|
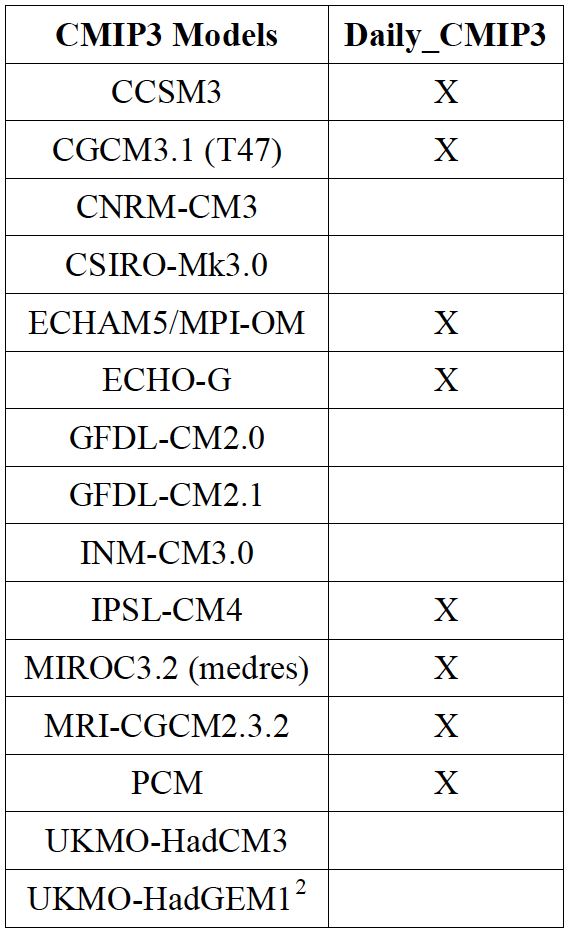
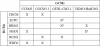
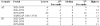
CMIP3 Models Listing |
NCA 3 |
 |
|
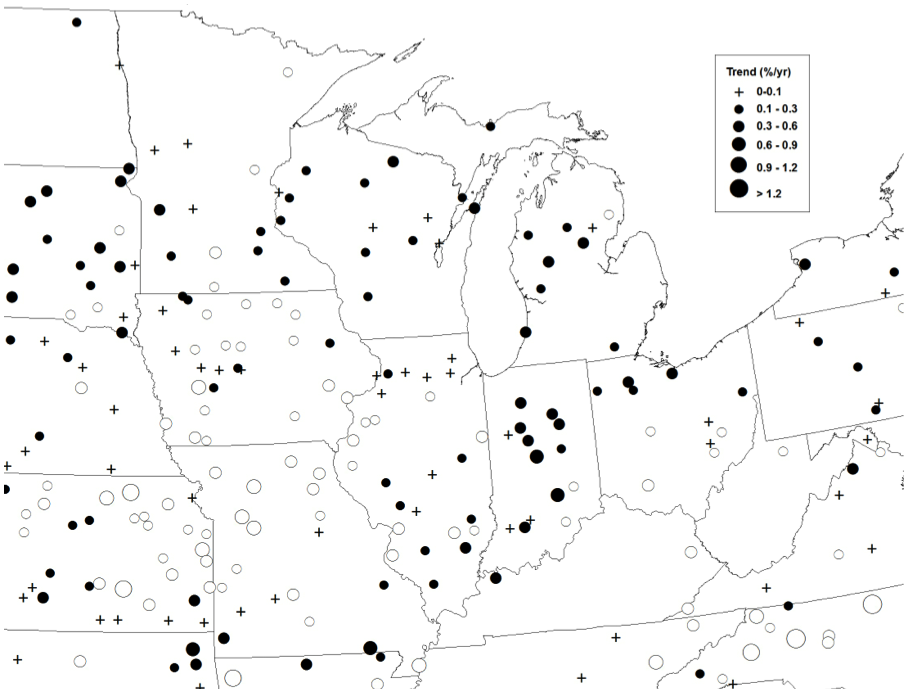
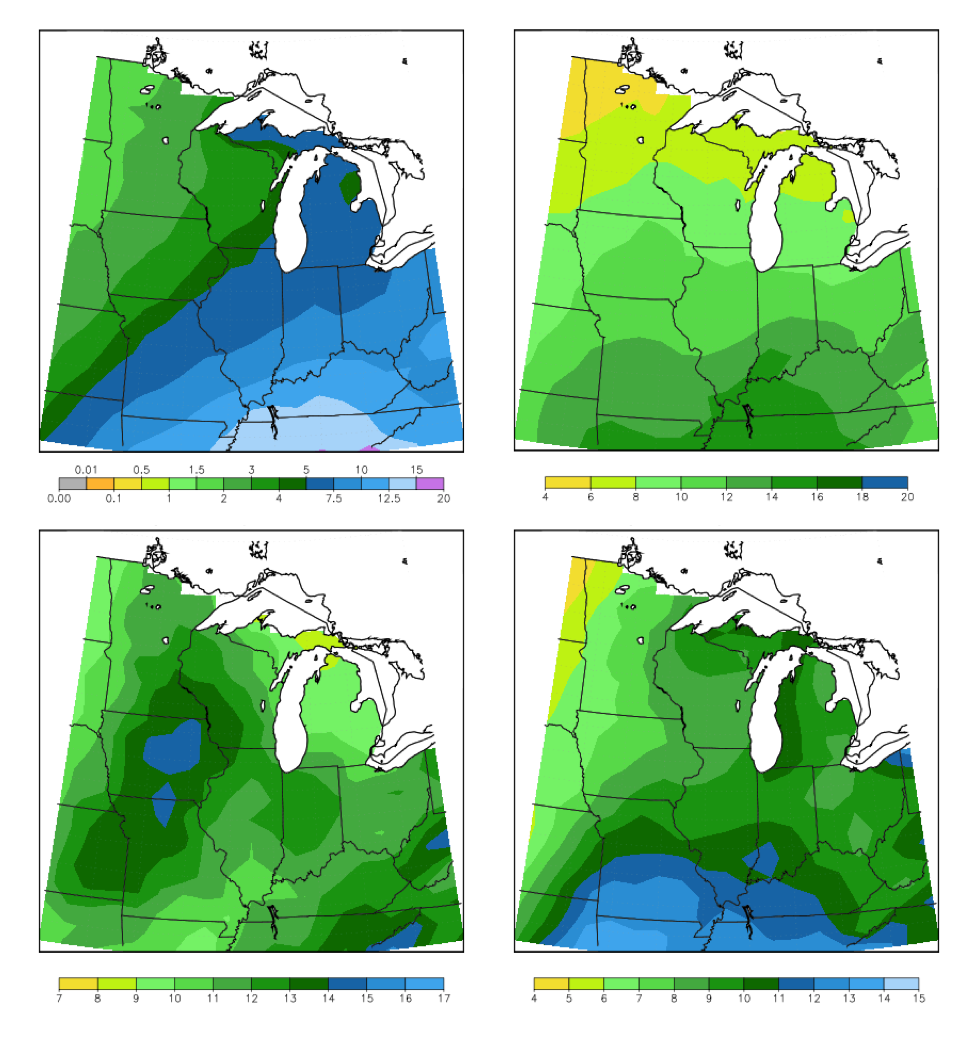
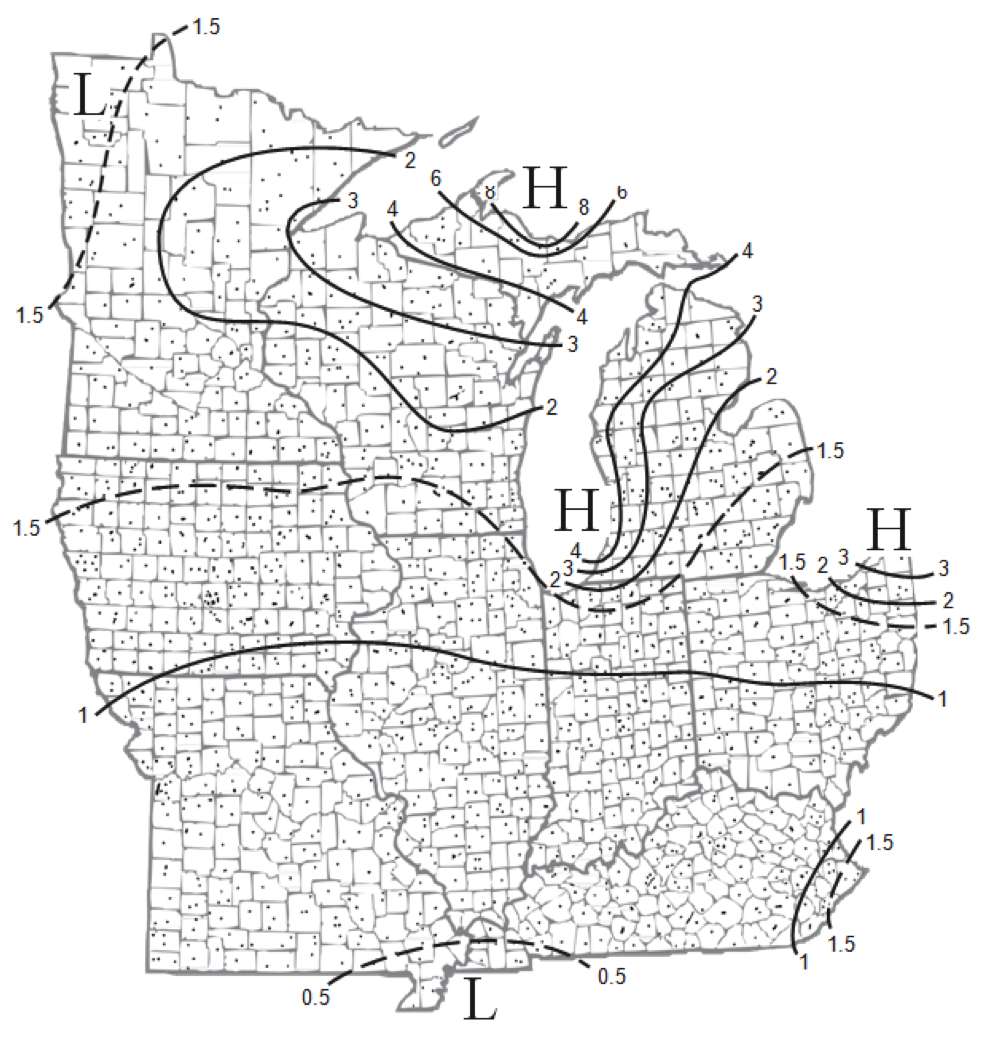
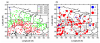
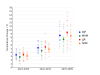
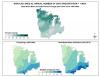
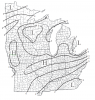
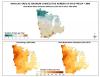
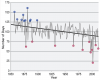
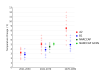
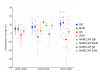
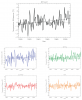
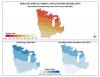
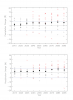
(a) Average annual precipitation during the top 10 wettest days in a year for for the Midwest region (b) Trend in the sum of the top 10 wettest days in a year for for the Midwest region |
NCA 3 |
 |
|
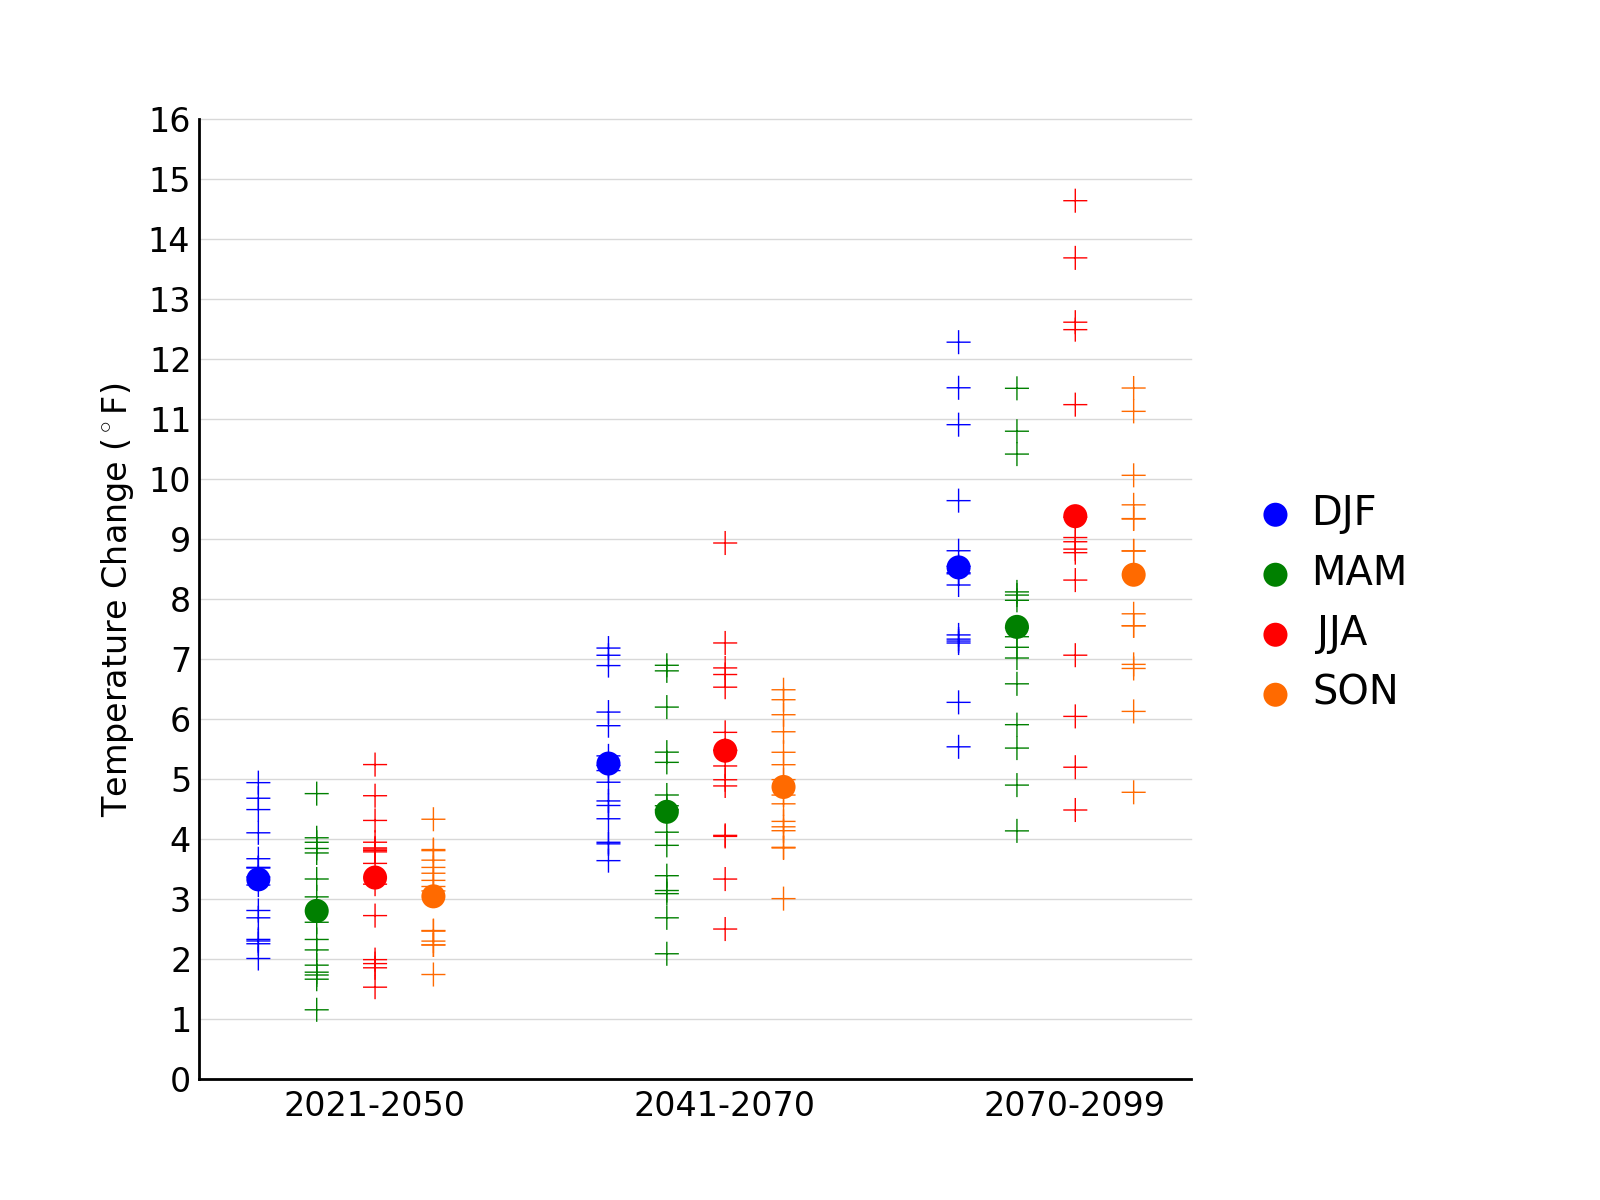
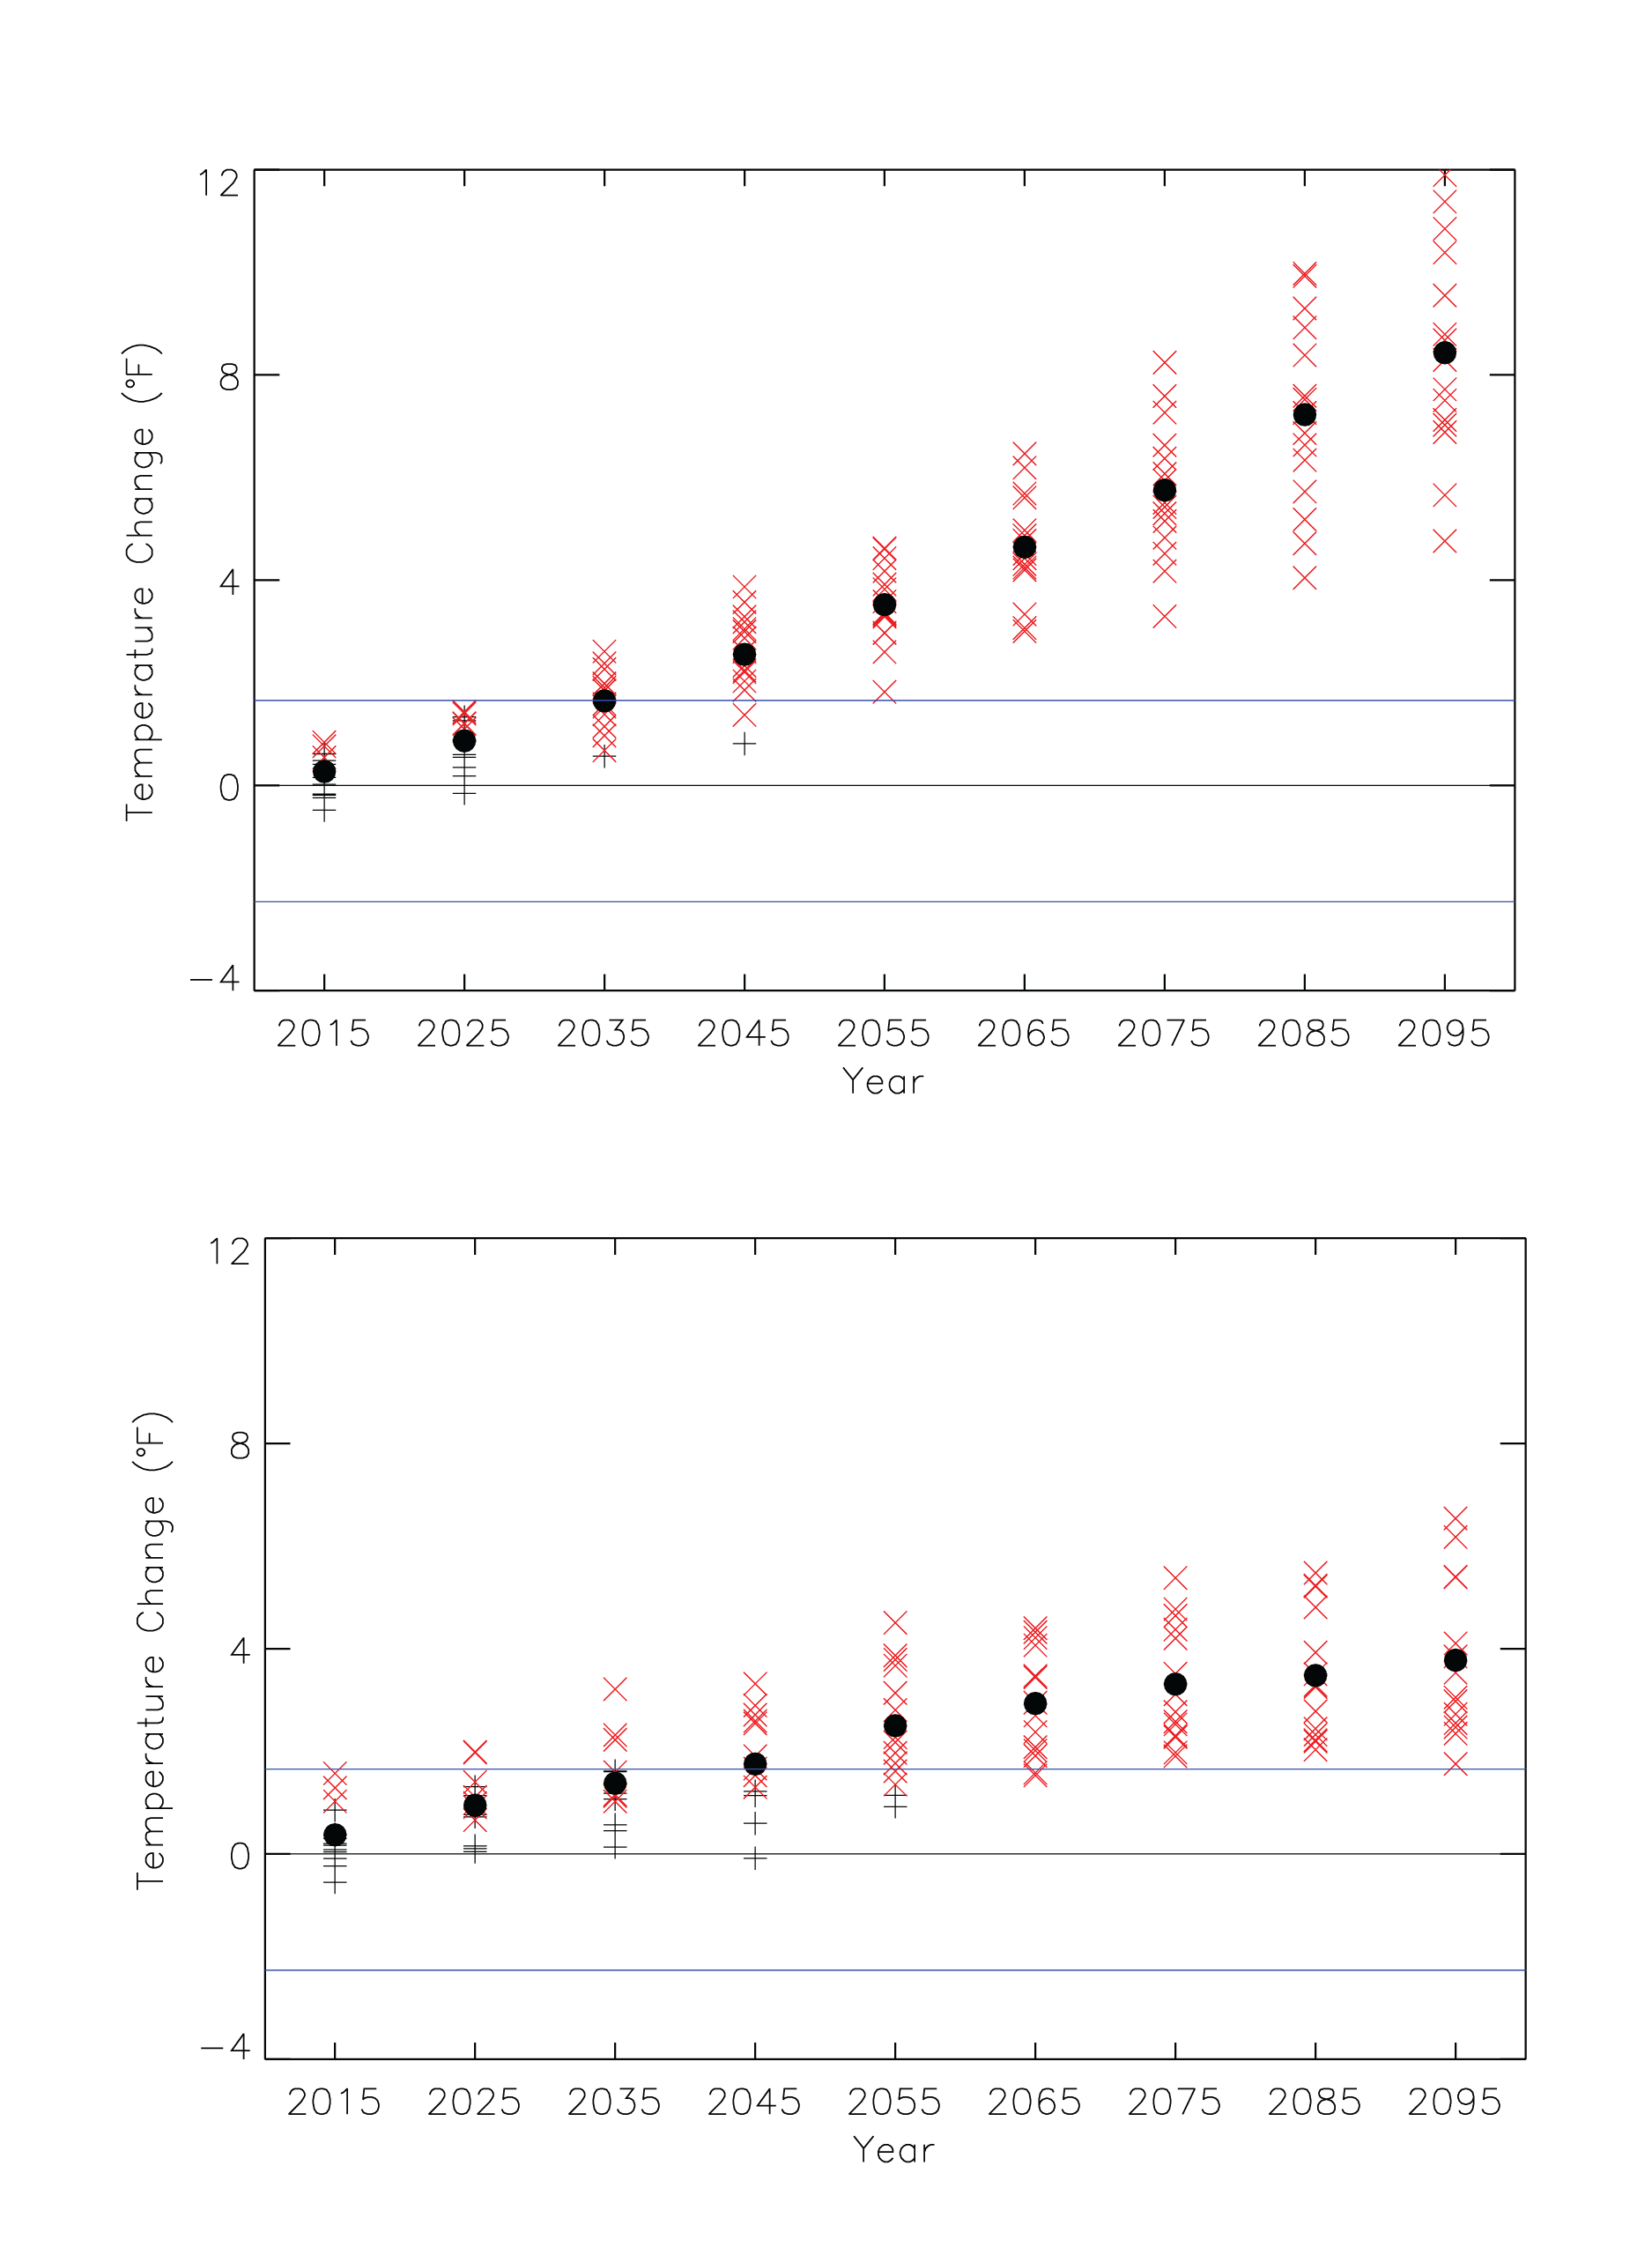
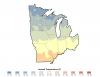
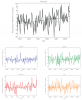
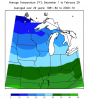
Simulated seasonal mean temperature change |
NCA 3 |
 |
|
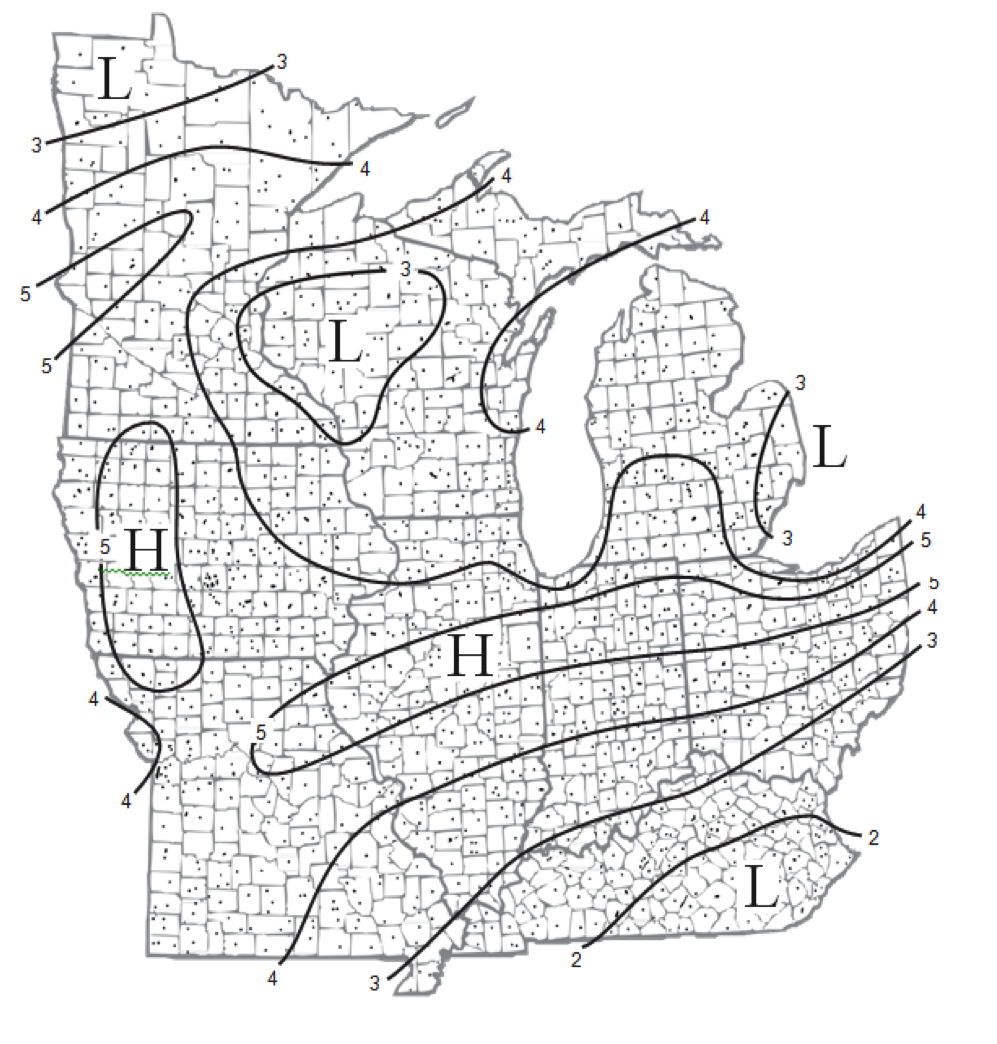
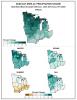
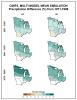
Simulated difference in the mean annual number of days with precipitation of greater than one inch |
NCA 3 |
 |
|
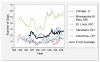
Hydrographs of lake levels for each of the Great Lakes |
NCA 3 |
 |
|
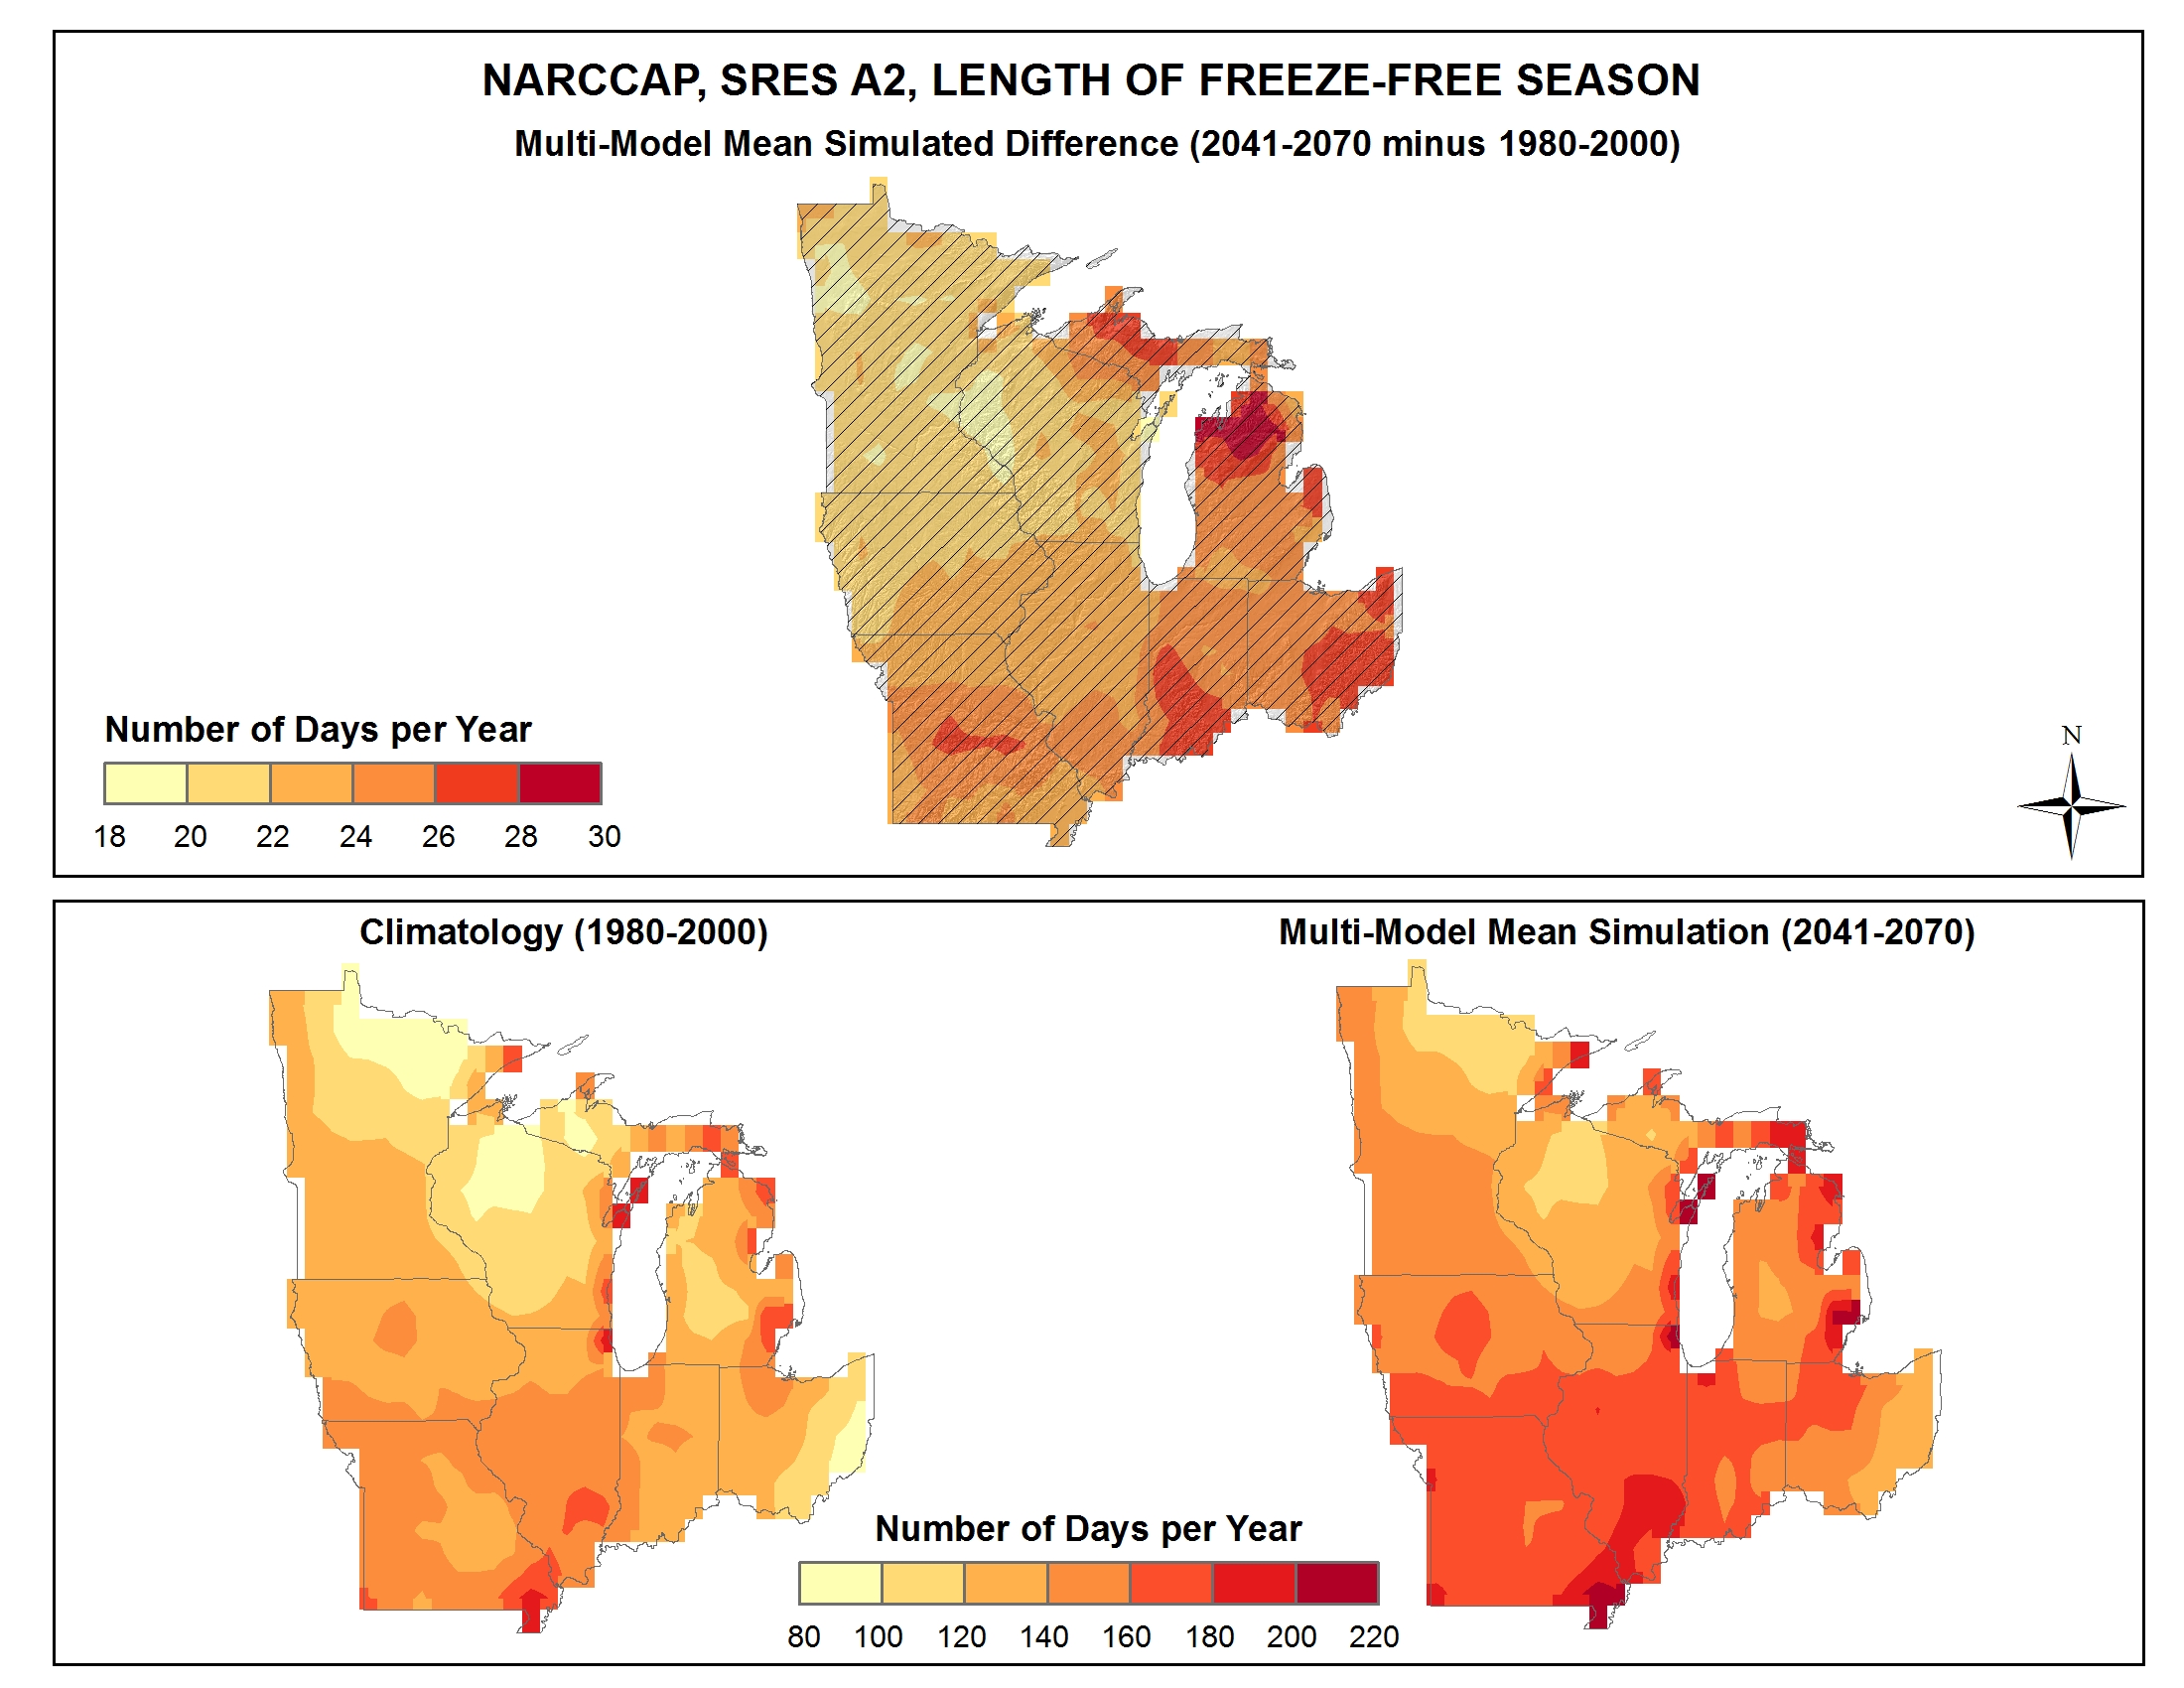
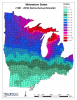
Simulated difference in the mean annual length of the freeze-free season |
NCA 3 |
 |
|
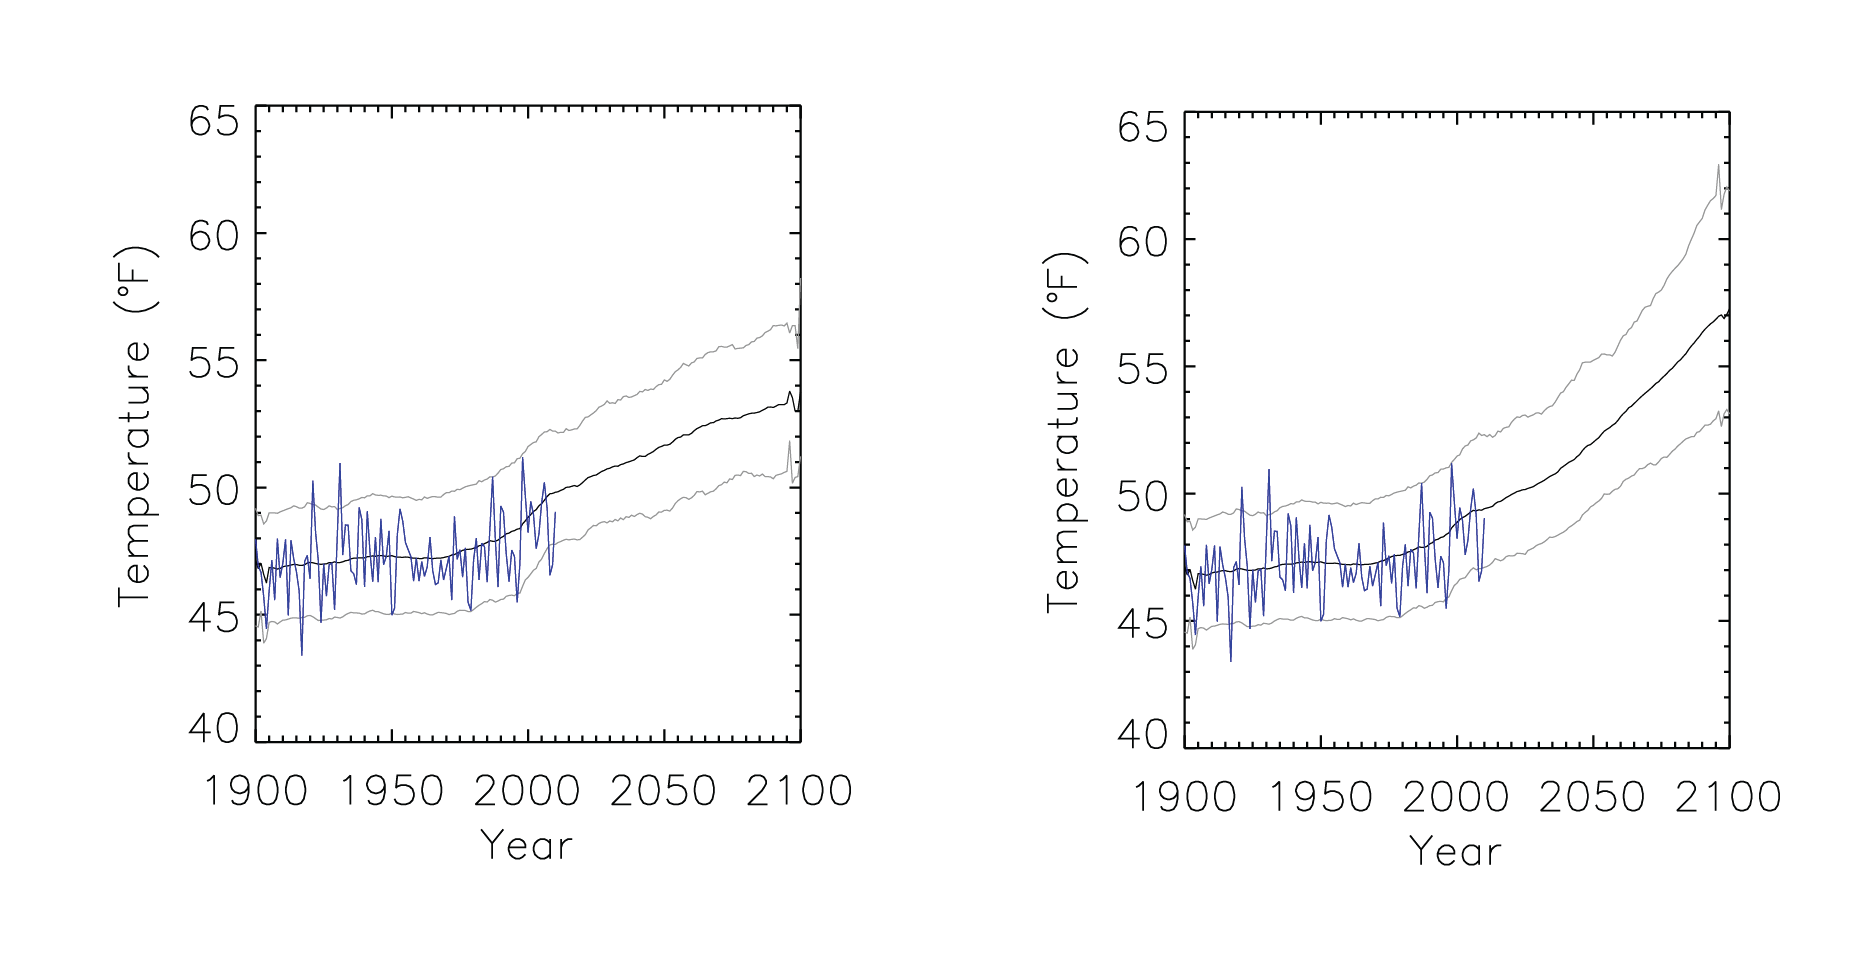
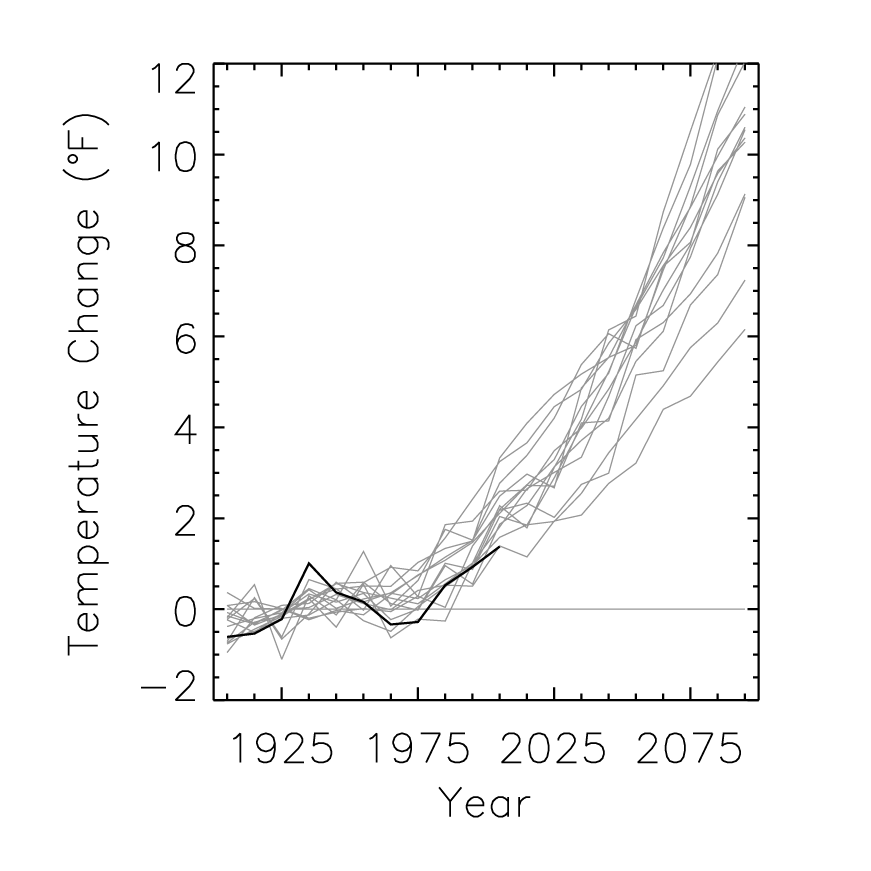
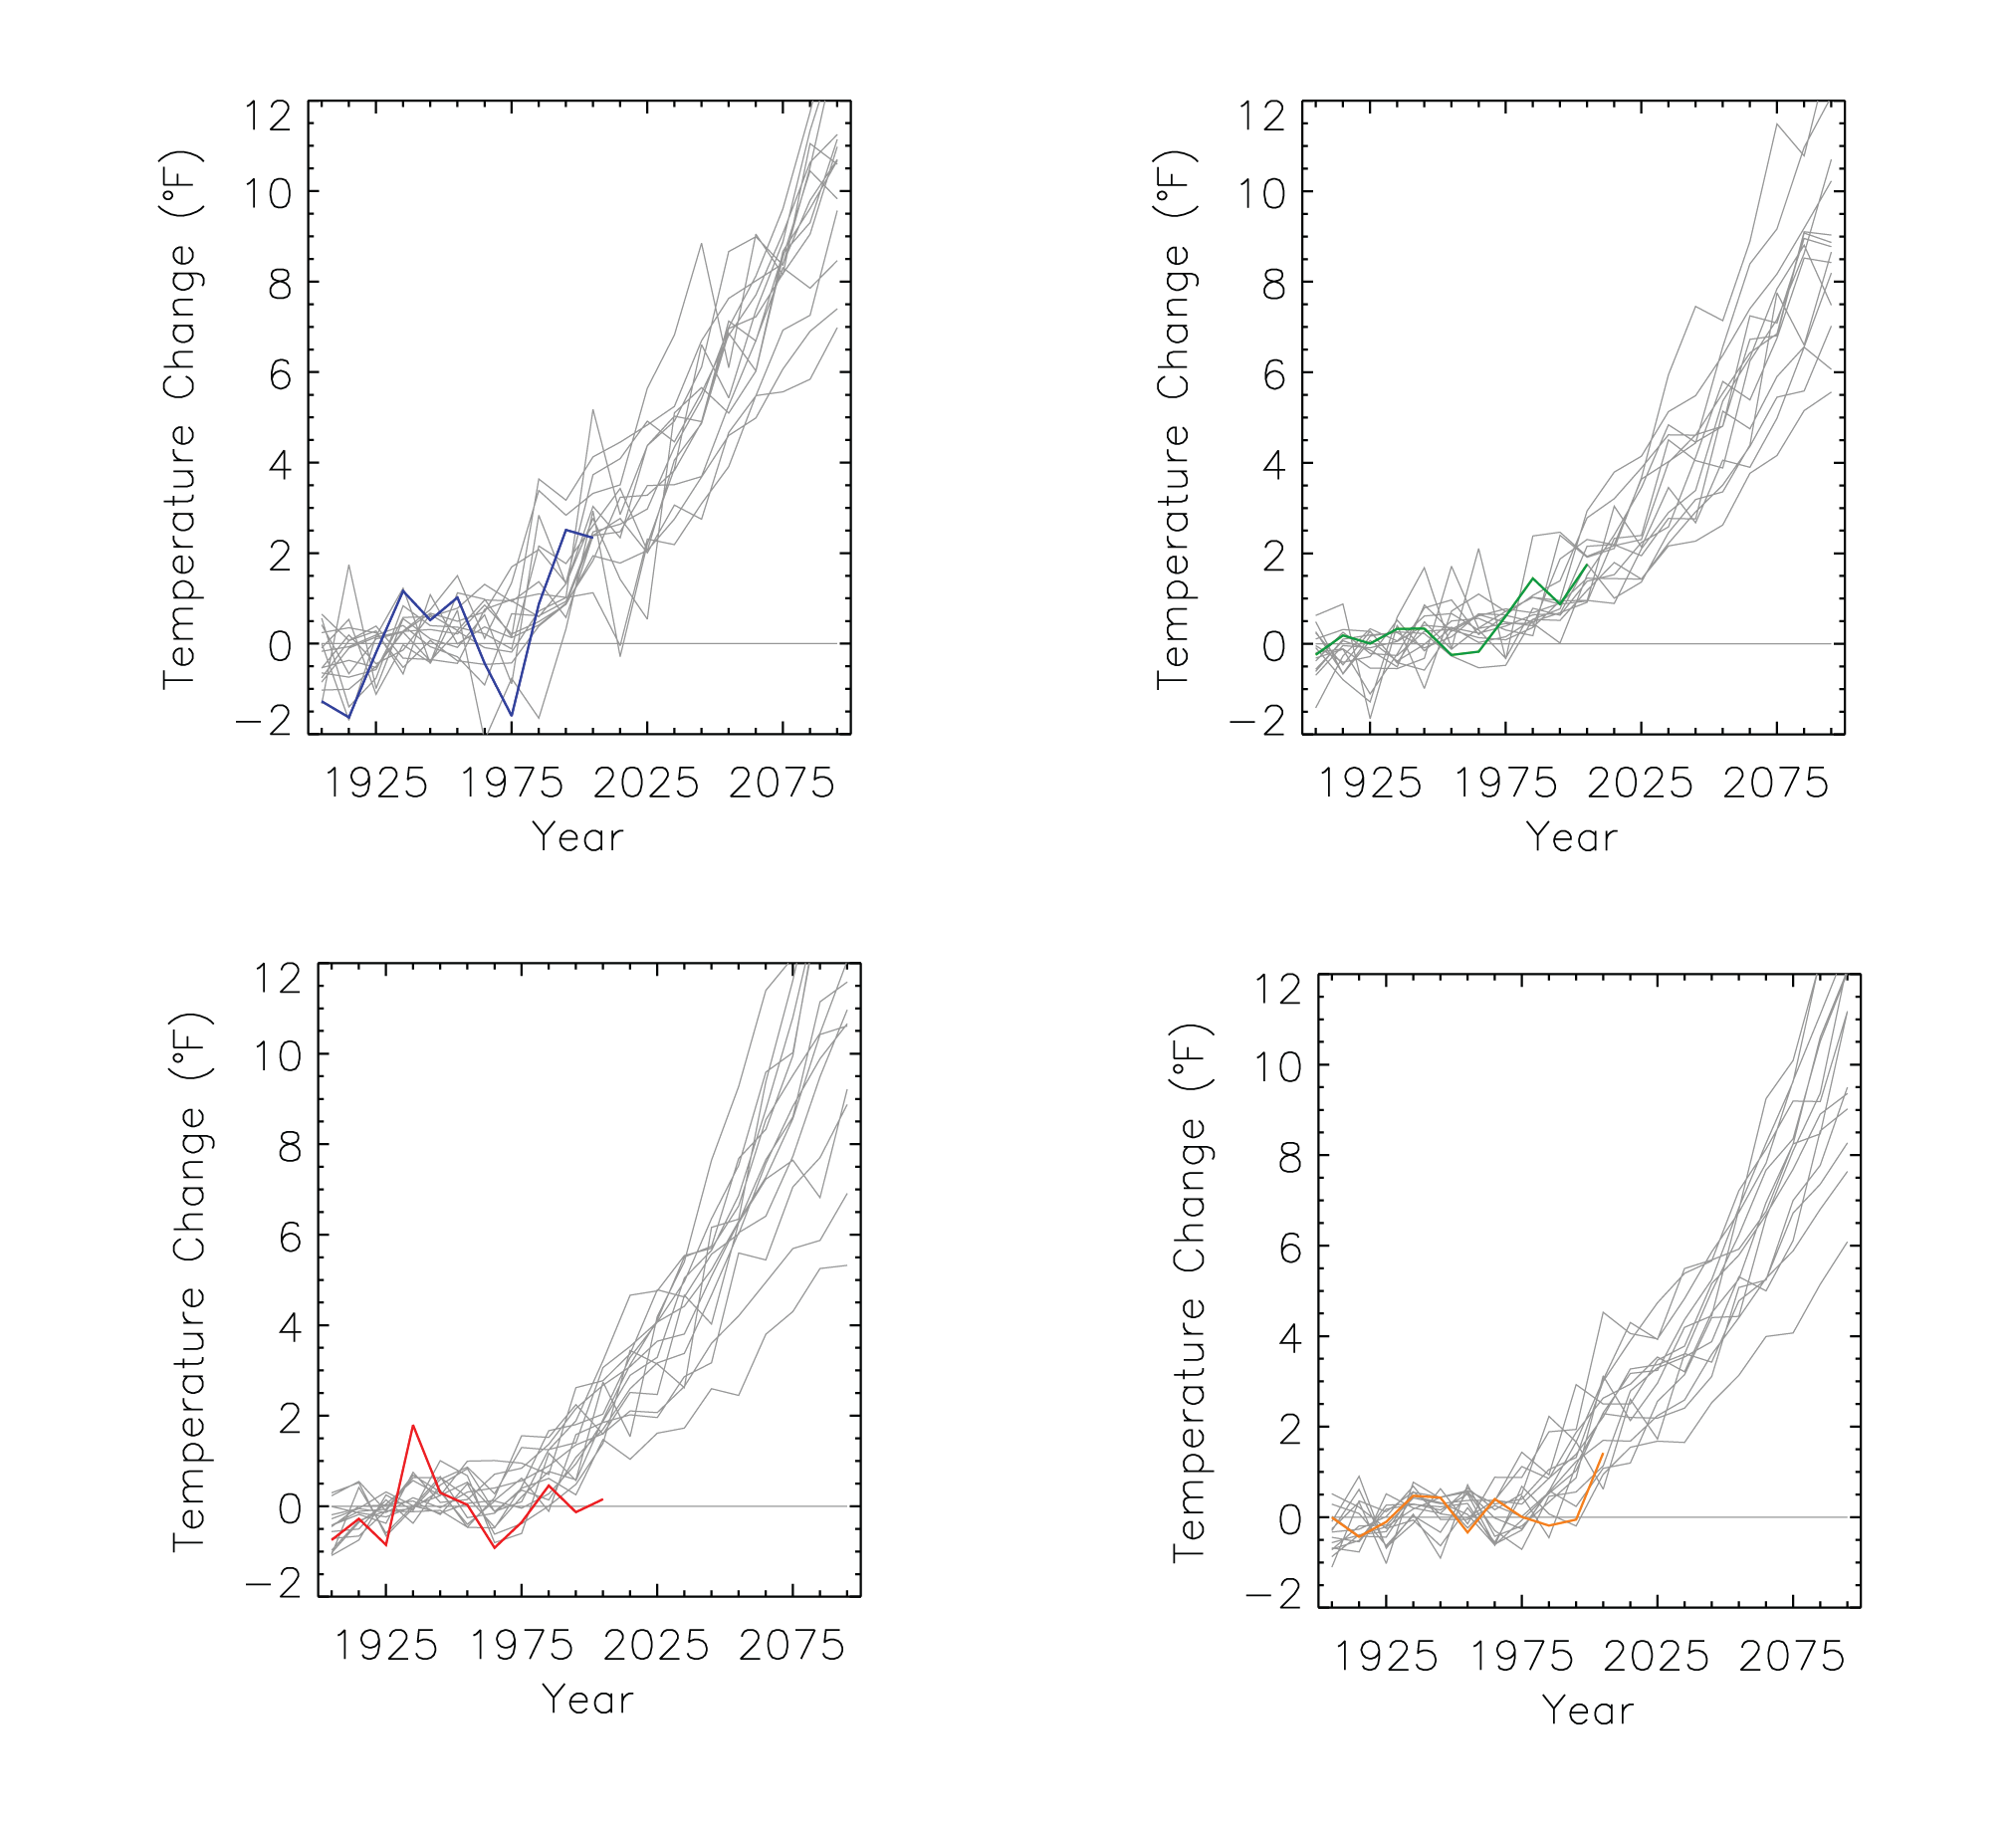
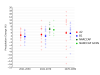
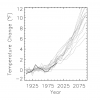
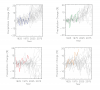
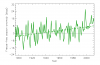
Time series of mean annual temperature |
NCA 3 |
 |
|
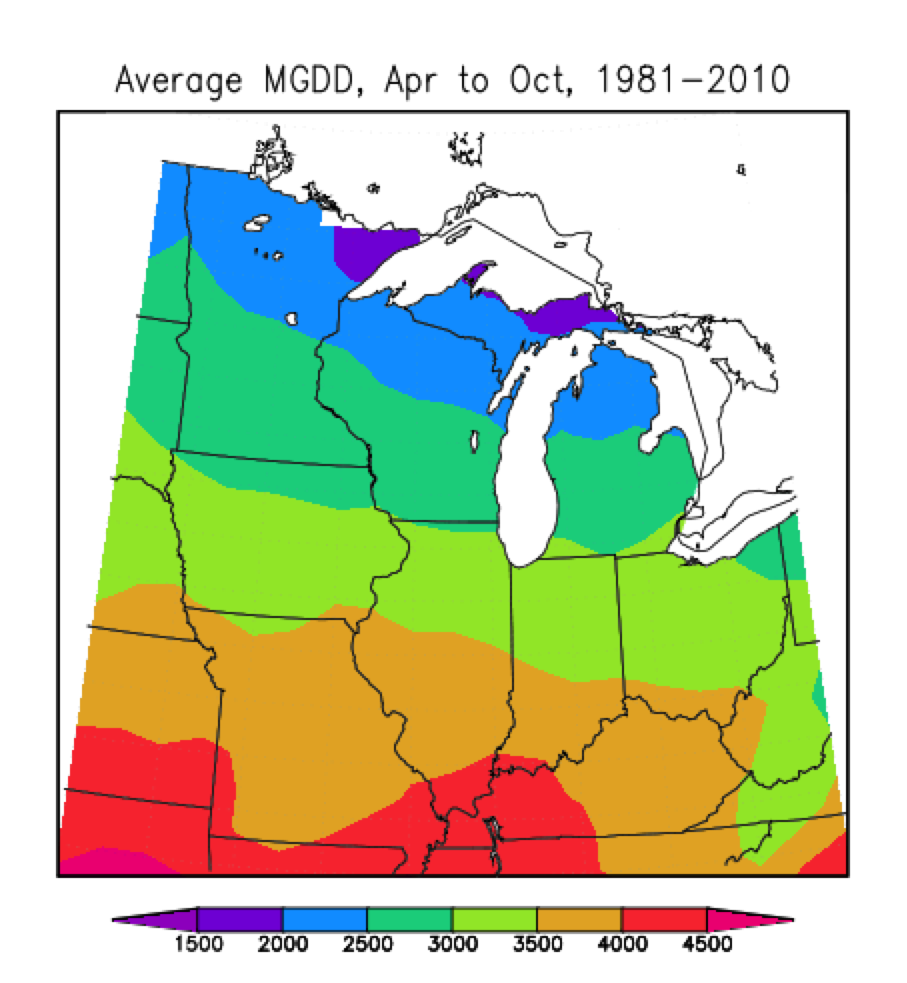
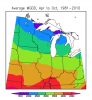
Average number of modified growing degree days for the Midwest region |
NCA 3 |
 |
|
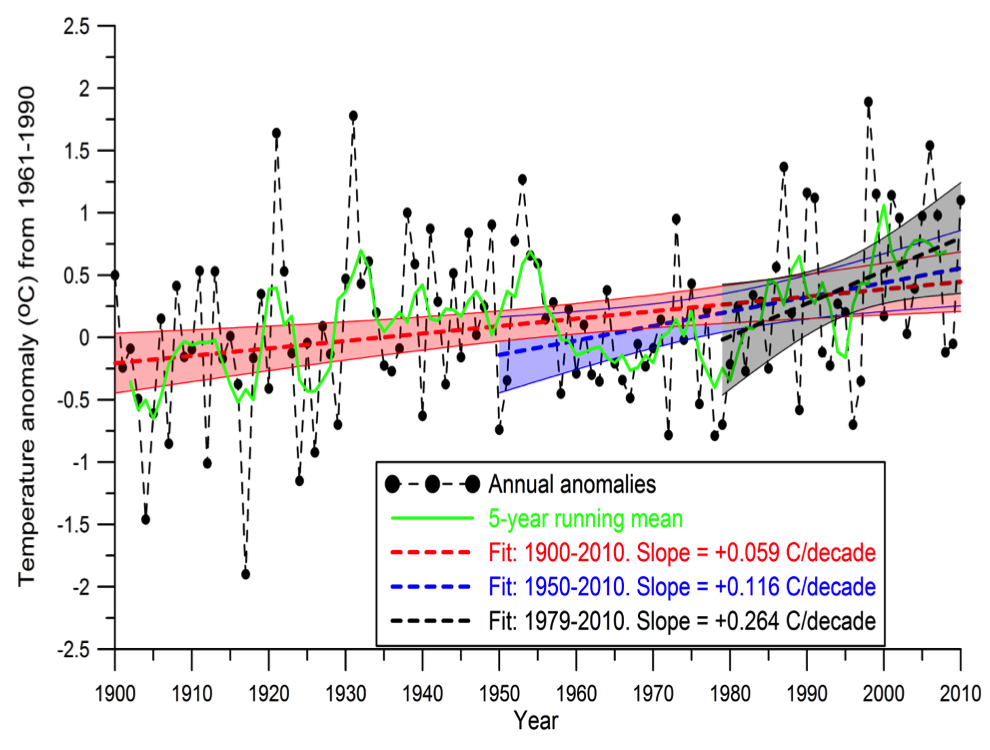
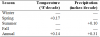
Trends in temperature and precipitation anomaly |
NCA 3 |
 |
|
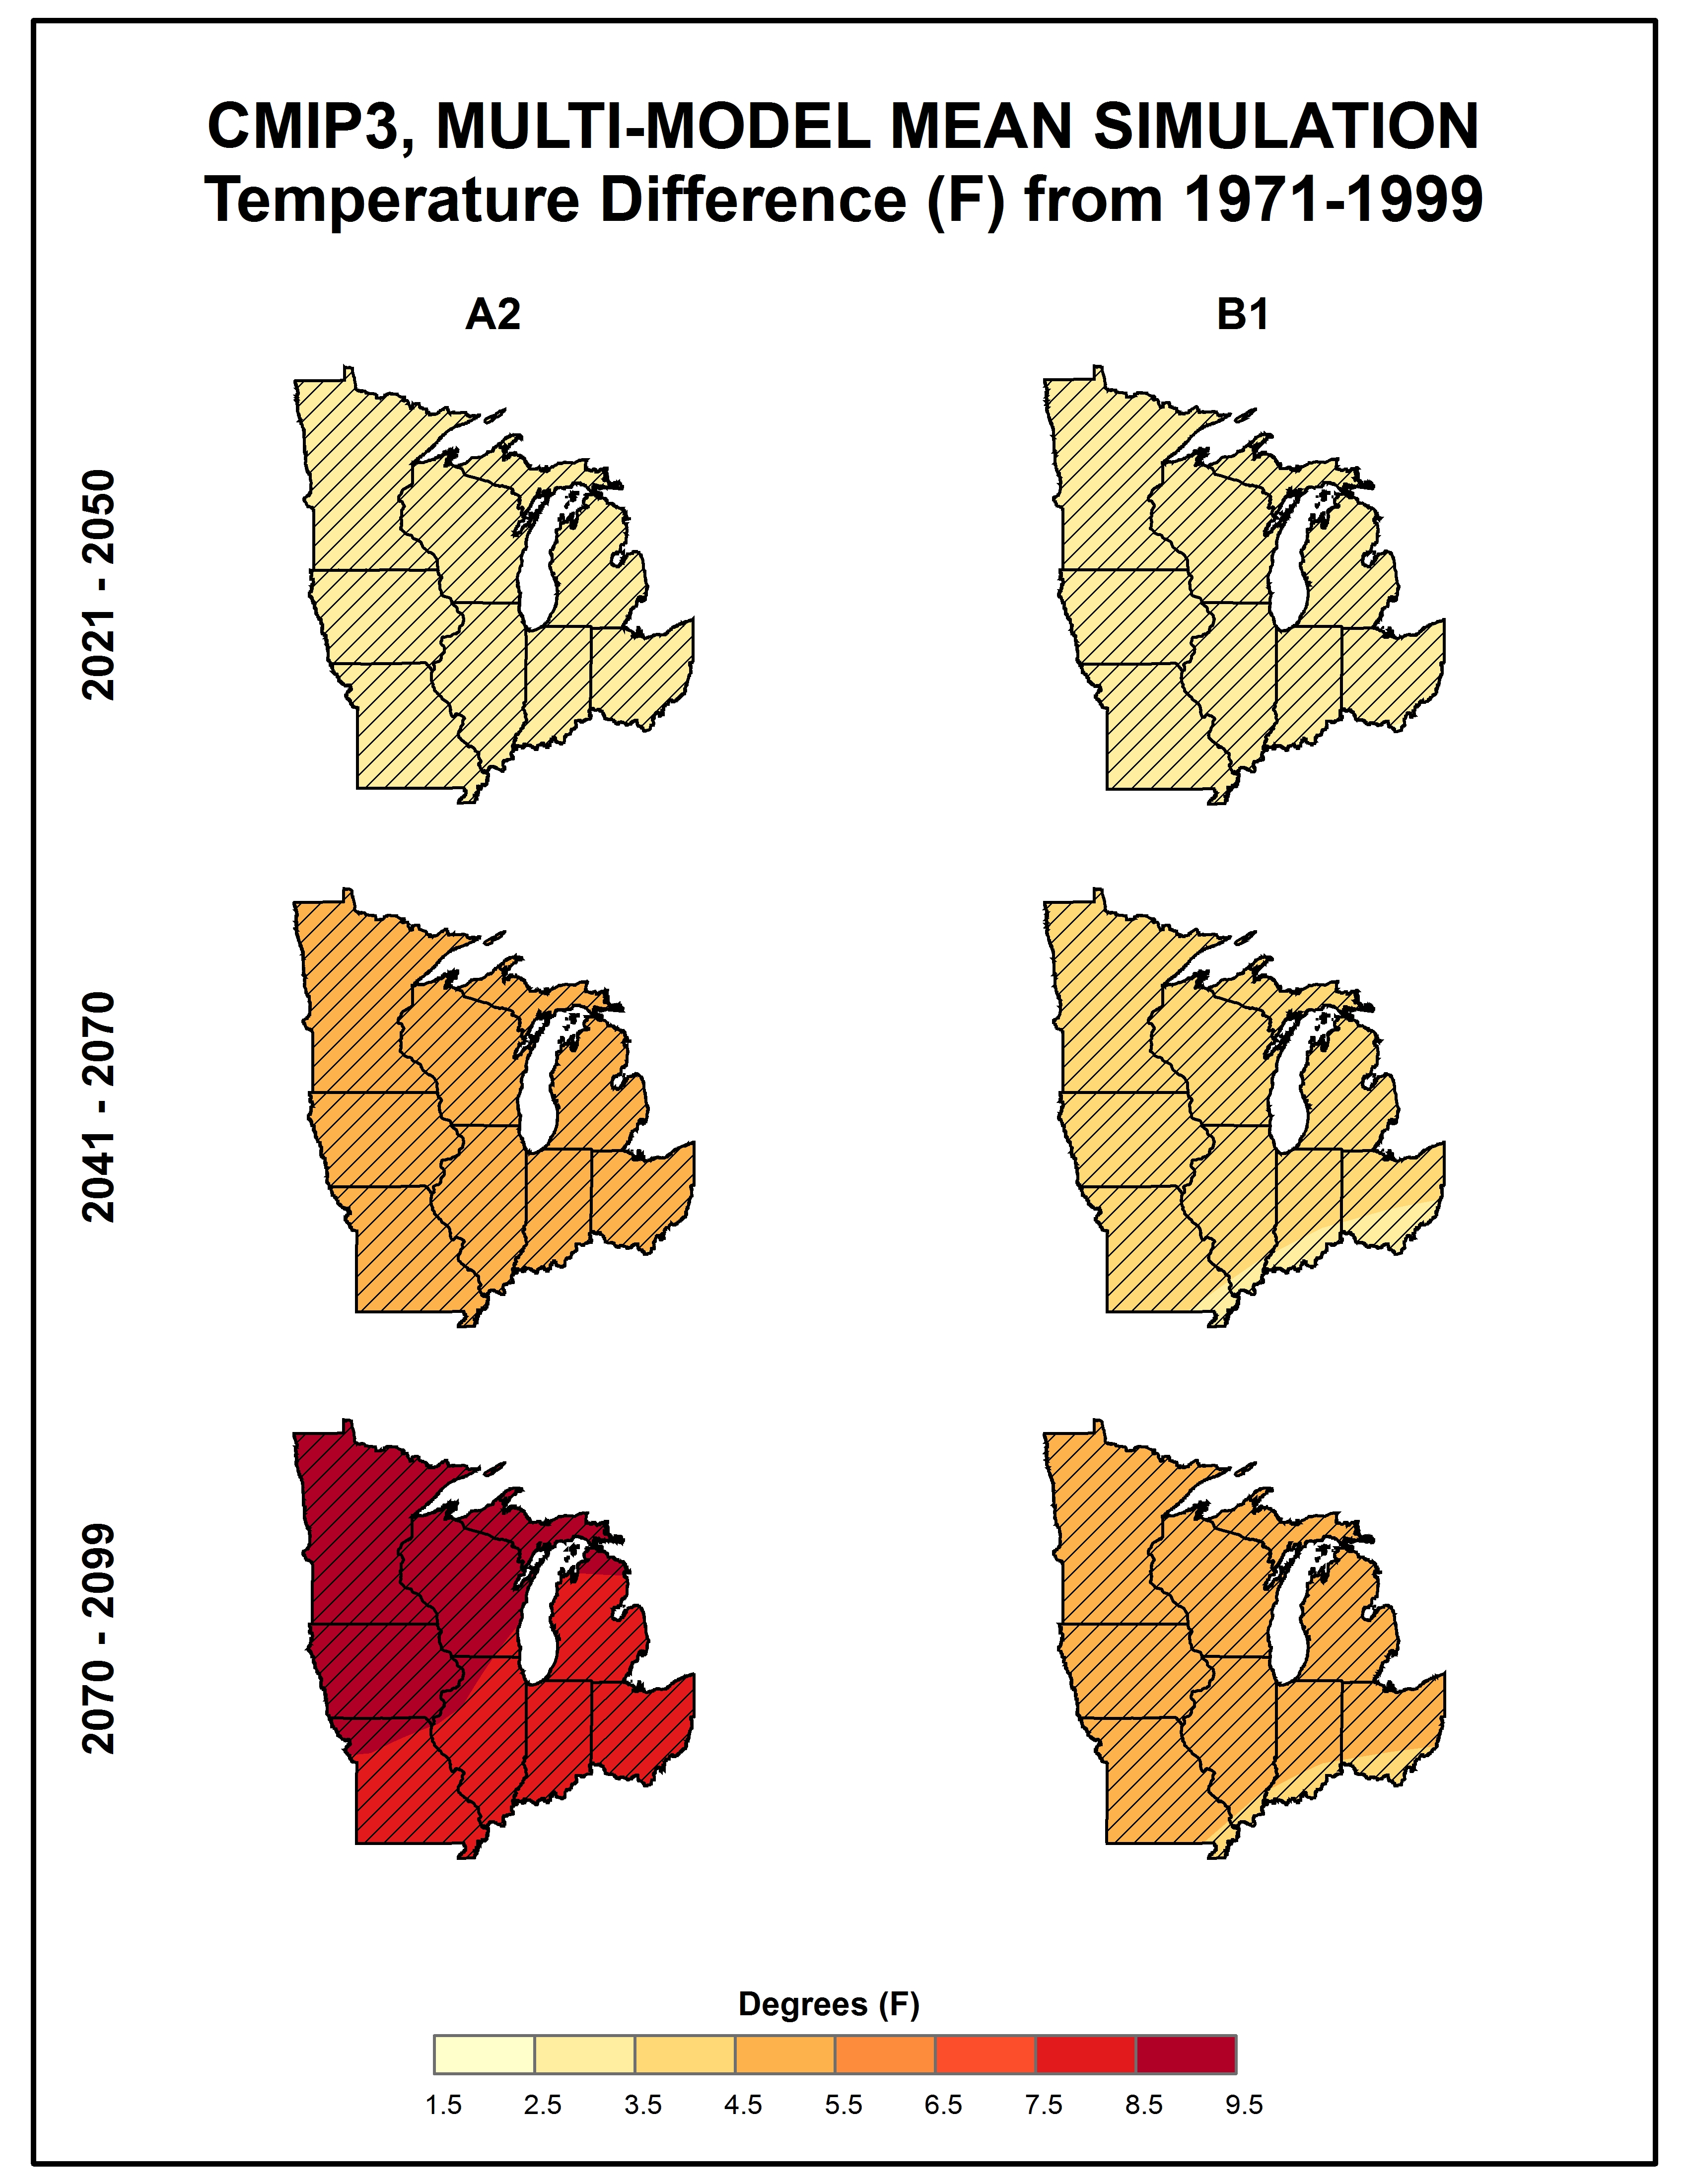
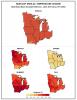
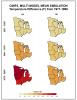
Simulated difference in annual and seasonal mean temperature |
NCA 3 |
 |
|
Simulated annual mean precipitation change |
NCA 3 |
 |
|
Snowfall trends for the Midwest region |
NCA 3 |
 |
|
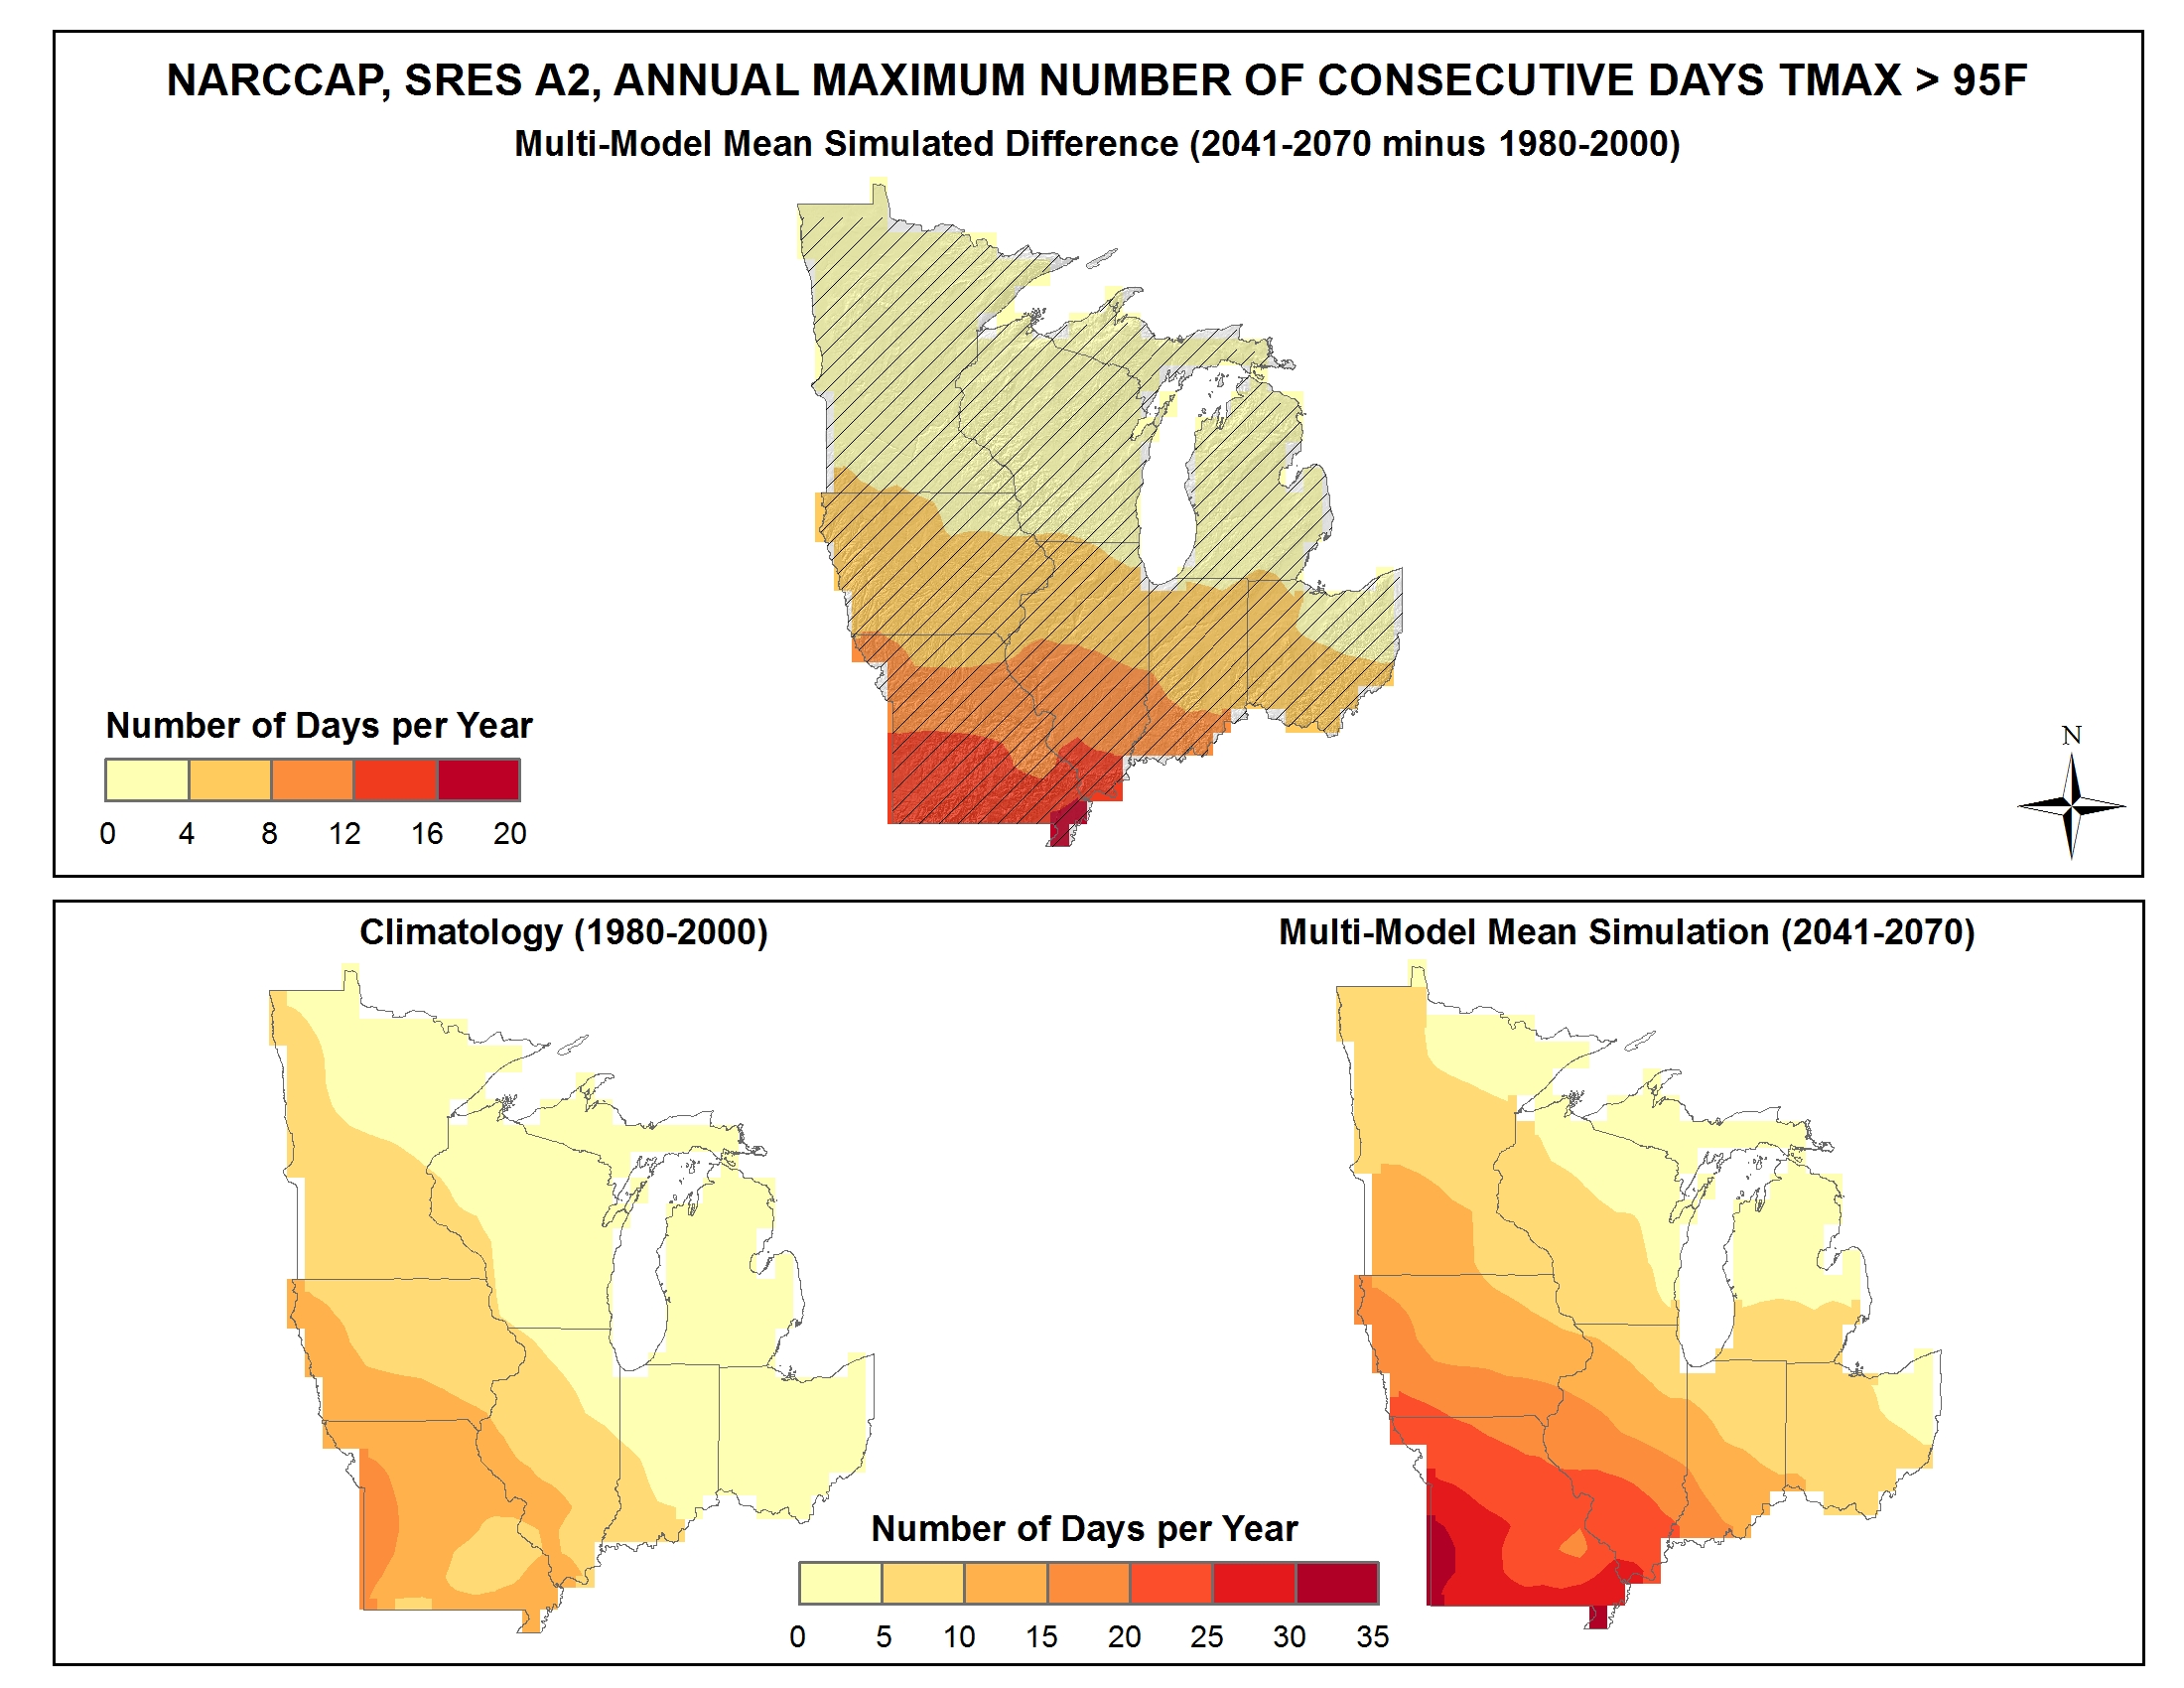
Simulated difference in the mean annual maximum number of consecutive days with a maximum temperature greater than 95F |
NCA 3 |
 |
|
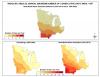
Observed decadal mean annual precipitation change |
NCA 3 |
 |
|
Average seasonal accumulated precipitation for the Midwest region |
NCA 3 |
 |
|
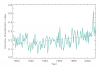
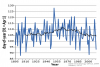
Annual temperature anomalies for the Midwest region |
NCA 3 |
 |
|
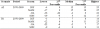
NARCCAP Models Listing |
NCA 3 |
 |
|
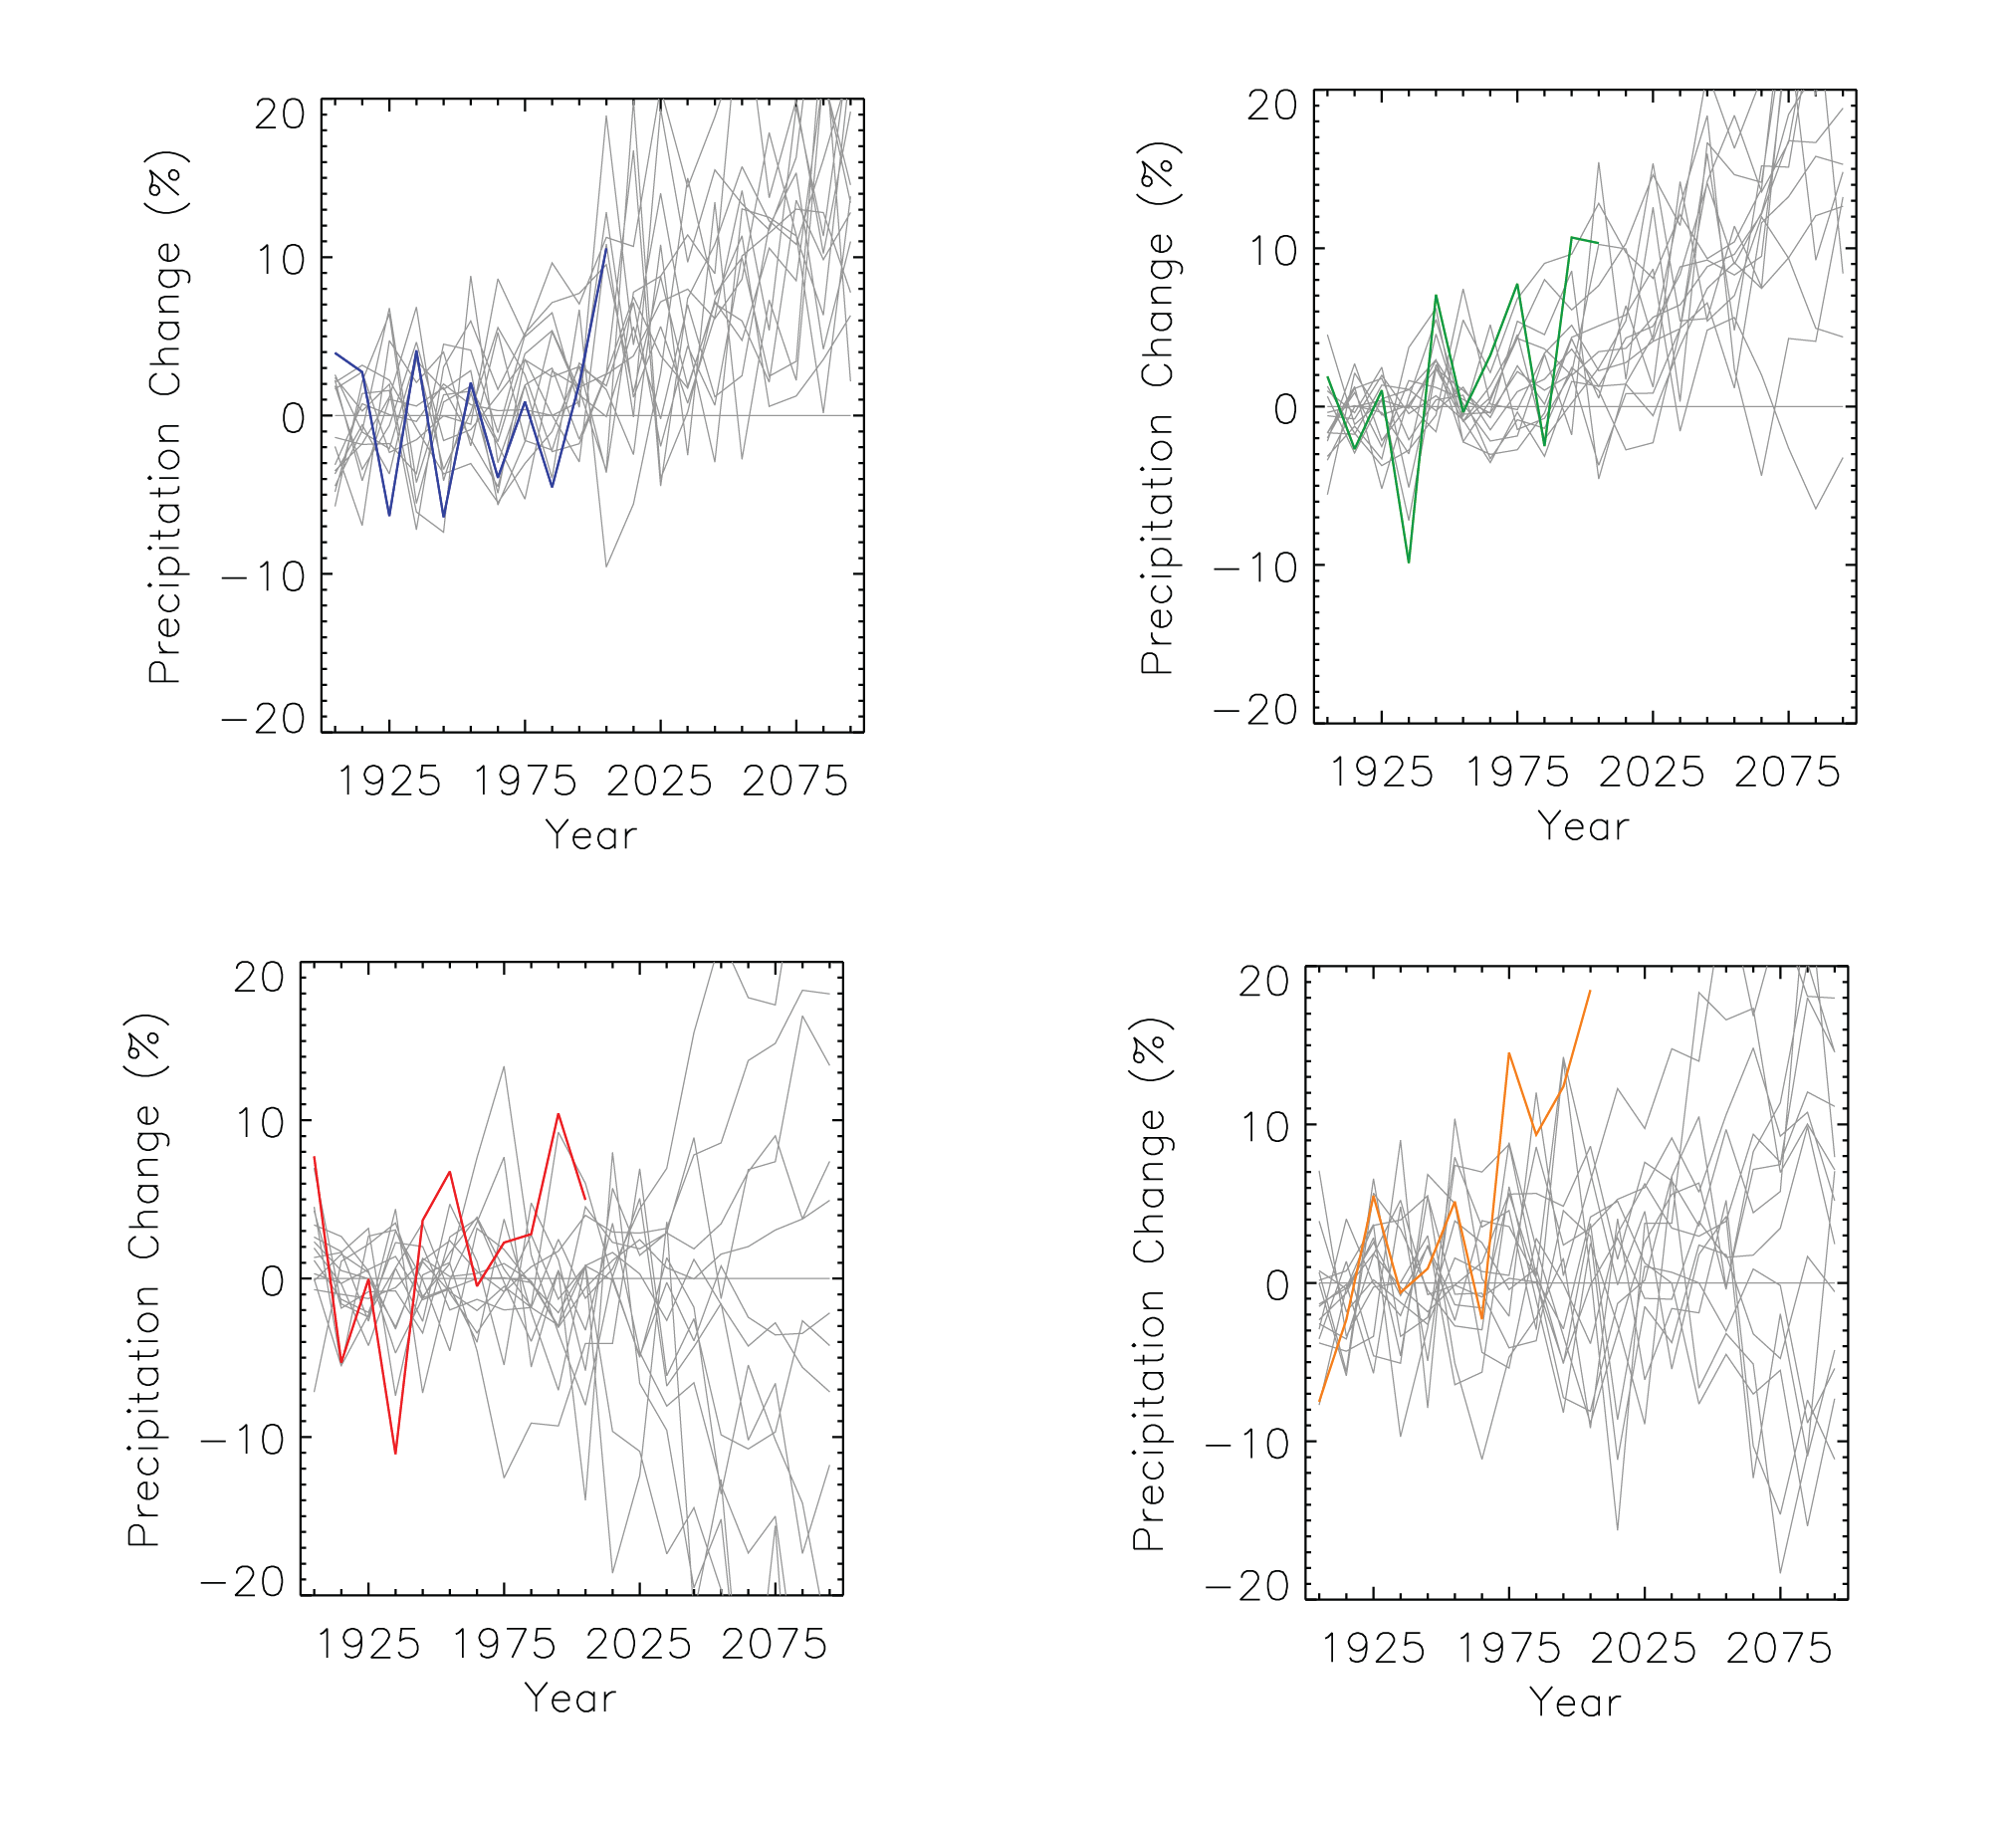
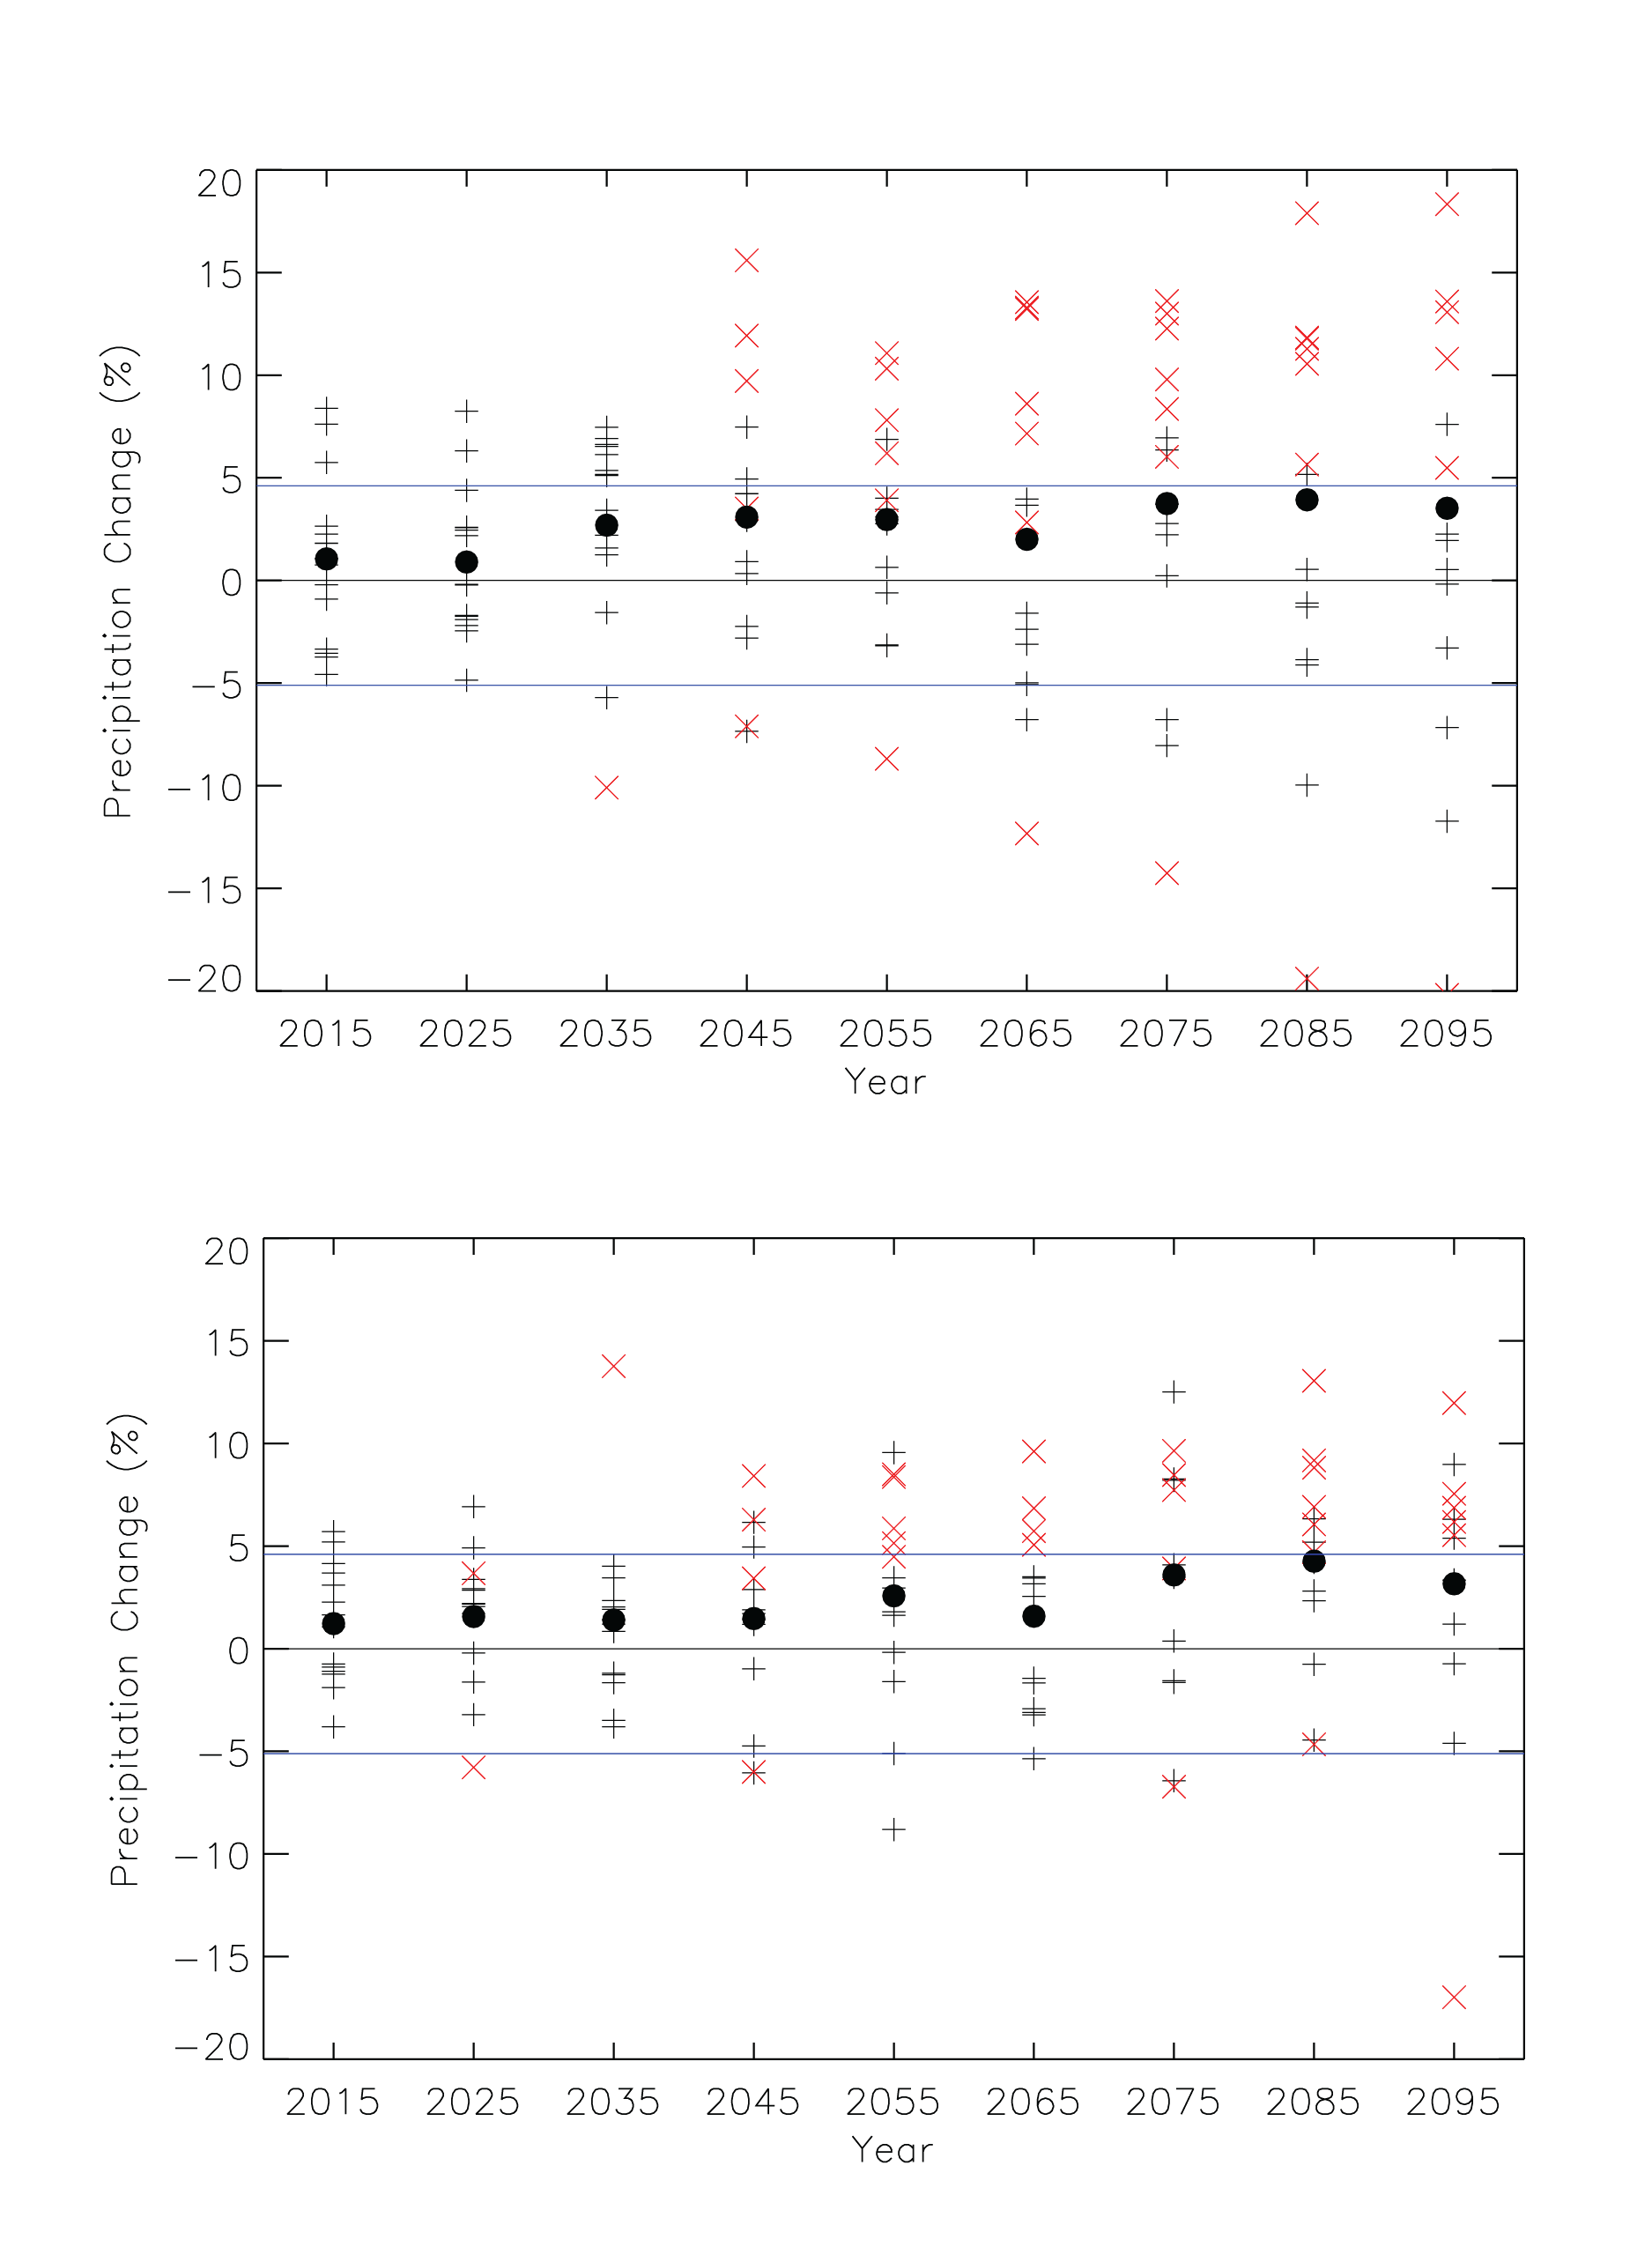
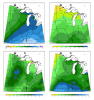
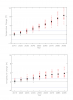
Distribution of the simulated change in seasonal mean precipitation |
NCA 3 |
 |
|
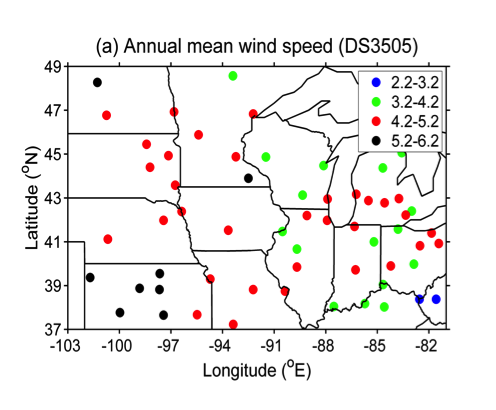
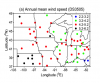
Annual mean wind speeds |
NCA 3 |
 |
|
Simulated difference in the mean annual number of days with a minimum temperature less than 10F |
NCA 3 |
 |
|
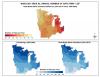
Observed decadal mean annual temperature change |
NCA 3 |
 |
|
Average annual temperature |
NCA 3 |
 |
|
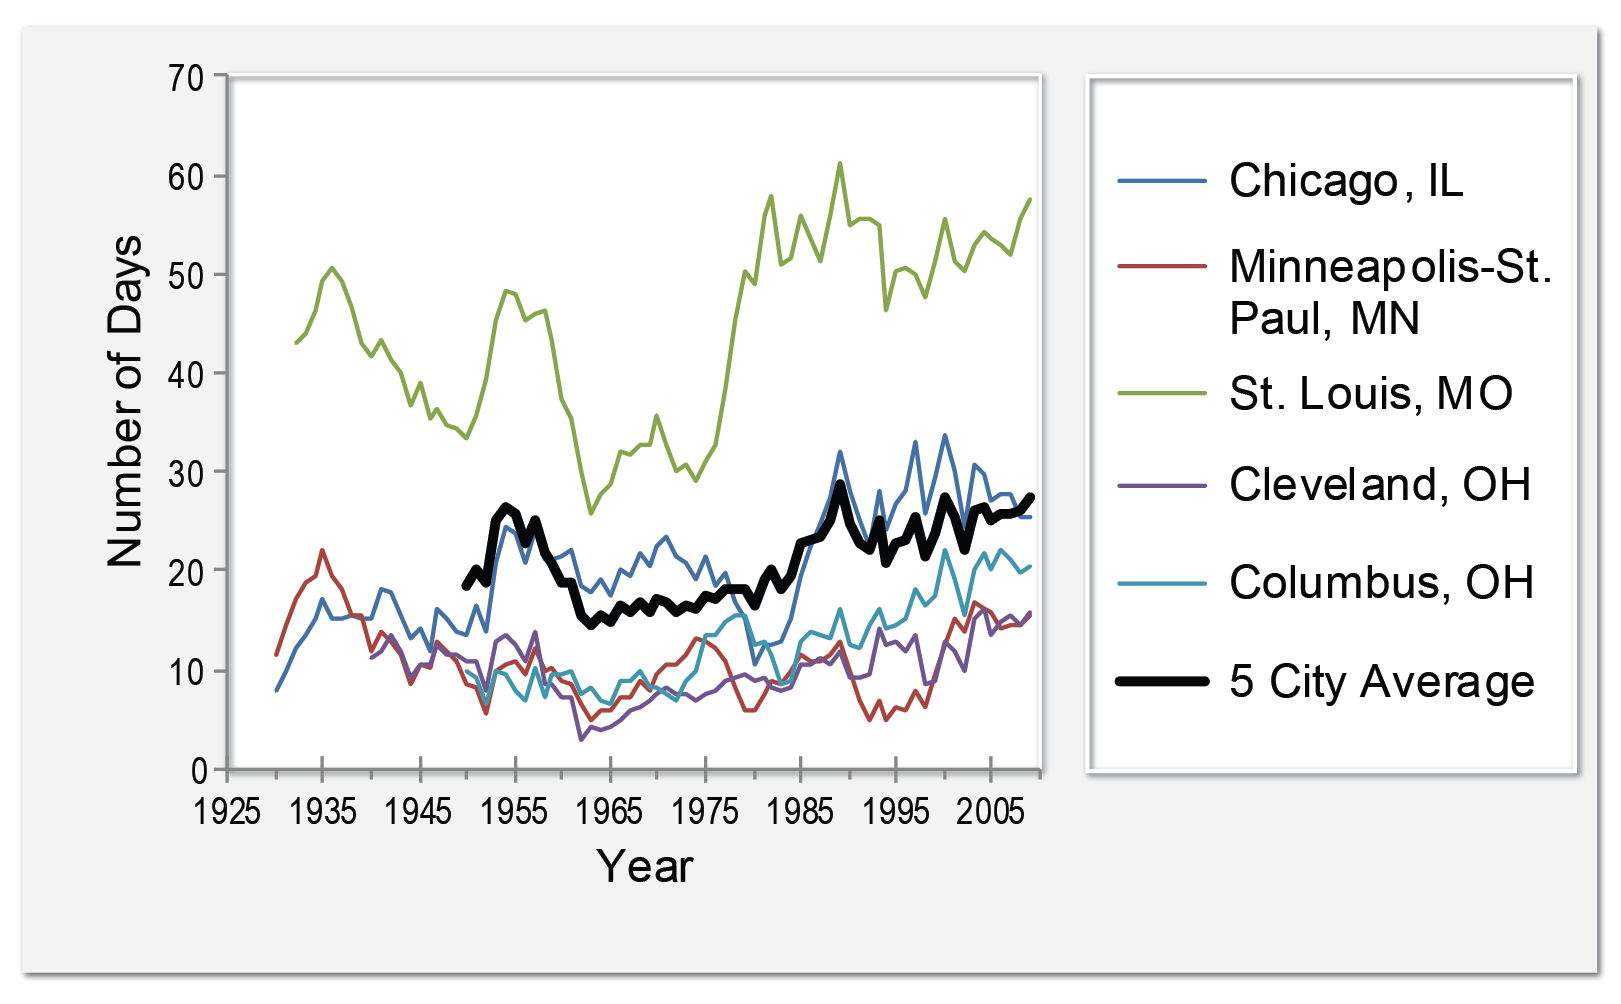
Number of days with minimum temperatures equal to or exceeding 70F at 5 large Midwestern cities |
NCA 3 |
 |
|
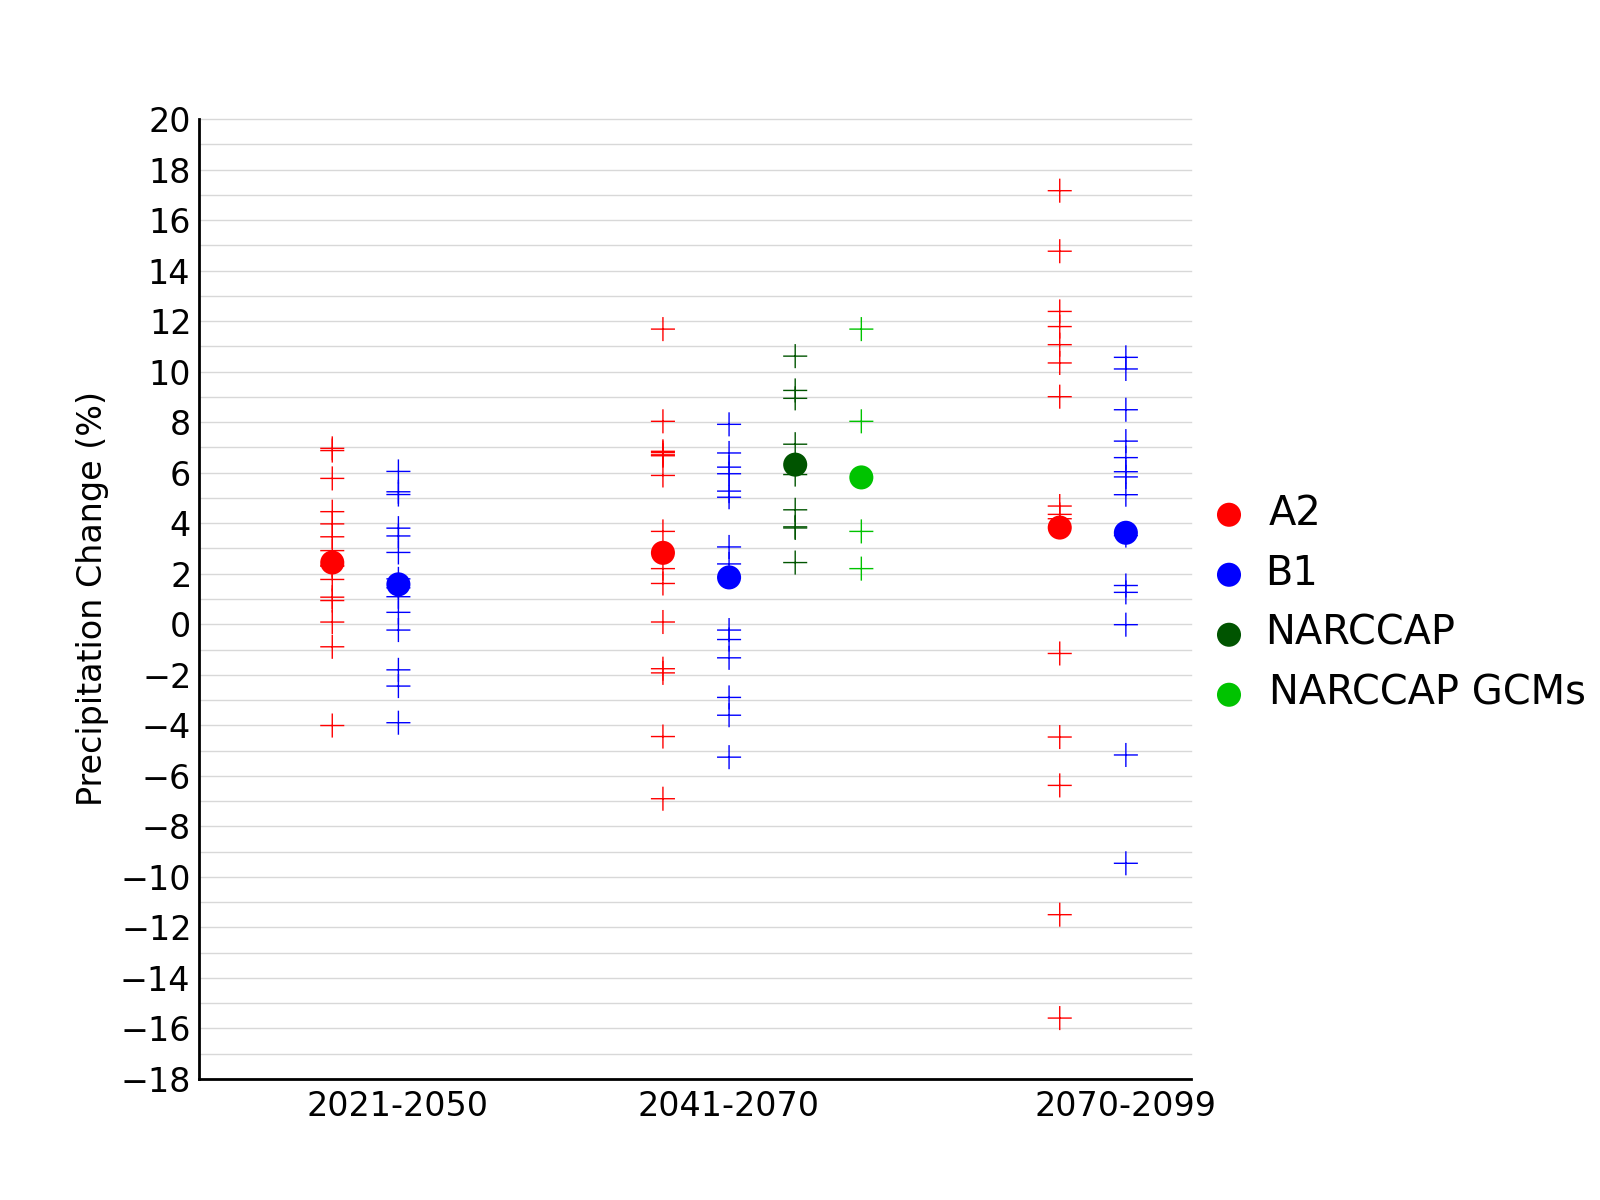
Distribution of the simulated change in annual mean precipitation |
NCA 3 |
 |
|
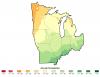
Average annual precipitation |
NCA 3 |
 |
|
Average annual number of days with freezing rain for the Midwest region |
NCA 3 |
 |
|
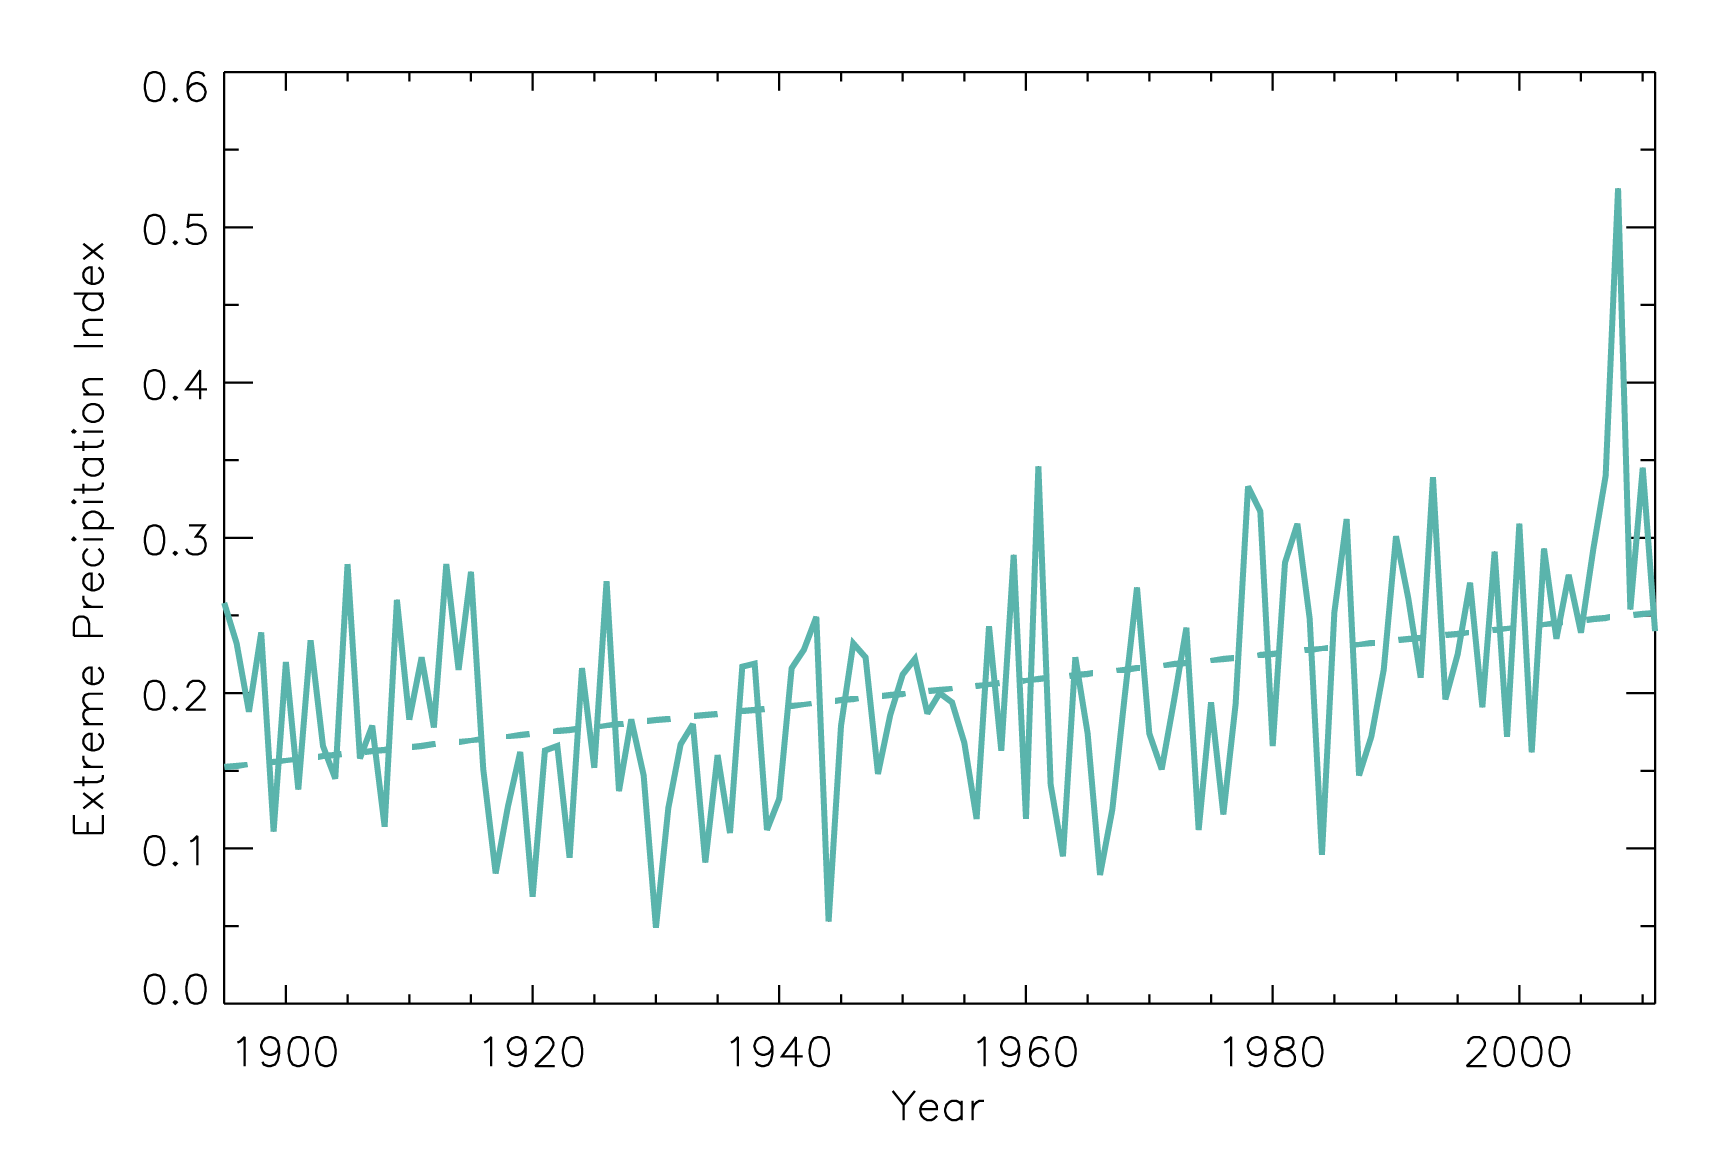
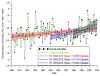
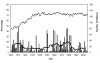
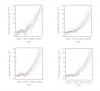
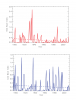
Time series of extreme precipitation index for the occurrence of 1-day, 1 in 5-year extreme precipitation |
NCA 3 |
 |
|
Distribution of the simulated change in annual mean temperature |
NCA 3 |
 |
|
Simulated difference in the mean annual maximum number of consecutive days with precipitation of less than 0.1 inches |
NCA 3 |
 |
|
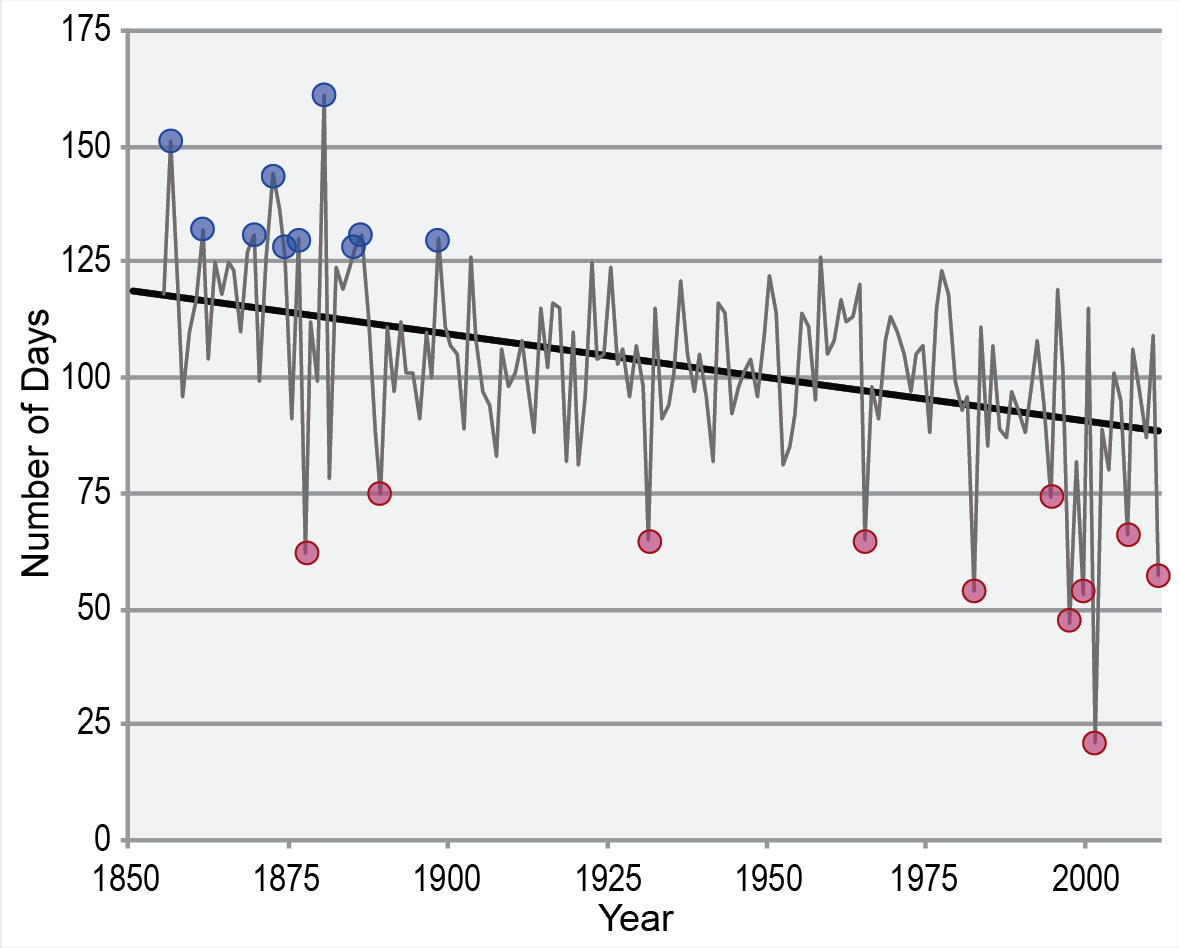
Long-term change in ice-cover duration for Lake Mendota, WI |
NCA 3 |
 |
|
Simulated difference in the mean annual number of cooling degree days |
NCA 3 |
 |
|
Simulated decadal mean change in annual temperature |
NCA 3 |
 |
|
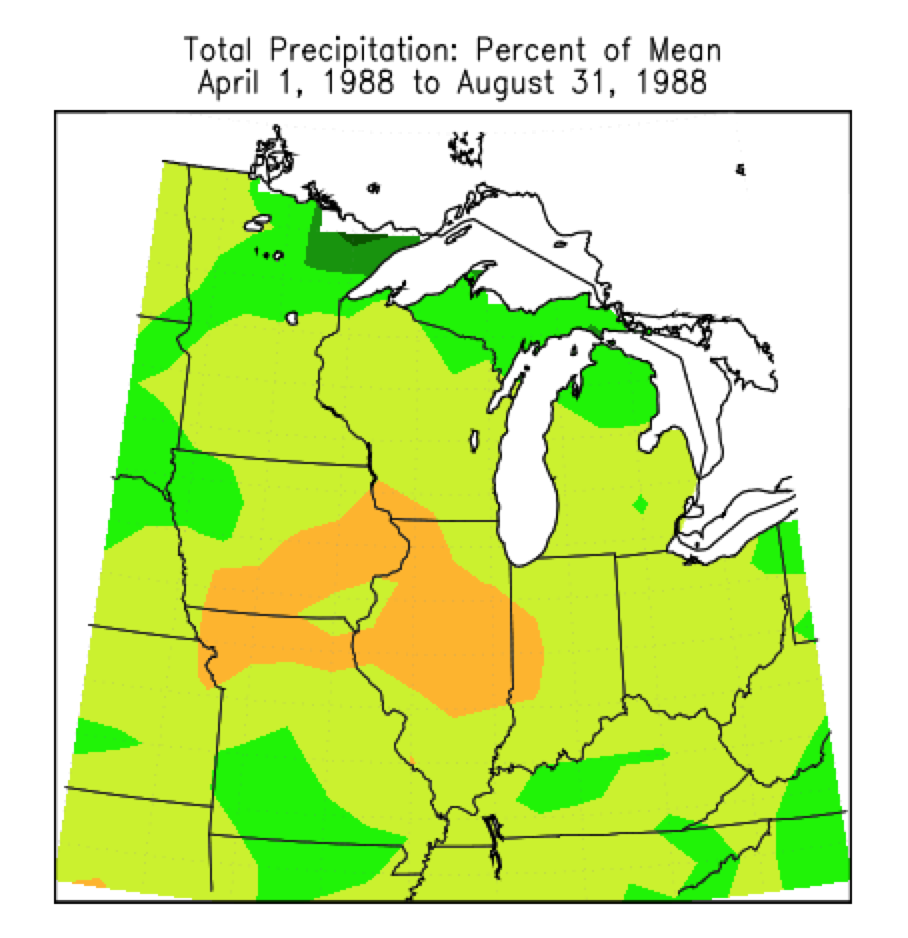
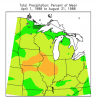
Total precipitation expressed as the percentage of the long-term mean during the summer drought of 1988 for the Midwest region |
NCA 3 |
 |
|
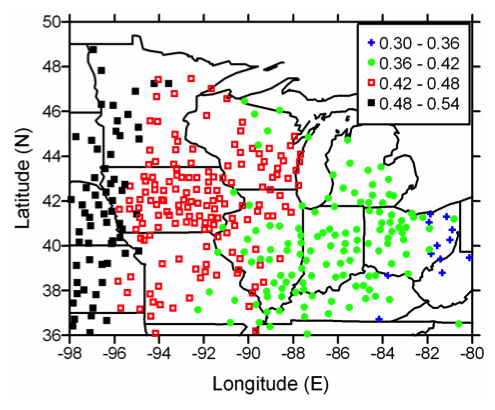
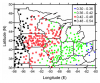
Fraction of the mean annual total precipitation from the top 10 wettest days in a year for the Midwest region. |
NCA 3 |
 |
|
Simulated annual mean temperature change |
NCA 3 |
 |
|
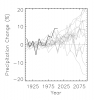
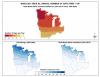
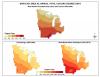
Simulated seasonal mean precipitation change |
NCA 3 |
 |
|
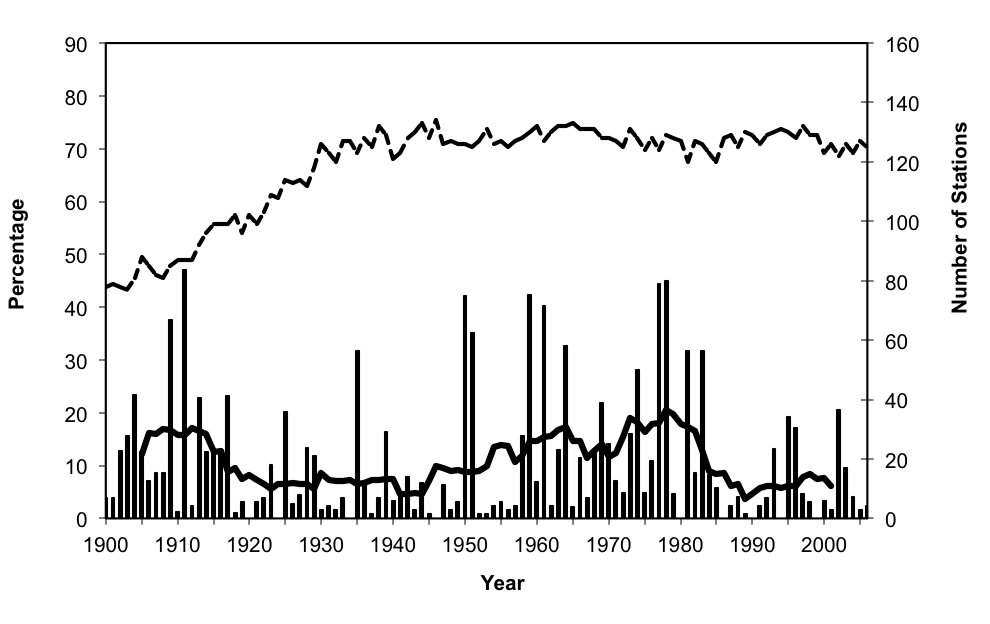
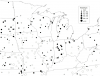
Regional average annual percentages of homogeneous snowfall stations exceeding the 90th percentile for the Midwest region |
NCA 3 |
 |
|
Simulated annual mean change in select temperature variables |
NCA 3 |
 |
|
Observed decadal mean seasonal precipitation change |
NCA 3 |
 |
|
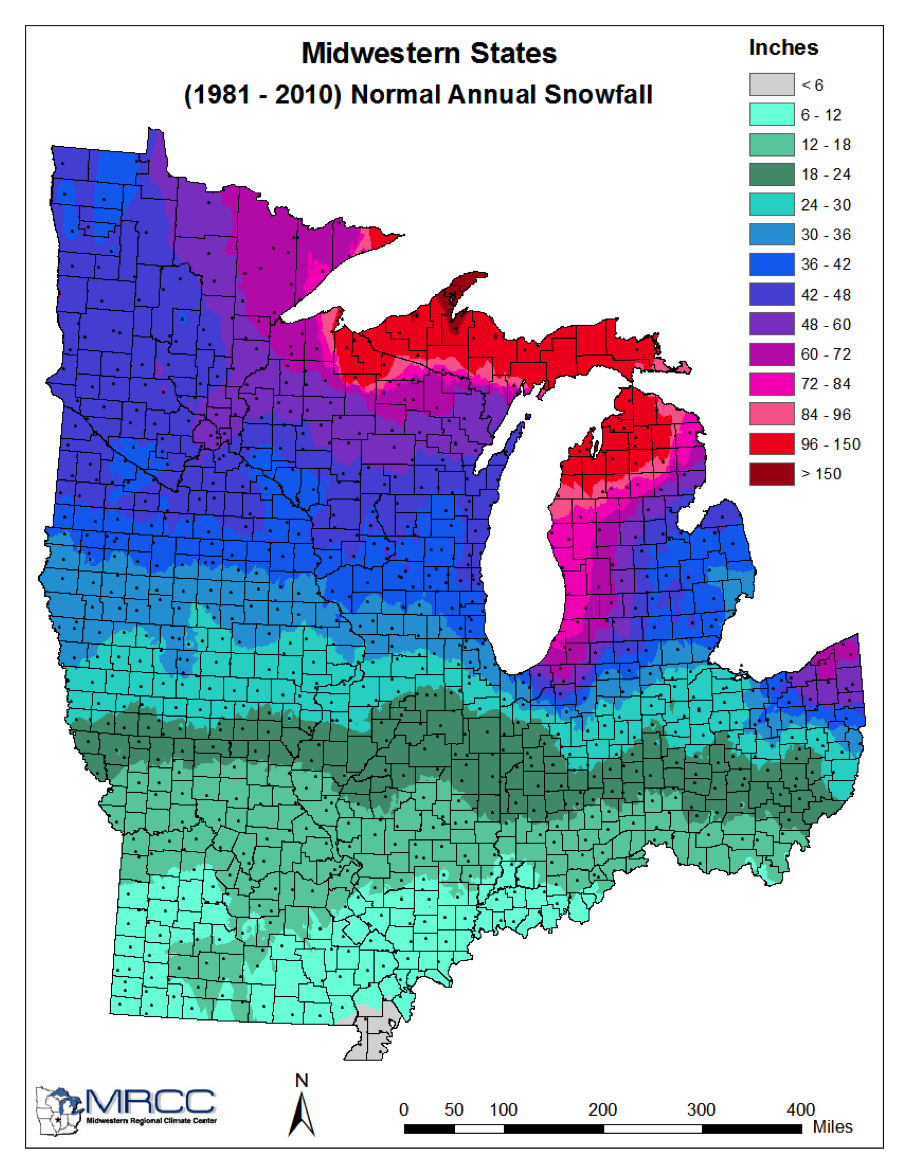
Average annual snowfall for the Midwest region |
NCA 3 |
 |
|
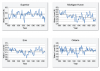
Annual and seasonal precipitation anomaly |
NCA 3 |
 |
|
Simulated difference in mean annual temperature |
NCA 3 |
 |
|
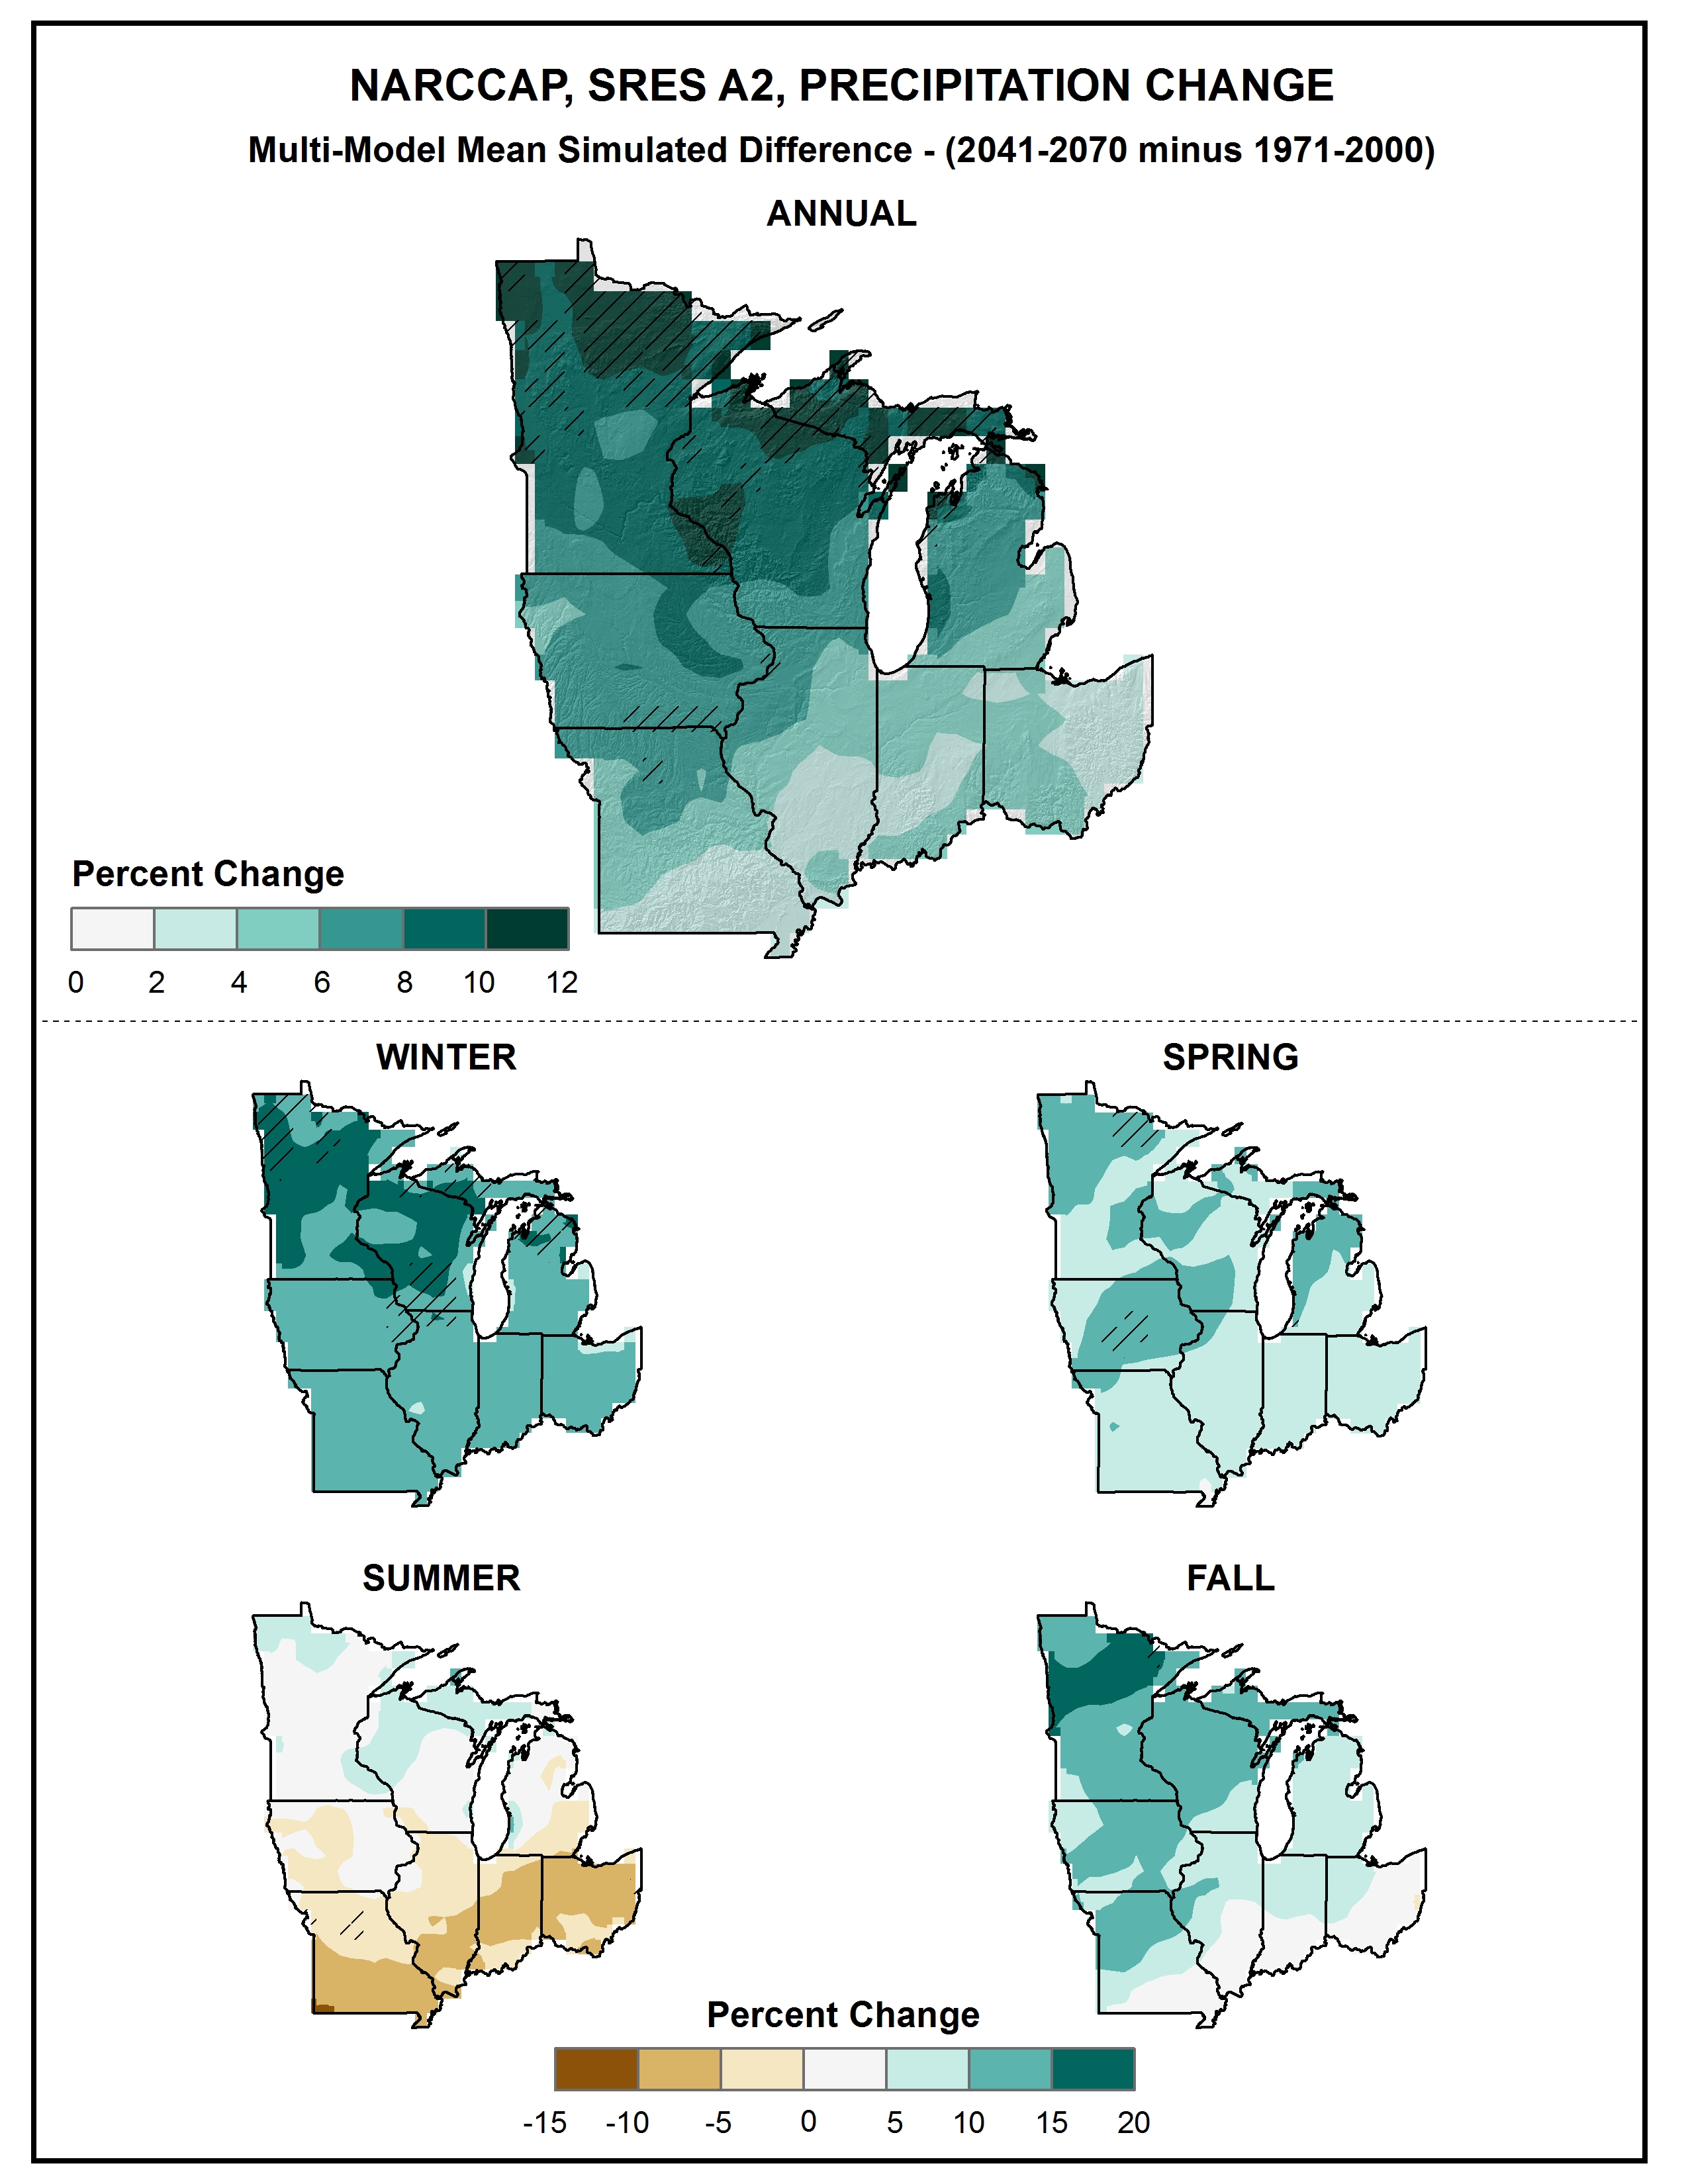
Simulated difference in annual and seasonal mean precipitation |
NCA 3 |
 |
|
Time series of freeze-free season anomalies |
NCA 3 |
 |
|
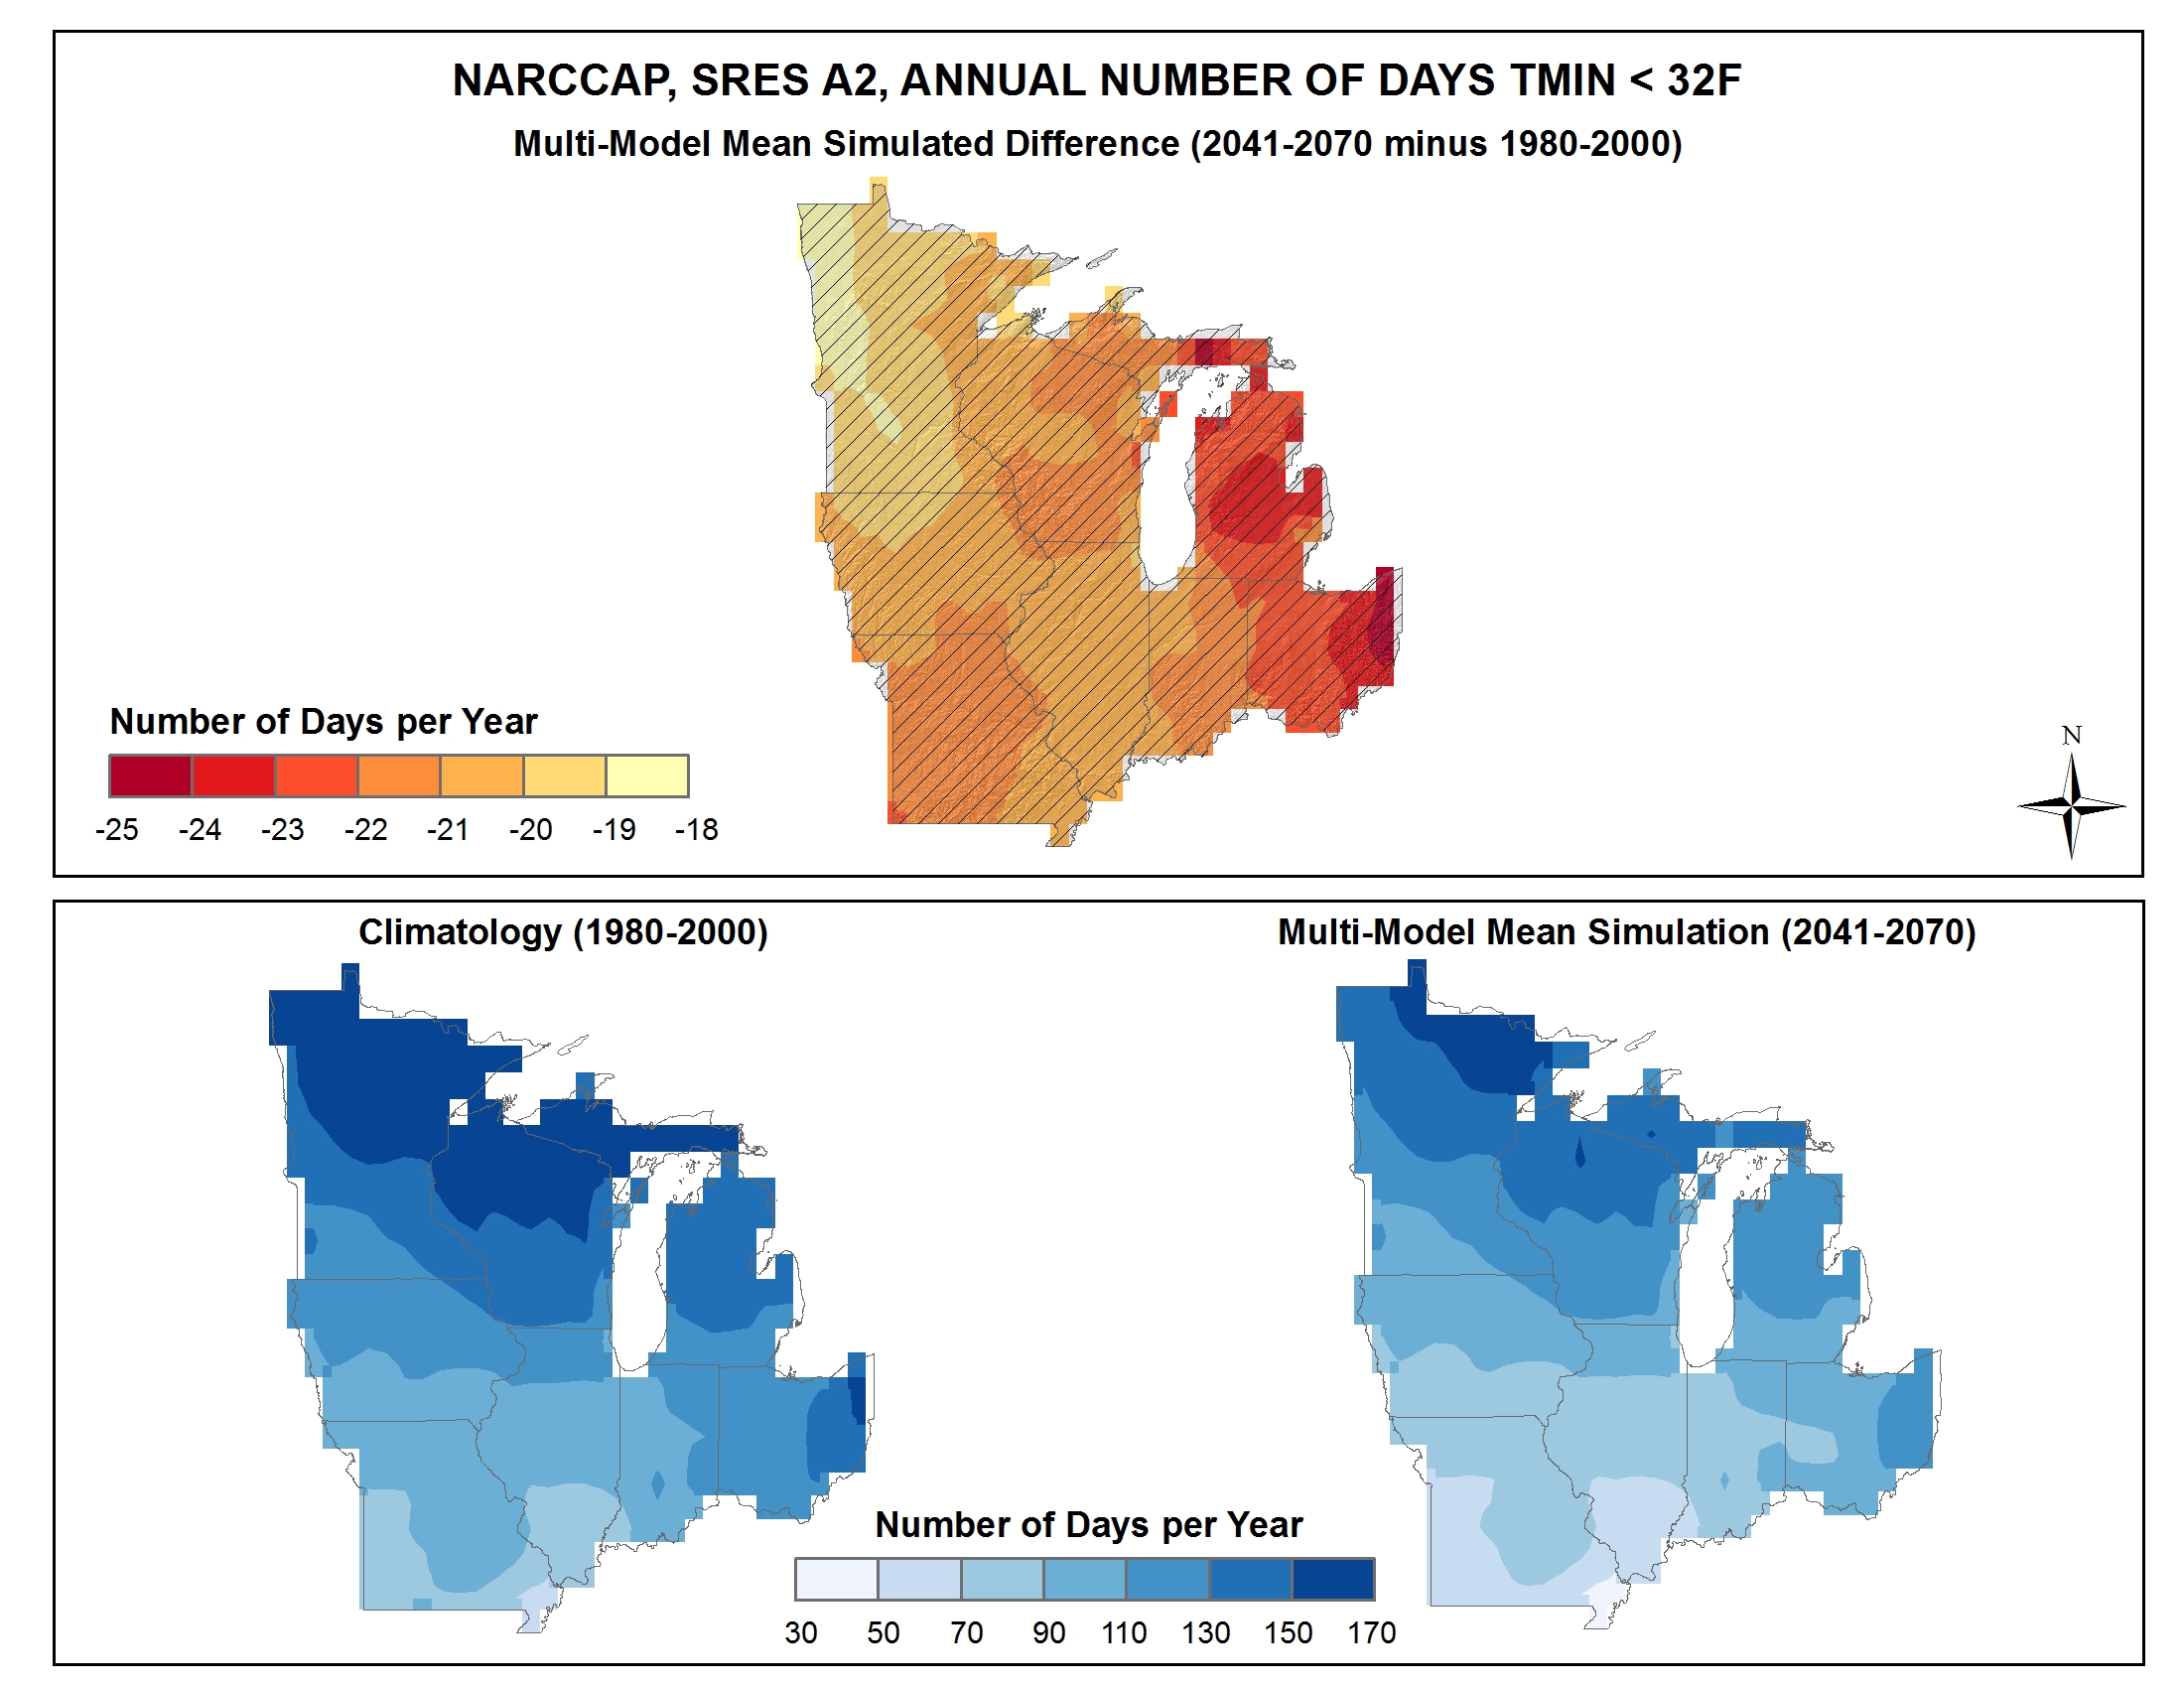
Simulated difference in the mean annual number of days with a minimum temperature less than 32F |
NCA 3 |
 |
|
Observed decadal mean seasonal temperature change |
NCA 3 |
 |
|
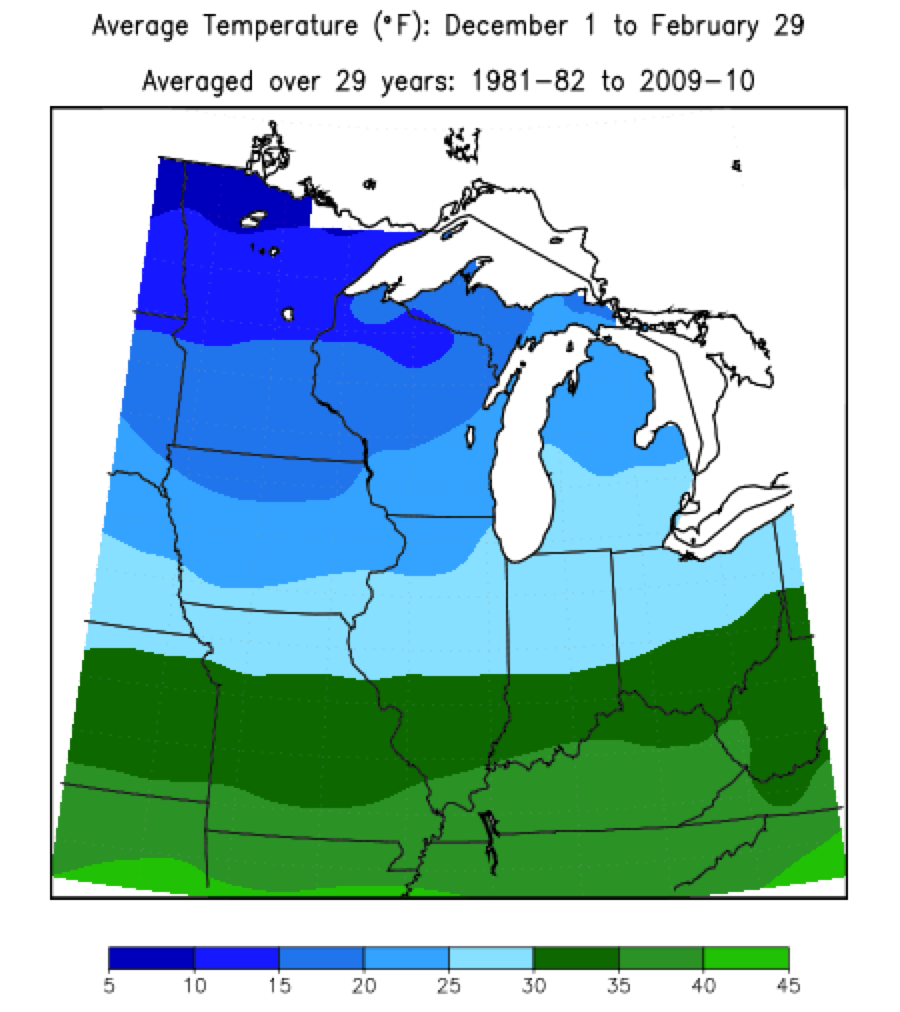
Average winter temperature for the Midwest region |
NCA 3 |
 |
|
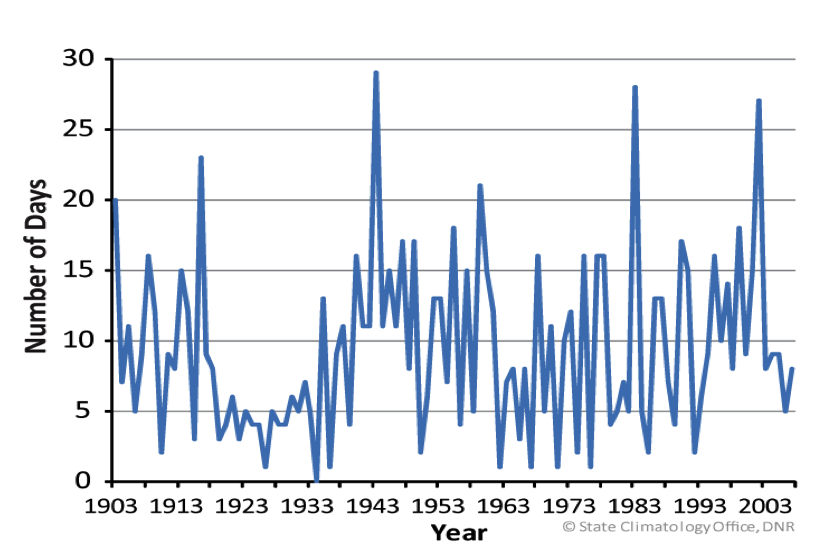
Number of days with late afternoon dewpoint equal to or exceeding 70F at Minneapolis-St. Paul |
NCA 3 |
 |
|
Simulated difference in mean annual precipitation |
NCA 3 |
 |
|
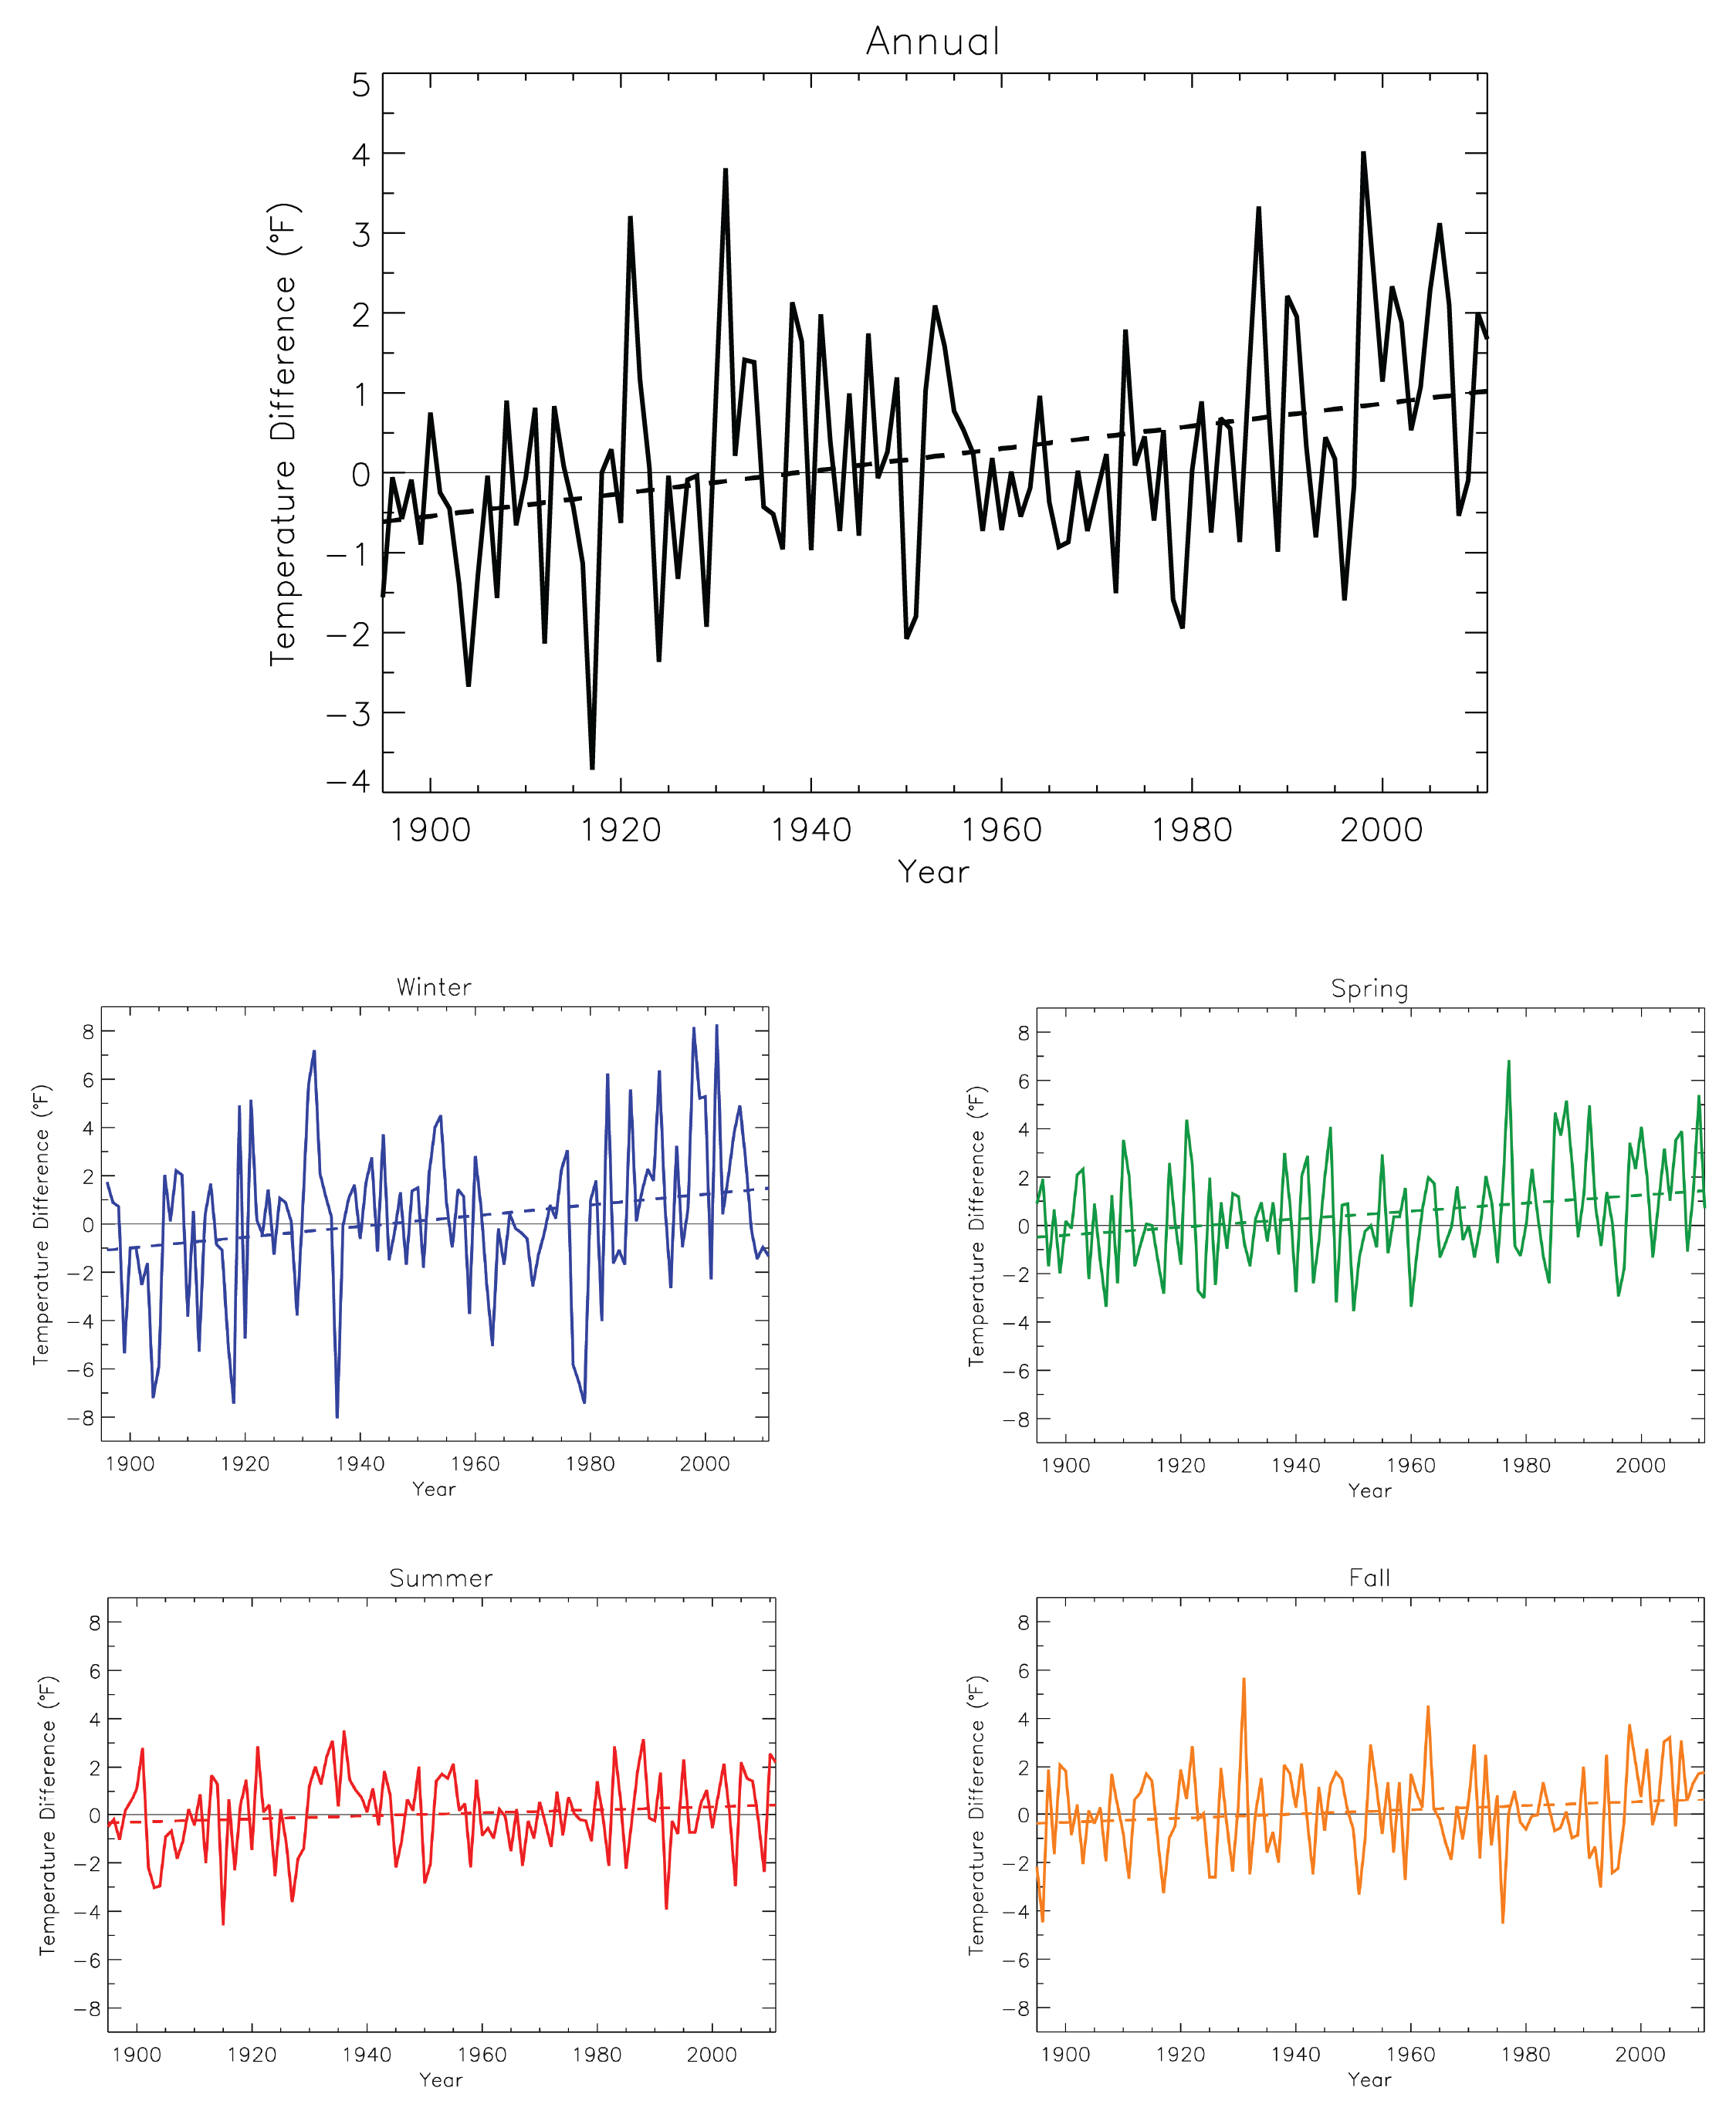
Annual and seasonal temperature anomaly |
NCA 3 |
 |
|
Time series of an index for the occurrence of heat waves and cold waves |
NCA 3 |
 |
|
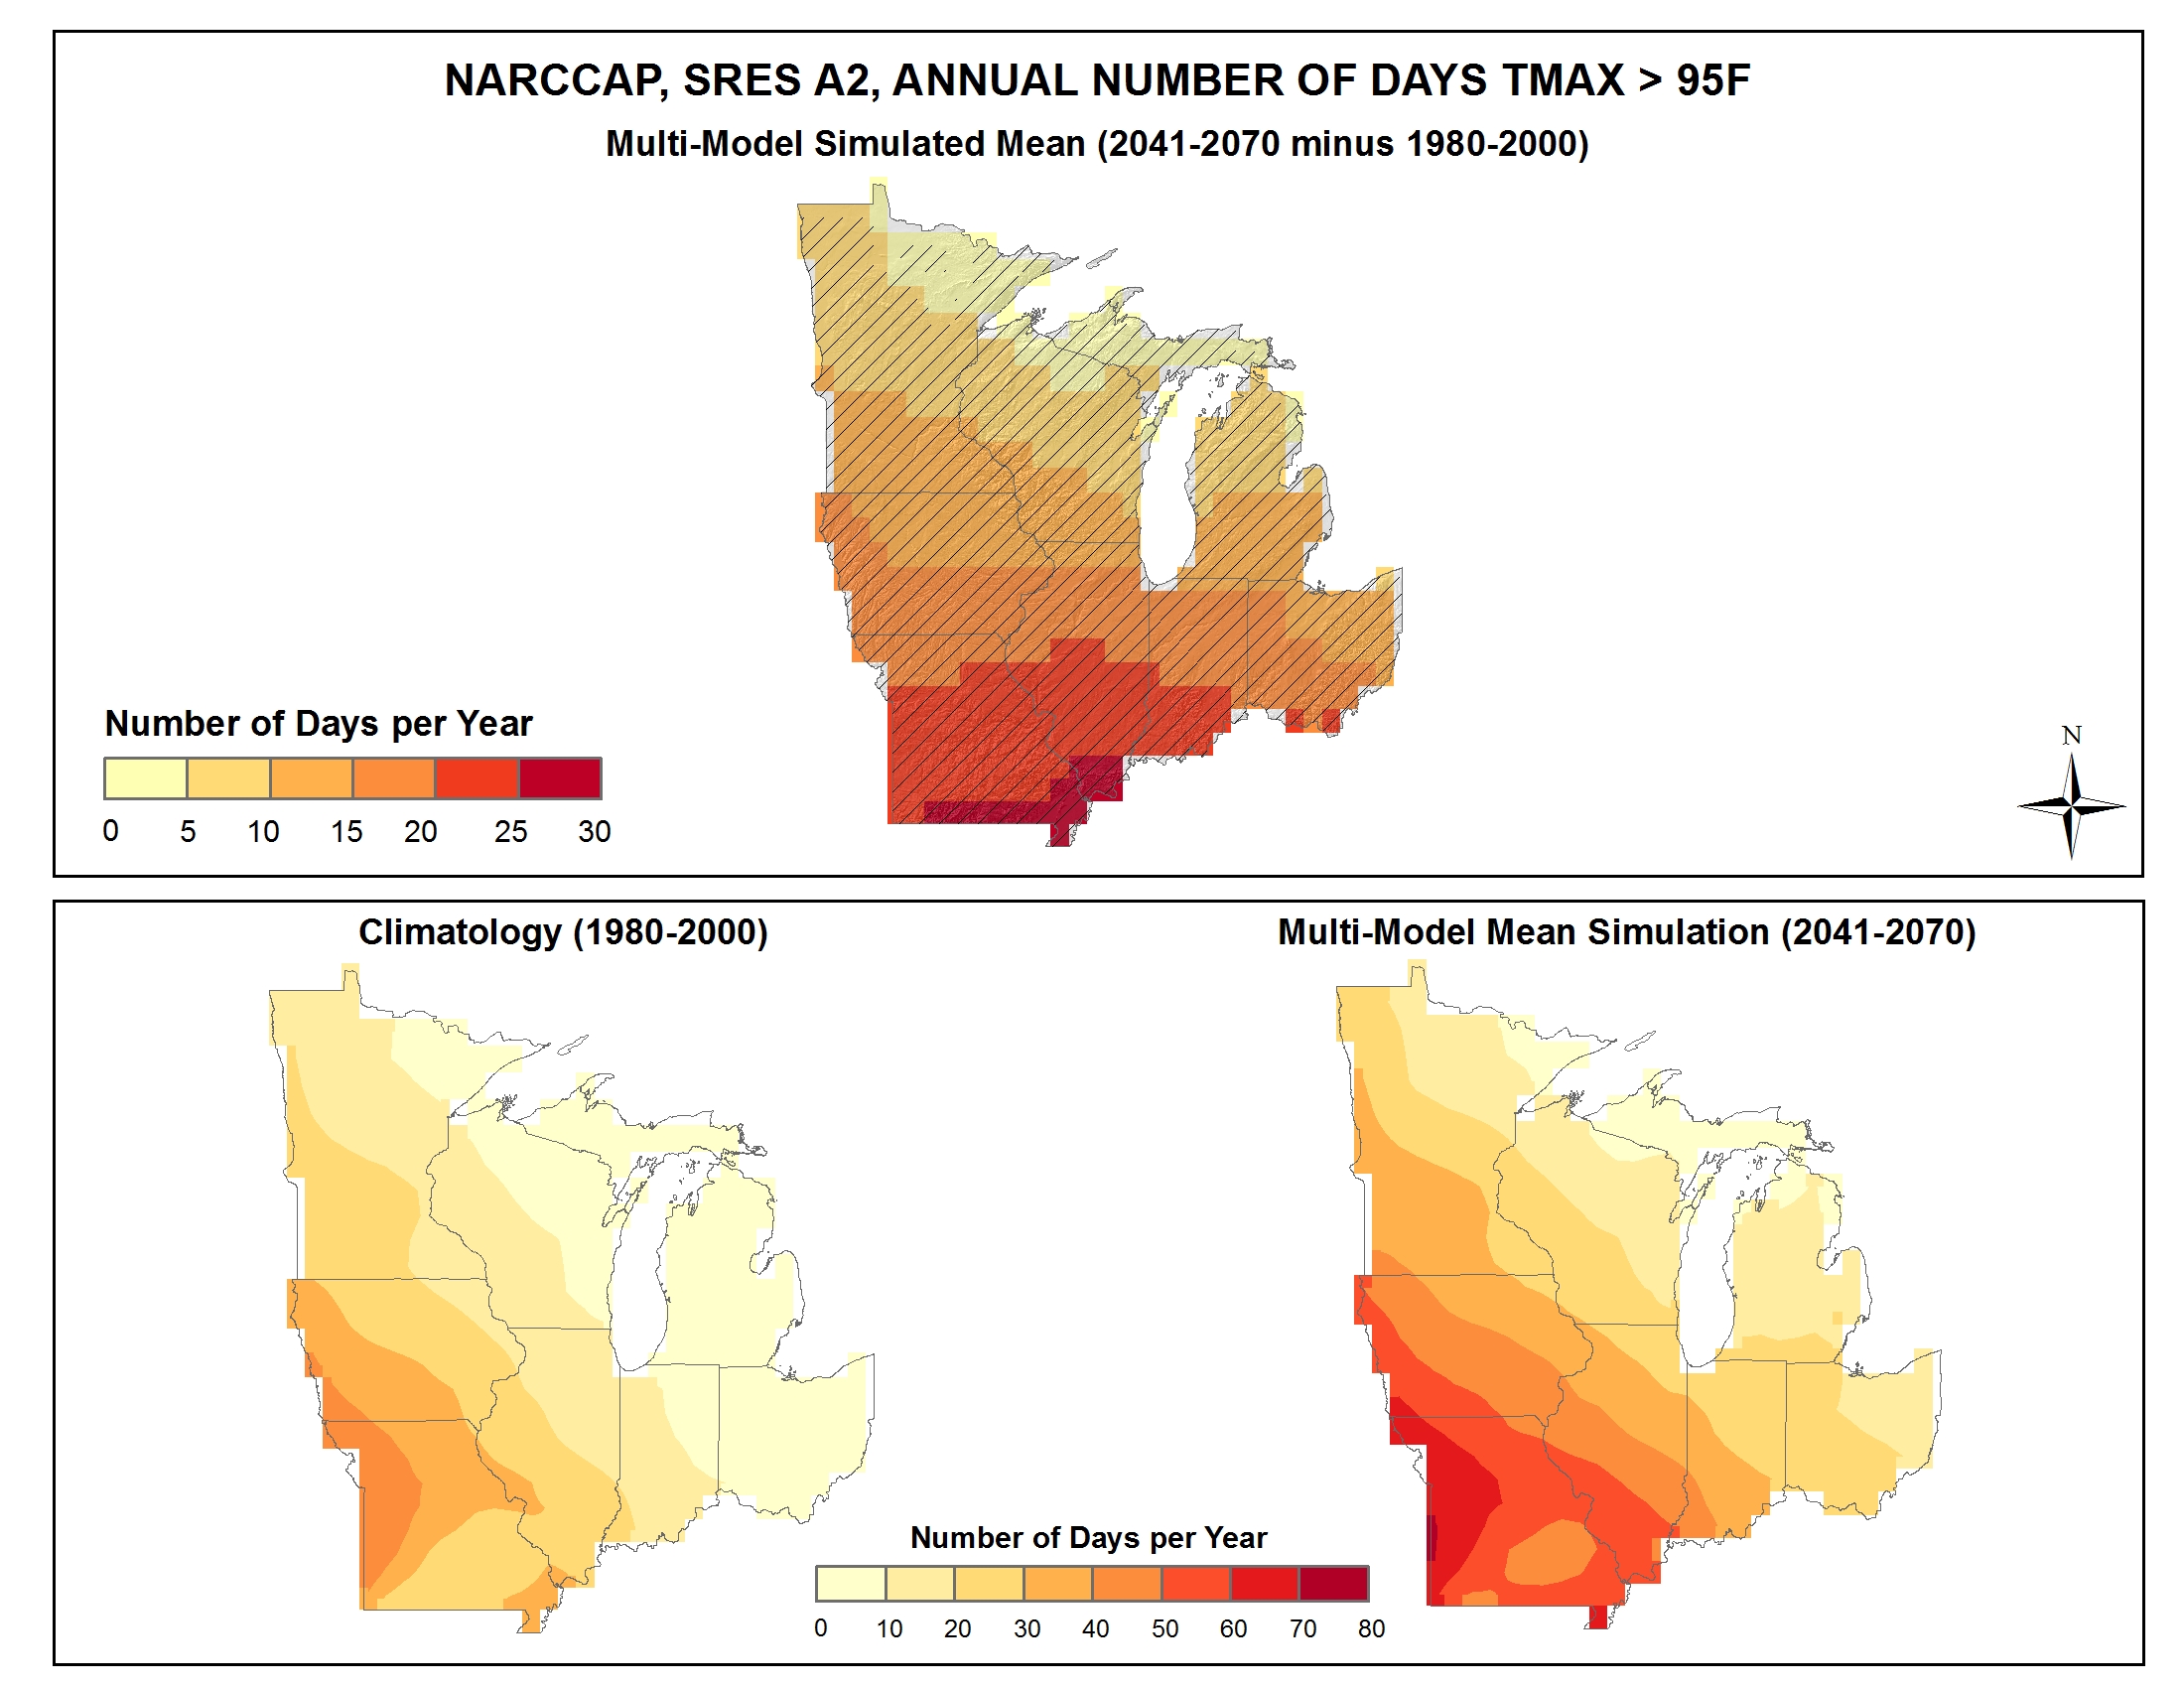
Simulated difference in the mean annual number of days with a maximum temperature greater than 95F |
NCA 3 |
 |
|
Simulated annual mean change in select precipitation variables |
NCA 3 |
 |
|
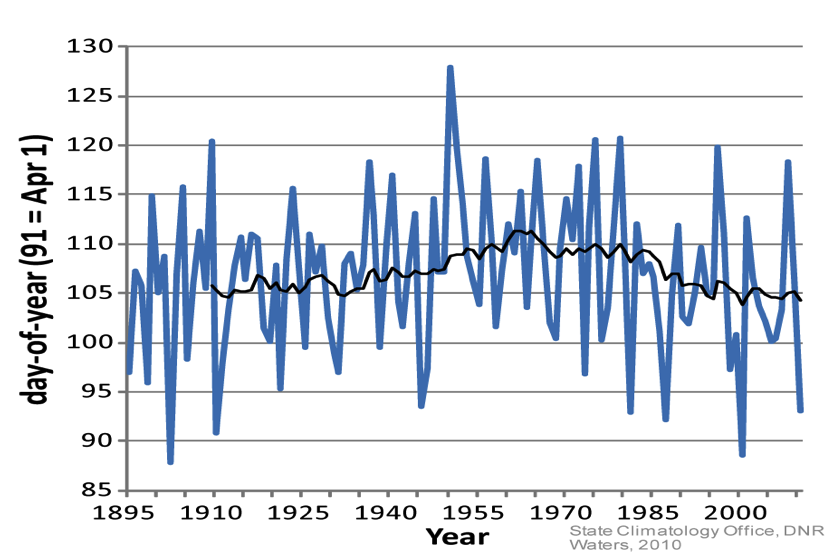
Average ice-out dates for Minnesota lakes |
NCA 3 |
 |
|
Simulated difference in the mean annual number of heating degree days |
NCA 3 |
 |
|
Simulated decadal mean change in annual precipitation |
NCA 3 |
 |
|
Average annual number of snowstorms for the Midwest region |
NCA 3 |
 |