General Information
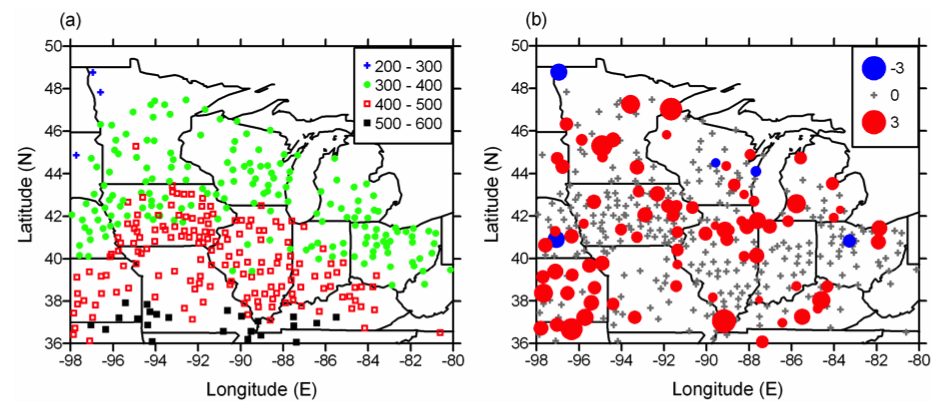
a) Average annual precipitation (mm) during the top 10 wettest days in a year for 1971-2000 for the Midwest region. There is a general increase from north to south. b) Trend in the sum of the top 10 wettest days in a year for 1901-2000, expressed in a percent per decade, for the Midwest region. A red circle indicates that the station showed a statistically significant increase through time; a blue circle indicates a statistically significant decrease. A plus symbol indicates that the trend was not significant (shown as 0 in the legend). The diameter of the circle scales linearly with the trend magnitude. Most stations with statistical significance show upward trends. There are a number of stations whose trends are not statistically significant, which reflects the high spatial and temporal variability of heavy precipitation and possible data quality issues (see text). Only stations with 80 years of precipitation data between 1895 and 2002 are shown (Pryor et al. 2009b). Figure courtesy of Indiana University Press.
Data Type:
Observed
Variable Type:
Precipitation
Region:
Metadata
Metadata File(s):
Files