General Information
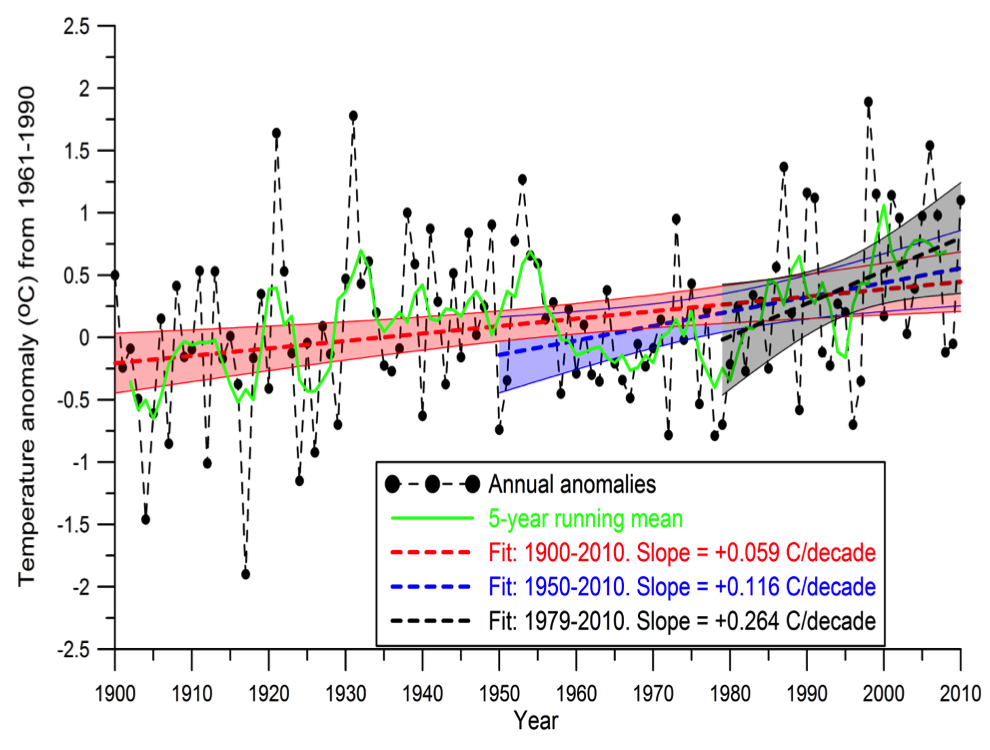
Annual temperature anomalies for the Midwest region from the CRUTEM3 data set. The anomalies are relative to 1961-1990. The data have a spatial resolution of 5 x 5, thus the domain used to construct this figure is 35N to 50N and 95W to 80W. Also shown is a 5-year running mean and linear fits to the annual data for 1900-2010, 1950-2010 and 1979-2010. The shading represents the 95% confidence intervals on the fits. The slopes of the region-wide trend estimates are expressed in C per decade and are shown for 3 time periods; 1900-2010, 1950-2010, and 1979-2010 (Pryor and Barthelmie 2012a). Data were downloaded from the Climatic Research Unit, University of East Anglia (UEA 2012). While trends for all periods are upward, the magnitude of the trend increases as the starting point for trend analysis becomes more recent. Figure courtesy of Indiana University Press.
Data Type:
Observed
Variable Type:
Temperature
Region:
Source Information
Data Source(s):
Metadata
Metadata File(s):
Files