General Information
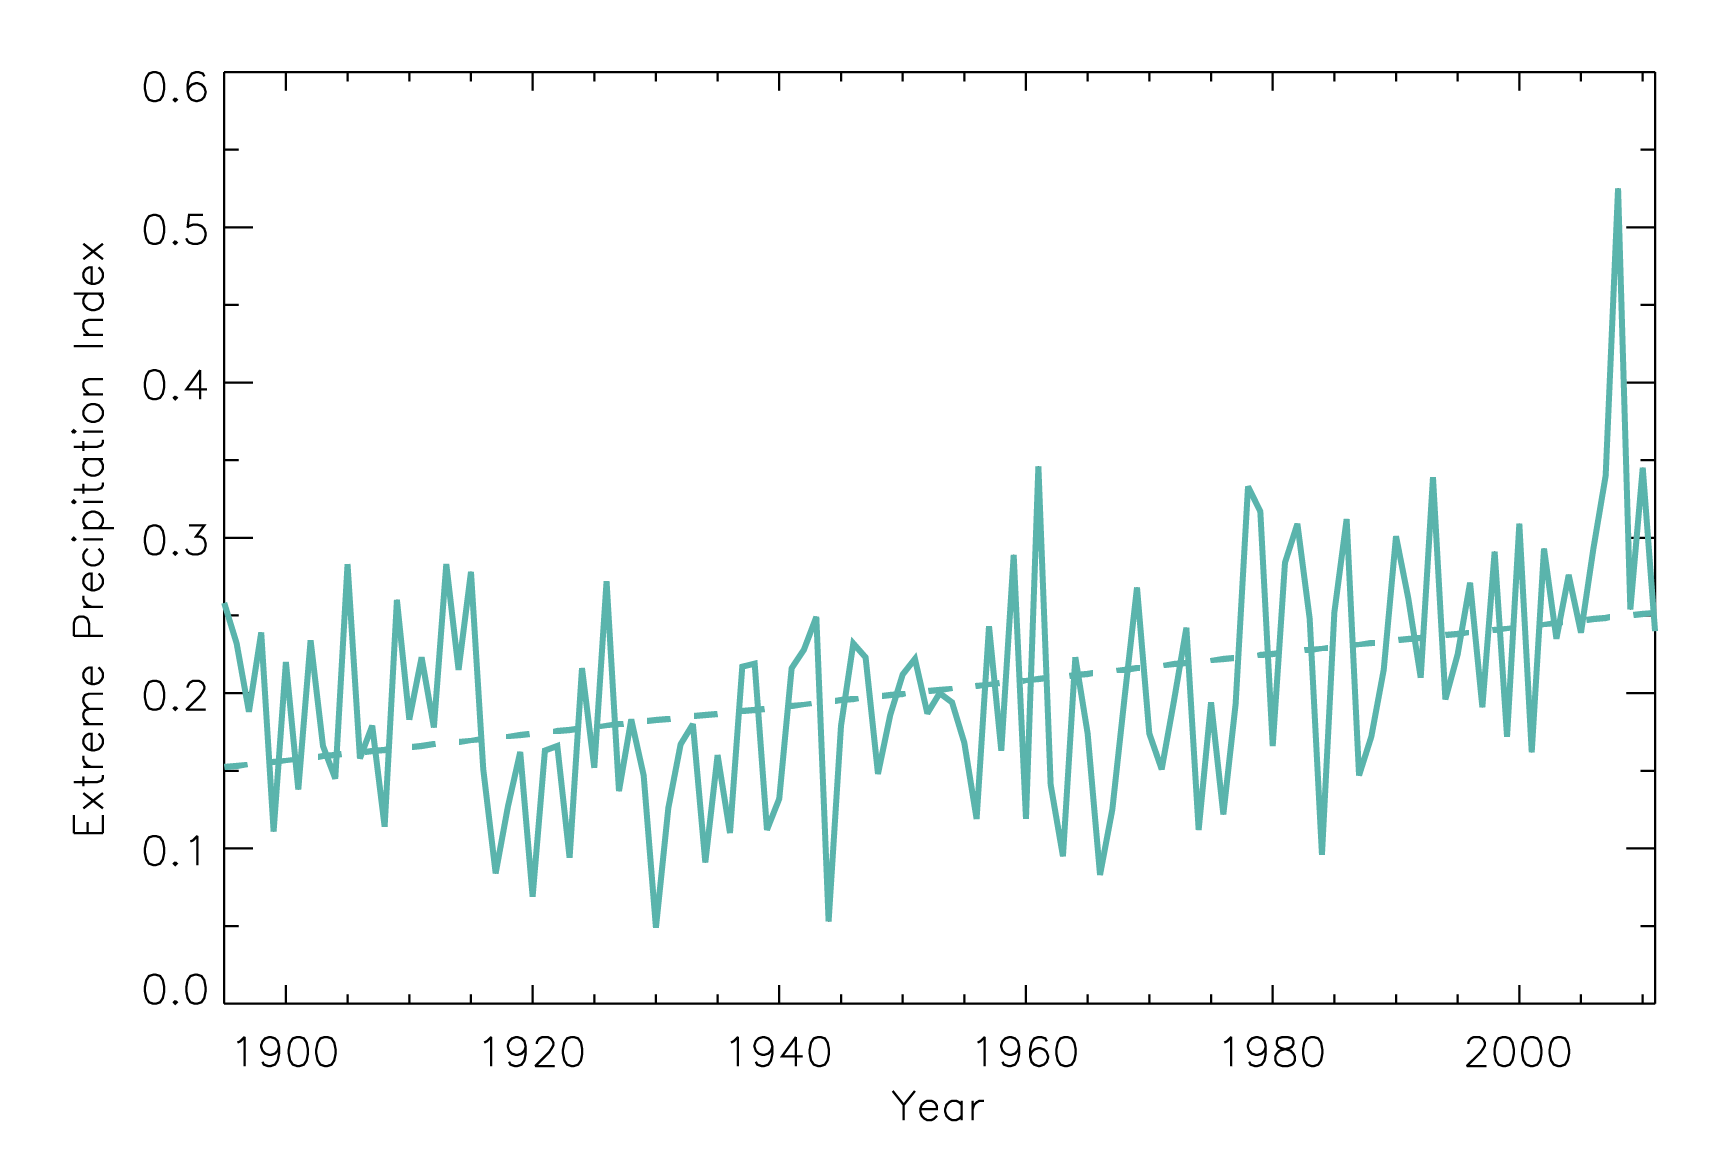
Time series of extreme precipitation index for the occurrence of 1-day, 1 in 5-year extreme precipitation events, for the Midwest region. The dashed line is a linear fit. Based on daily COOP data from long-term stations in the National Climatic Data Centers Global Historical Climate Network data set. Only stations with less than 10% missing daily precipitation data for the period 1895-2011 are used in this analysis. Events are first identified for each individual station by ranking all daily precipitation values and choosing the top N/5 events, where N is the number of years of data for that particular station. Then, event numbers for each year are averaged for all stations in each 1x1 grid box. Finally, a regional average is determined by averaging the values for the individual grid boxes. This regional average is the extreme precipitation index. There is a statistically significant upward trend.
Data Type:
Observed
Variable Type:
Precipitation
Region:
Source Information
Data Source(s):
Image Source:
Laura Stevens
Metadata
Metadata File(s):
Files