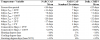
|
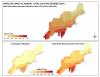
Simulated decadal mean change in annual precipitation |
NCA 3 |
 |
|
Annual mean sea level for gauges at four major Northeast coastal cities |
NCA 3 |
 |
|
Simulated difference in the mean annual number of heating degree days |
NCA 3 |
 |
|
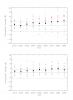
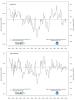
Trends in temperature and precipitation anomaly |
NCA 3 |
 |
|
Simulated seasonal mean temperature change |
NCA 3 |
 |
|
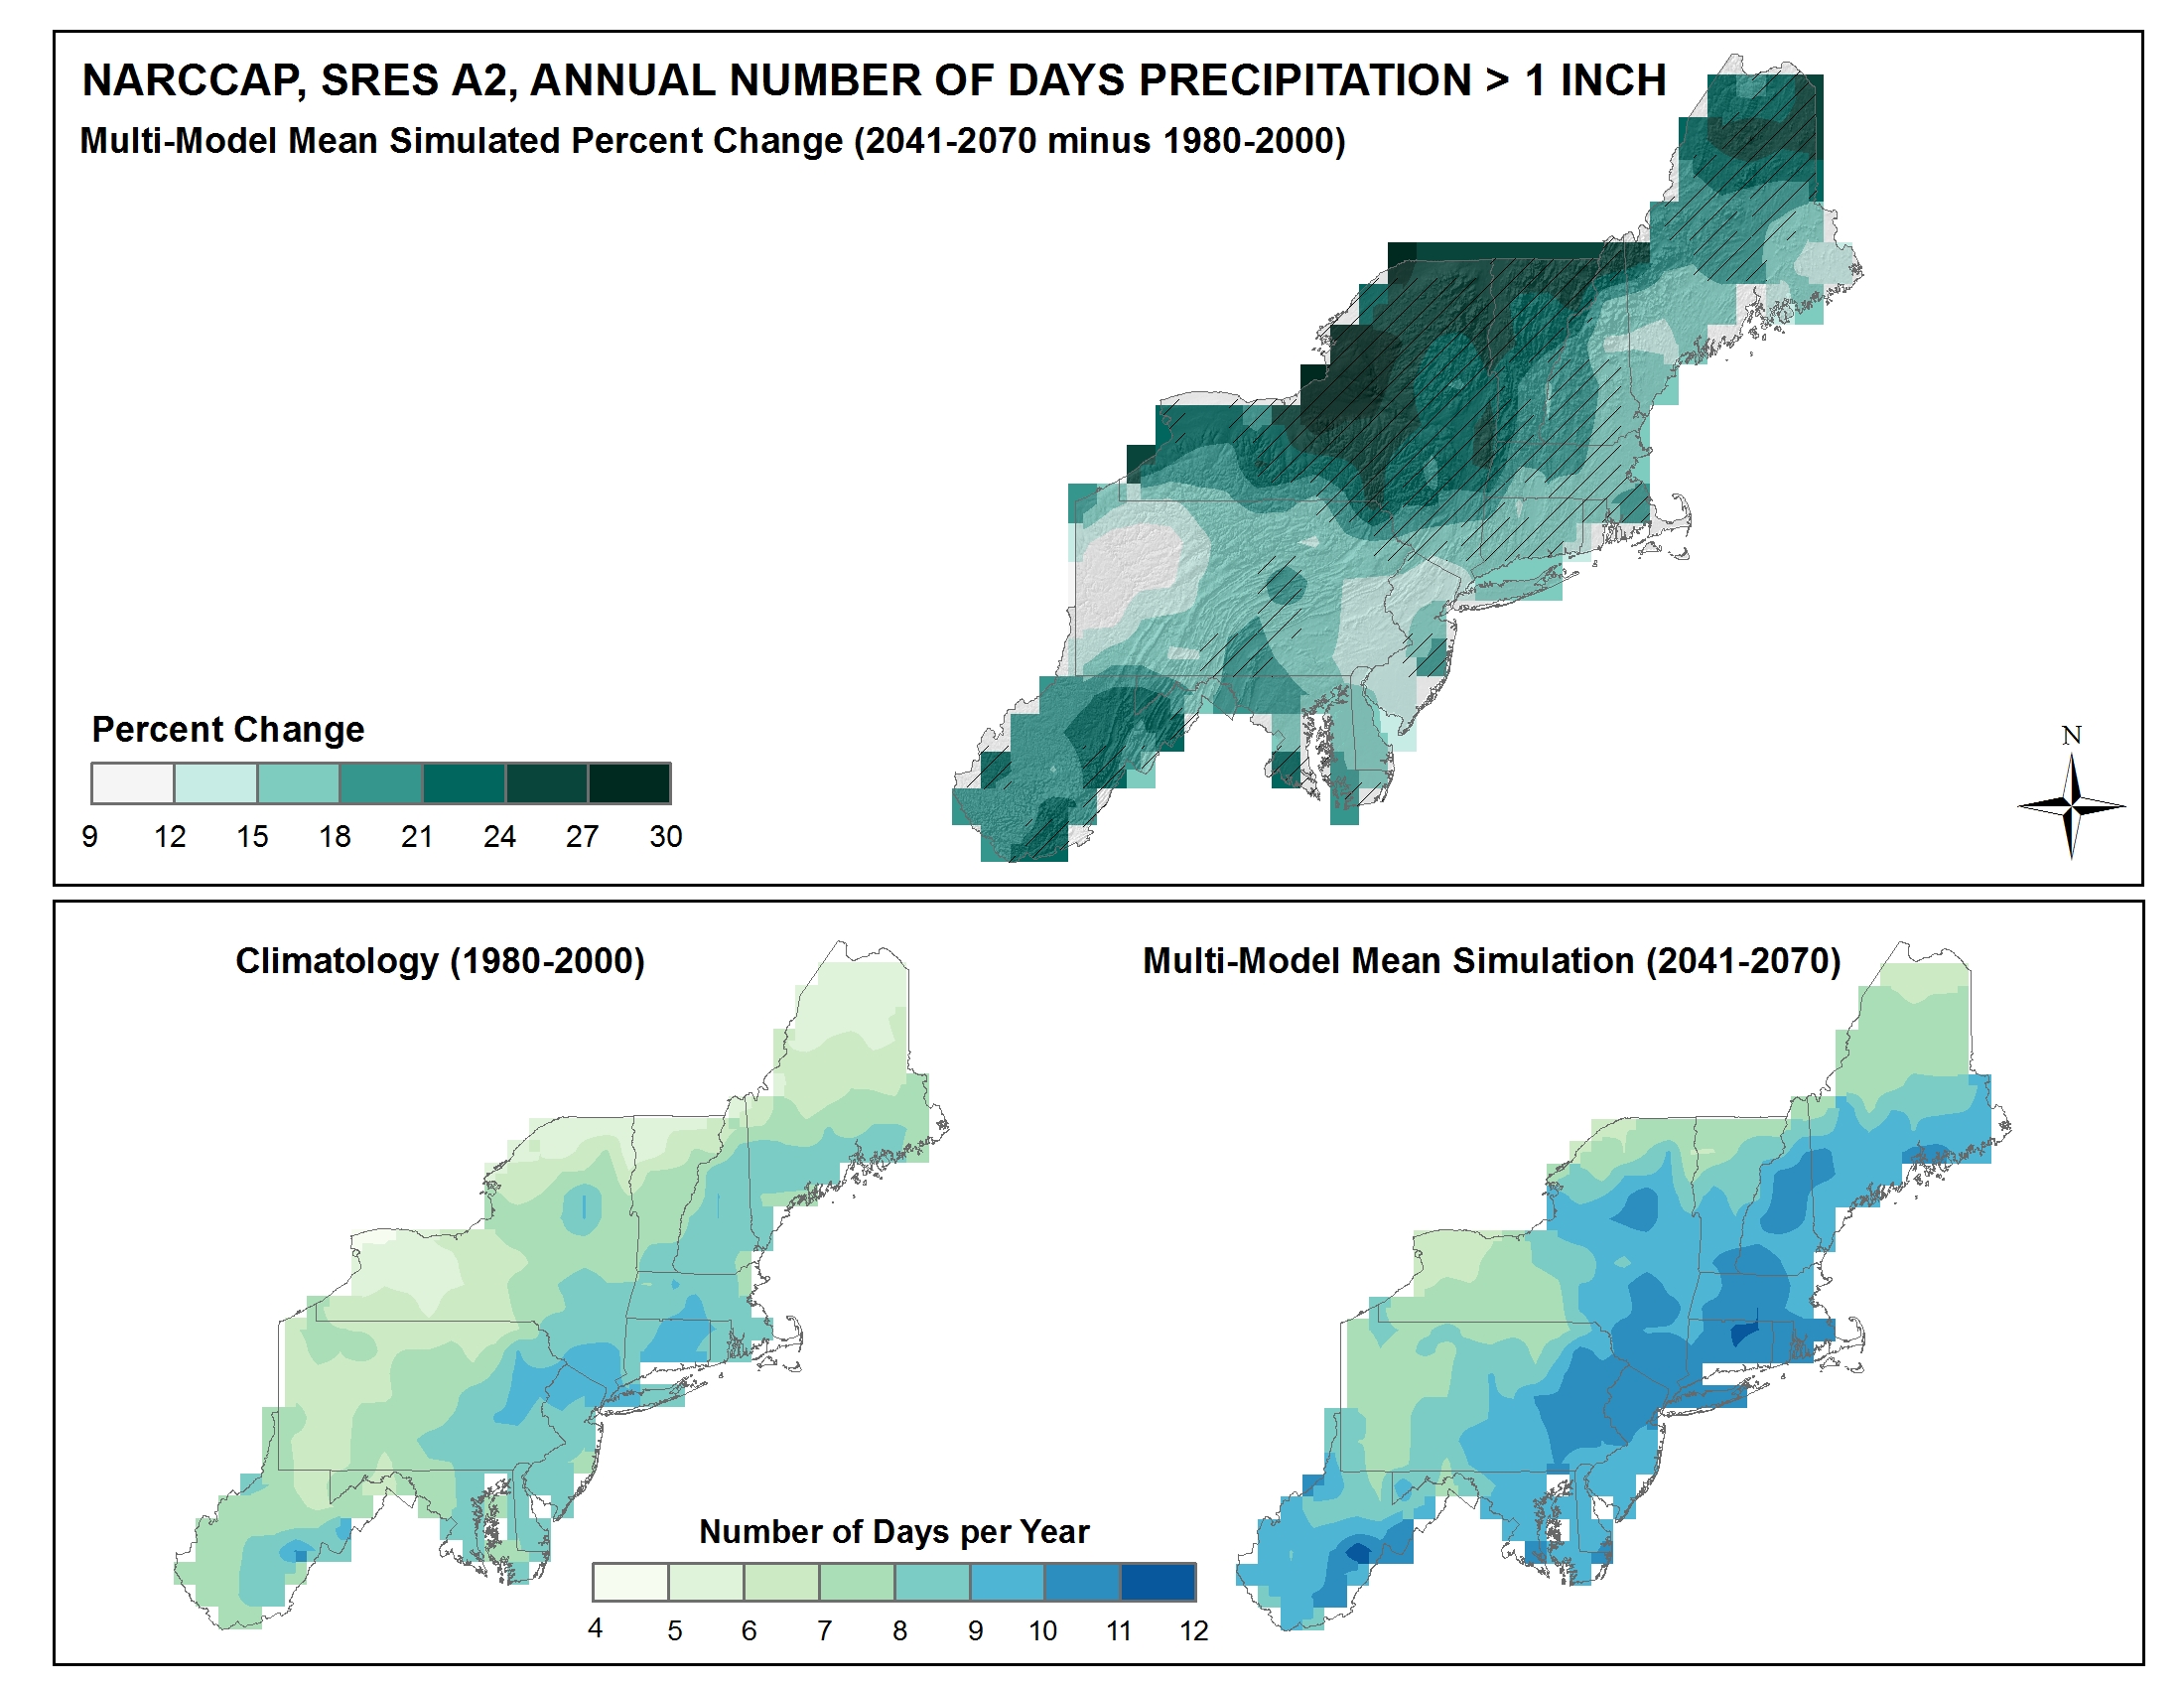
Simulated difference in the mean annual number of days with precipitation of greater than one inch |
NCA 3 |
 |
|
Date of ice-in on the main portion of Lake Champlain |
NCA 3 |
 |
|
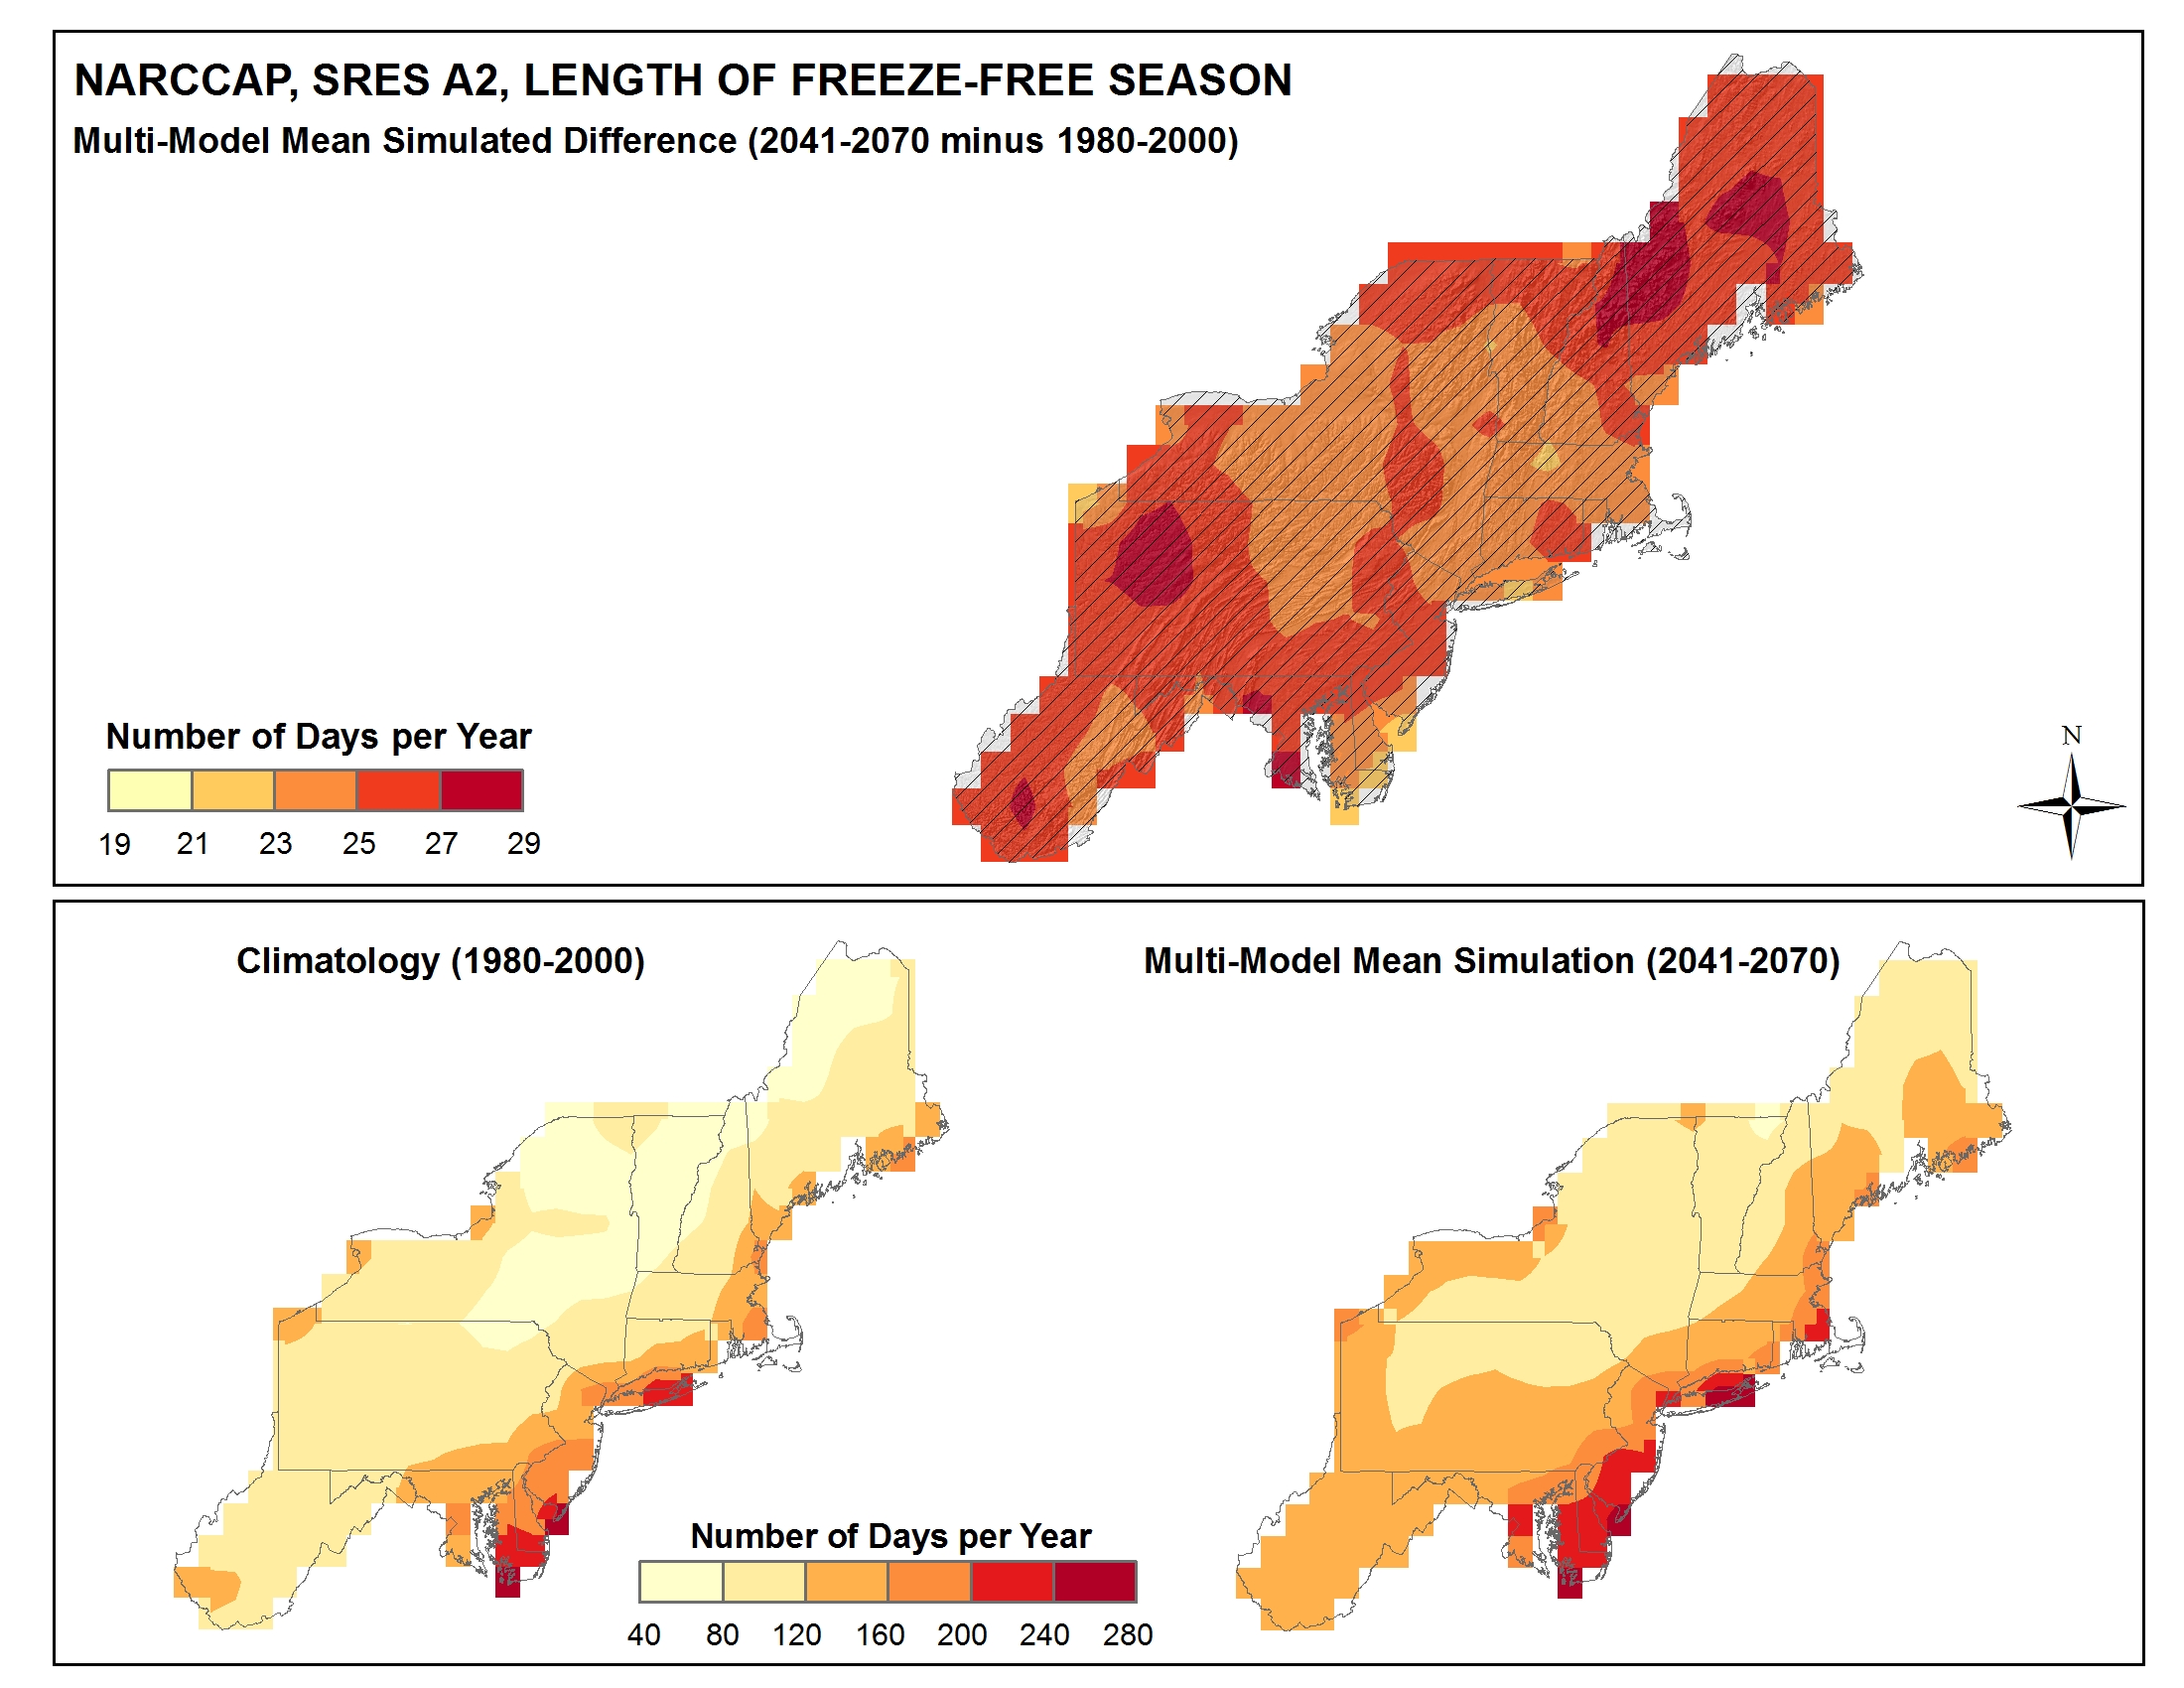
Simulated difference in the mean annual length of the freeze-free season |
NCA 3 |
 |
|
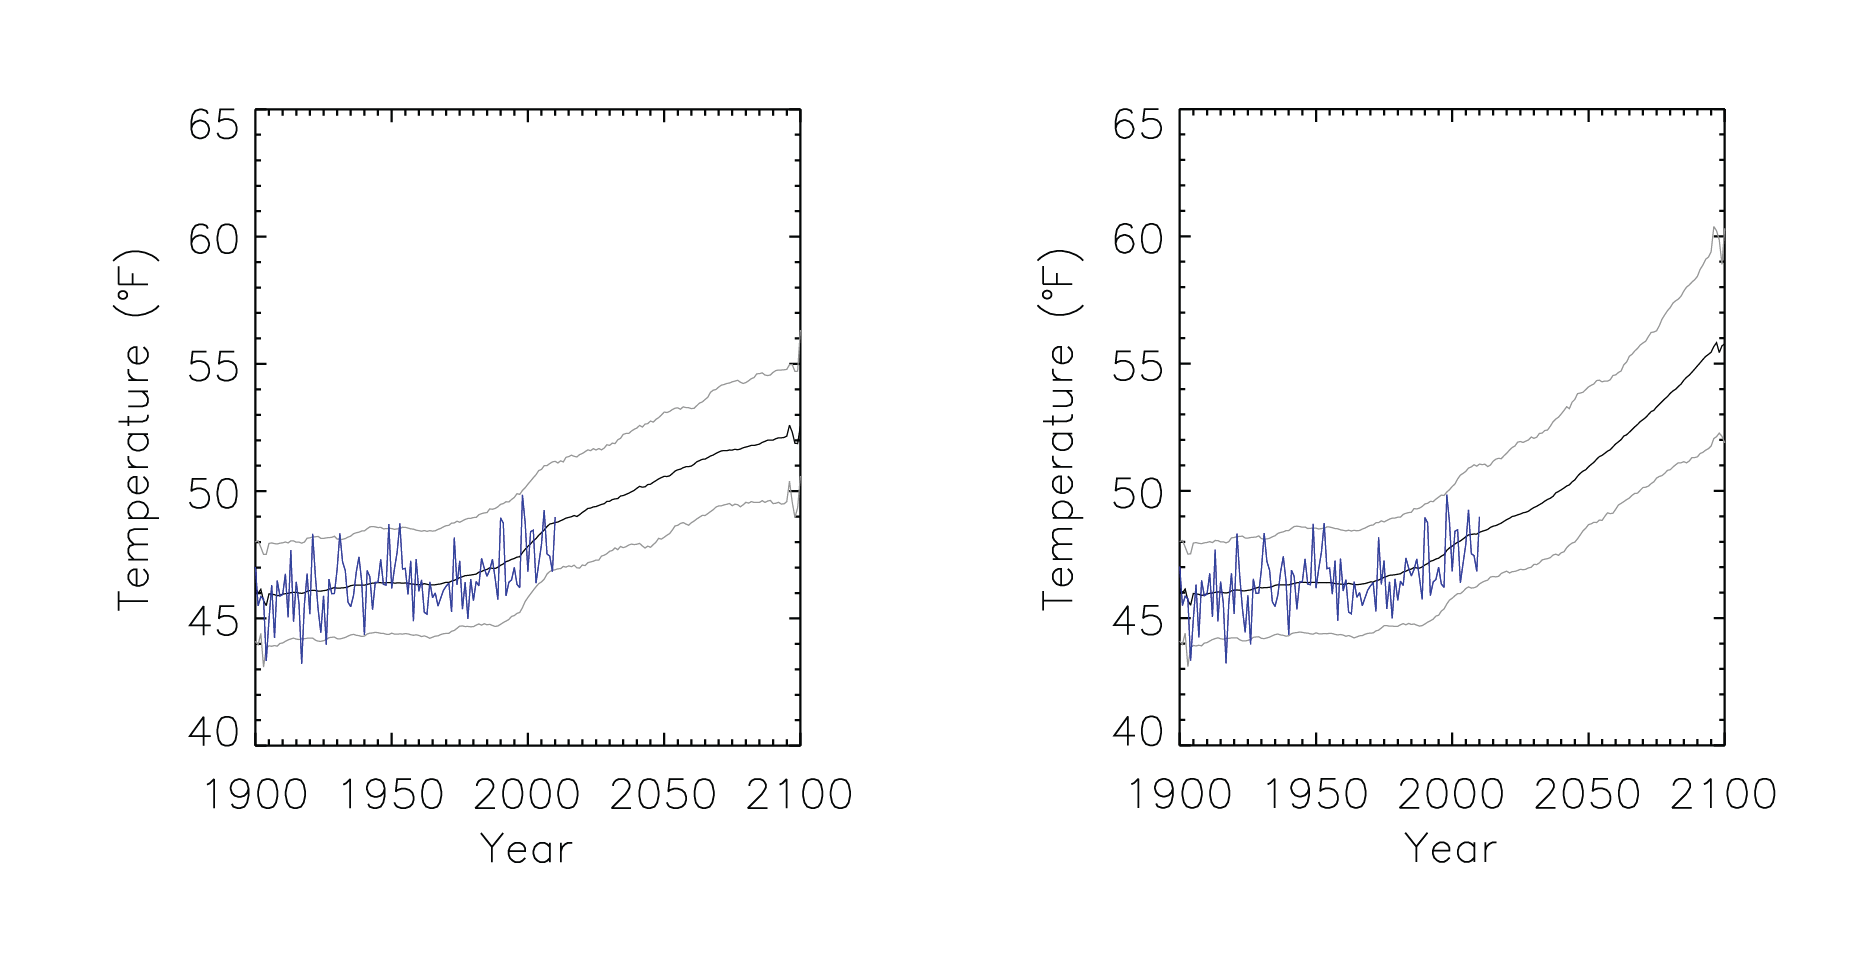
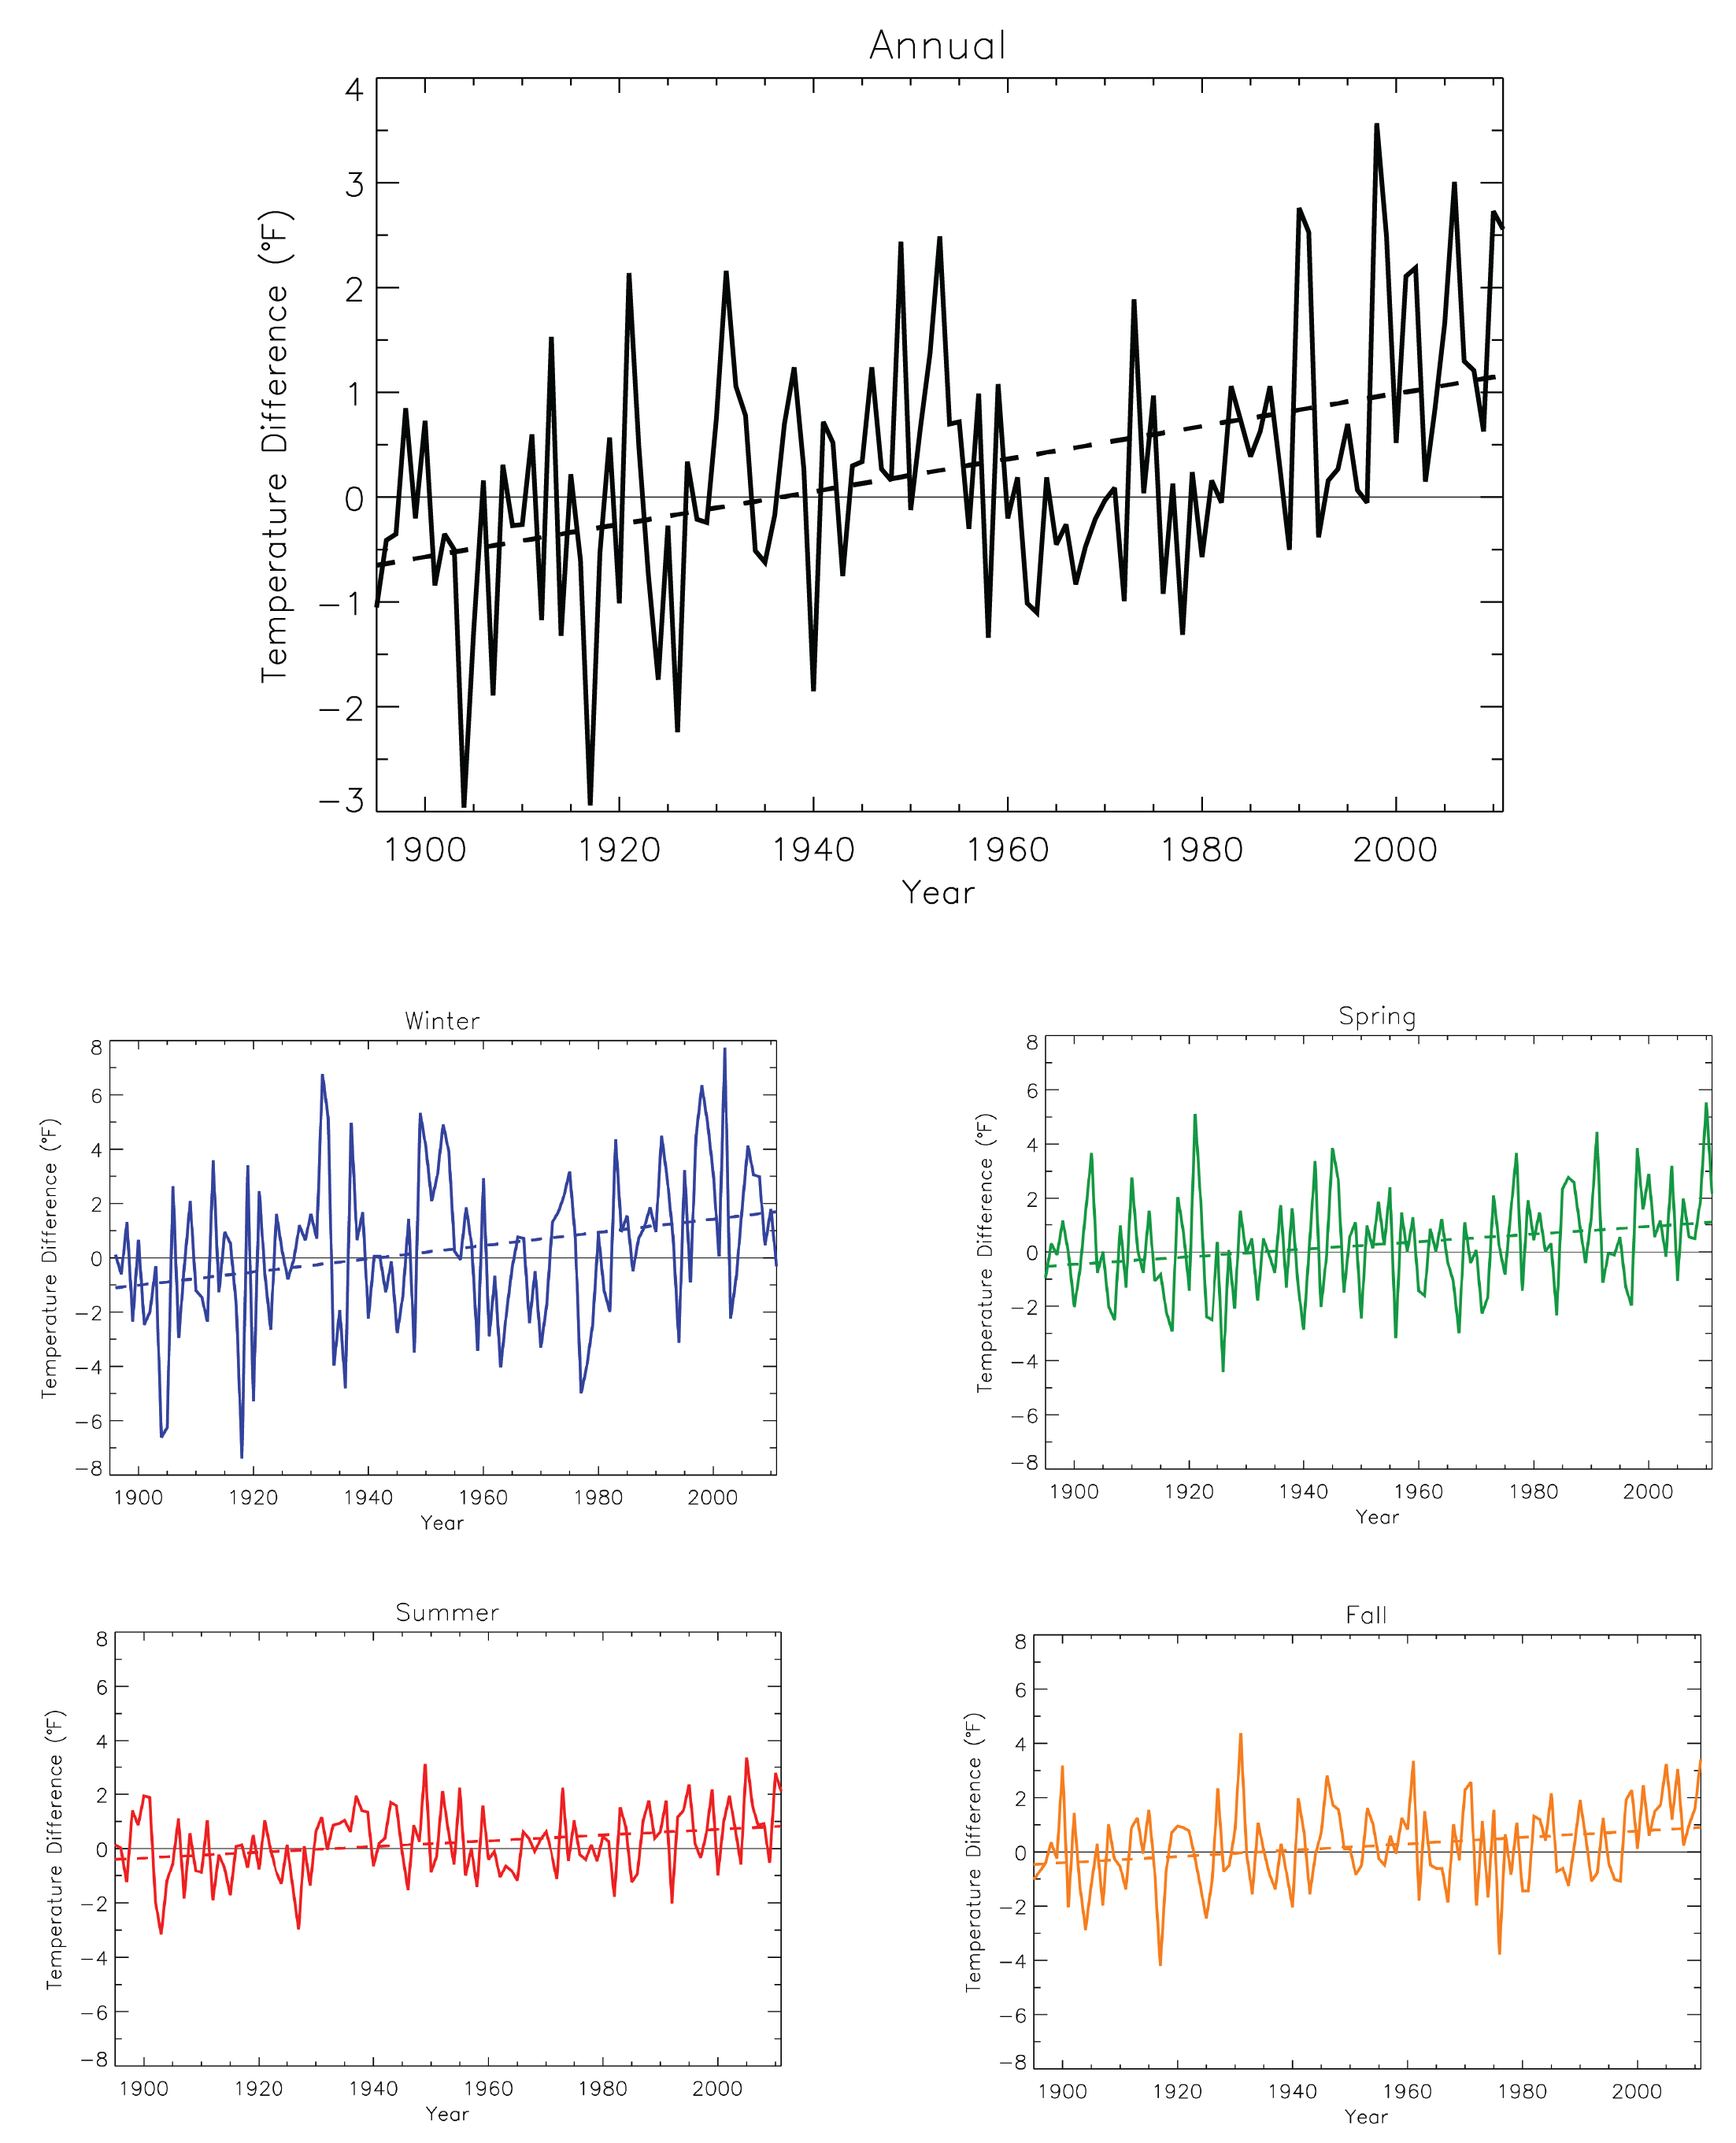
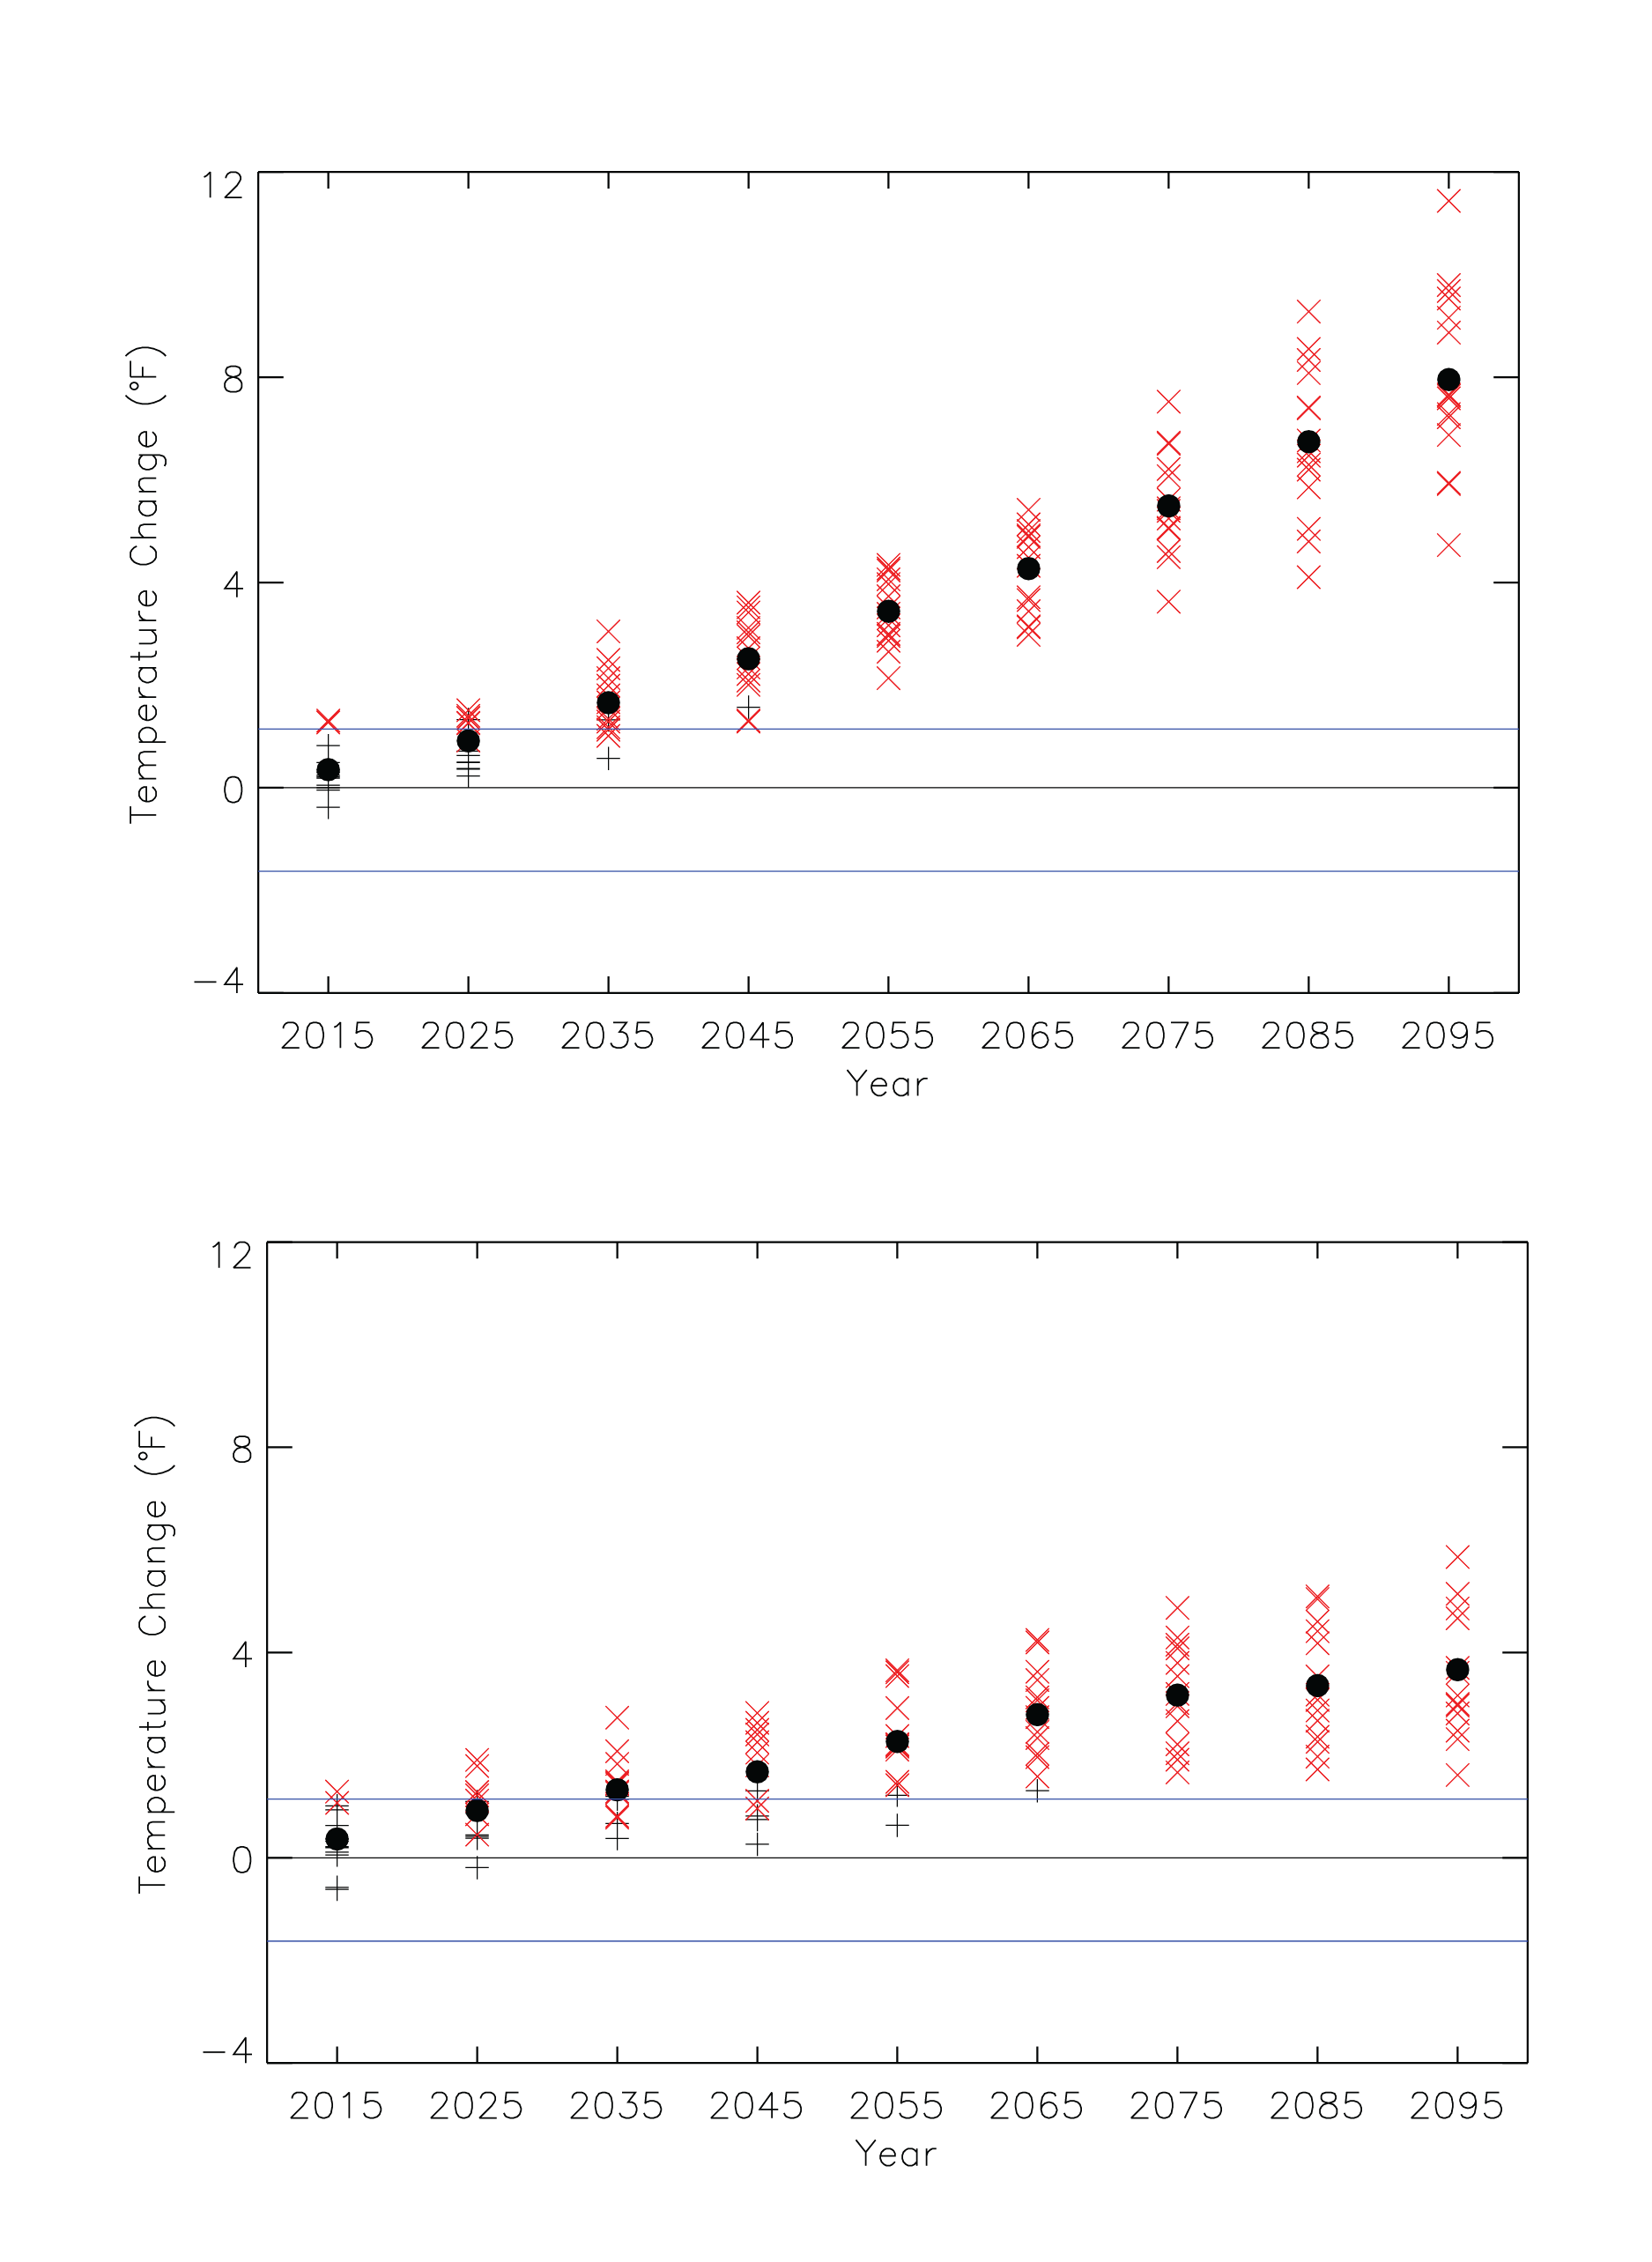
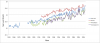
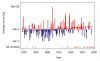
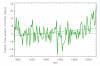
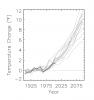
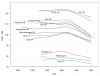
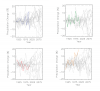
Time series of mean annual temperature |
NCA 3 |
 |
|
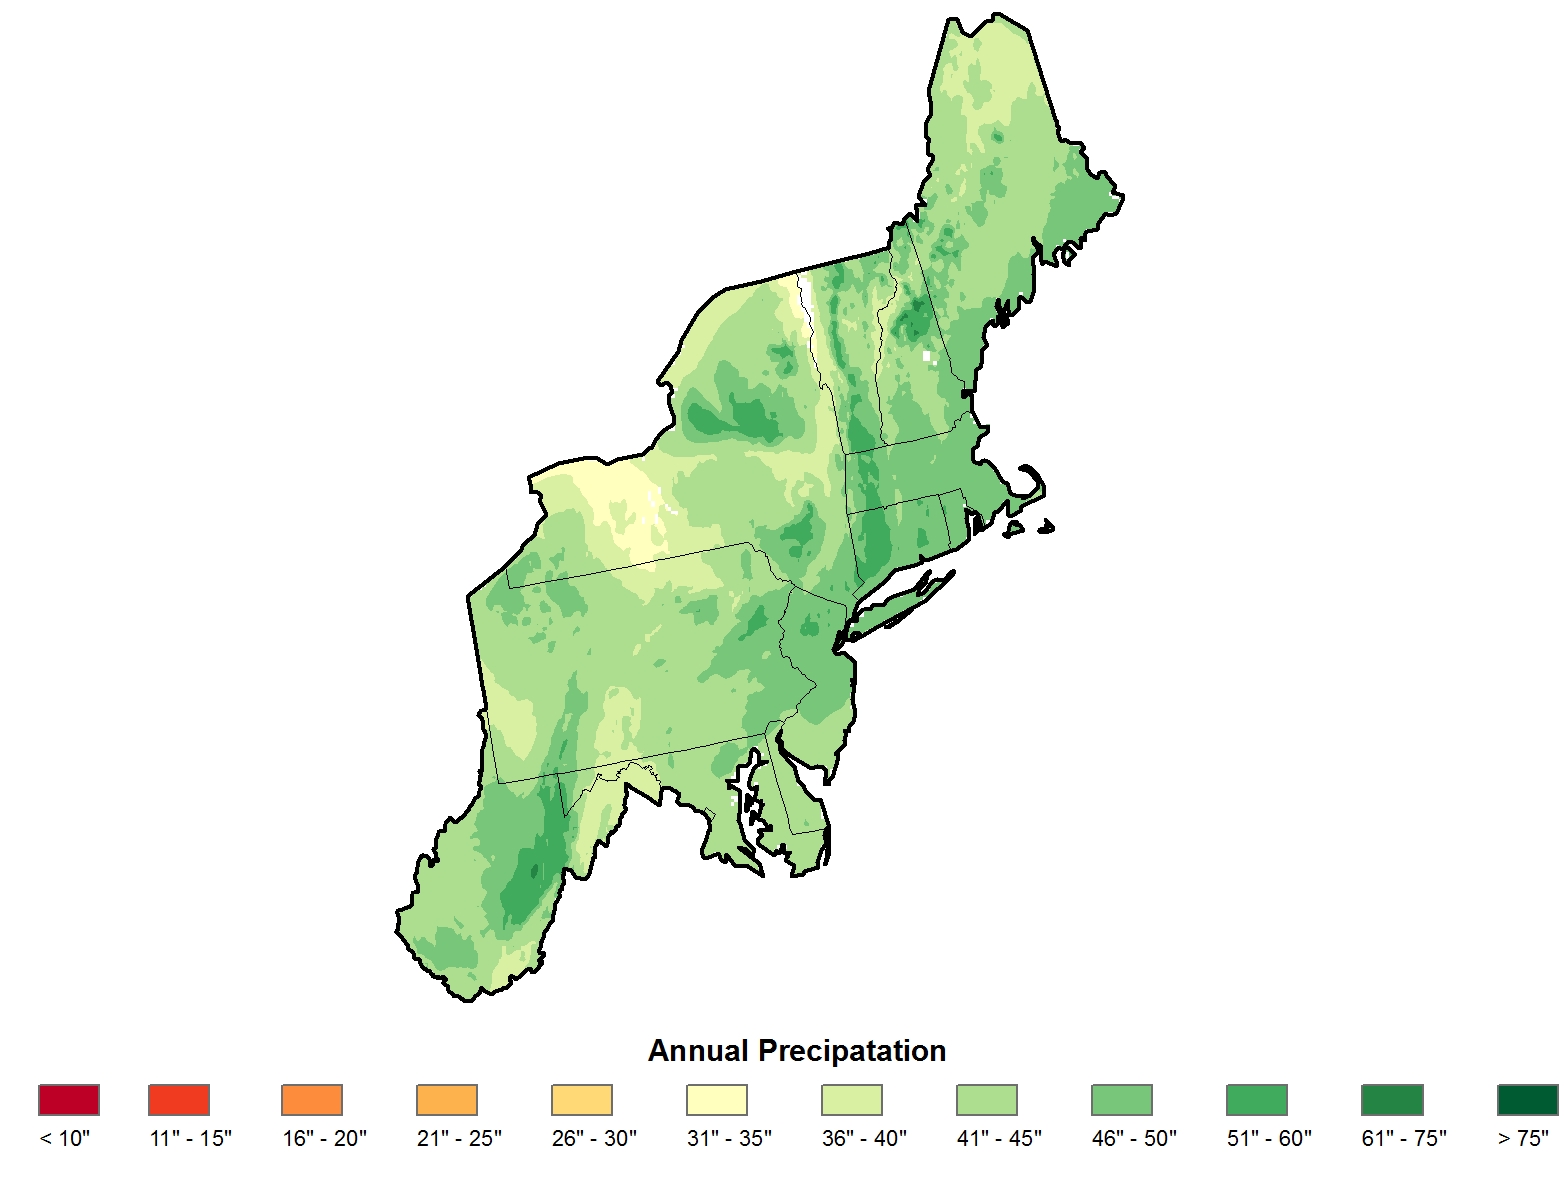
Average annual precipitation |
NCA 3 |
 |
|
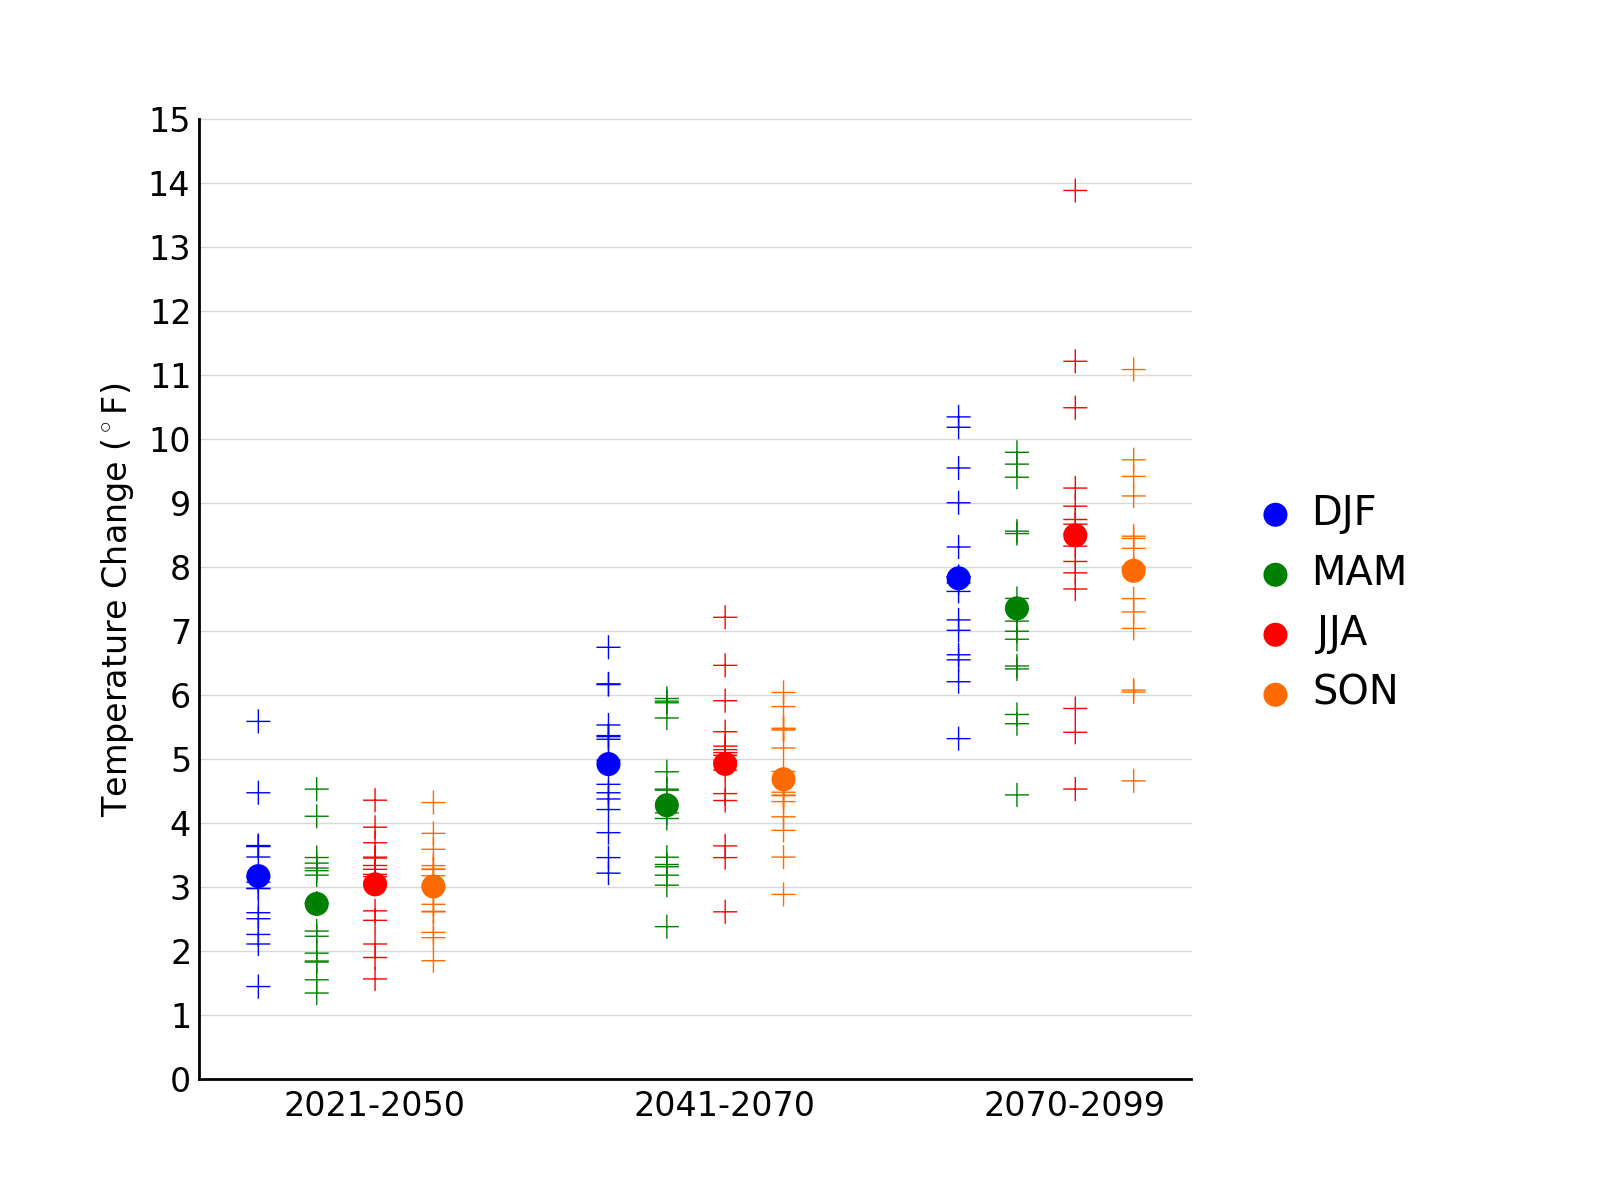
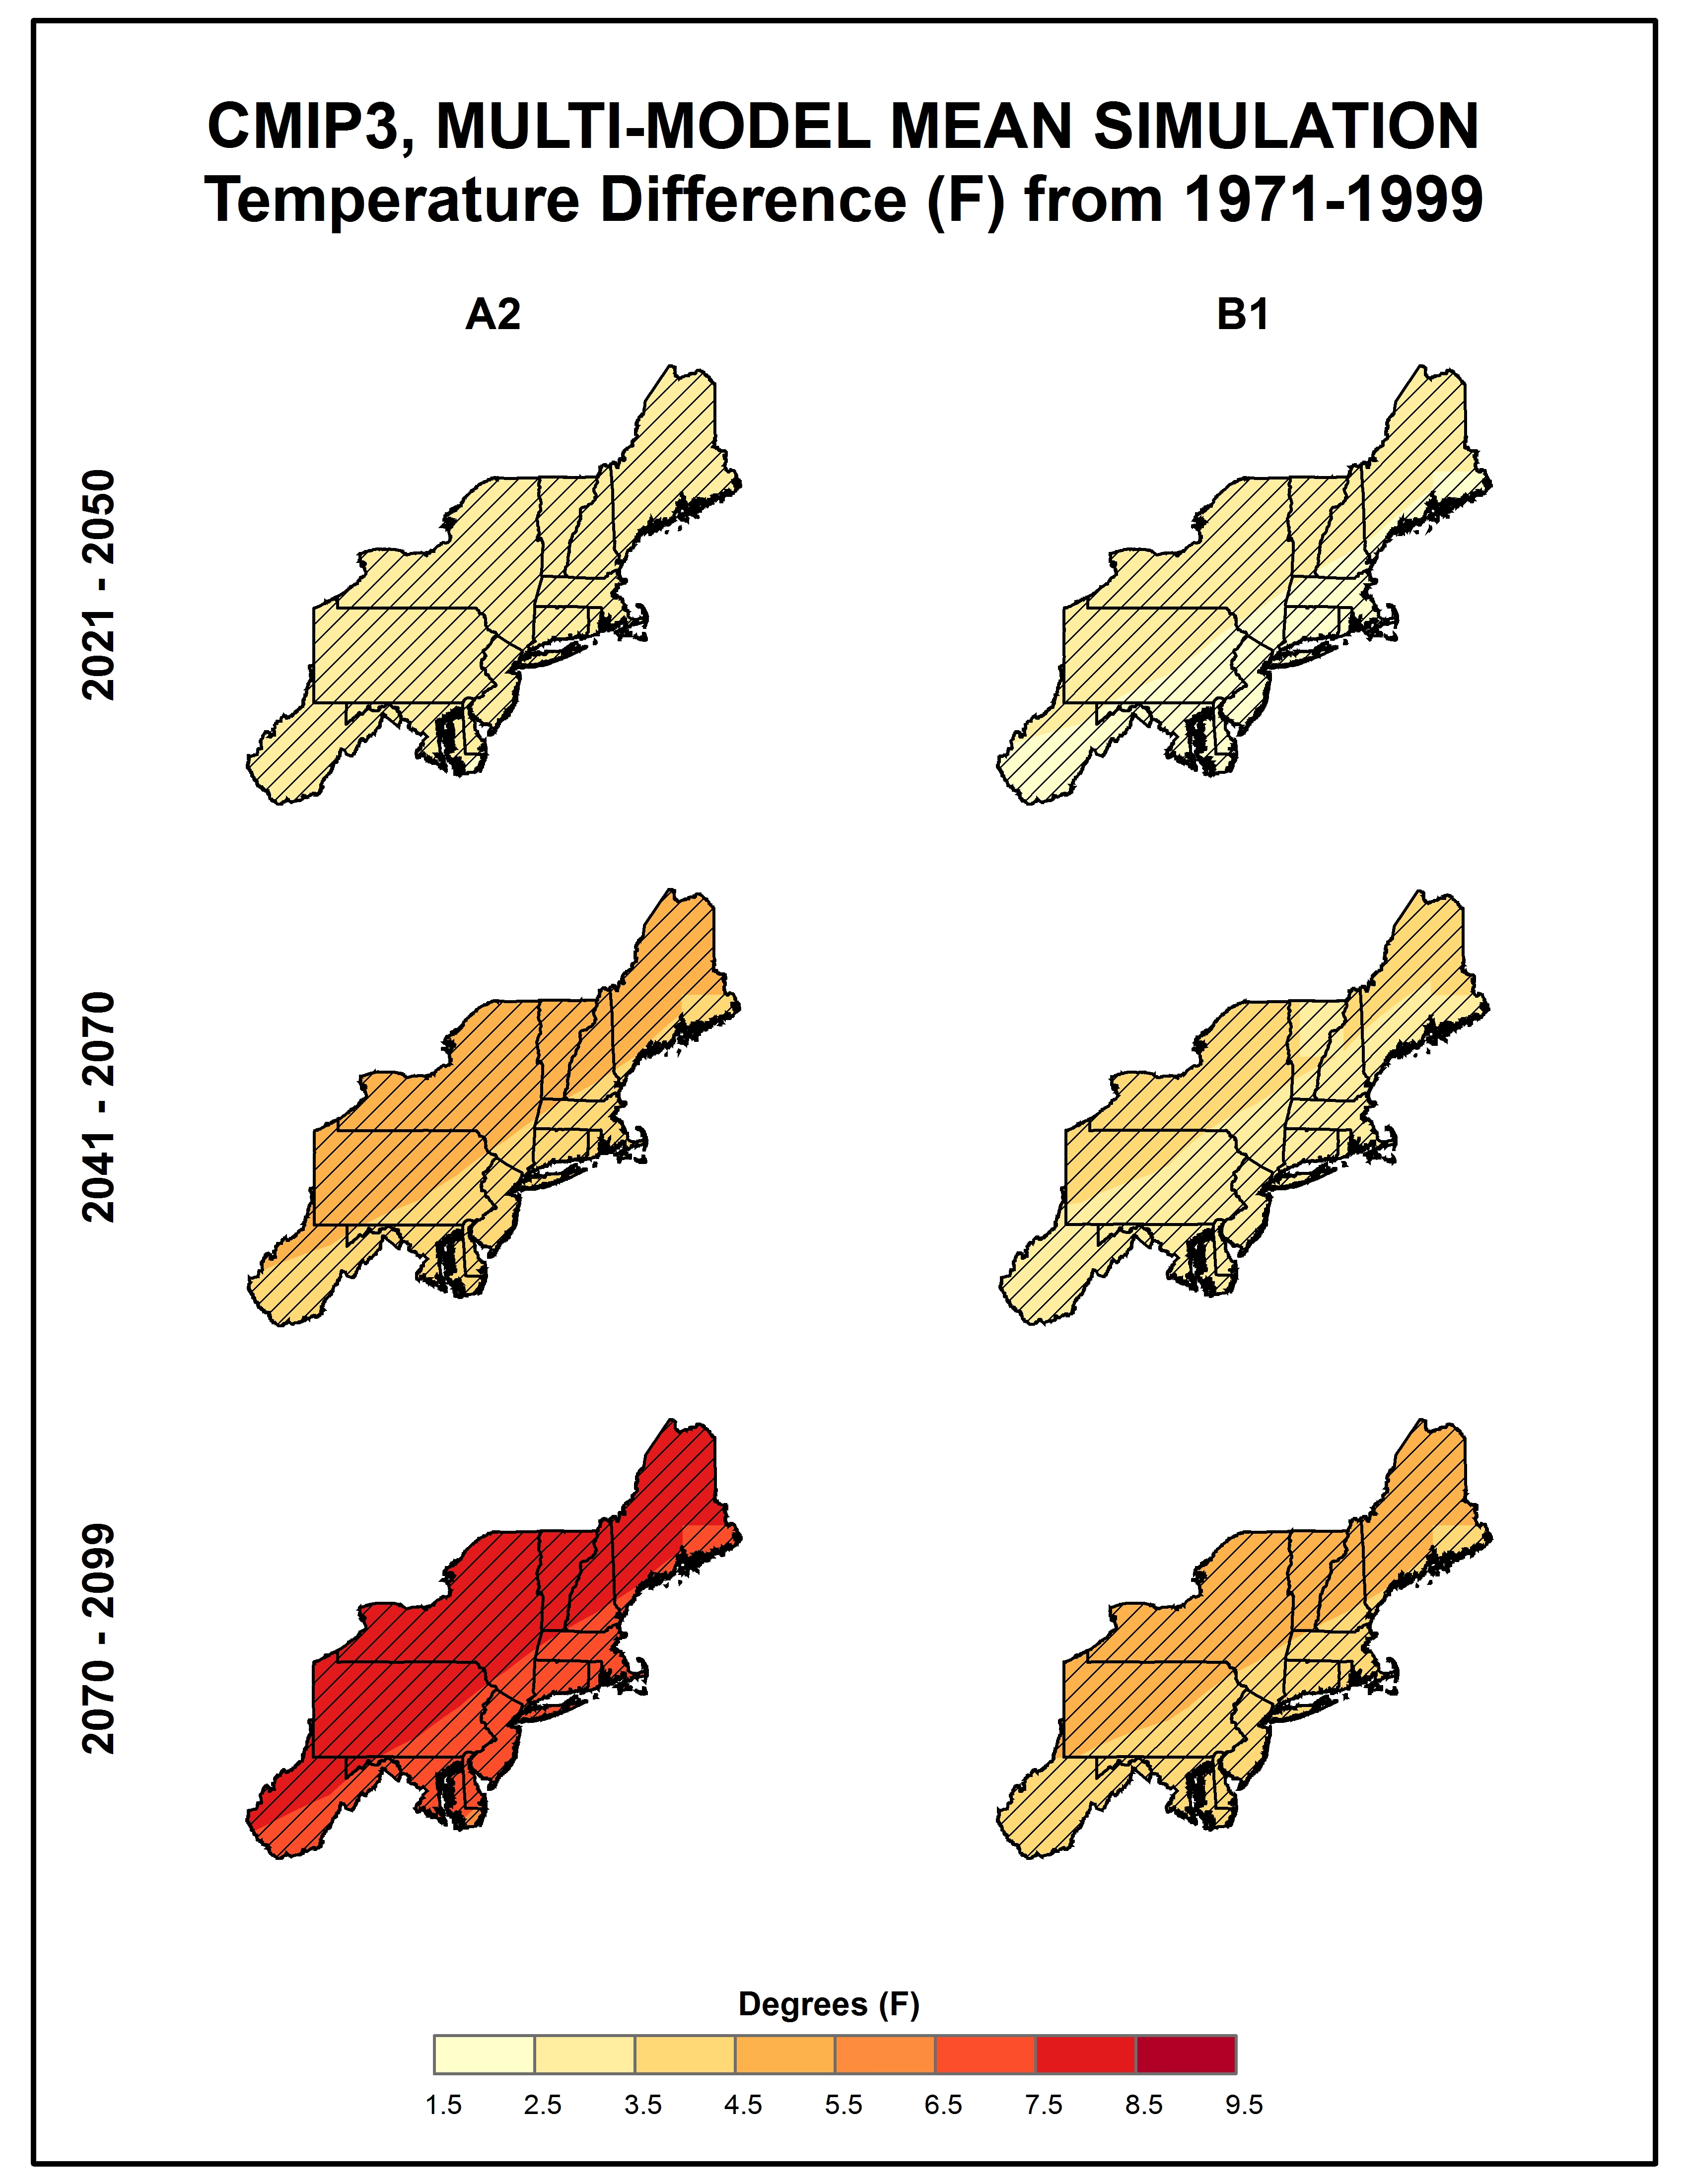
Simulated difference in annual and seasonal mean temperature |
NCA 3 |
 |
|
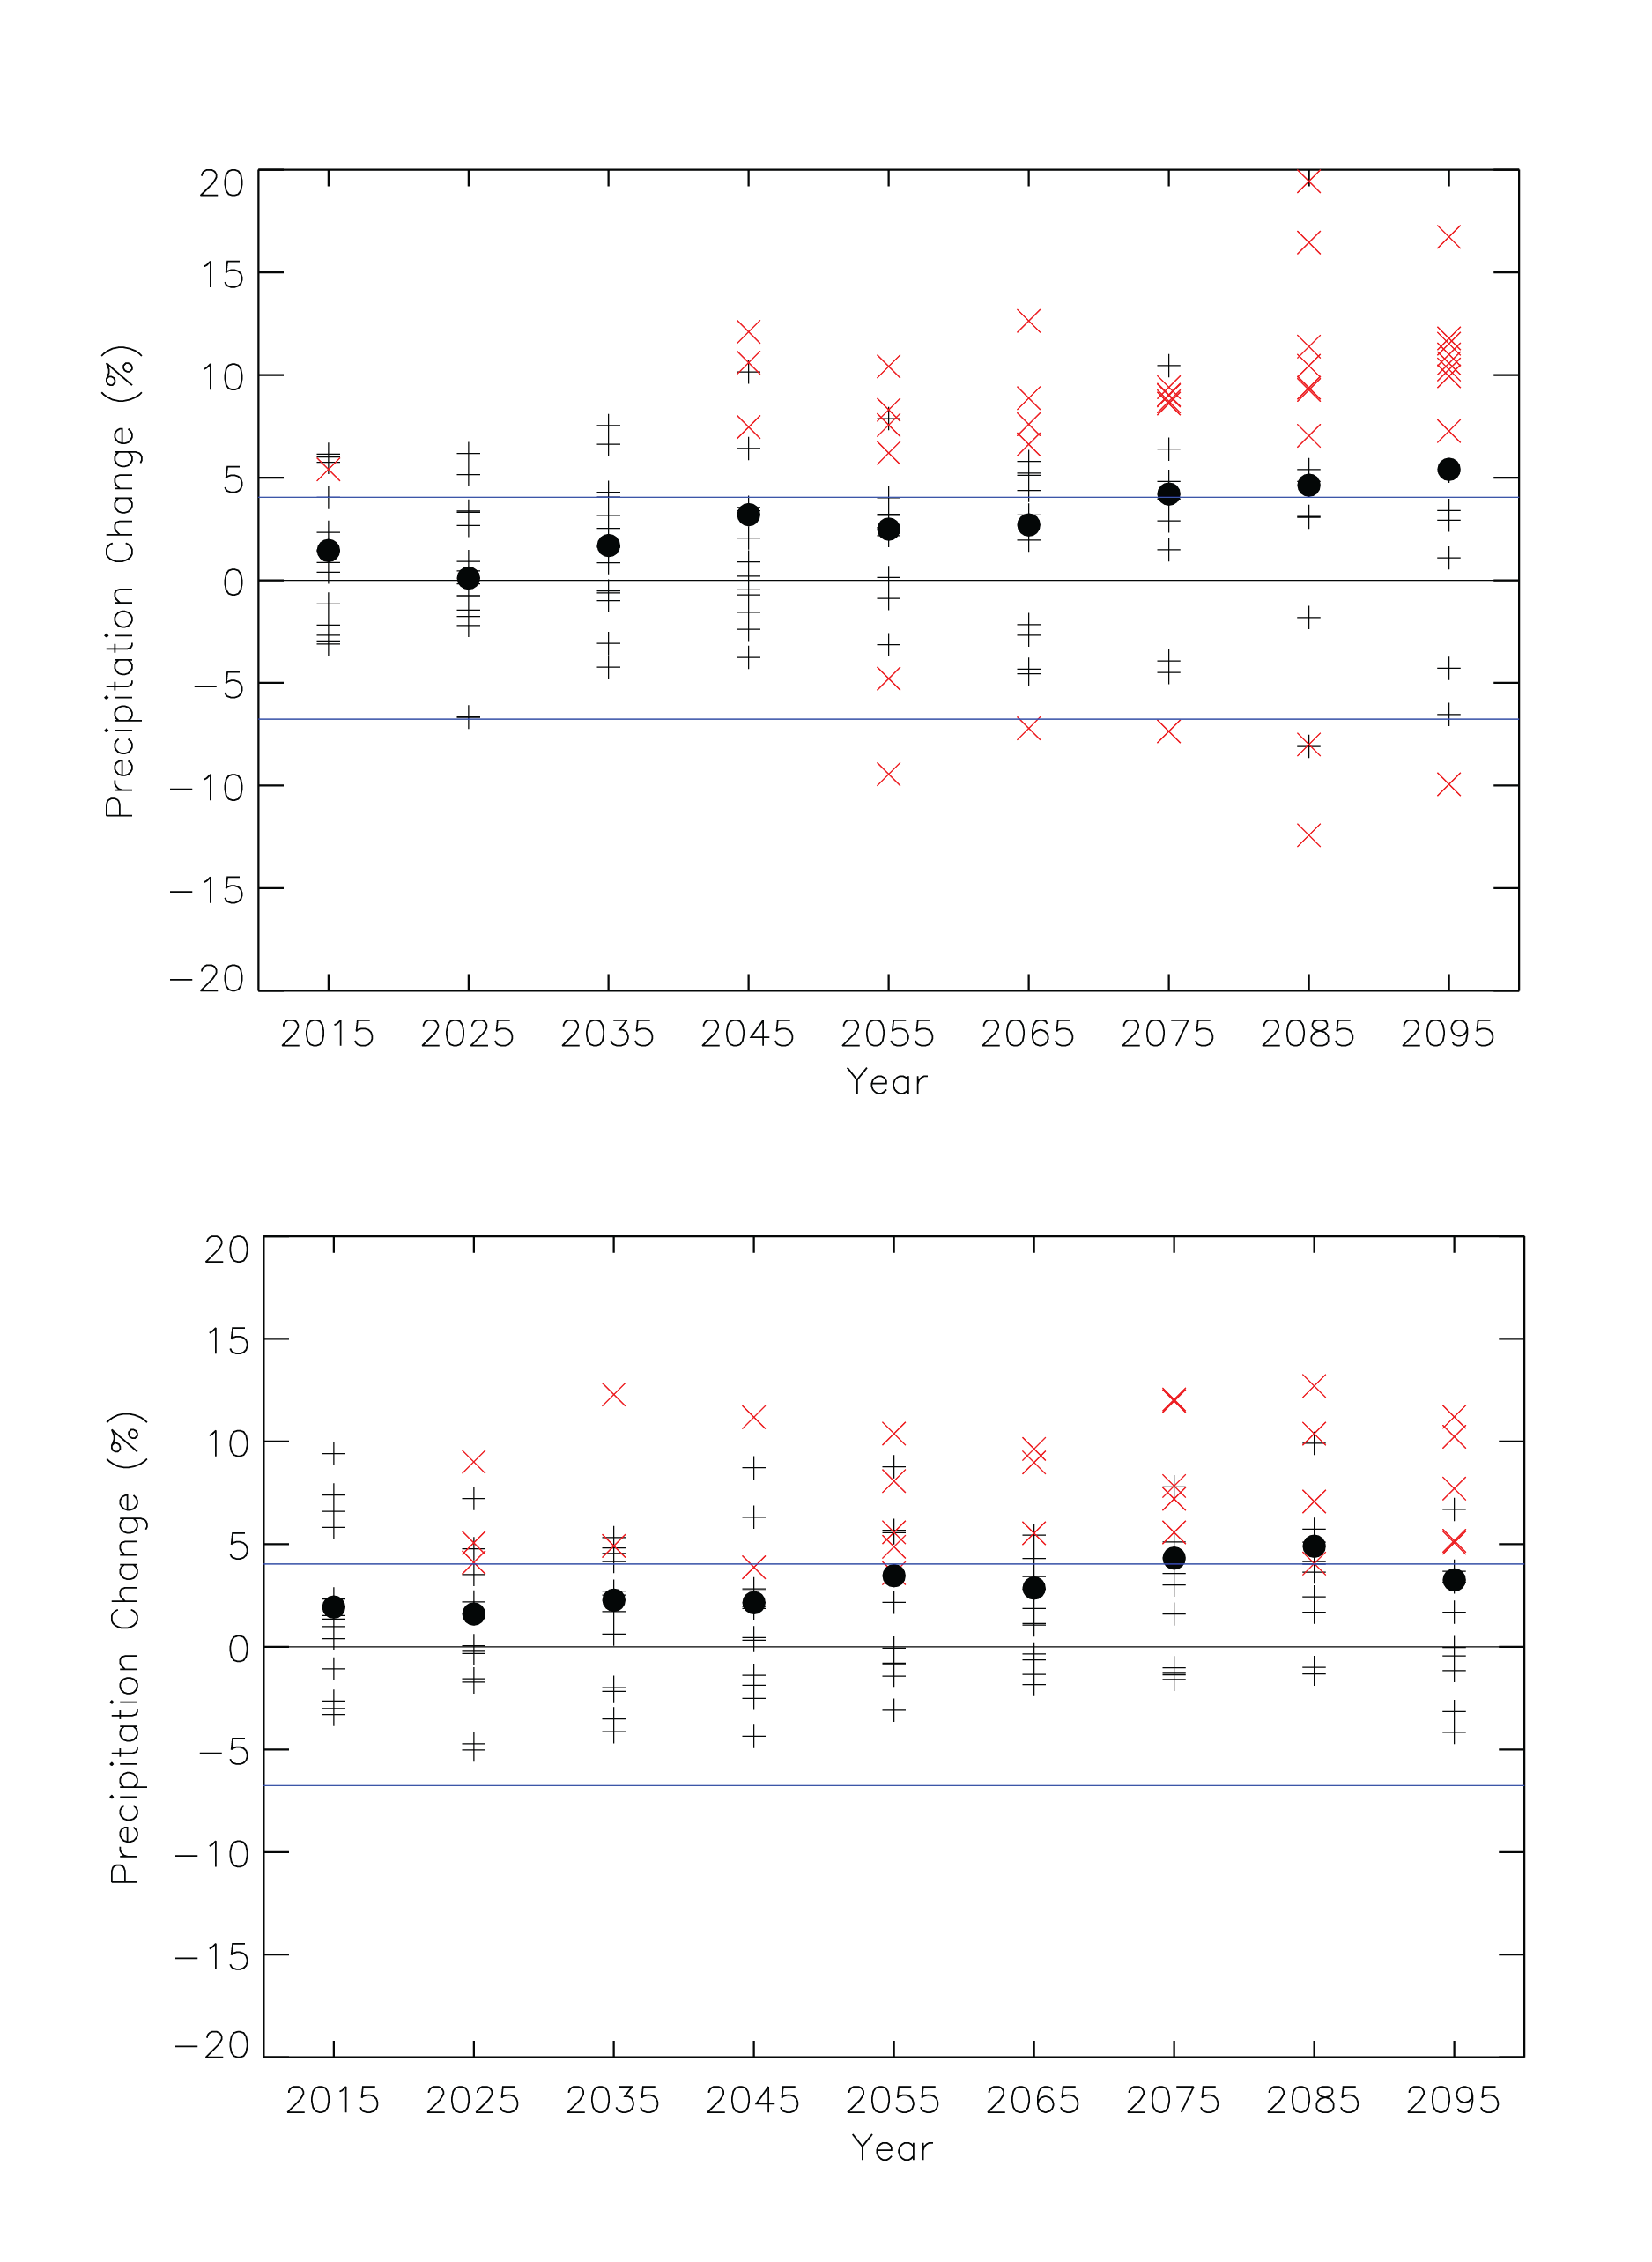
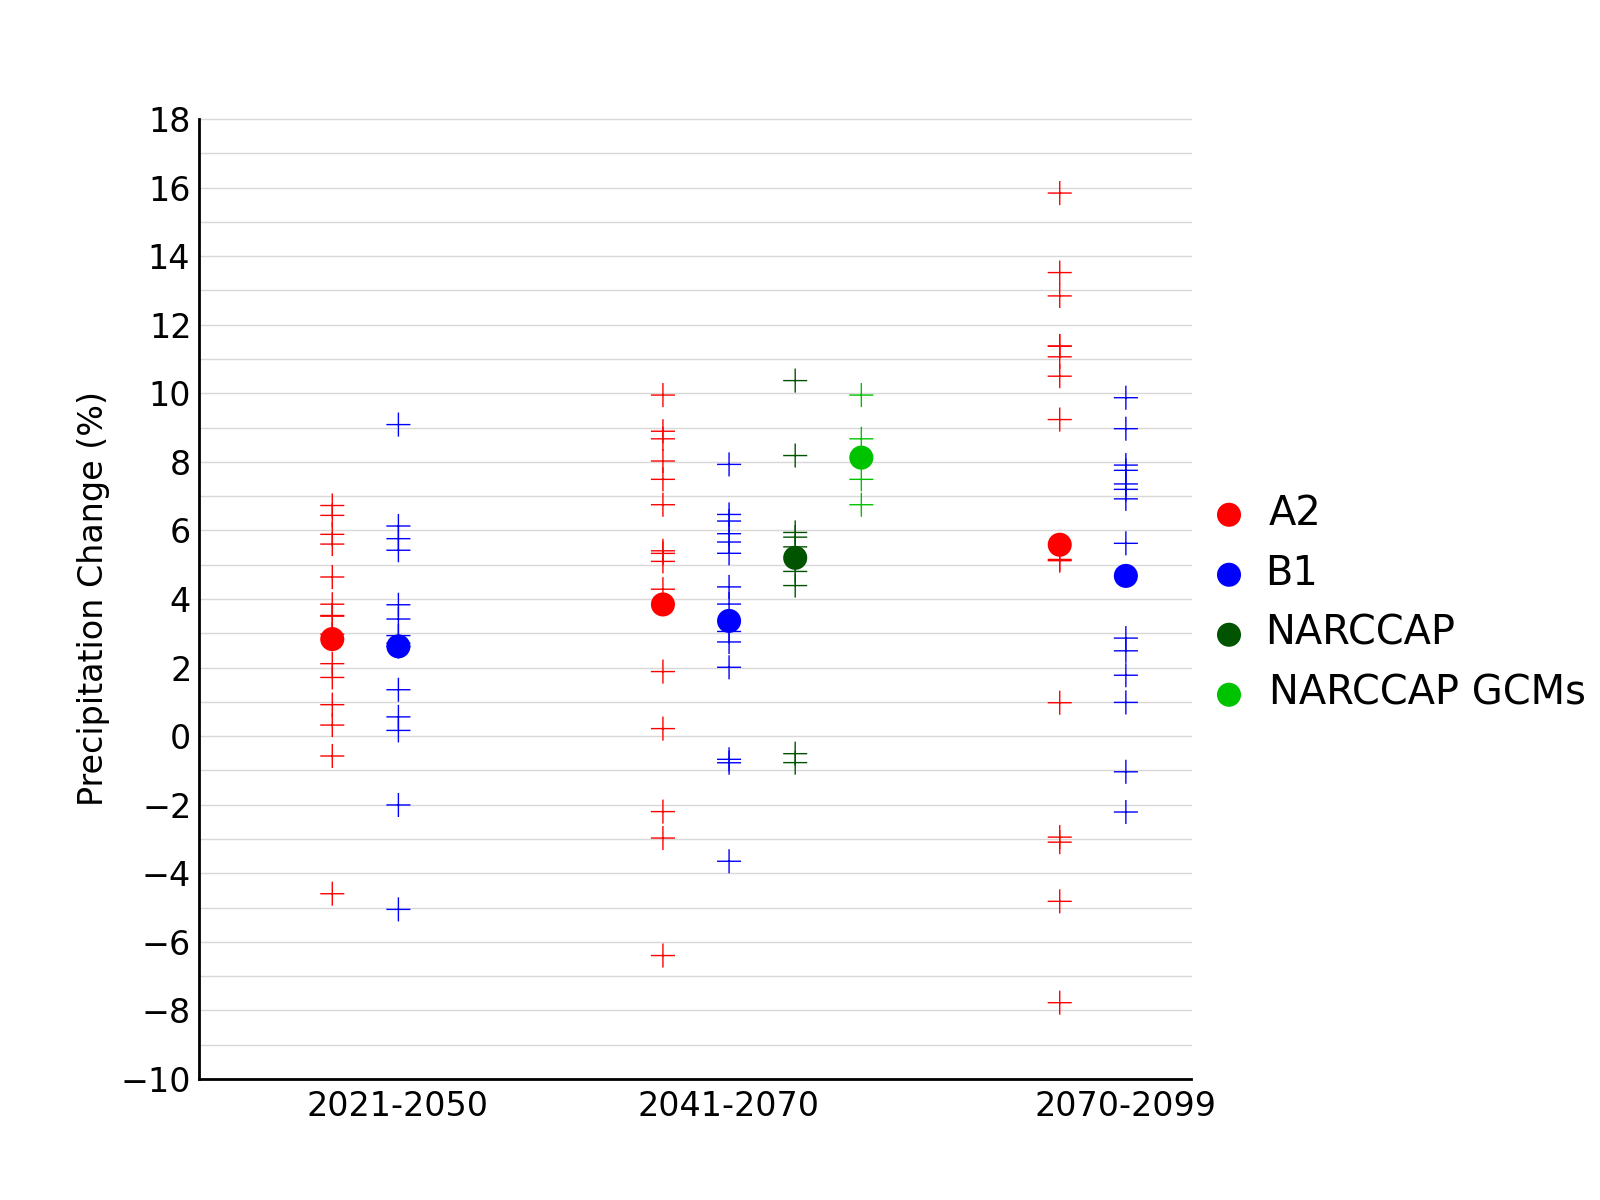
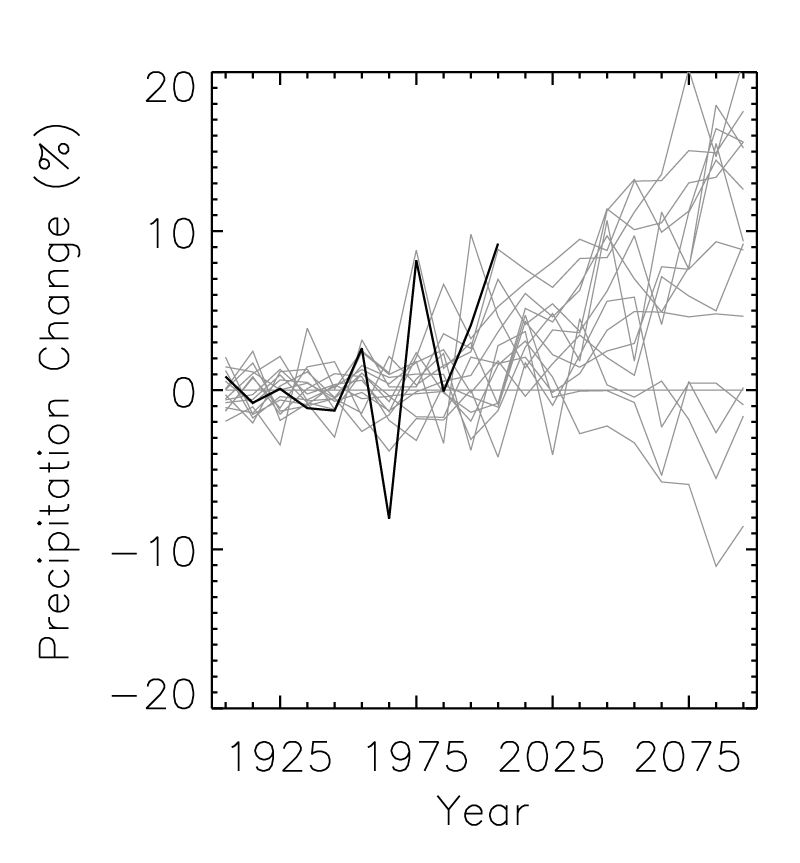
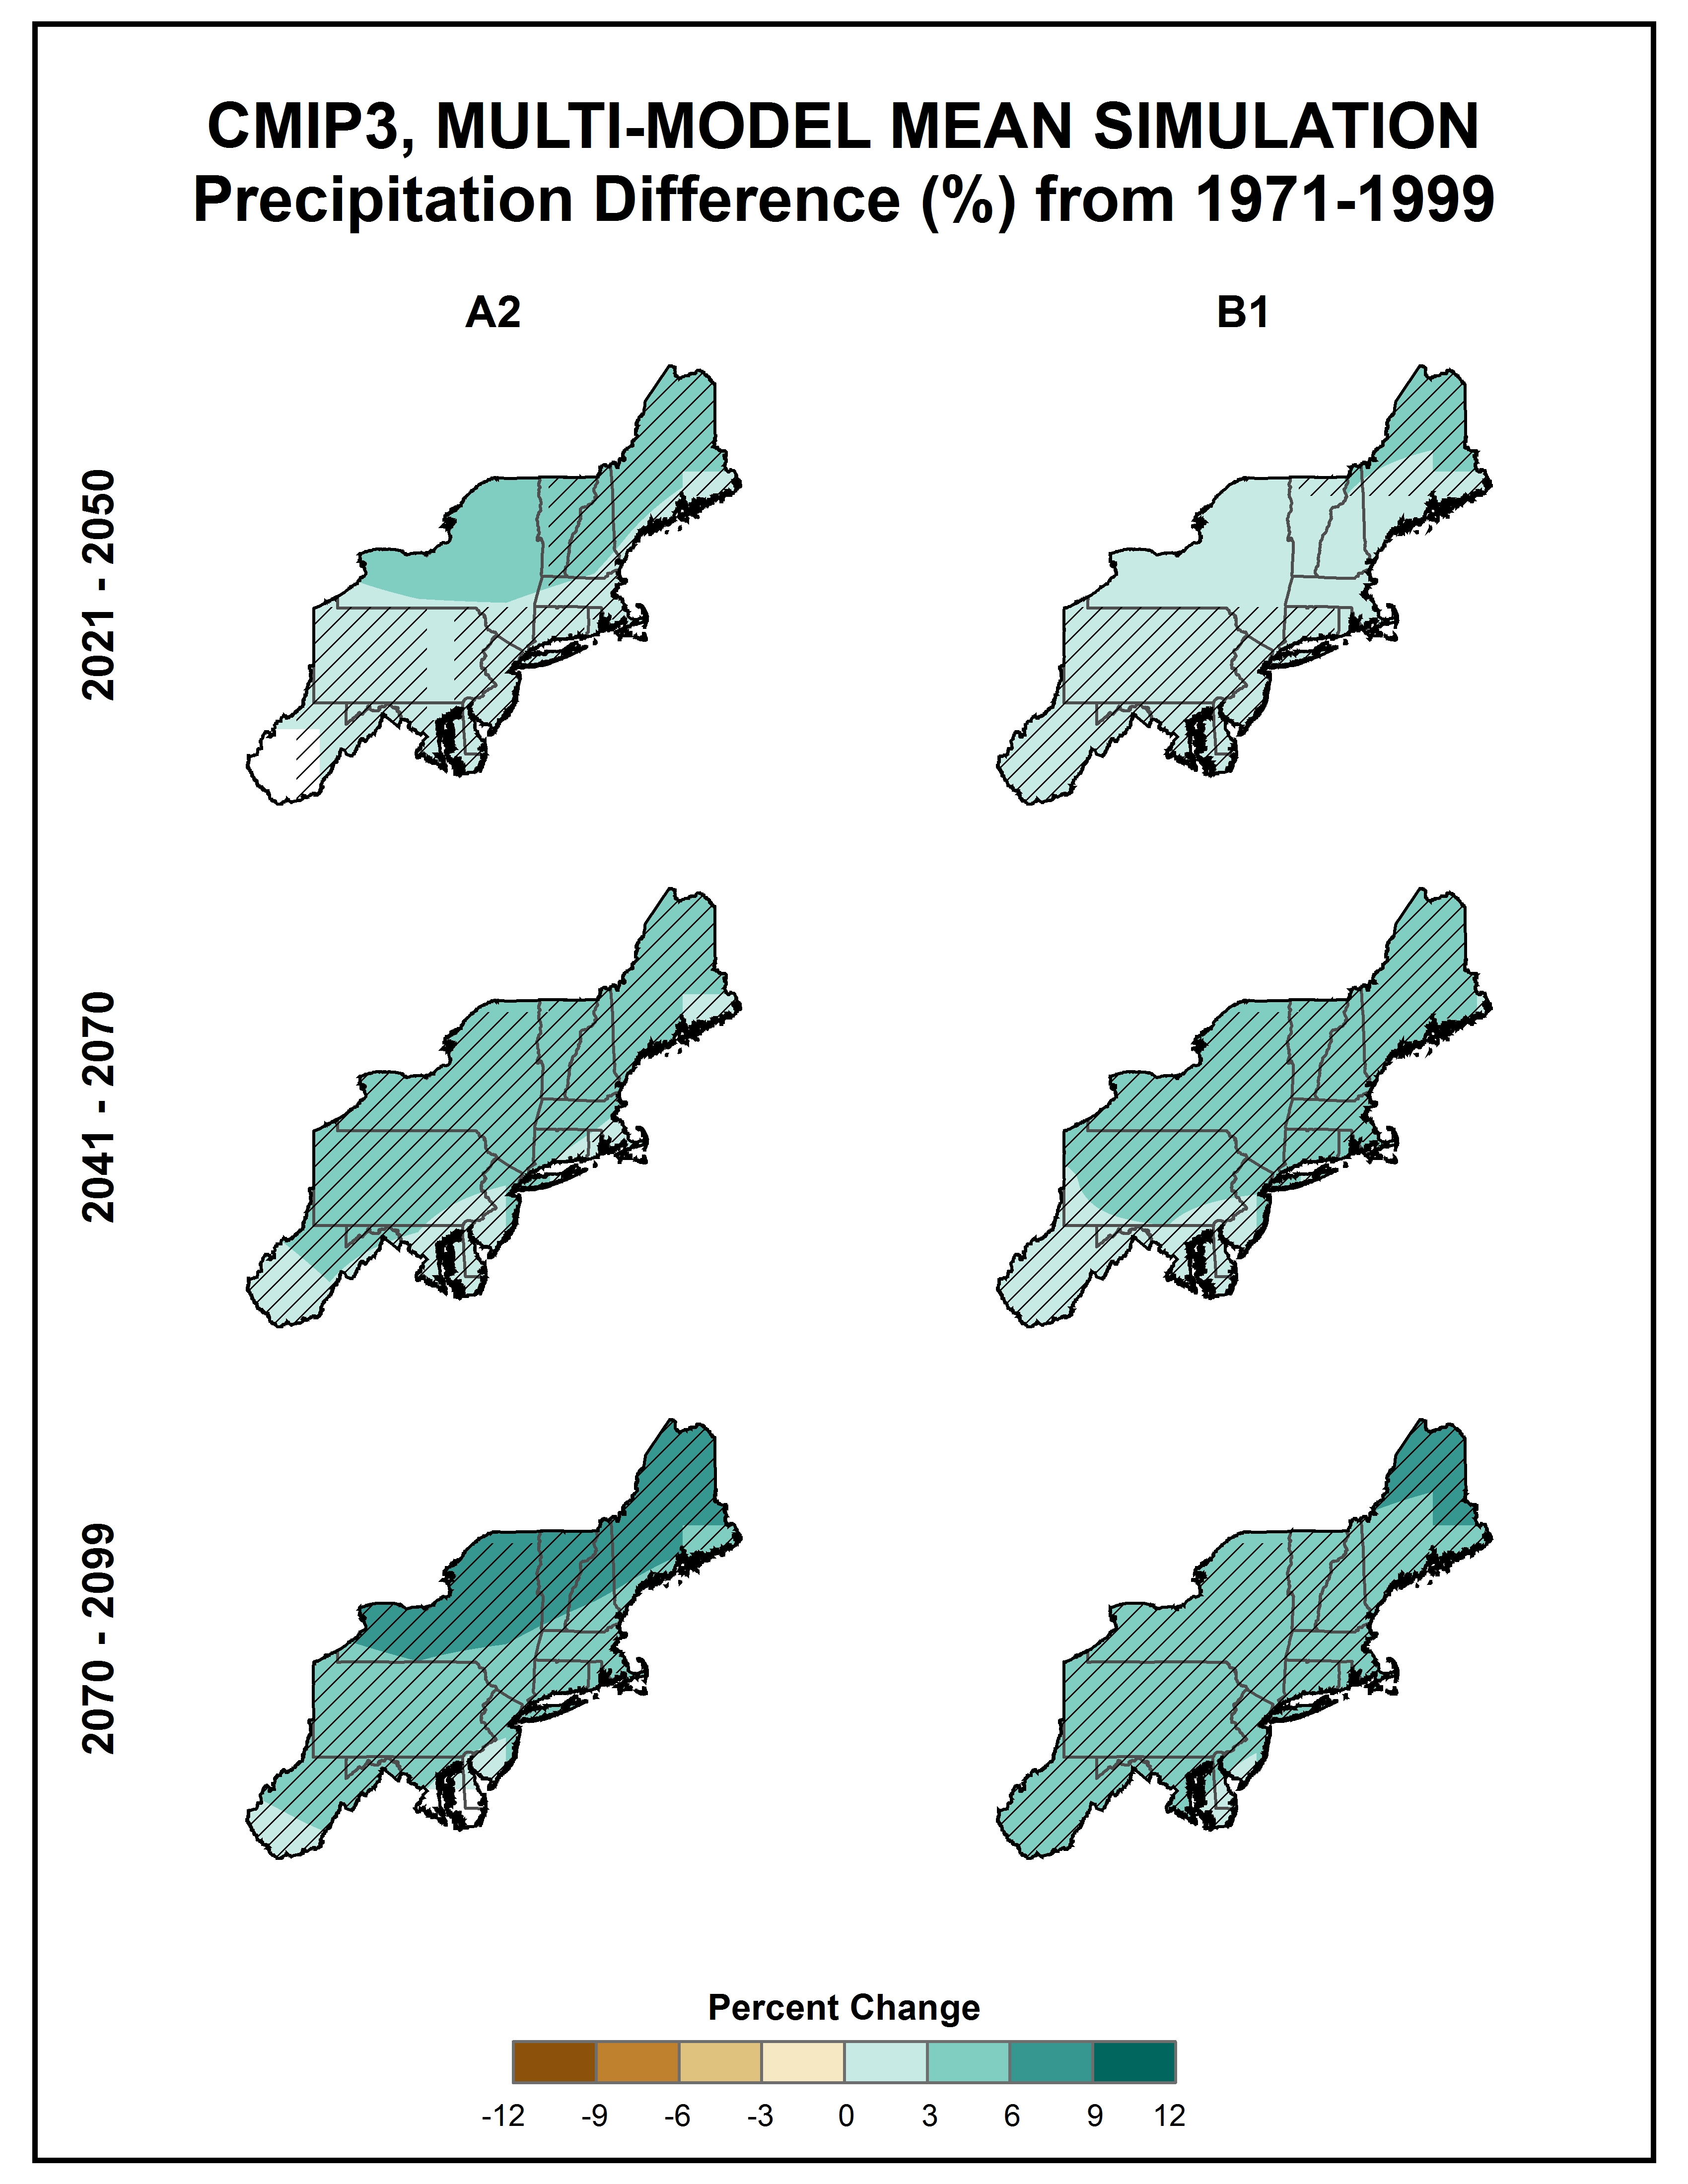
Simulated annual mean precipitation change |
NCA 3 |
 |
|
Time series of freeze-free season anomalies |
NCA 3 |
 |
|
Simulated difference in the mean annual maximum number of consecutive days with a maximum temperature greater than 95F |
NCA 3 |
 |
|
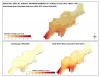
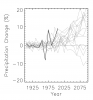
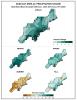
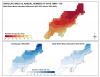
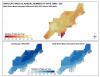
Observed decadal mean annual precipitation change |
NCA 3 |
 |
|
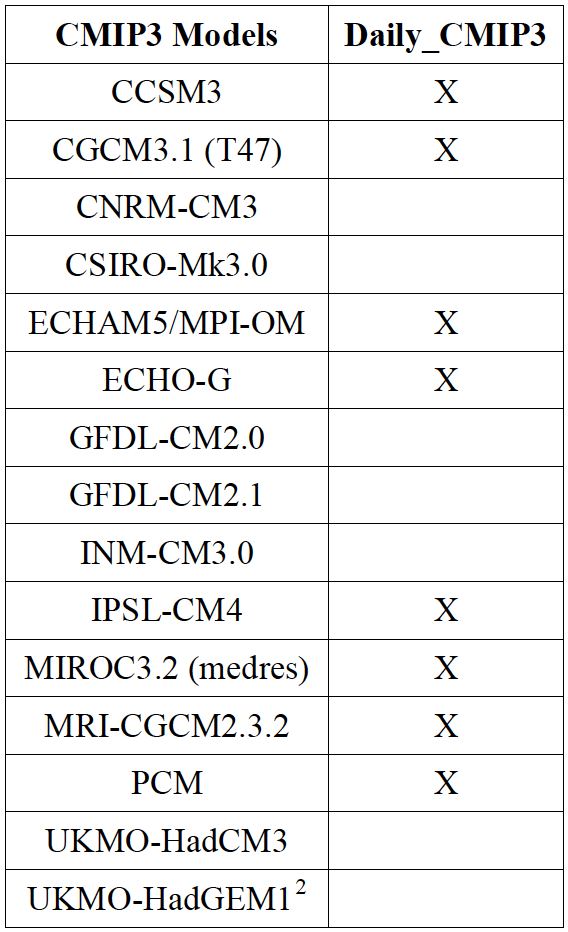
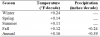
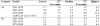
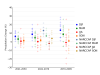
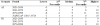
NARCCAP Models Listing |
NCA 3 |
 |
|
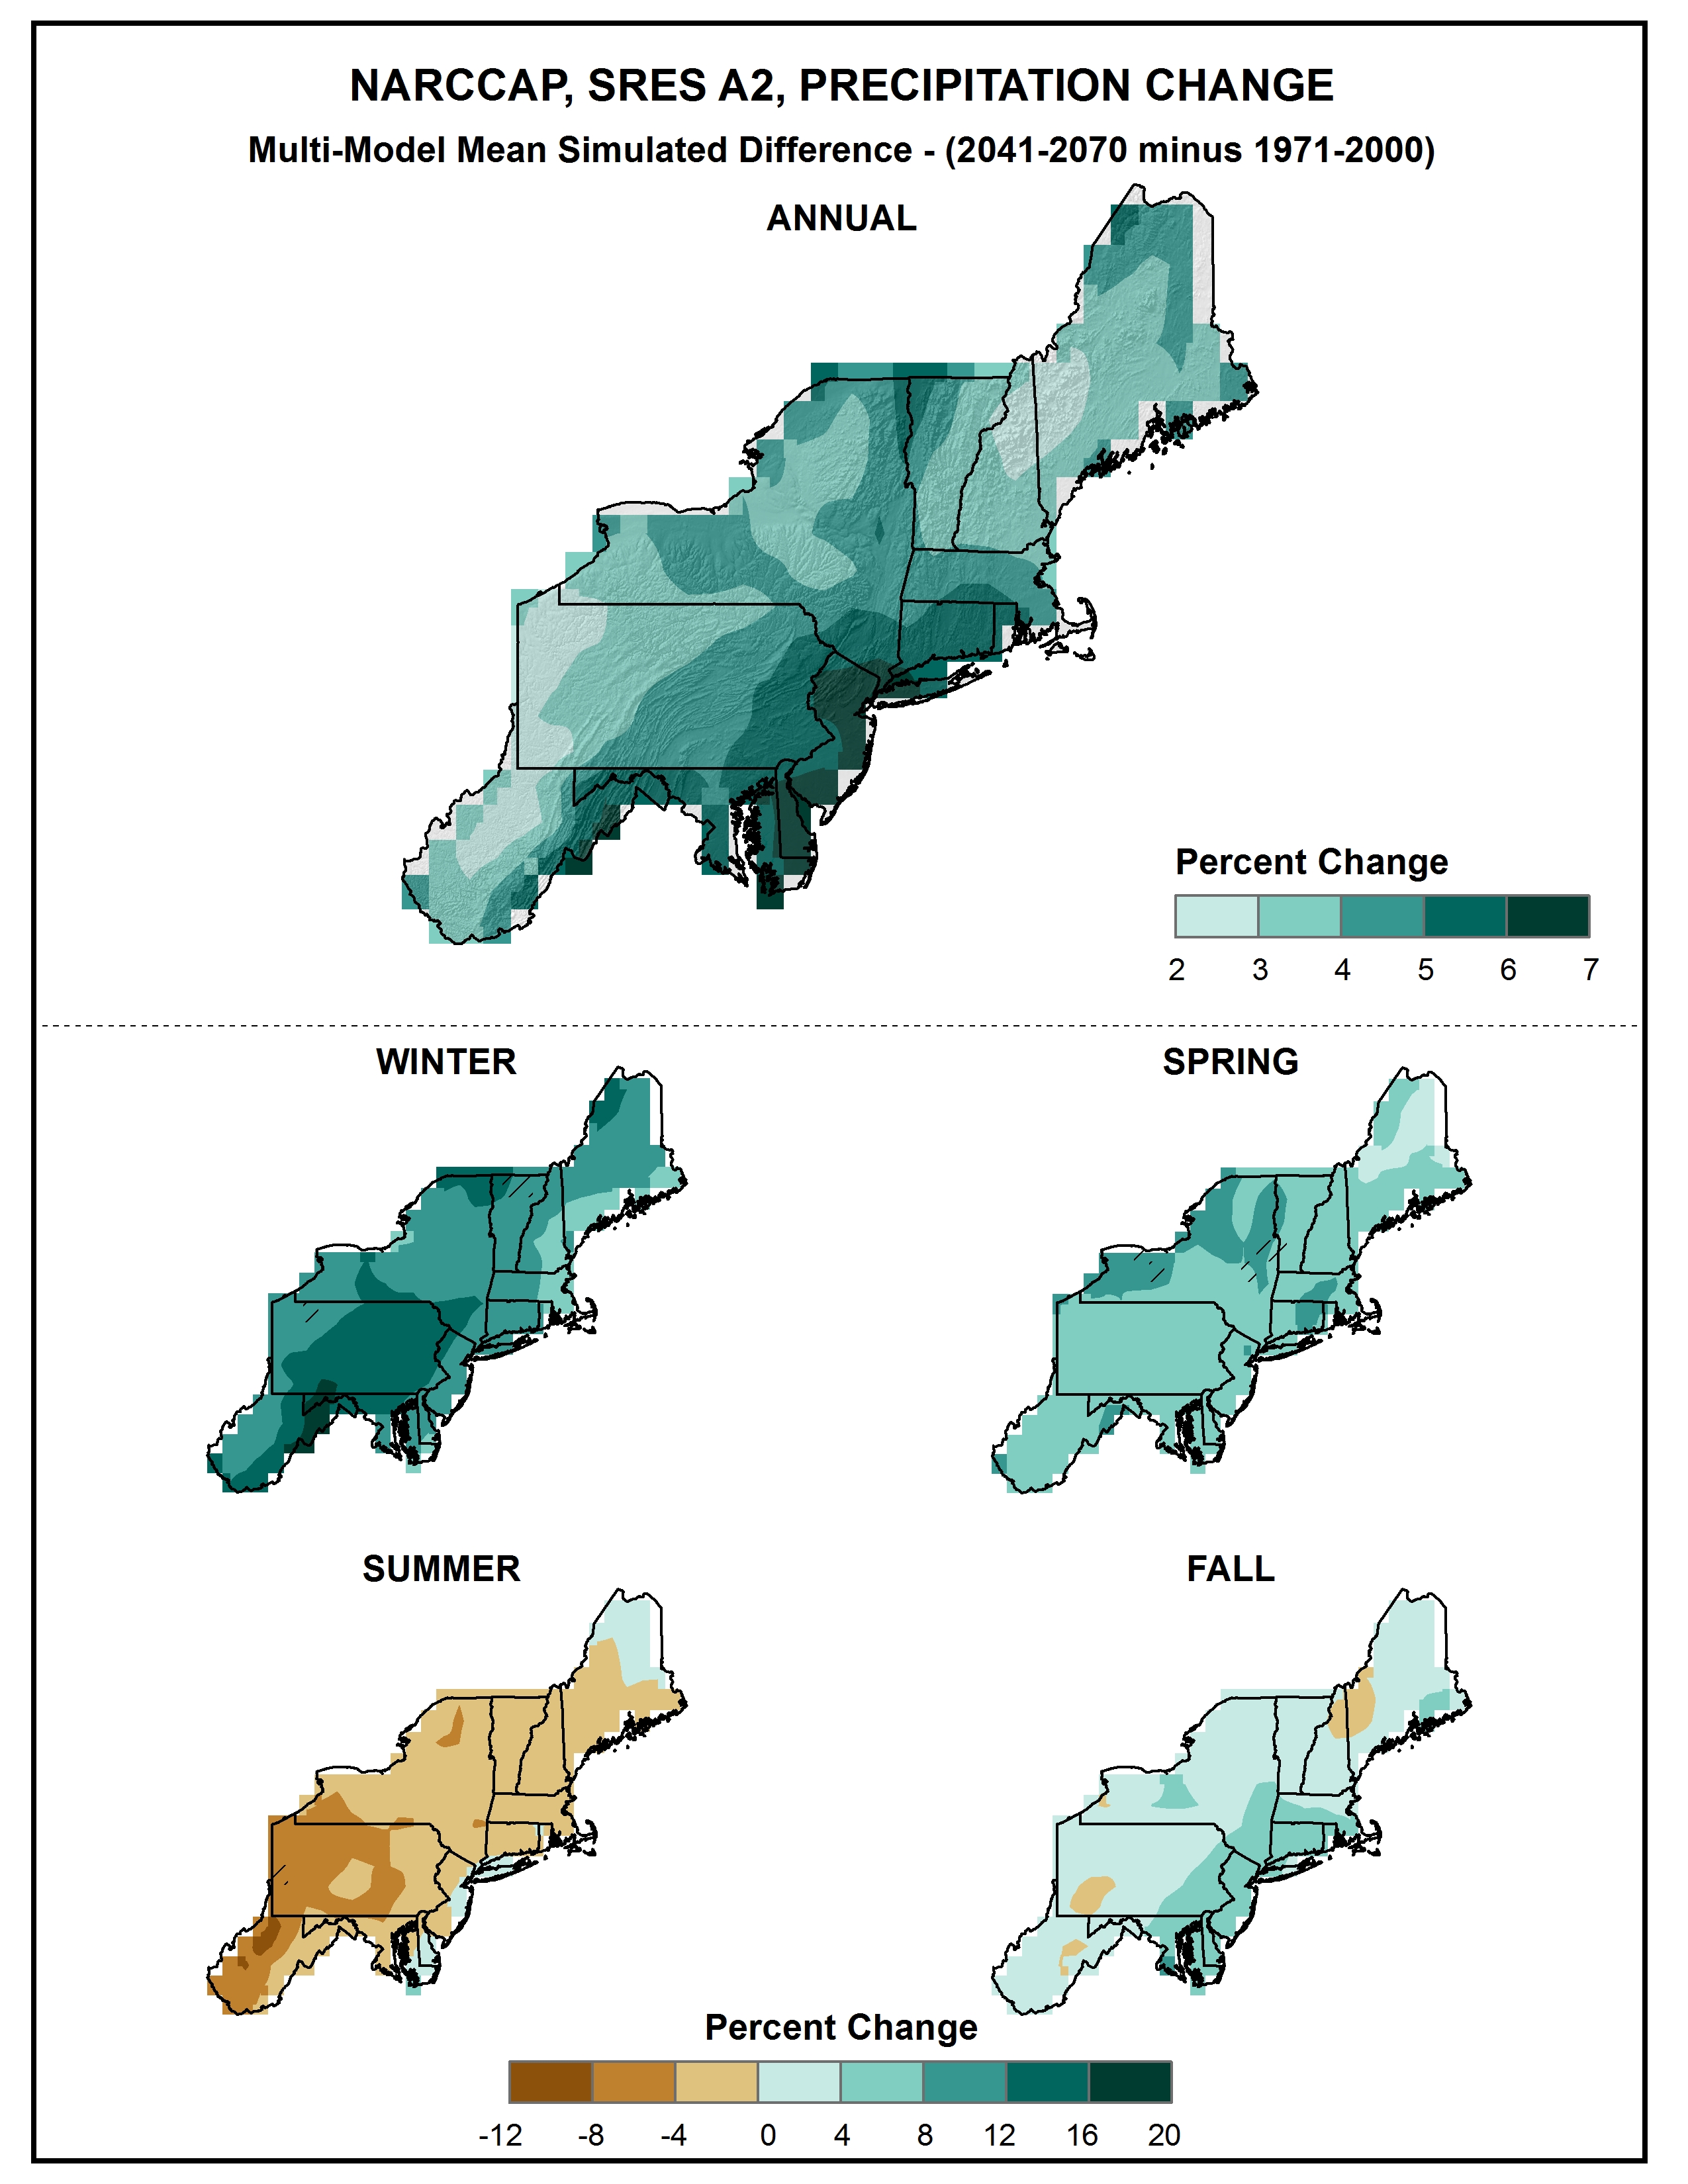
Simulated difference in annual and seasonal mean precipitation |
NCA 3 |
 |
|
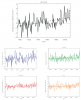
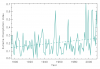
Time series of an index for the occurrence of heat waves and cold waves |
NCA 3 |
 |
|
Simulated difference in the mean annual number of days with a minimum temperature less than 10F |
NCA 3 |
 |
|
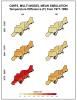
Observed decadal mean annual temperature change |
NCA 3 |
 |
|
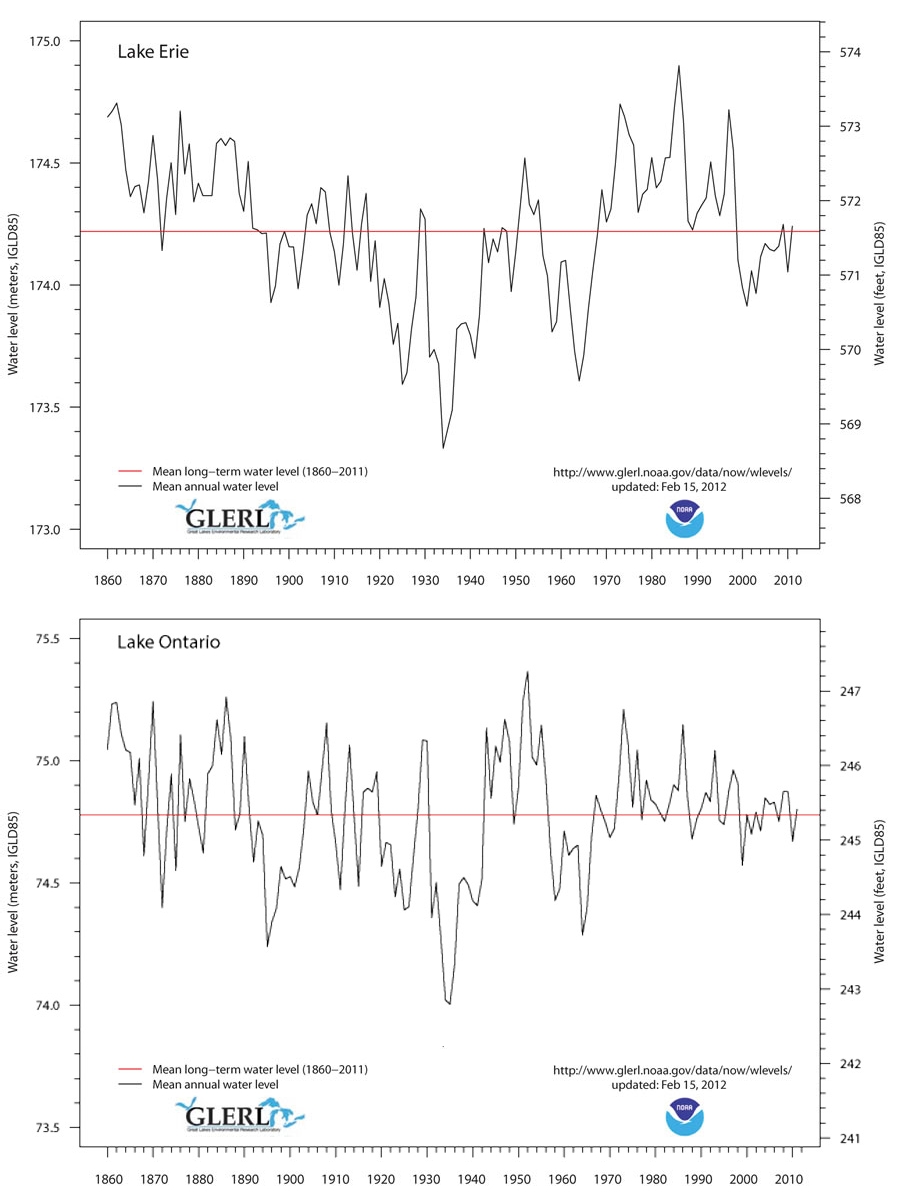
Time series of water levels in Lake Erie and Lake Ontario |
NCA 3 |
 |
|
Simulated difference in mean annual precipitation |
NCA 3 |
 |
|
Annual and seasonal temperature anomaly |
NCA 3 |
 |
|
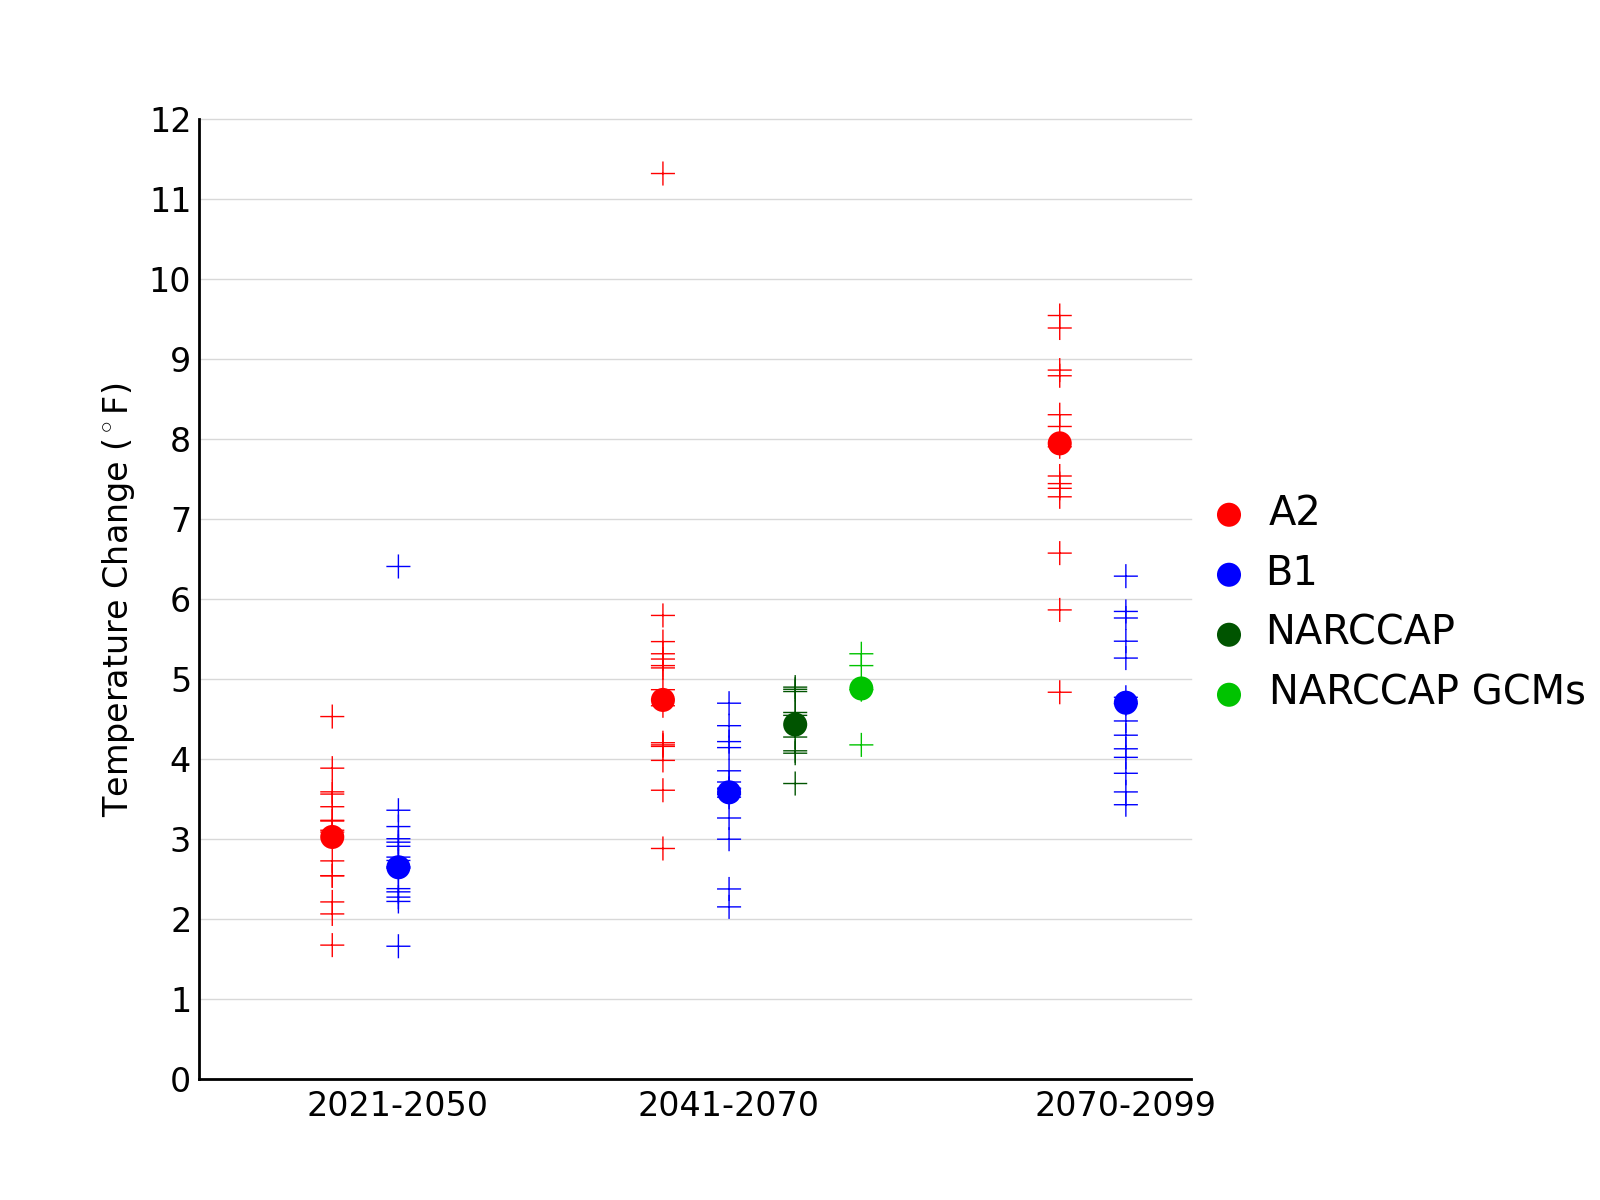
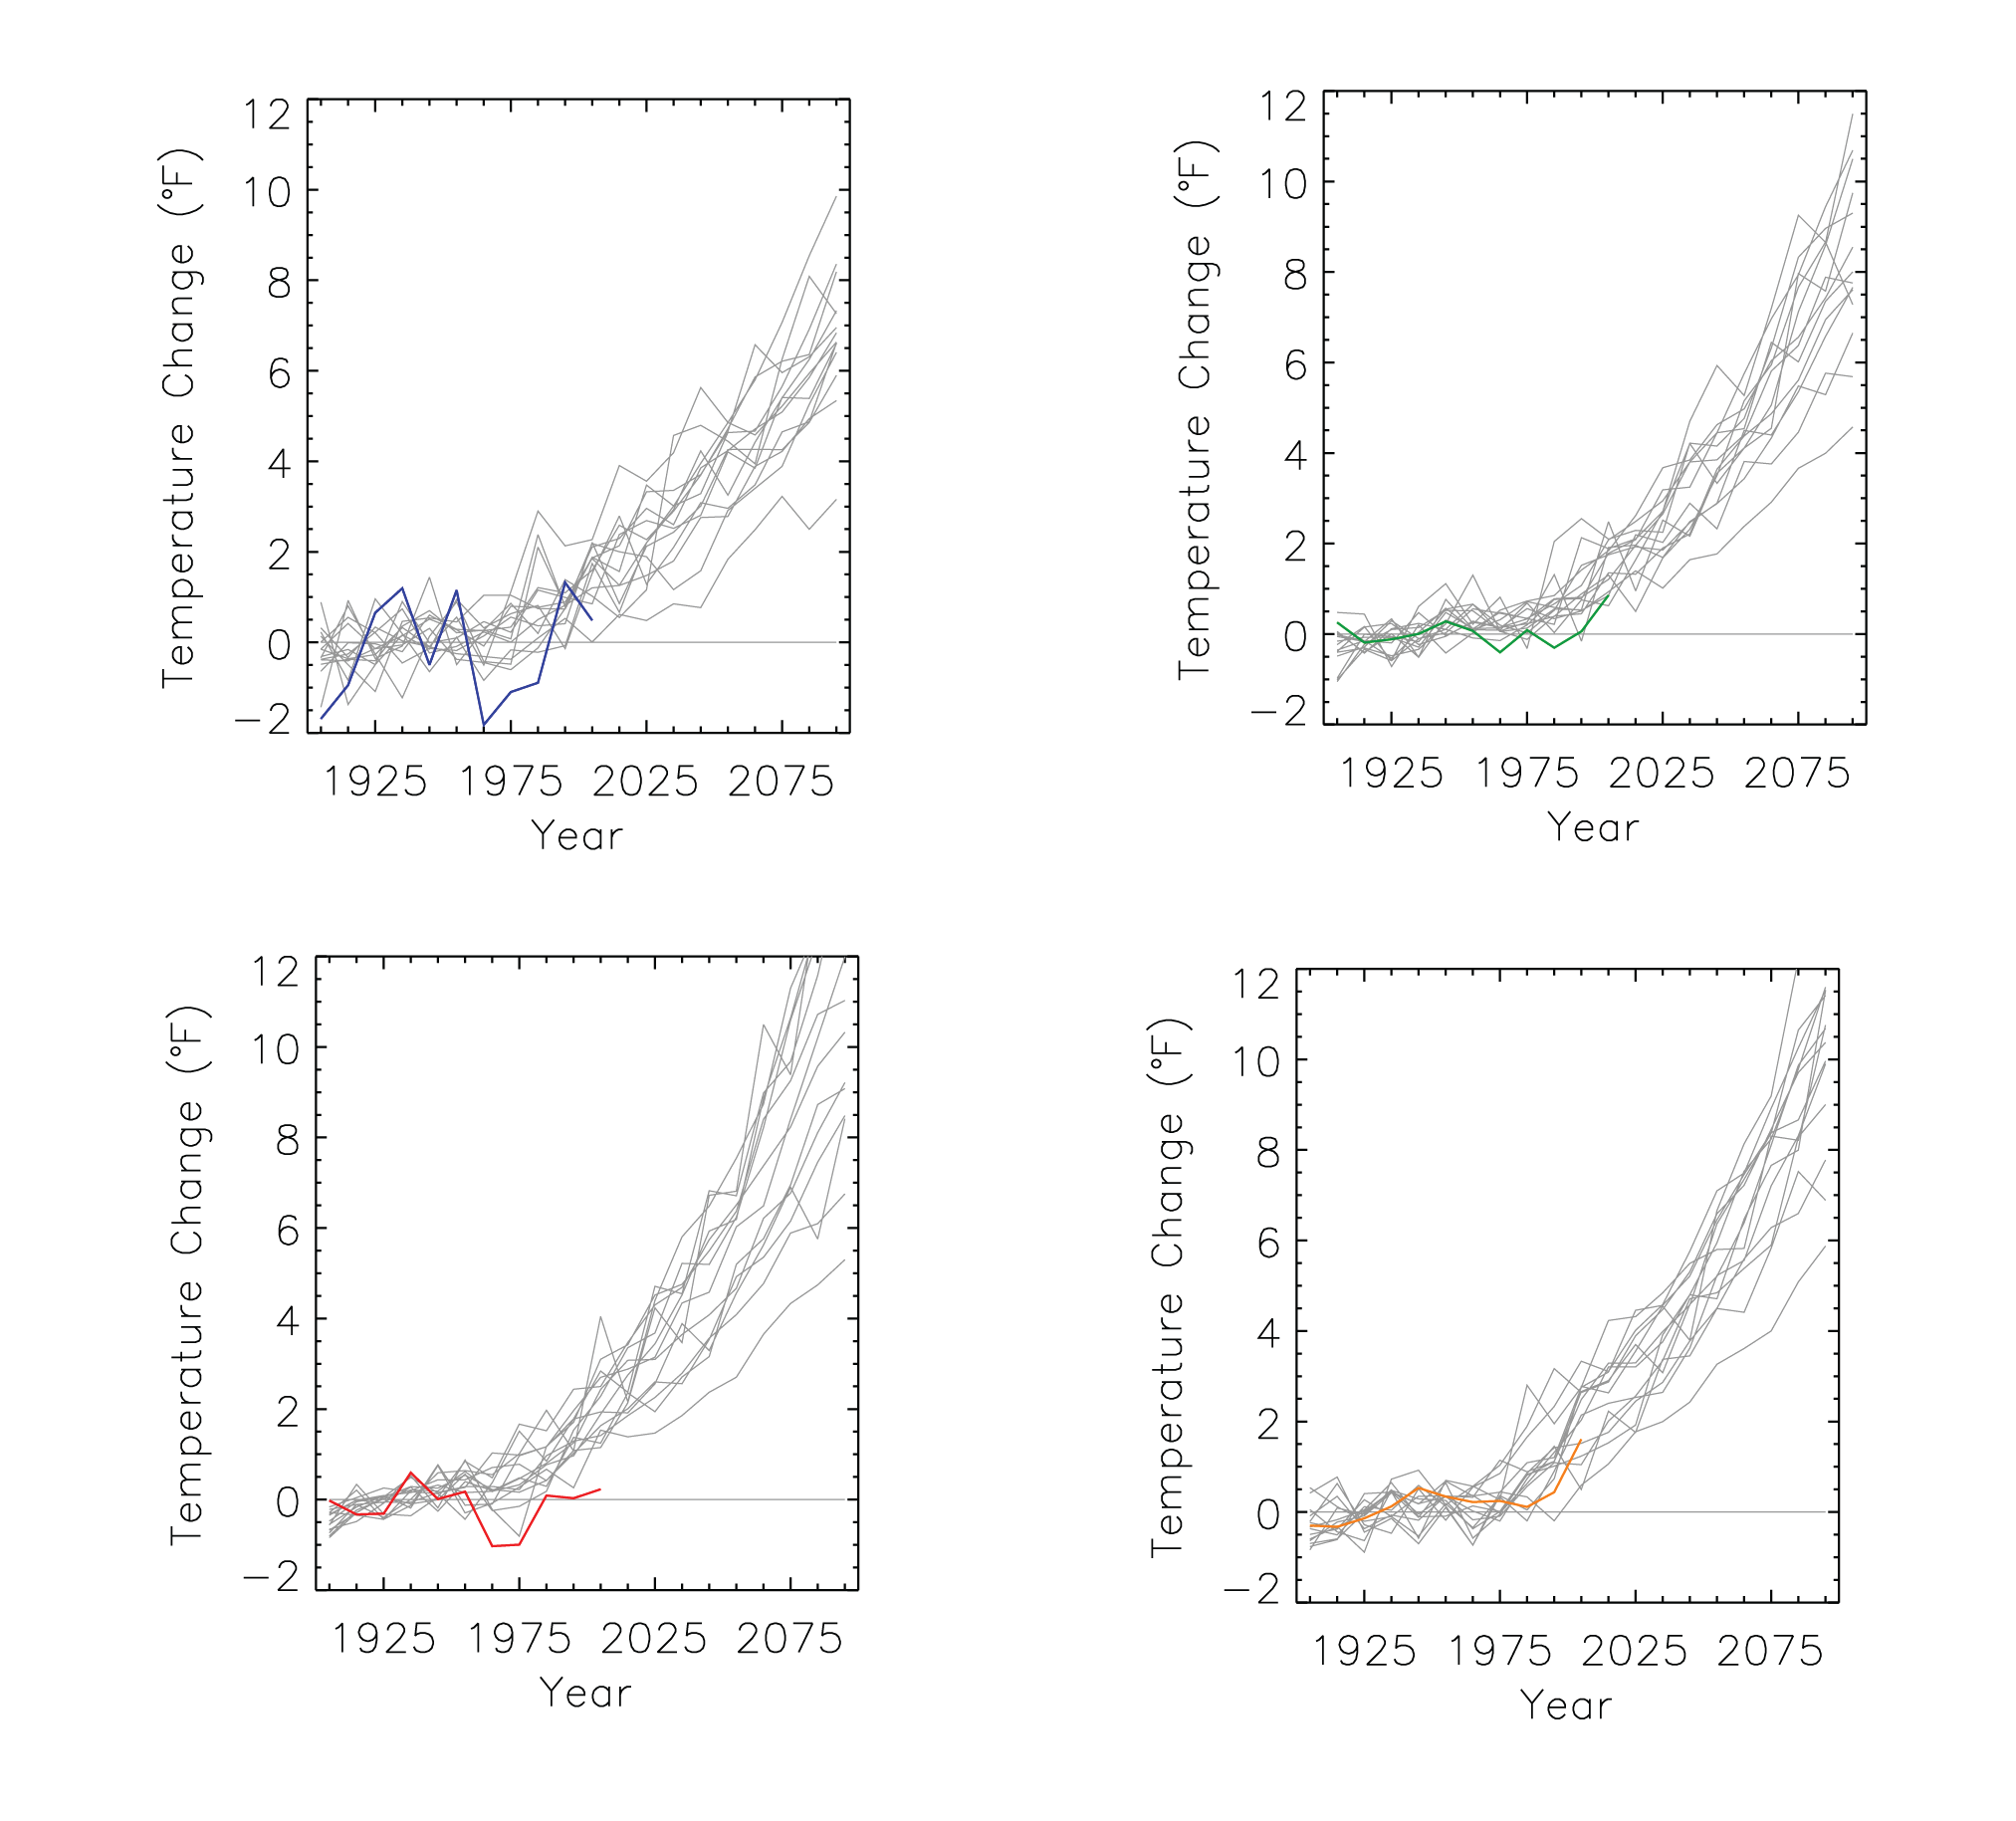
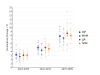
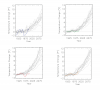
Distribution of the simulated change in annual mean temperature |
NCA 3 |
 |
|
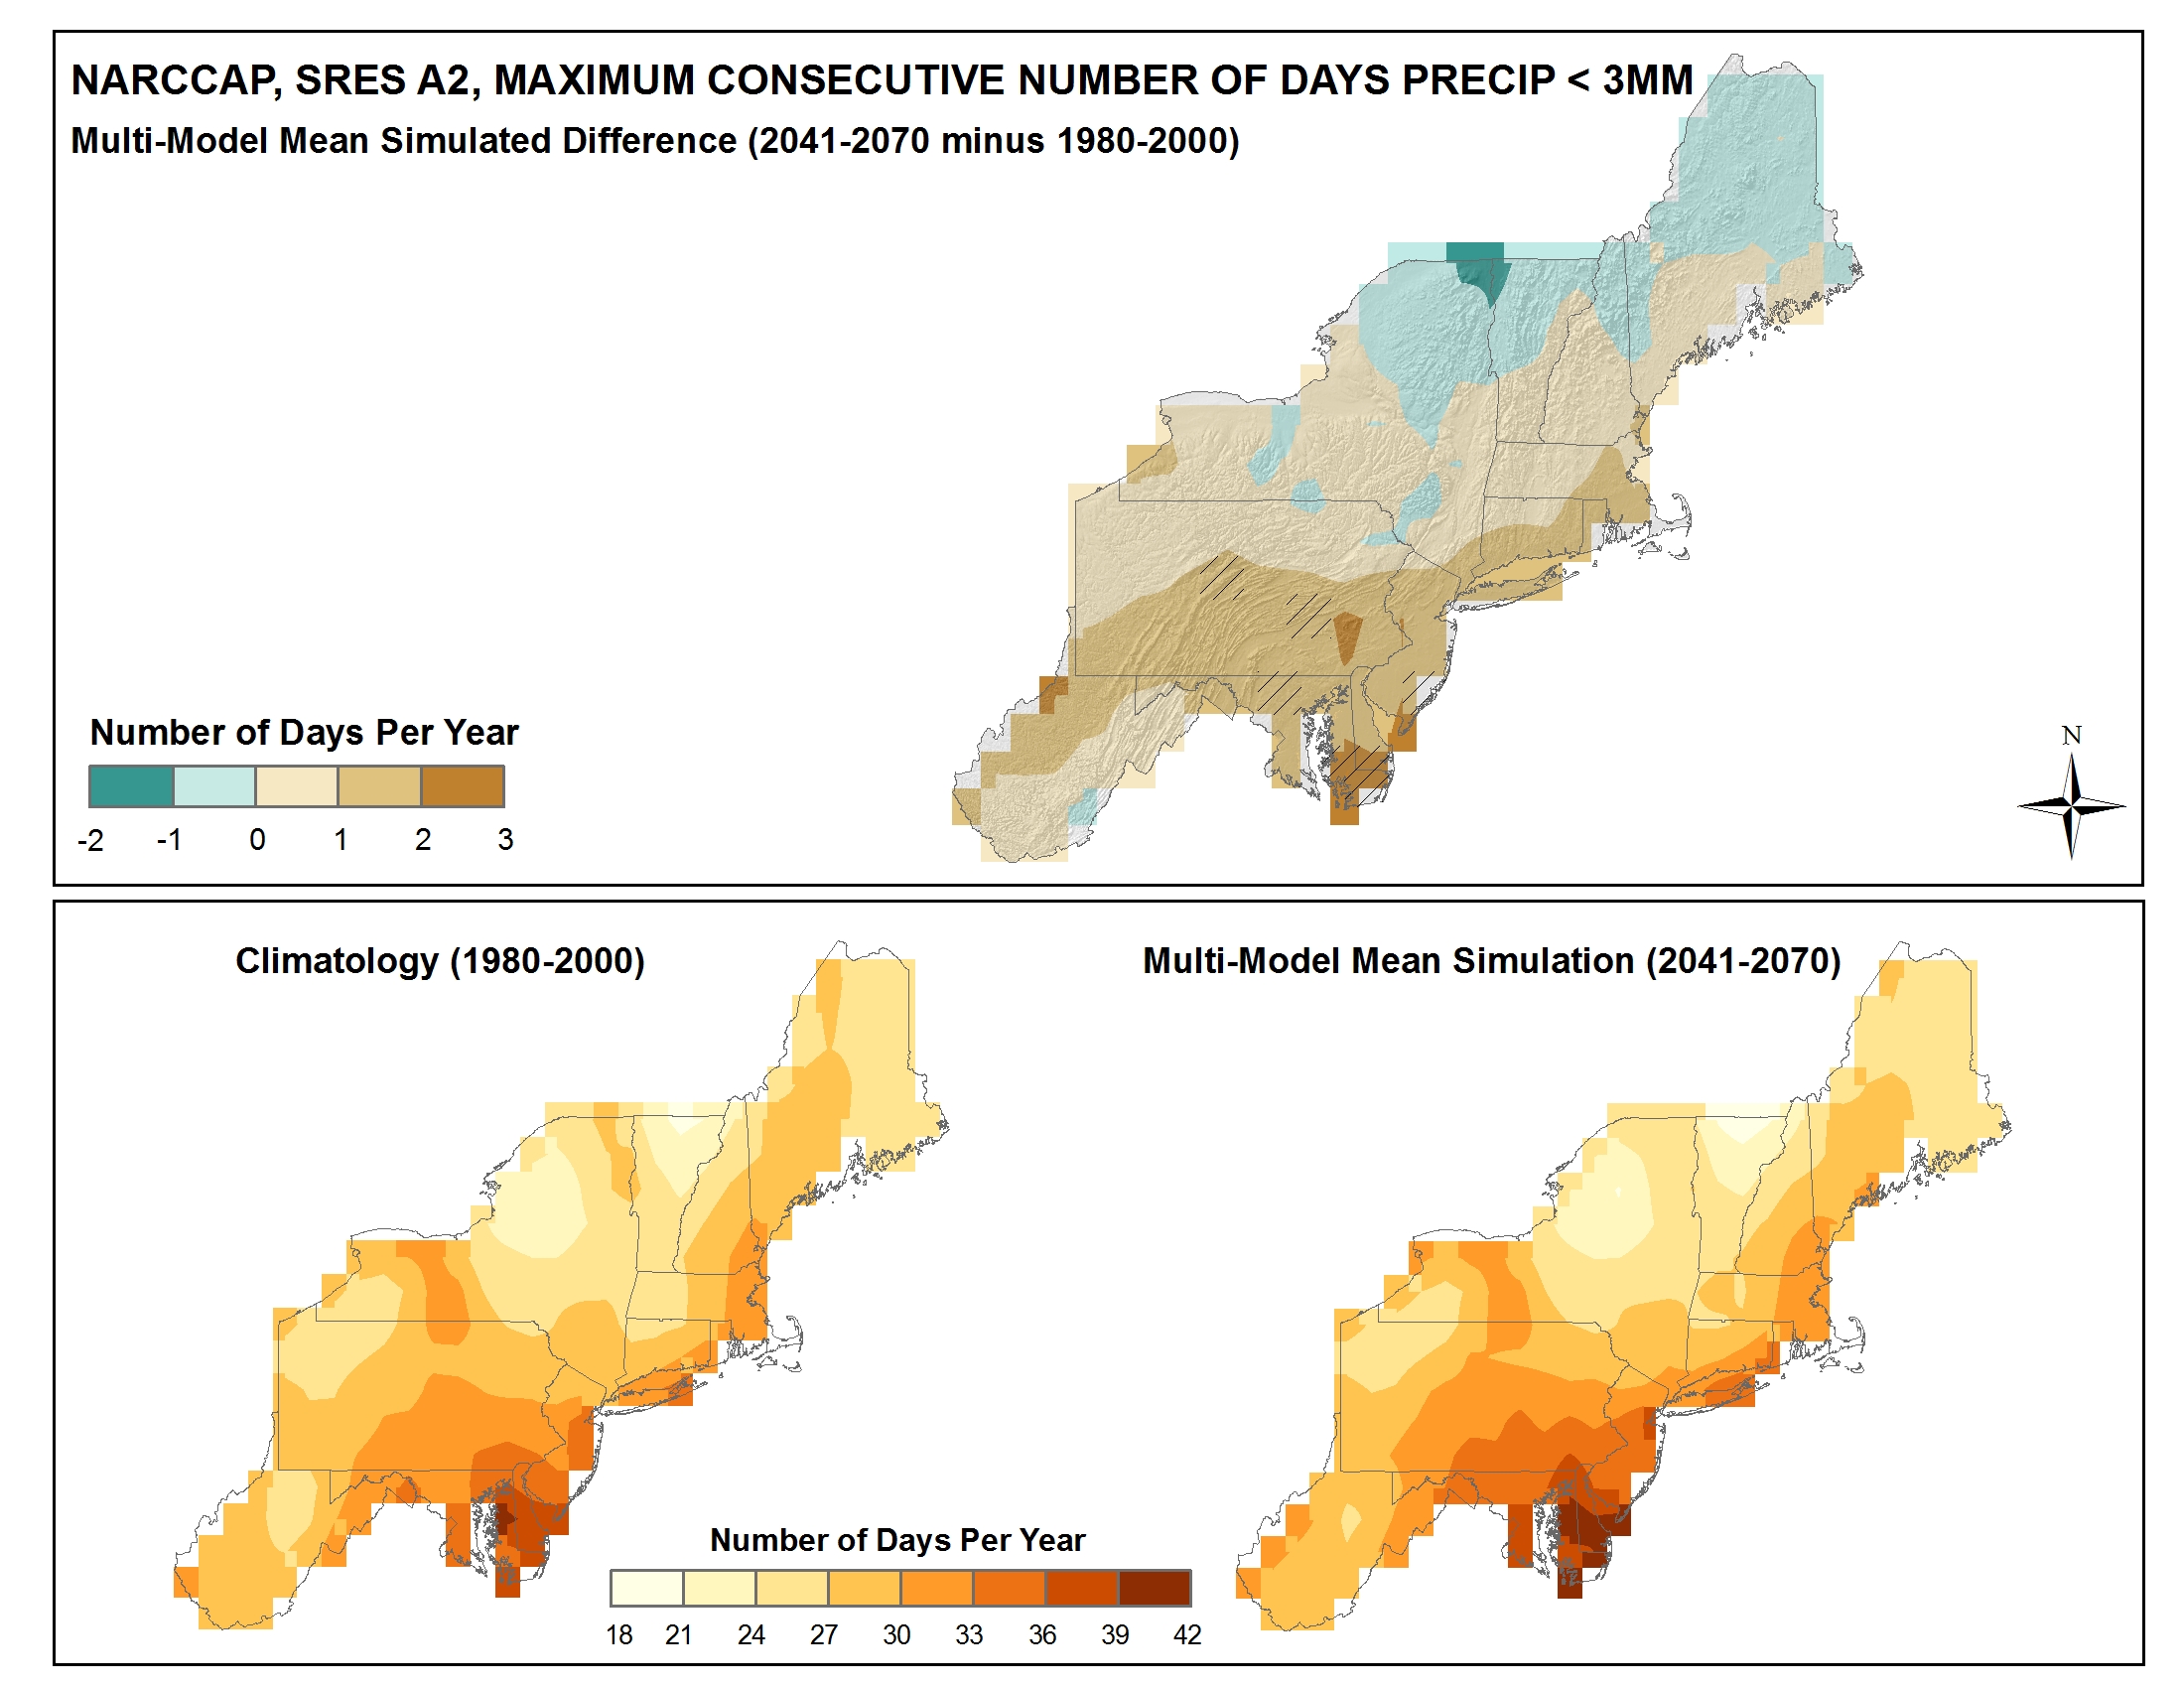
Simulated difference in the mean annual maximum number of consecutive days with precipitation of less than 0.1 inches |
NCA 3 |
 |
|
Simulated decadal mean change in annual temperature |
NCA 3 |
 |
|
Time series of average snow depth at 23 snow course sites in Maine |
NCA 3 |
 |
|
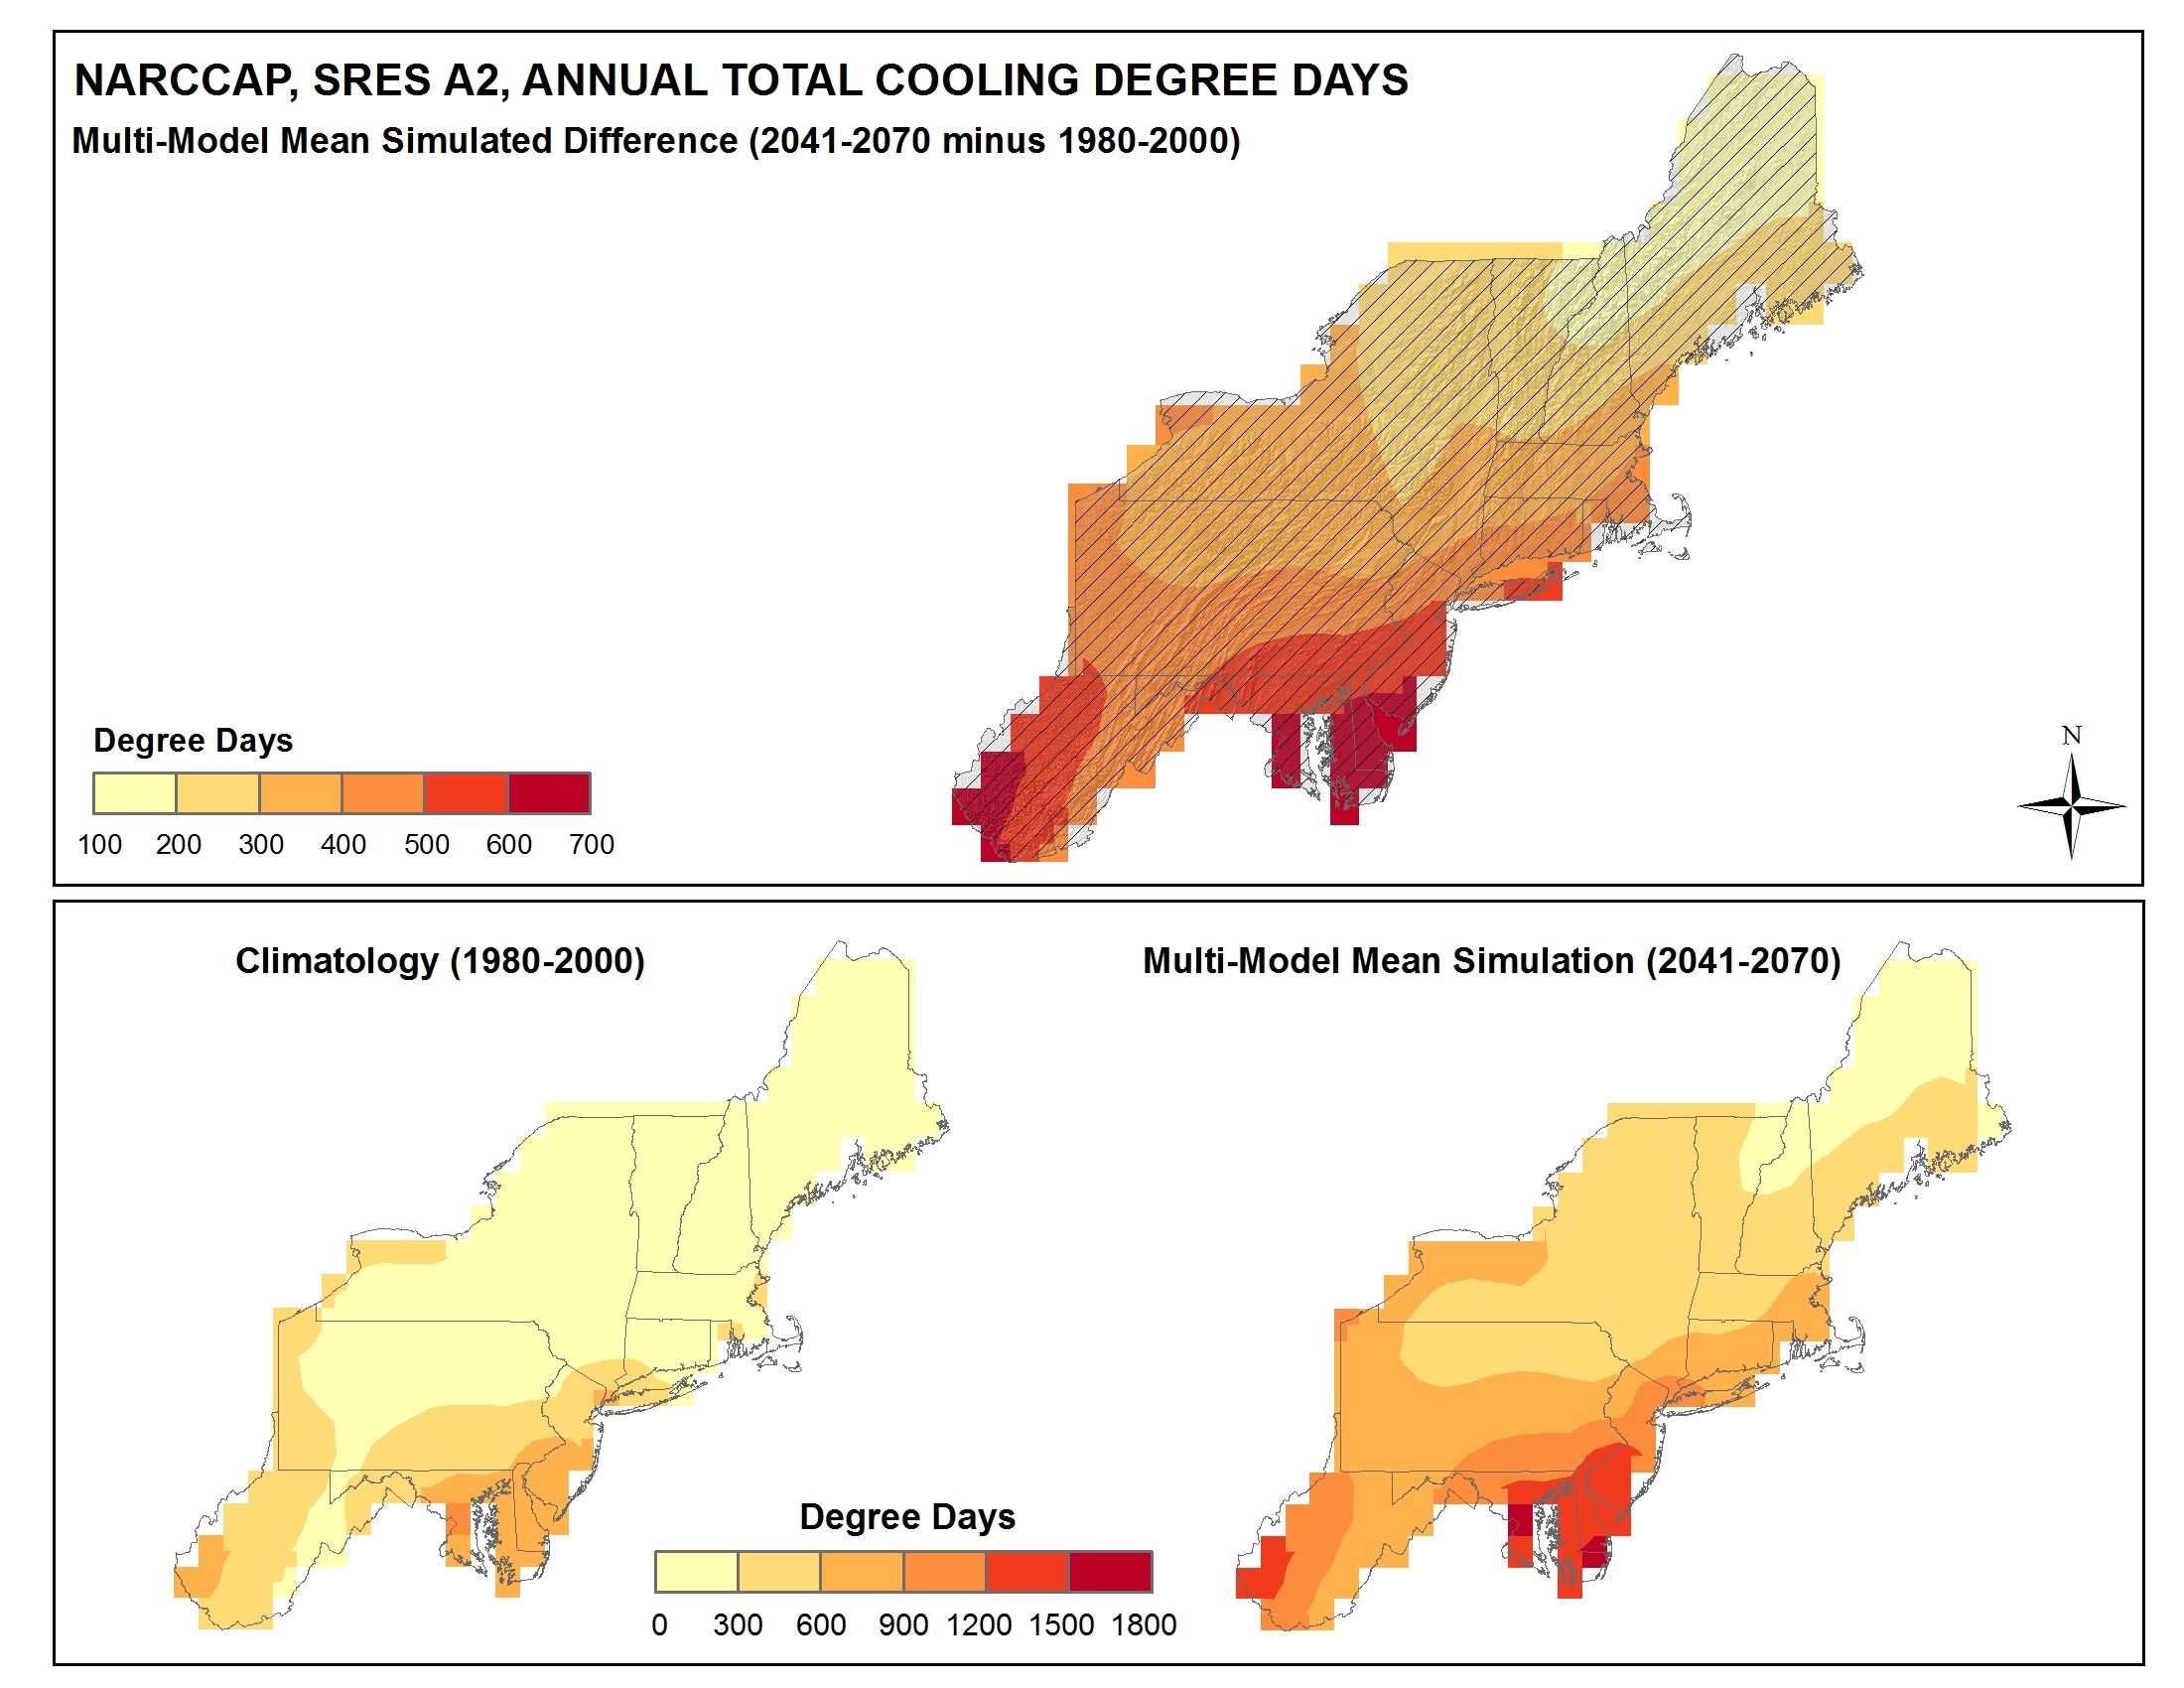
Simulated difference in the mean annual number of cooling degree days |
NCA 3 |
 |
|
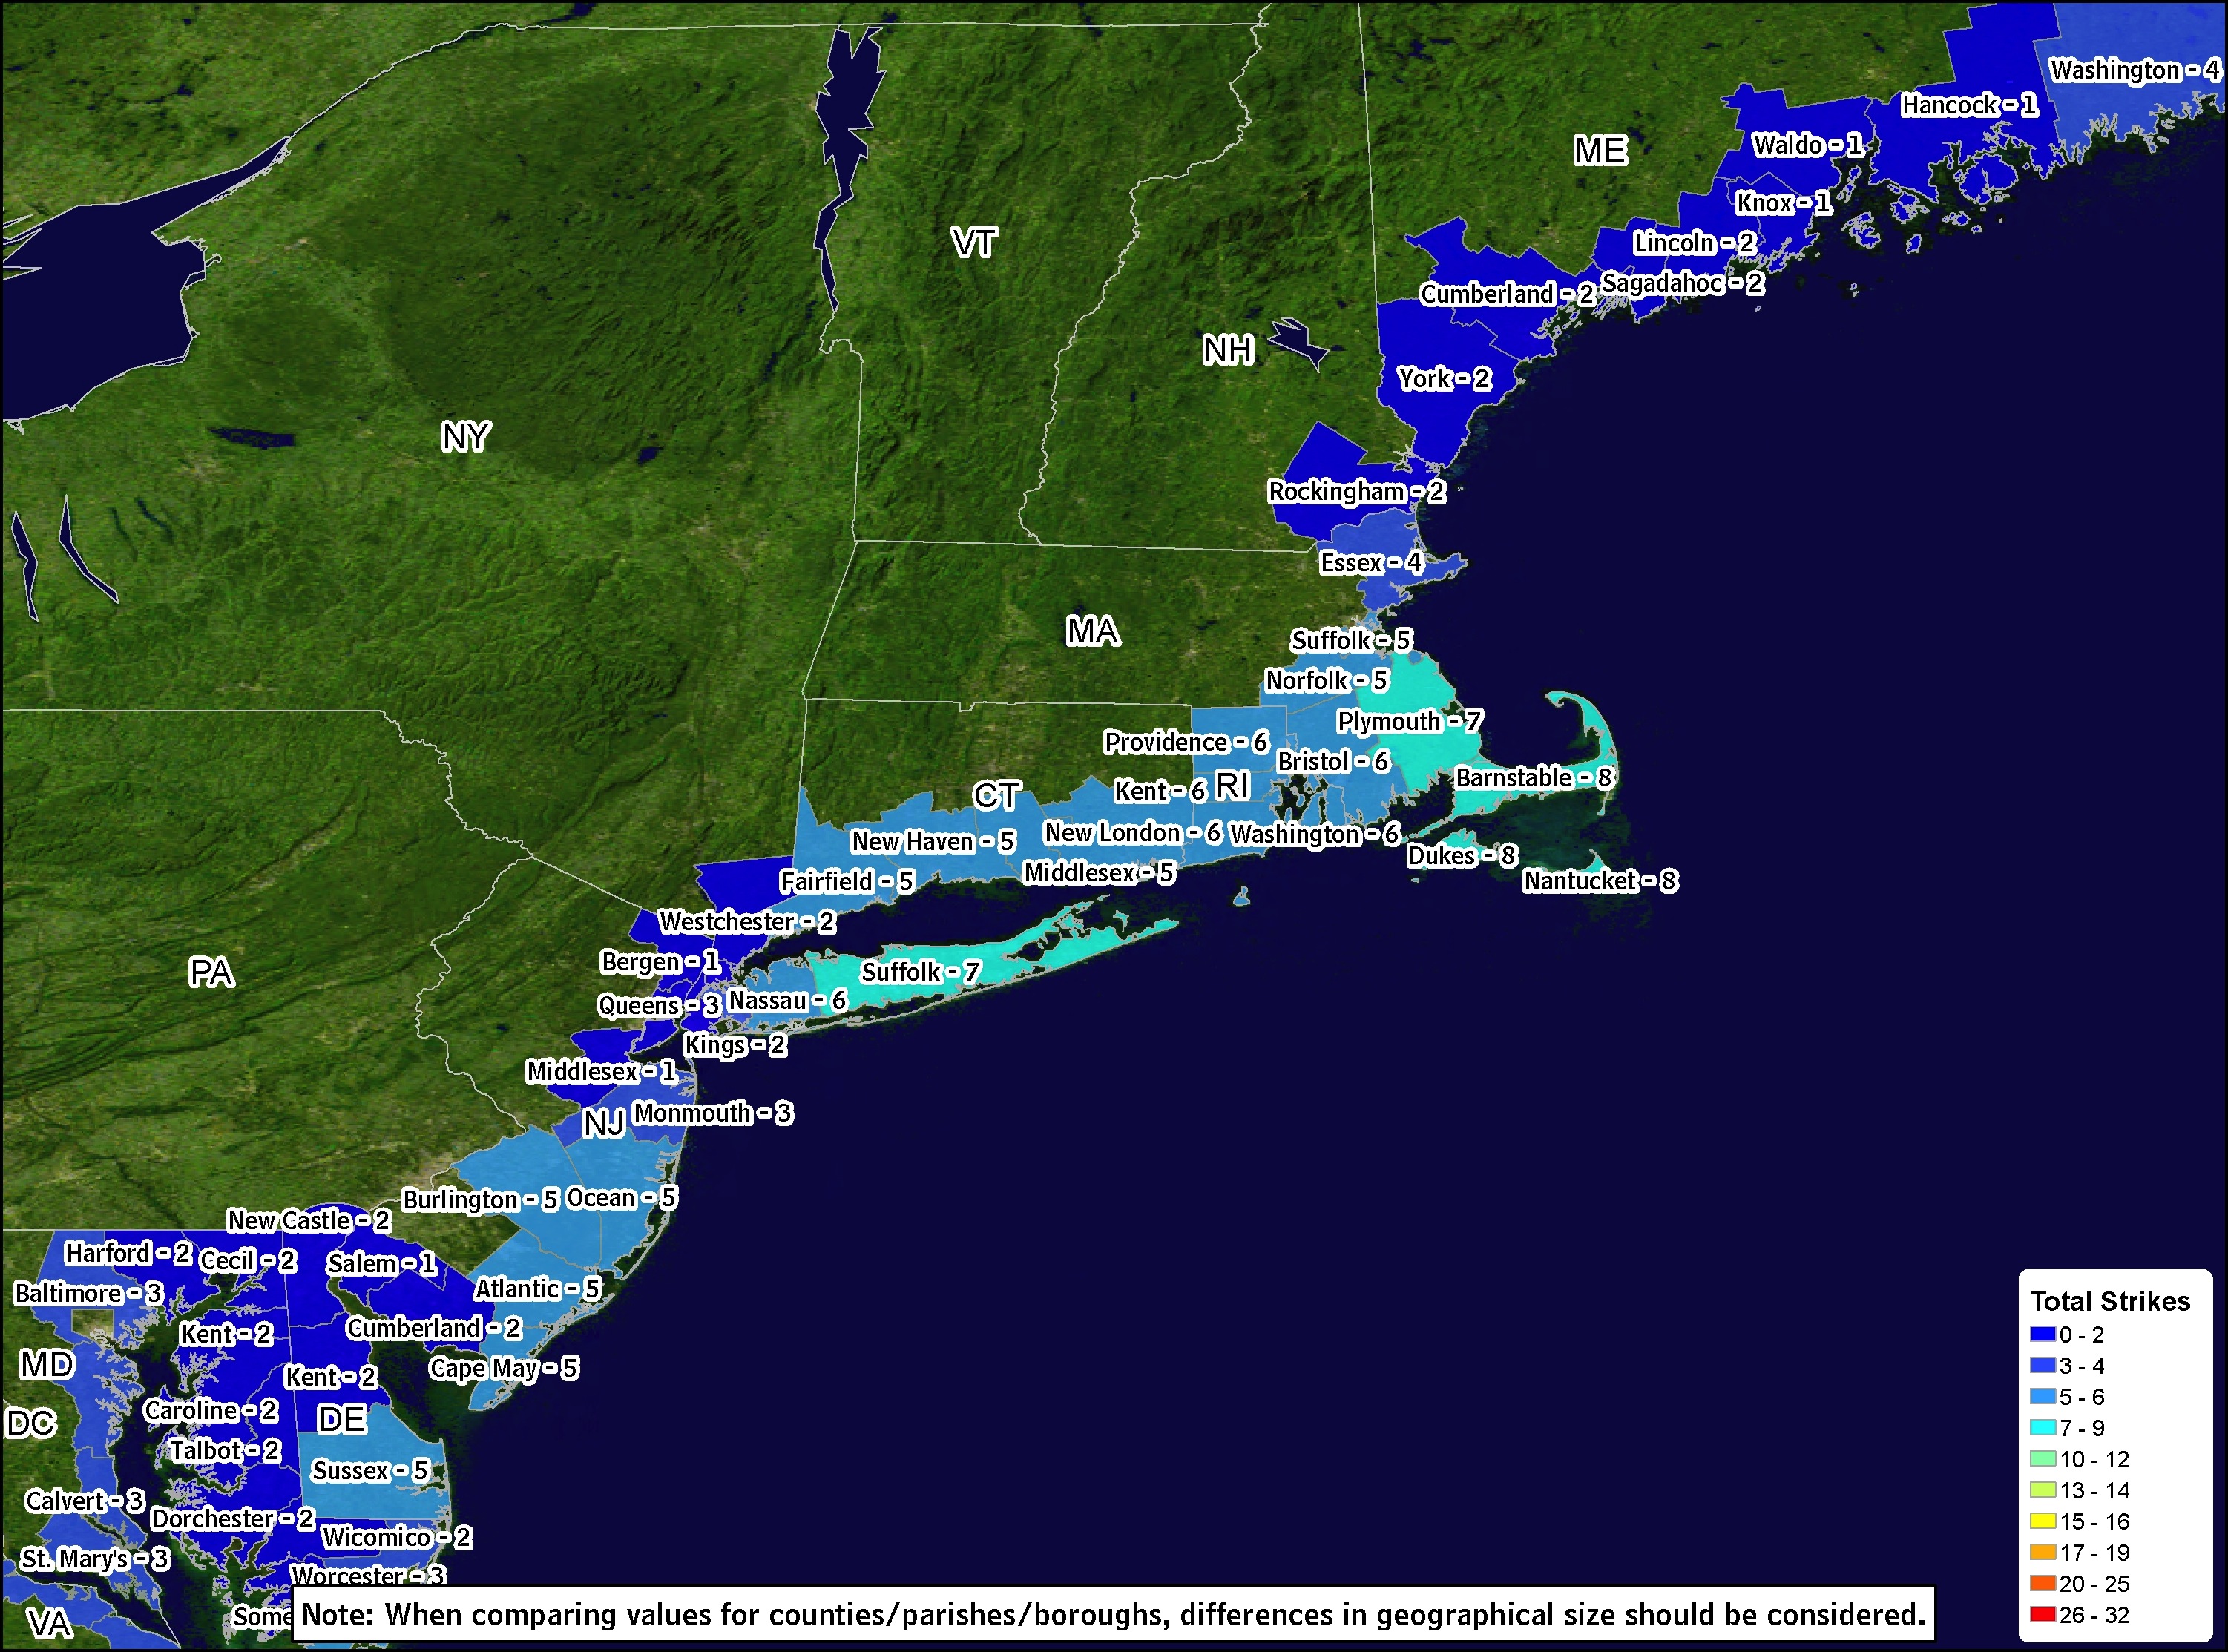
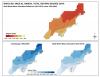
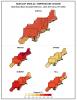
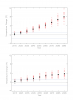
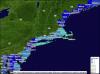
Number of hurricane strikes per county along the Northeast coast |
NCA 3 |
 |
|
Simulated annual mean temperature change |
NCA 3 |
 |
|
Simulated seasonal mean precipitation change |
NCA 3 |
 |
|
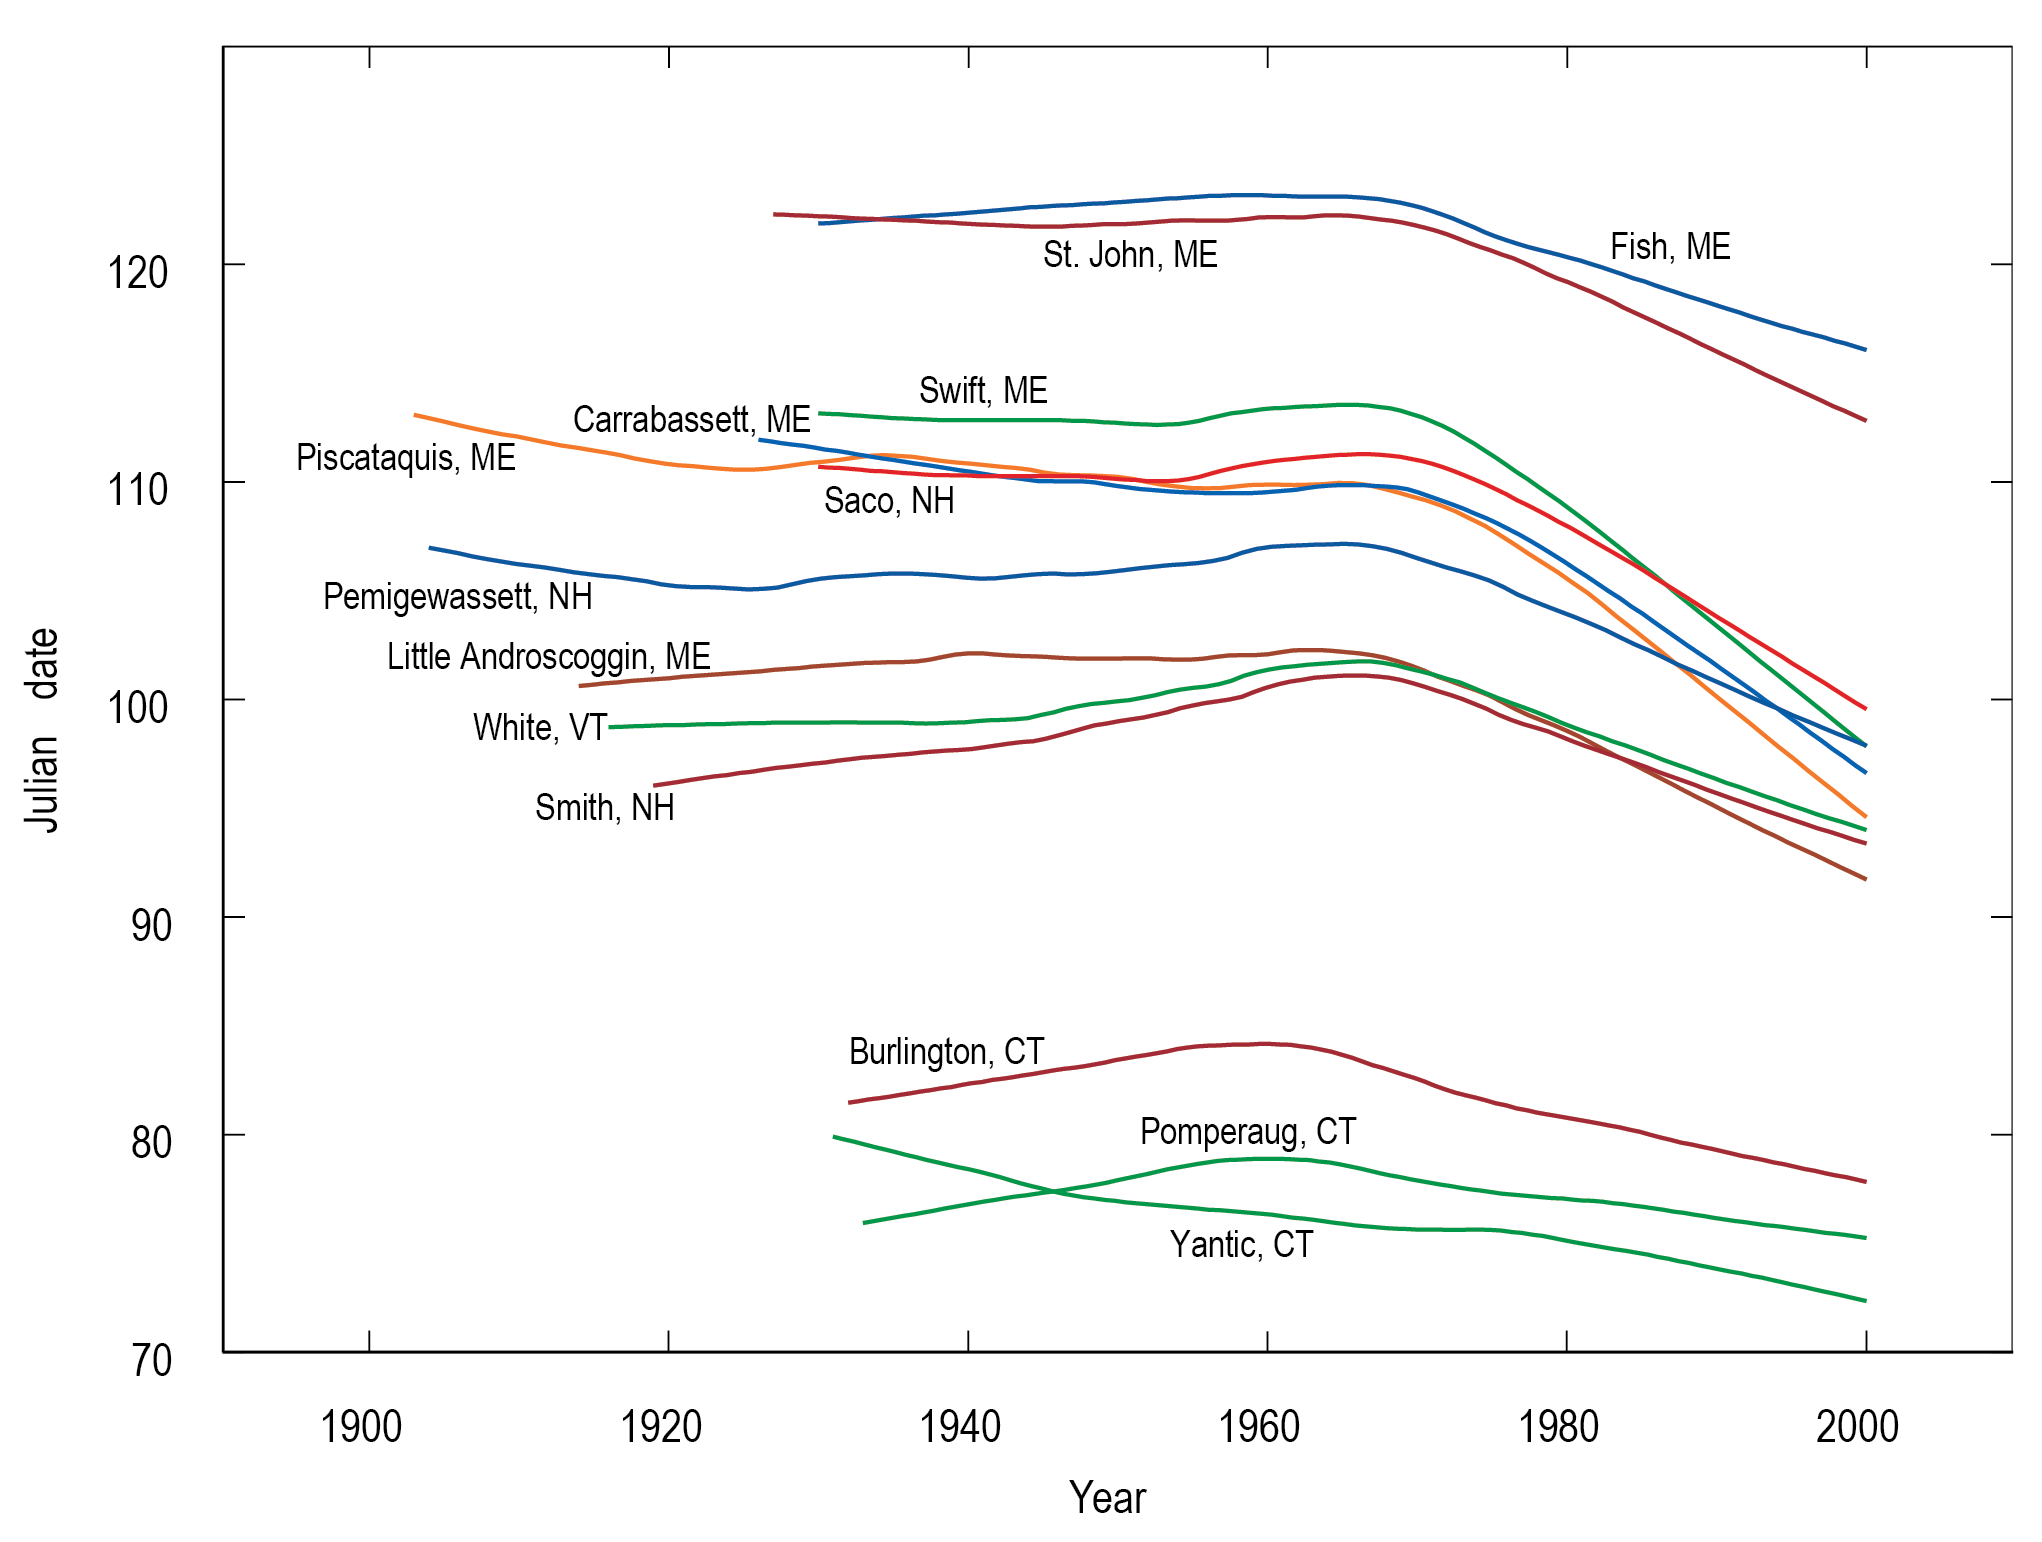
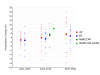
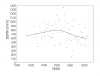
Winter/spring center of volume dates for the 13 longest-record rural, unregulated rivers in New England |
NCA 3 |
 |
|
Simulated annual mean change in select temperature variables |
NCA 3 |
 |
|
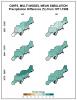
Observed decadal mean seasonal precipitation change |
NCA 3 |
 |
|
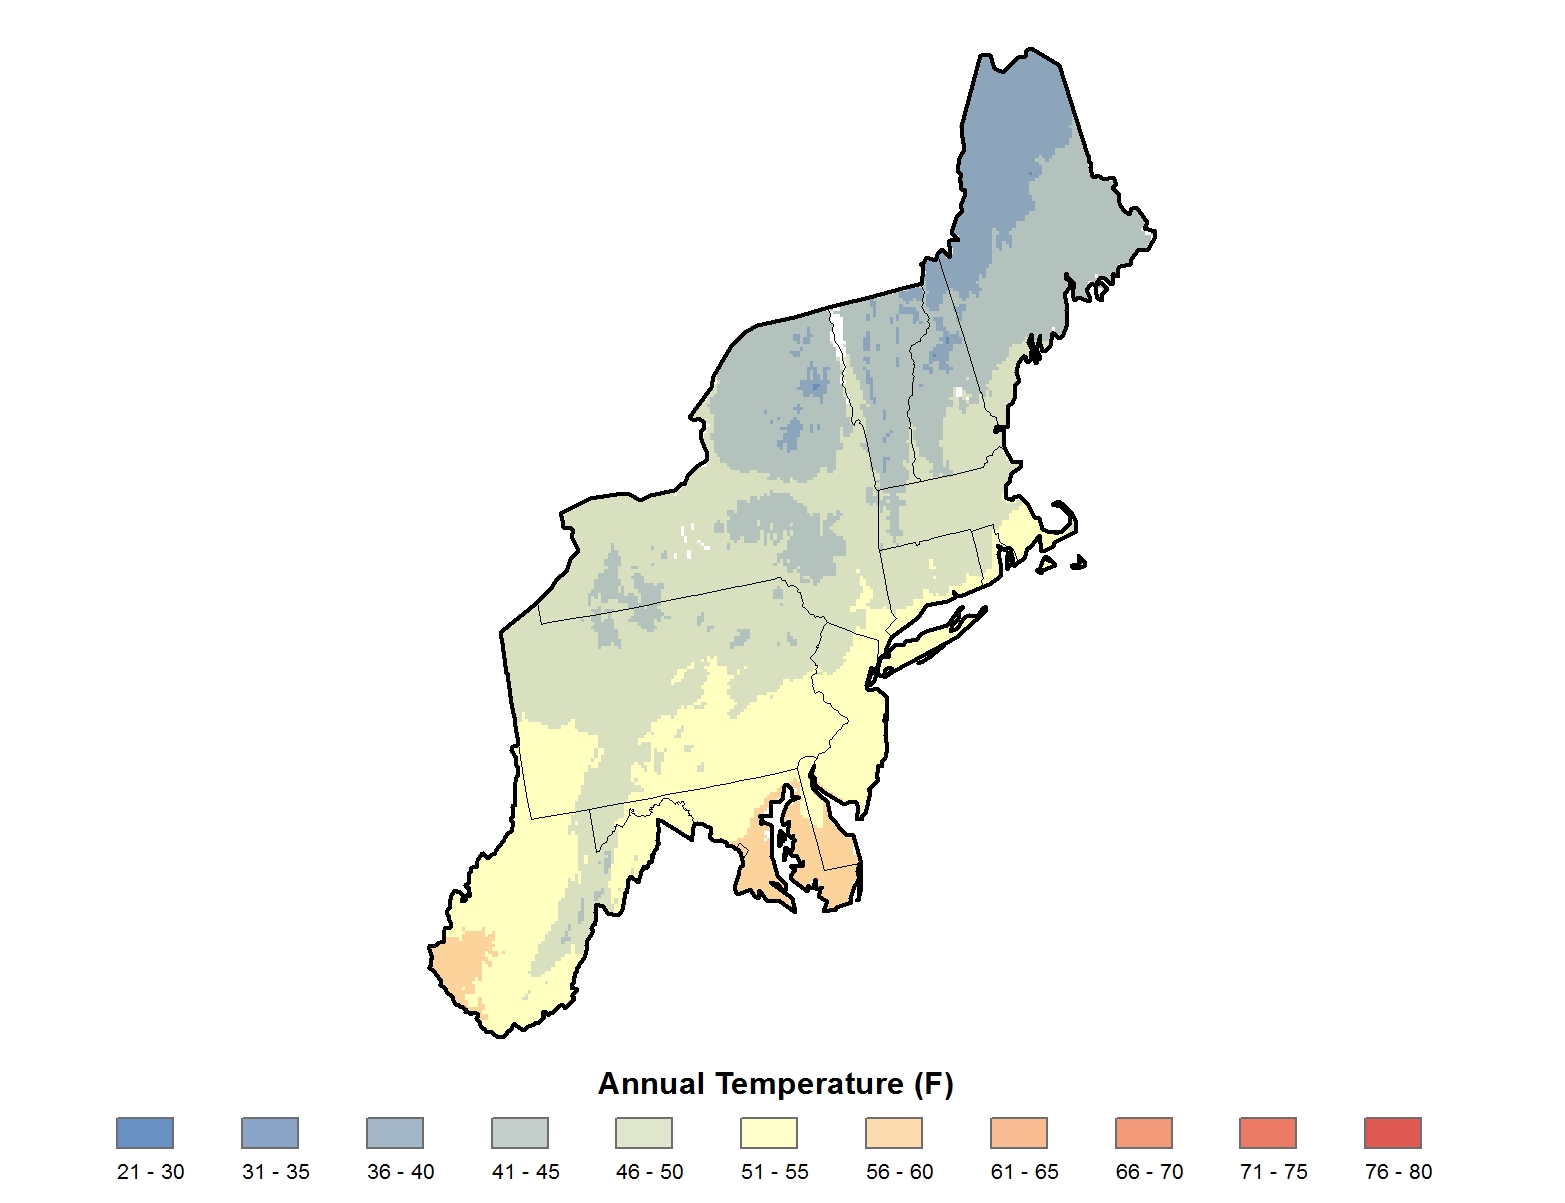
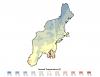
Average annual temperature |
NCA 3 |
 |
|
Simulated difference in mean annual temperature |
NCA 3 |
 |
|
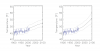
Distribution of the simulated change in seasonal mean precipitation |
NCA 3 |
 |
|
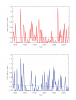
Time series of extreme precipitation index for the occurrence of 1-day, 1 in 5-year extreme precipitation |
NCA 3 |
 |
|
Simulated difference in the mean annual number of days with a minimum temperature less than 32F |
NCA 3 |
 |
|
Observed decadal mean seasonal temperature change |
NCA 3 |
 |
|
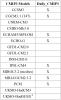
CMIP3 Models Listing |
NCA 3 |
 |
|
Distribution of the simulated change in annual mean precipitation |
NCA 3 |
 |
|
Annual and seasonal precipitation anomaly |
NCA 3 |
 |
|
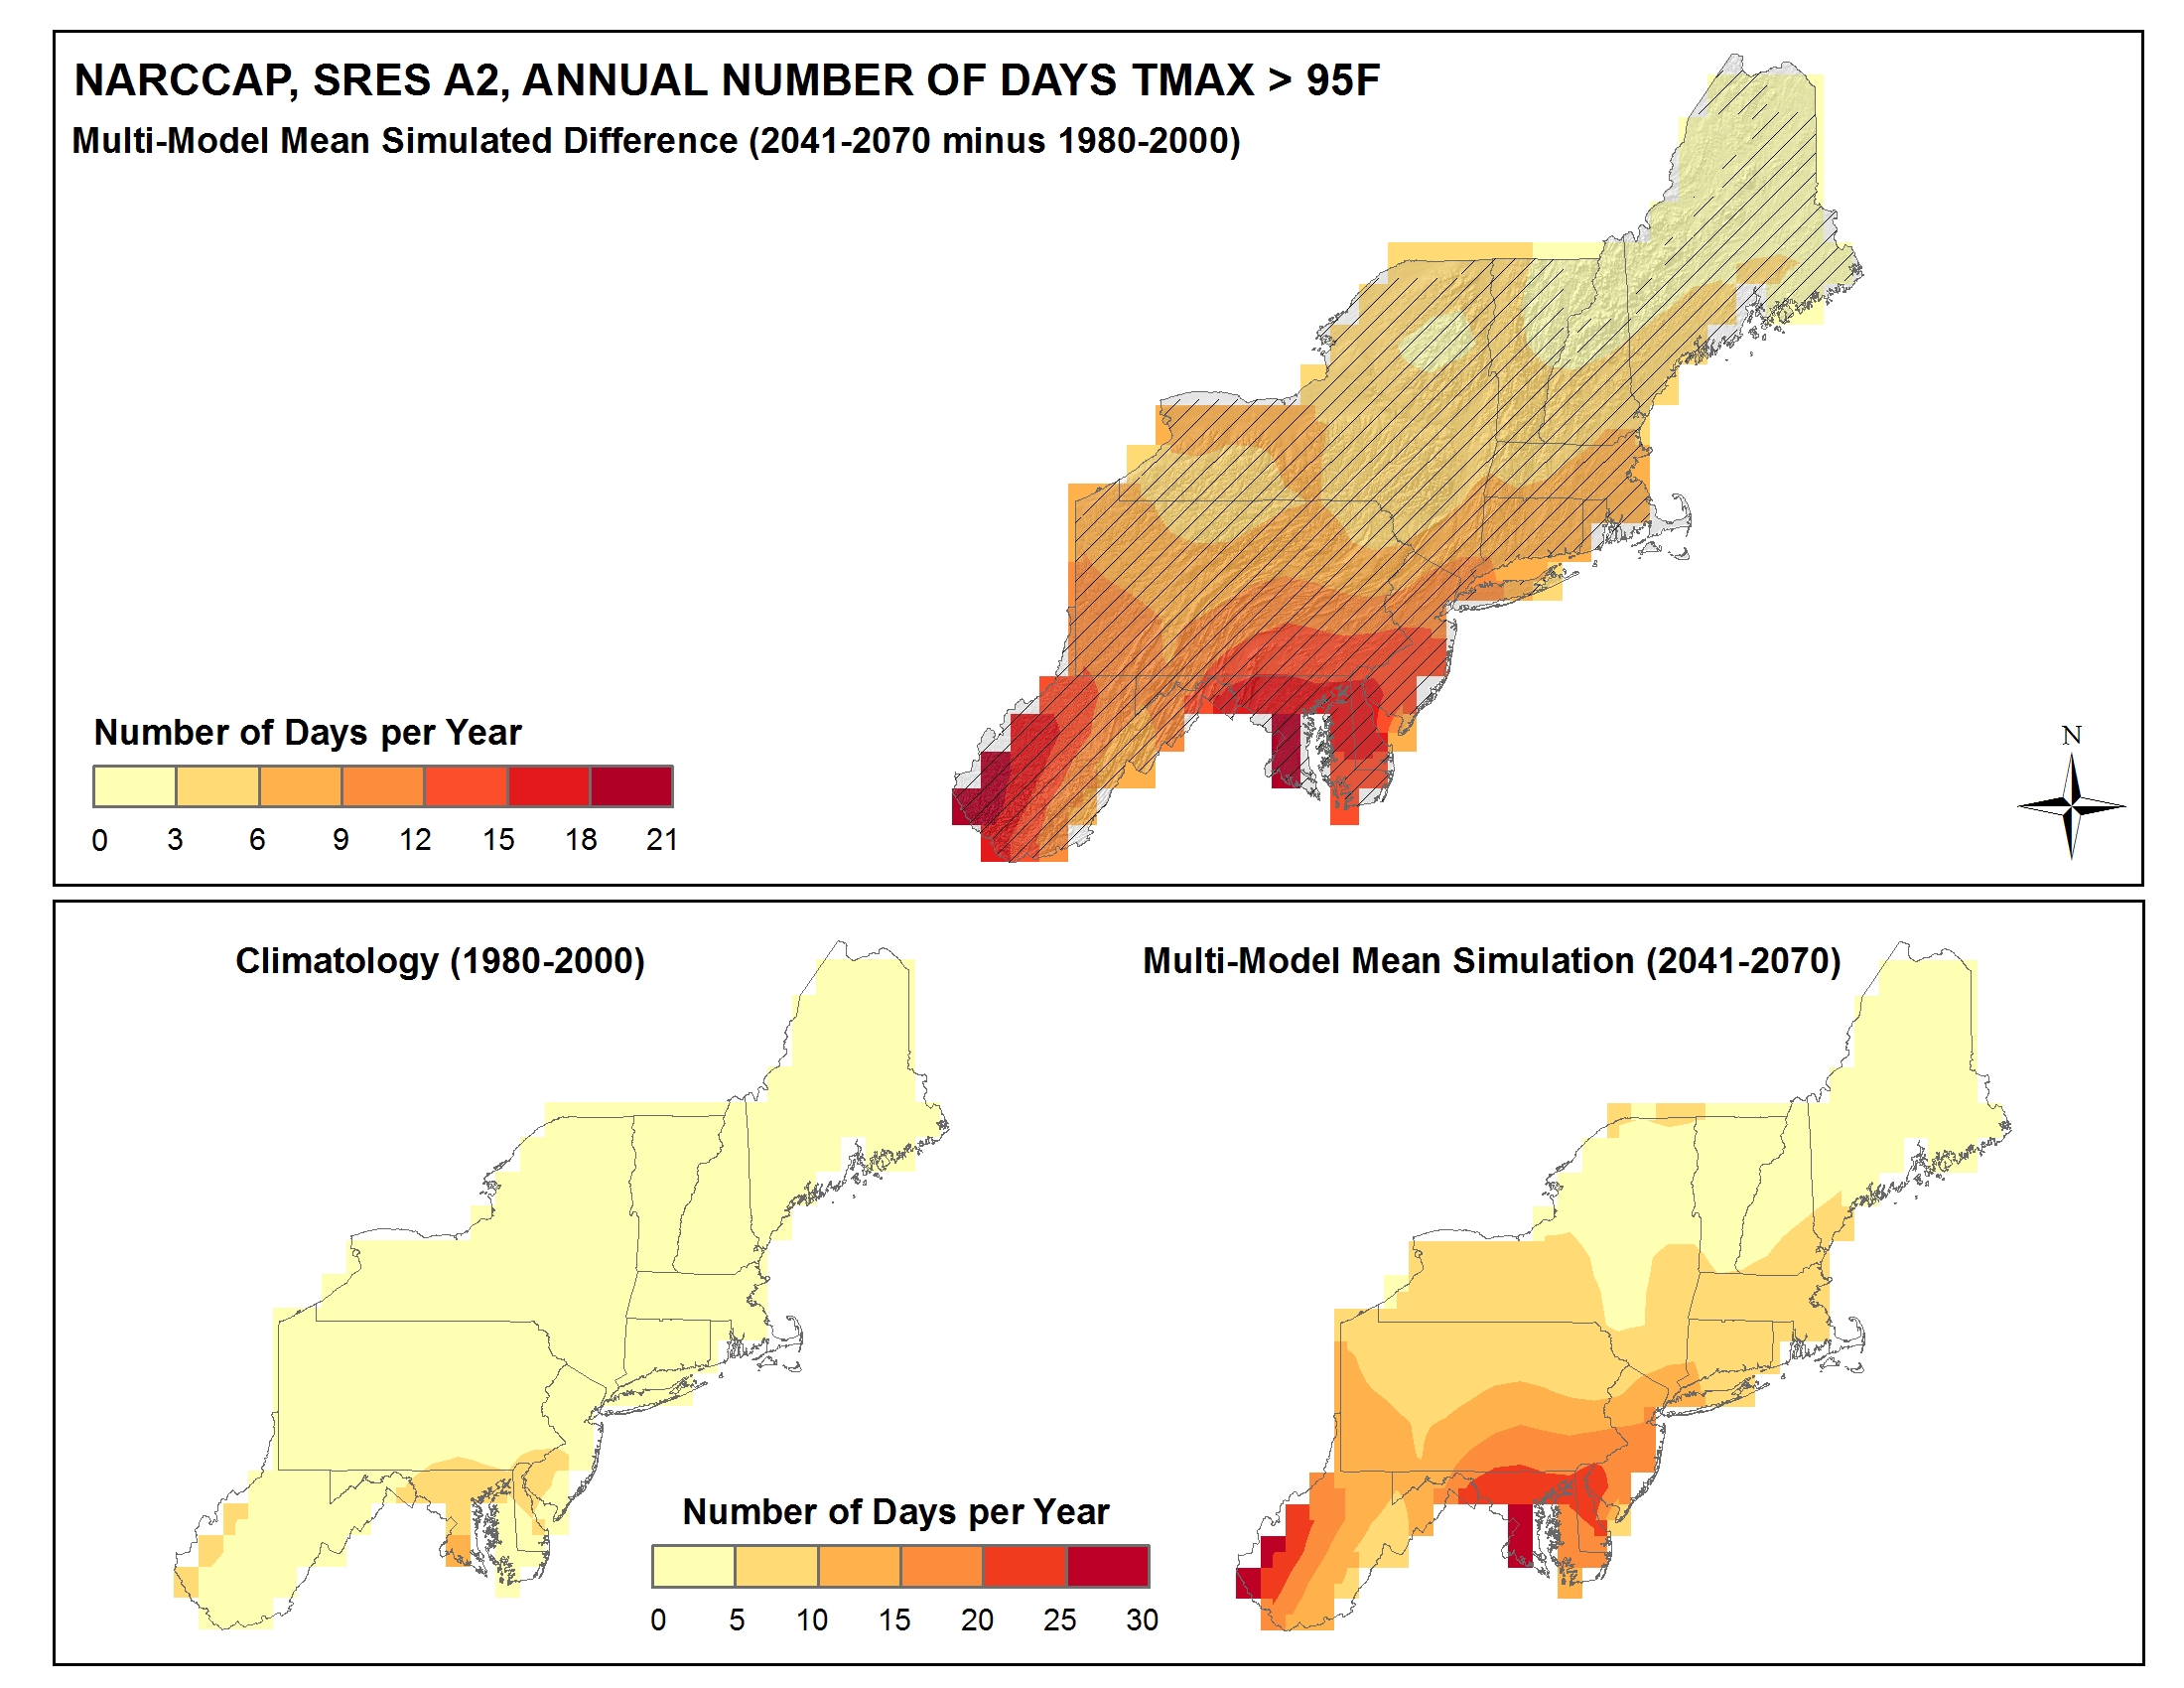
Simulated difference in the mean annual number of days with a maximum temperature greater than 95F |
NCA 3 |
 |
|
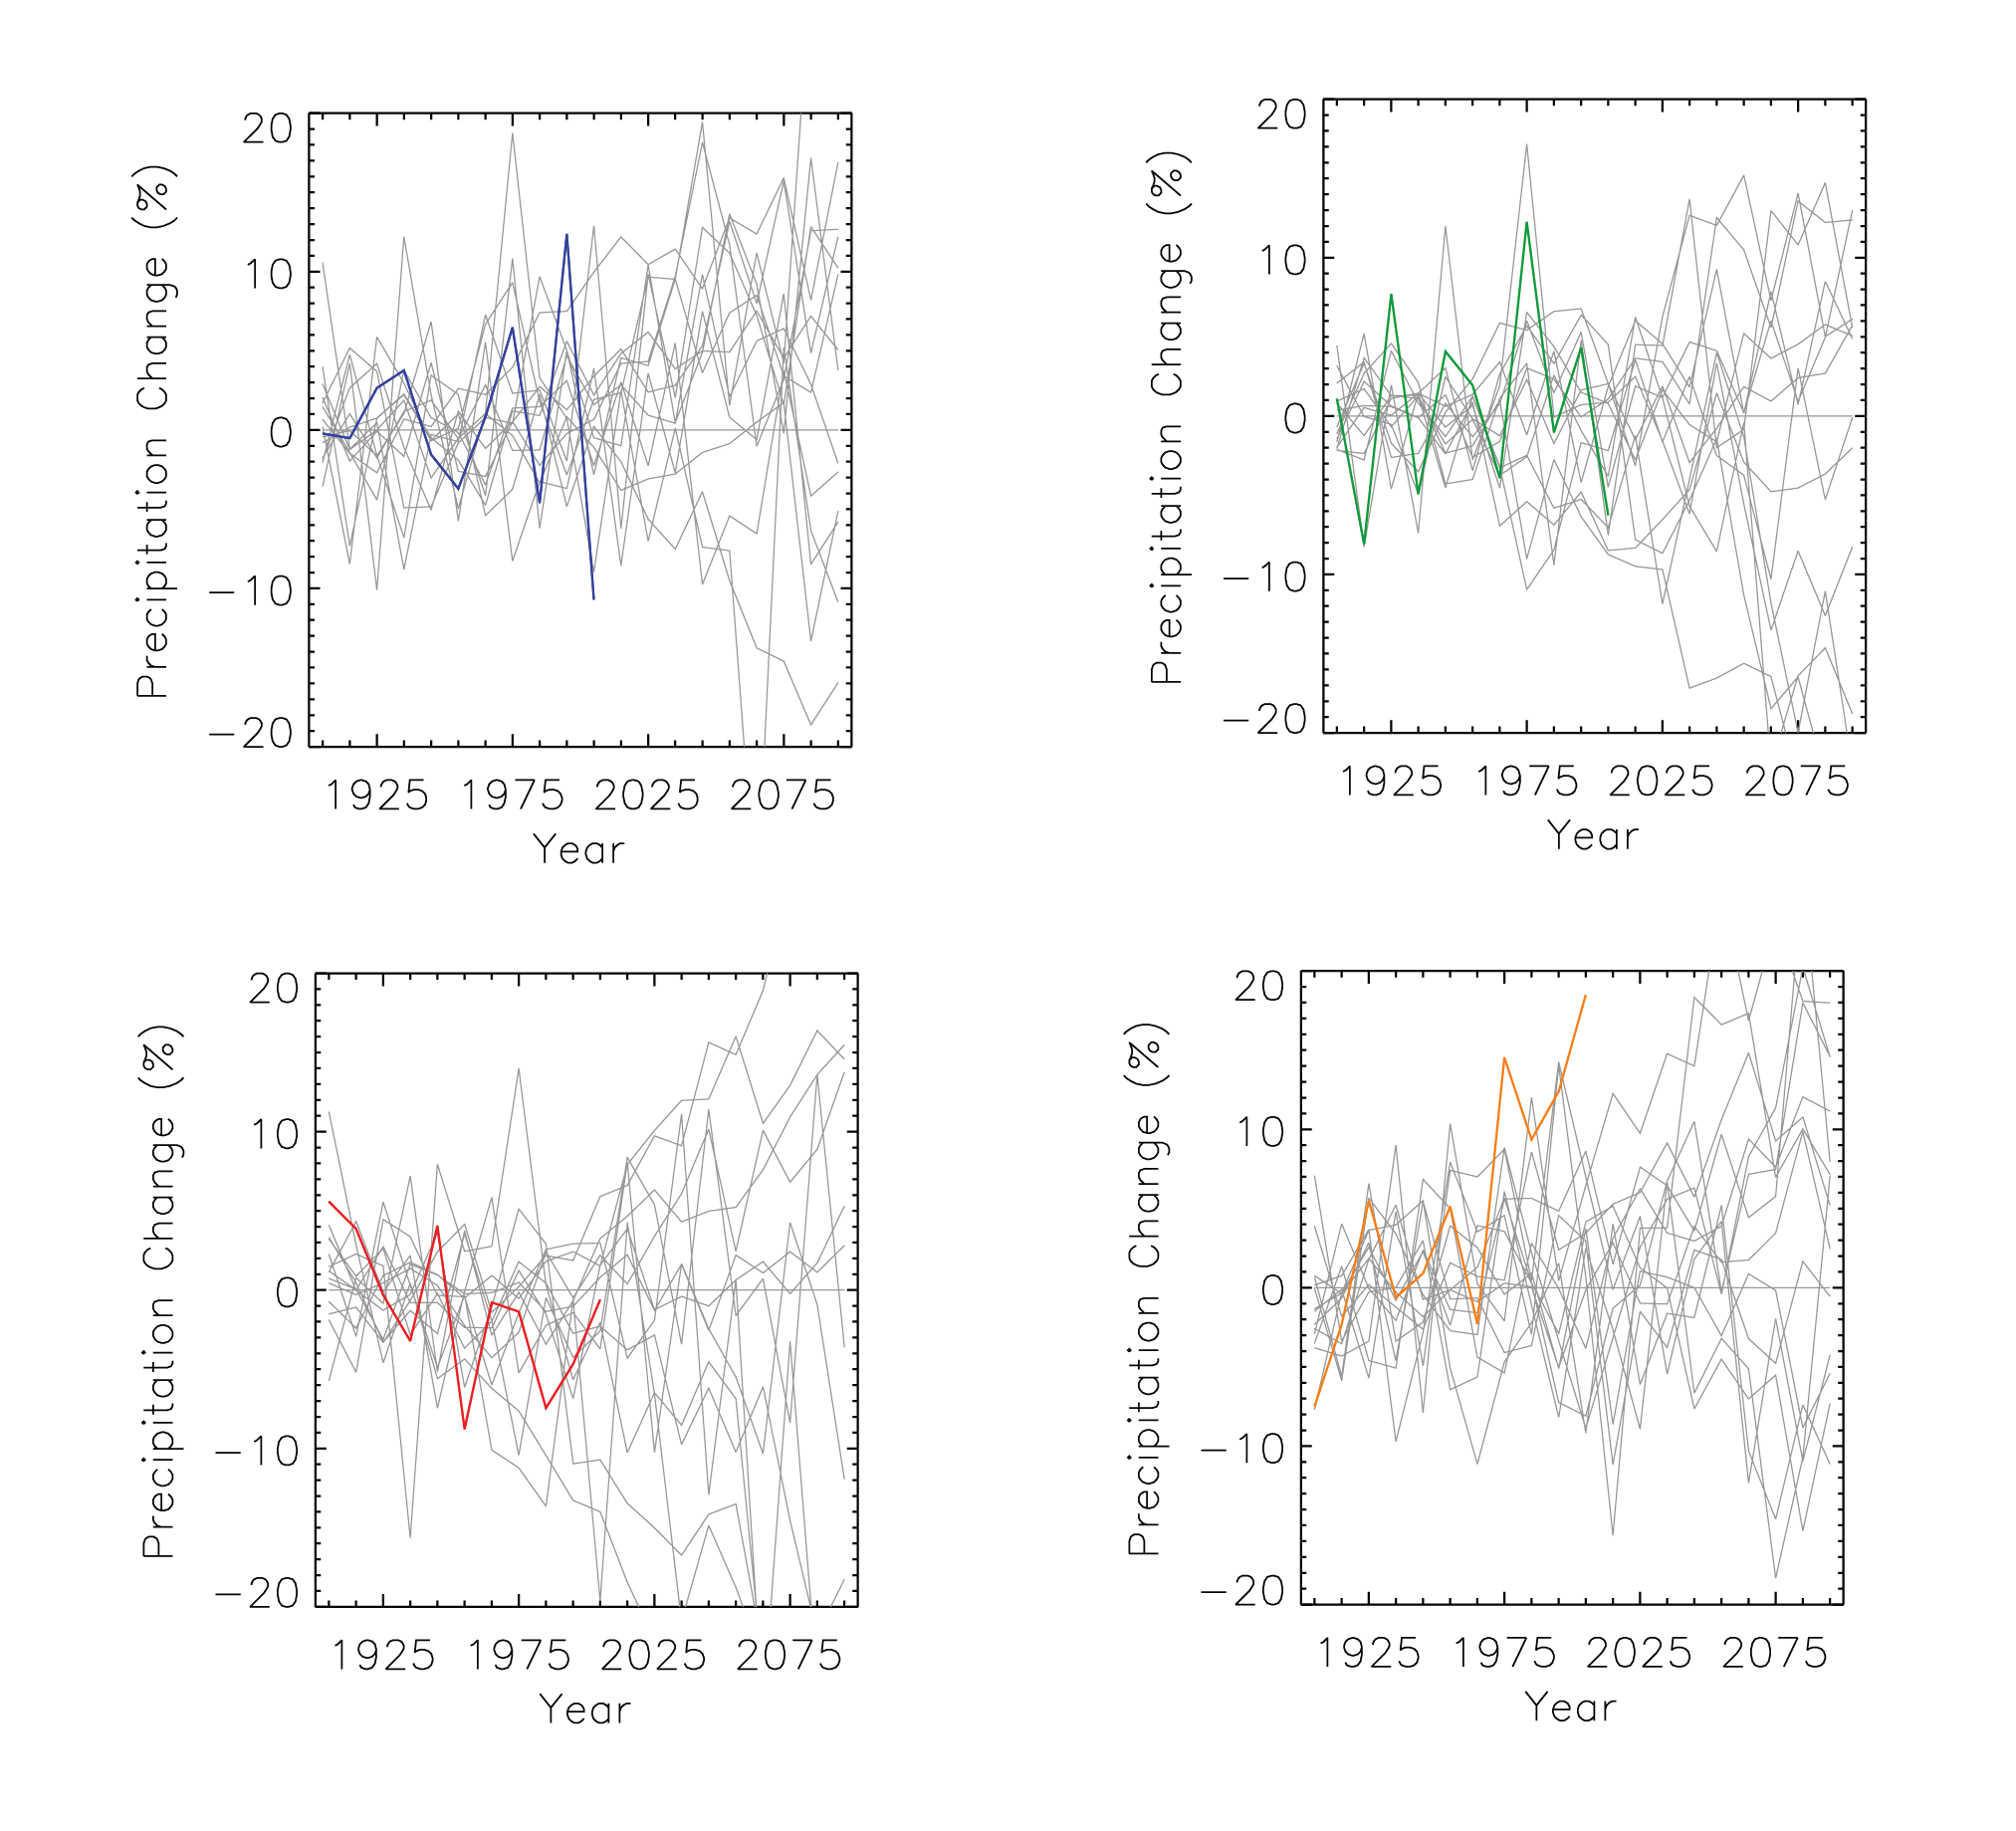
Simulated annual mean change in select precipitation variables |
NCA 3 |
 |