|
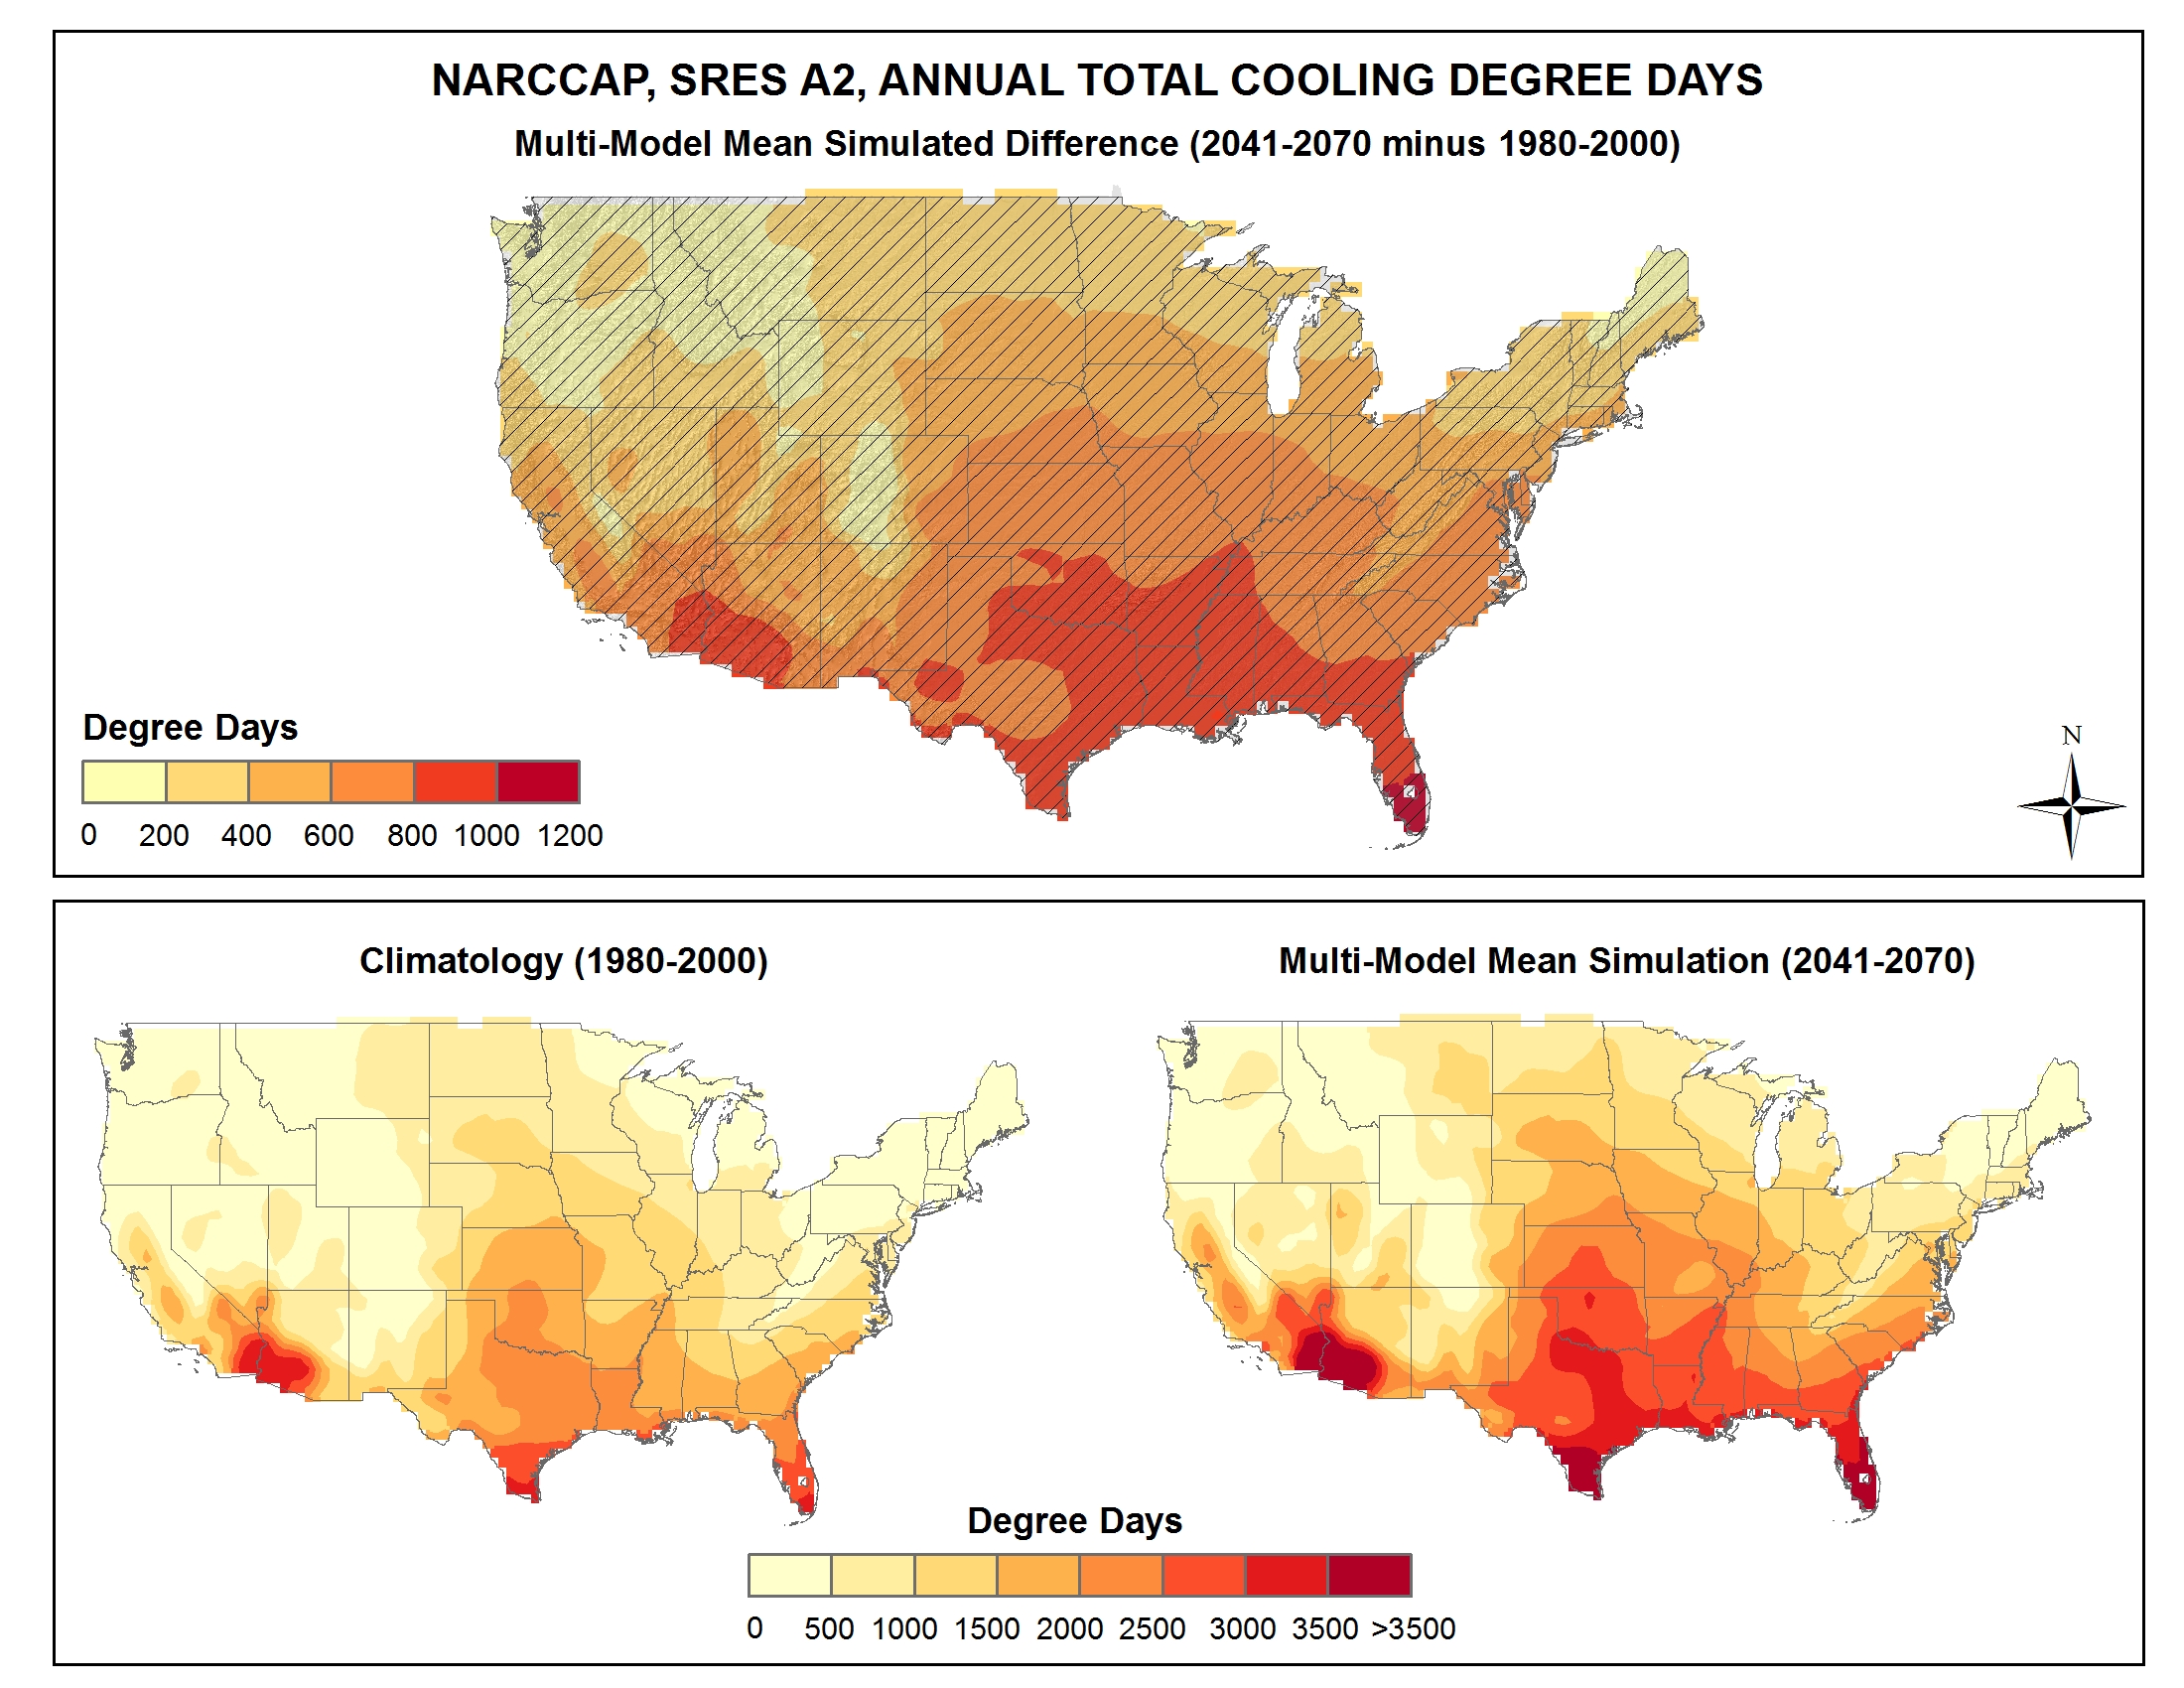
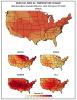
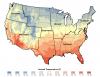
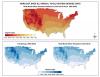
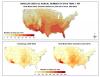
Simulated difference in the mean annual number of cooling degree days |
NCA 3 |
 |
|
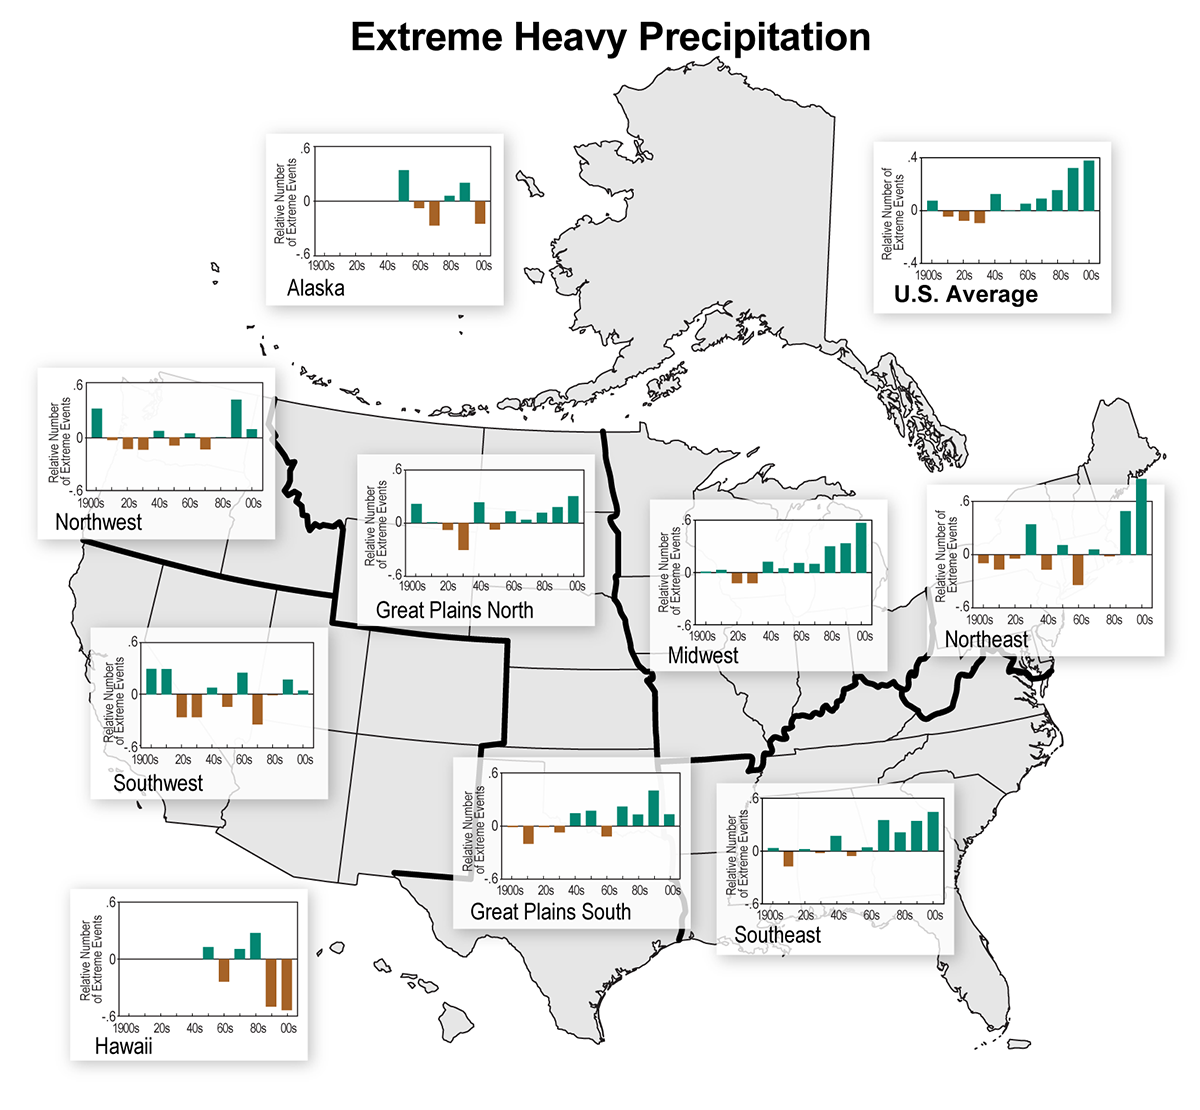
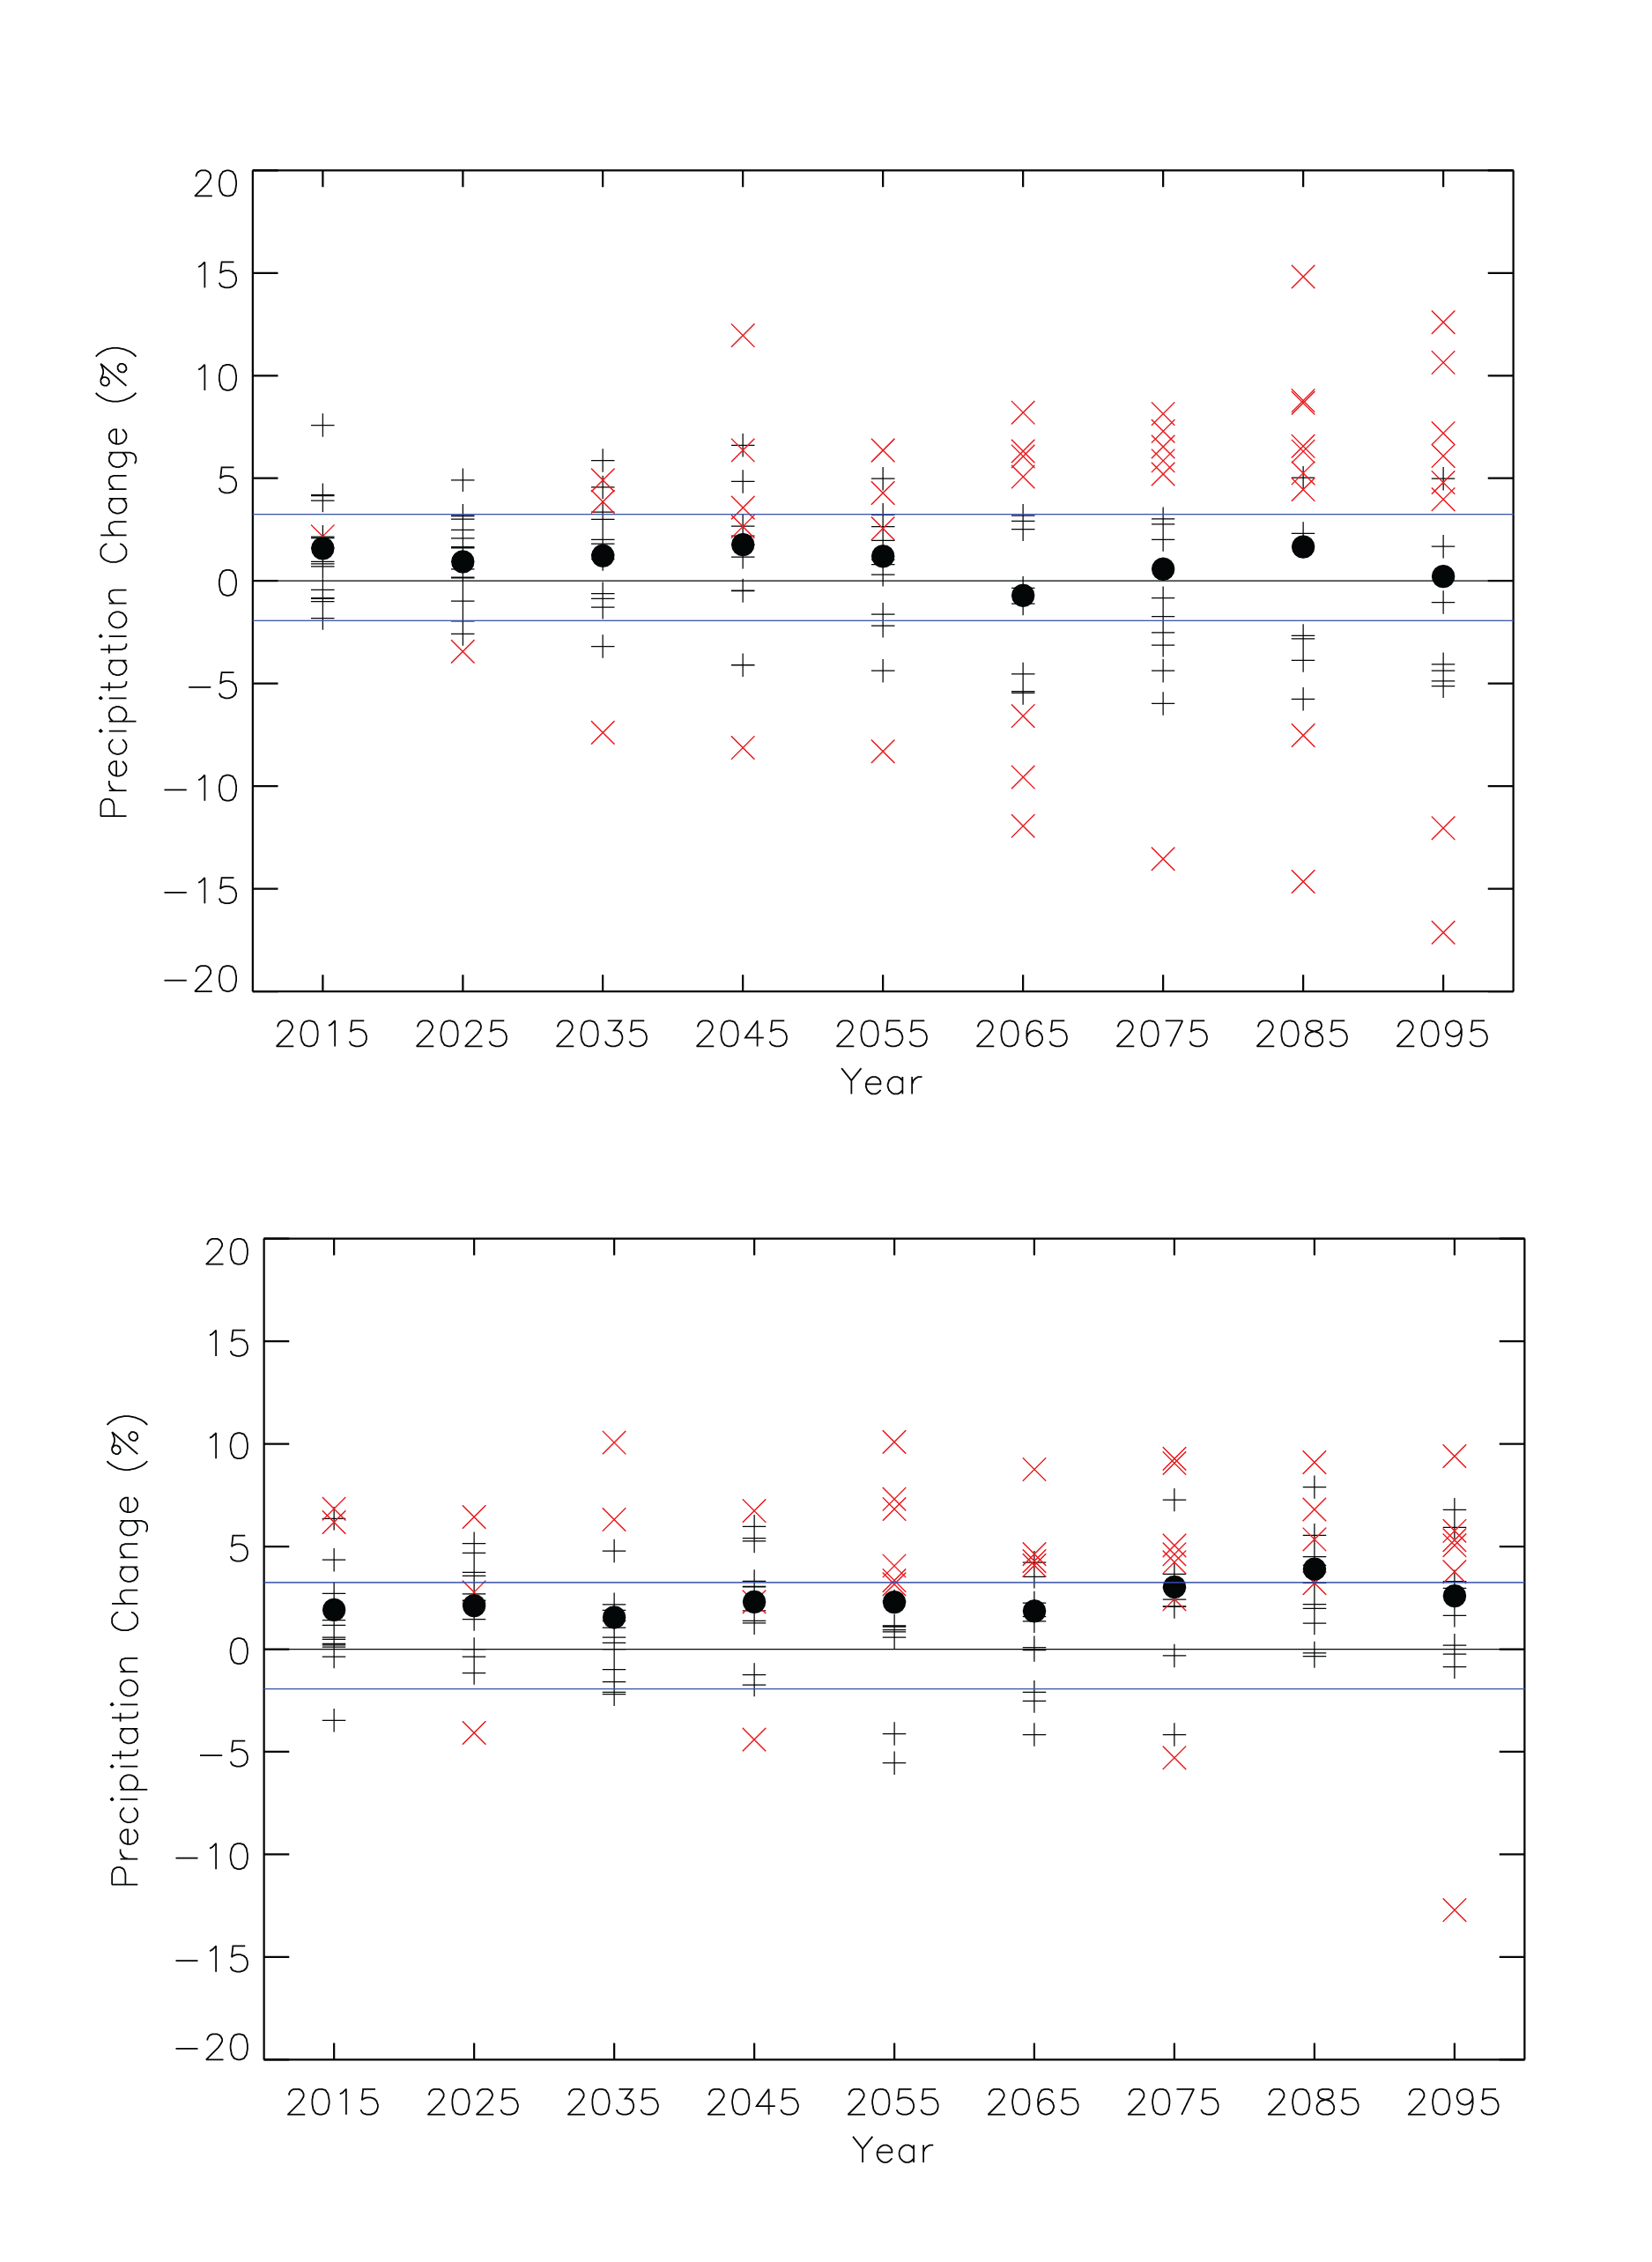
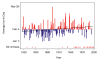
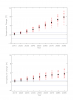
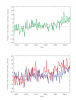
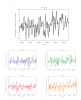
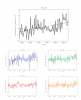
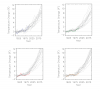
Decadal time series of an extreme precipitation index |
NCA 3 |
 |
|
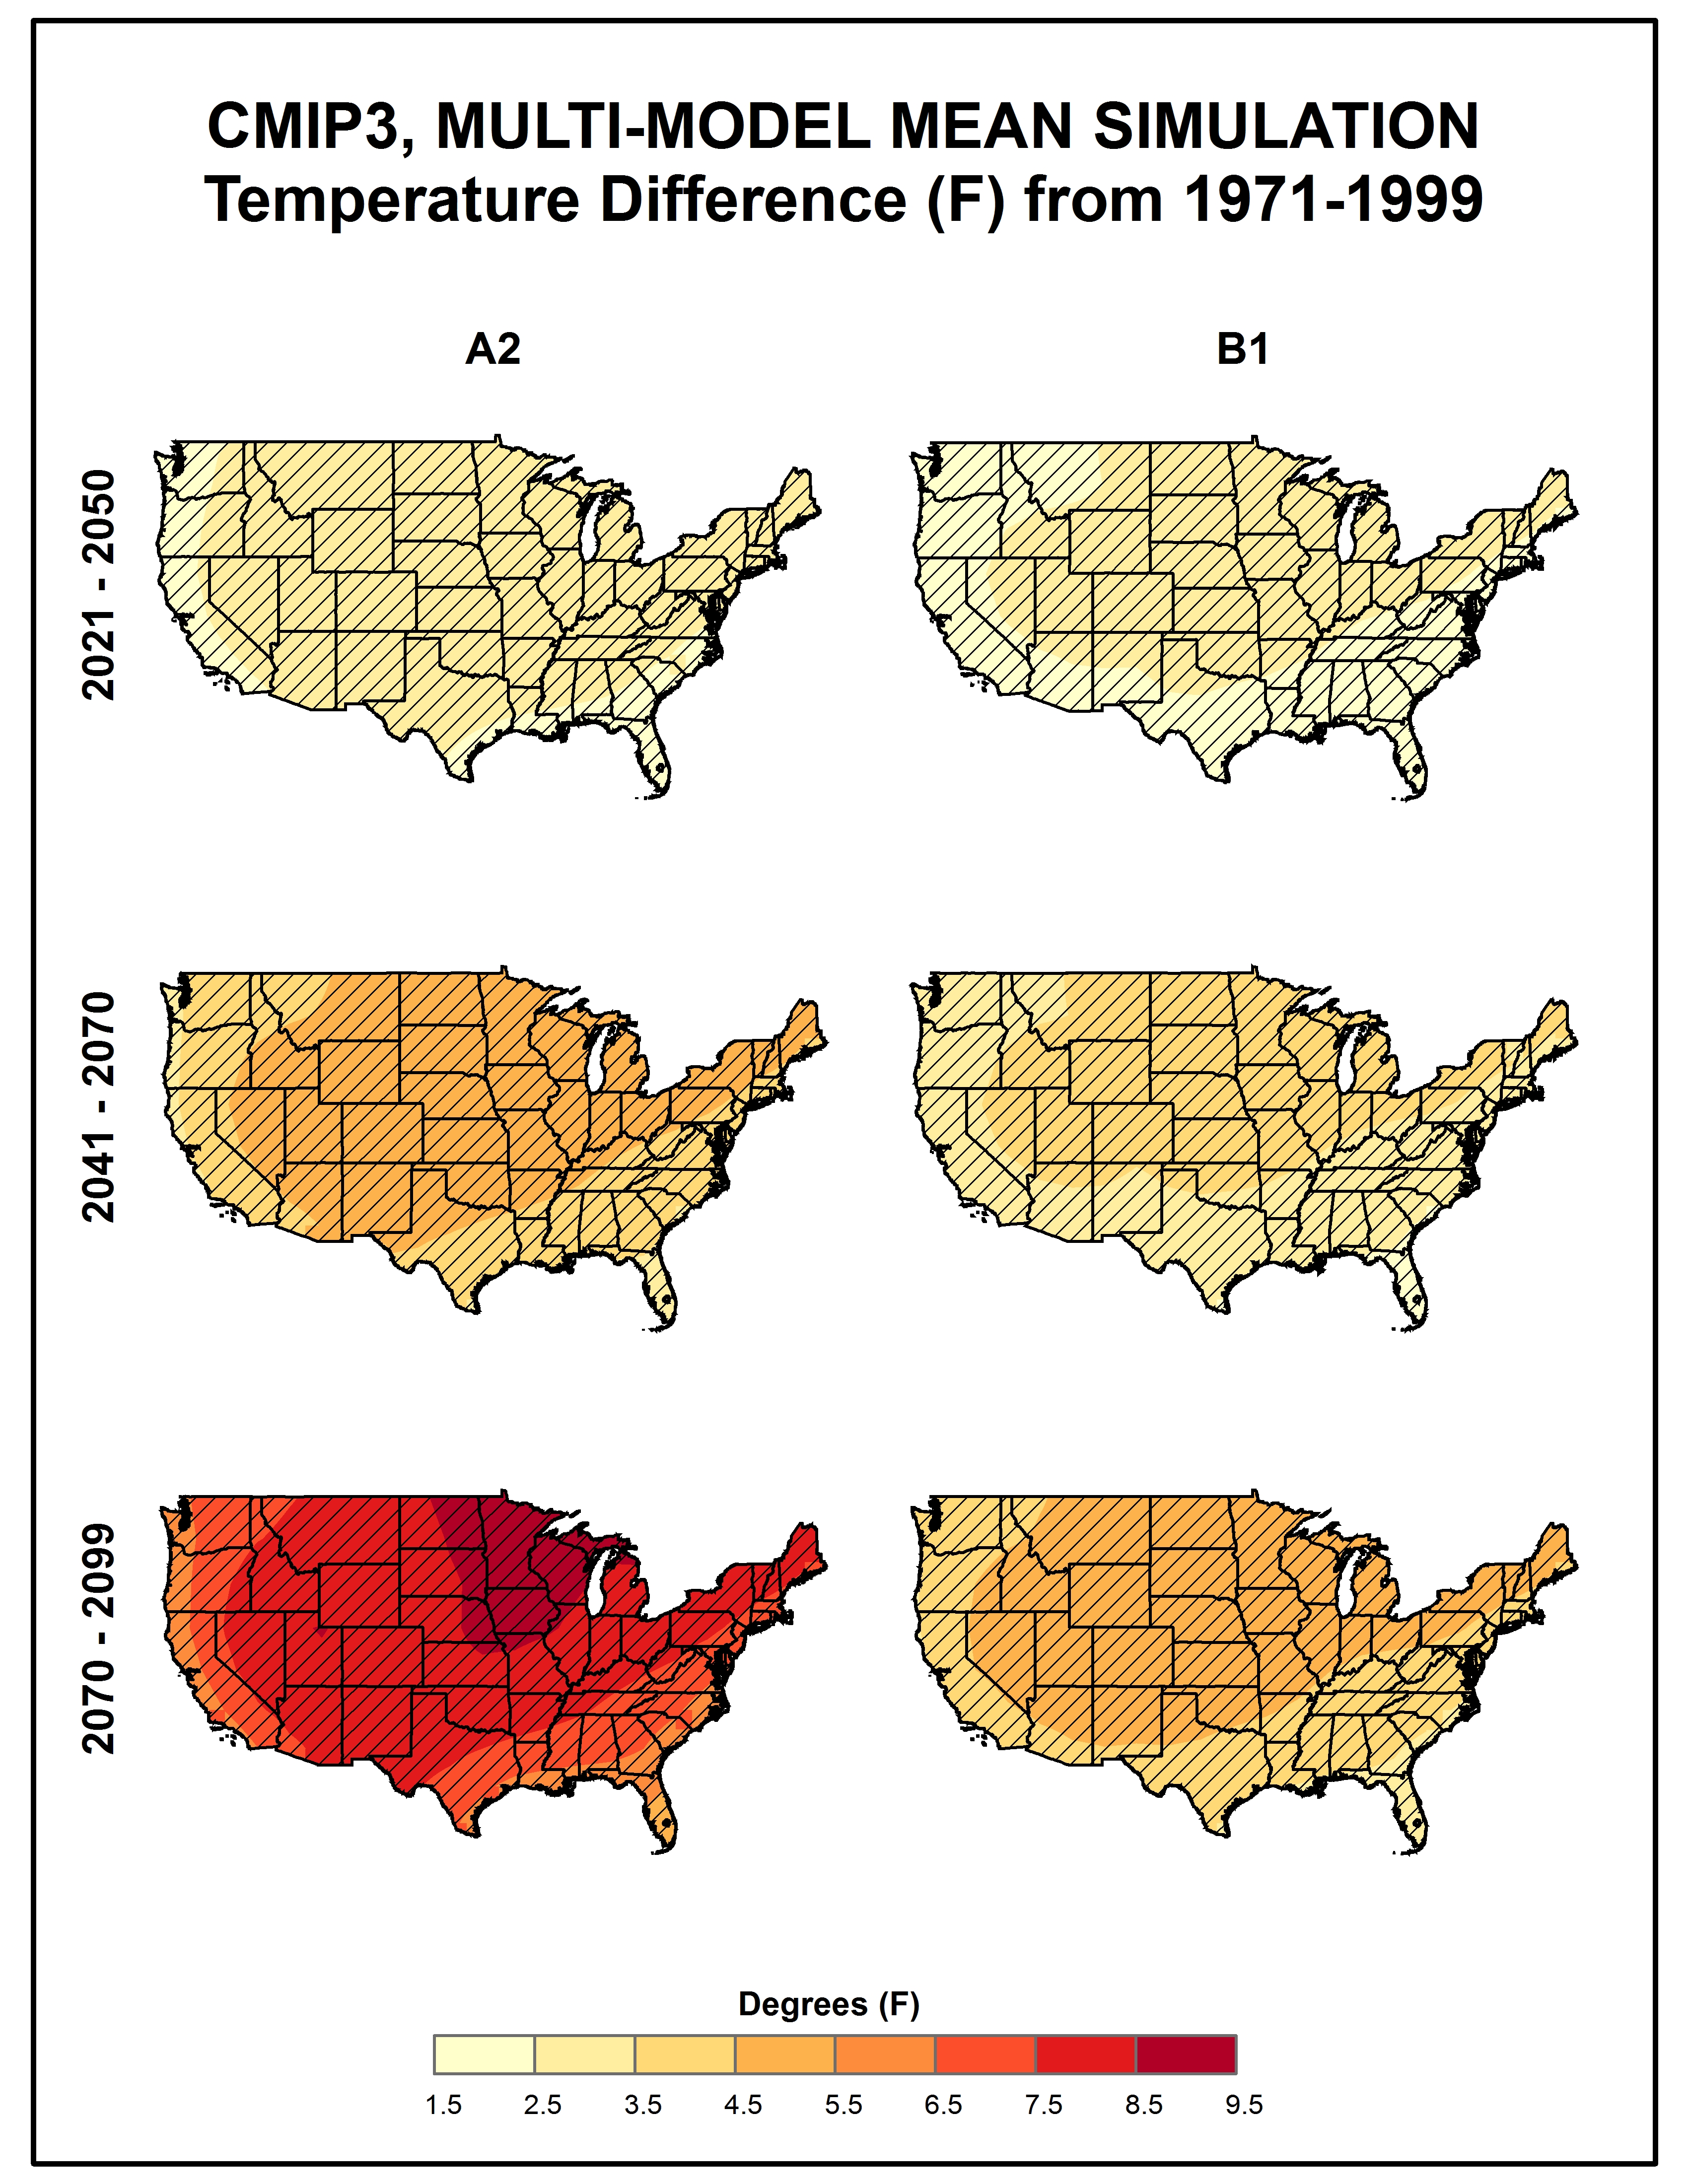
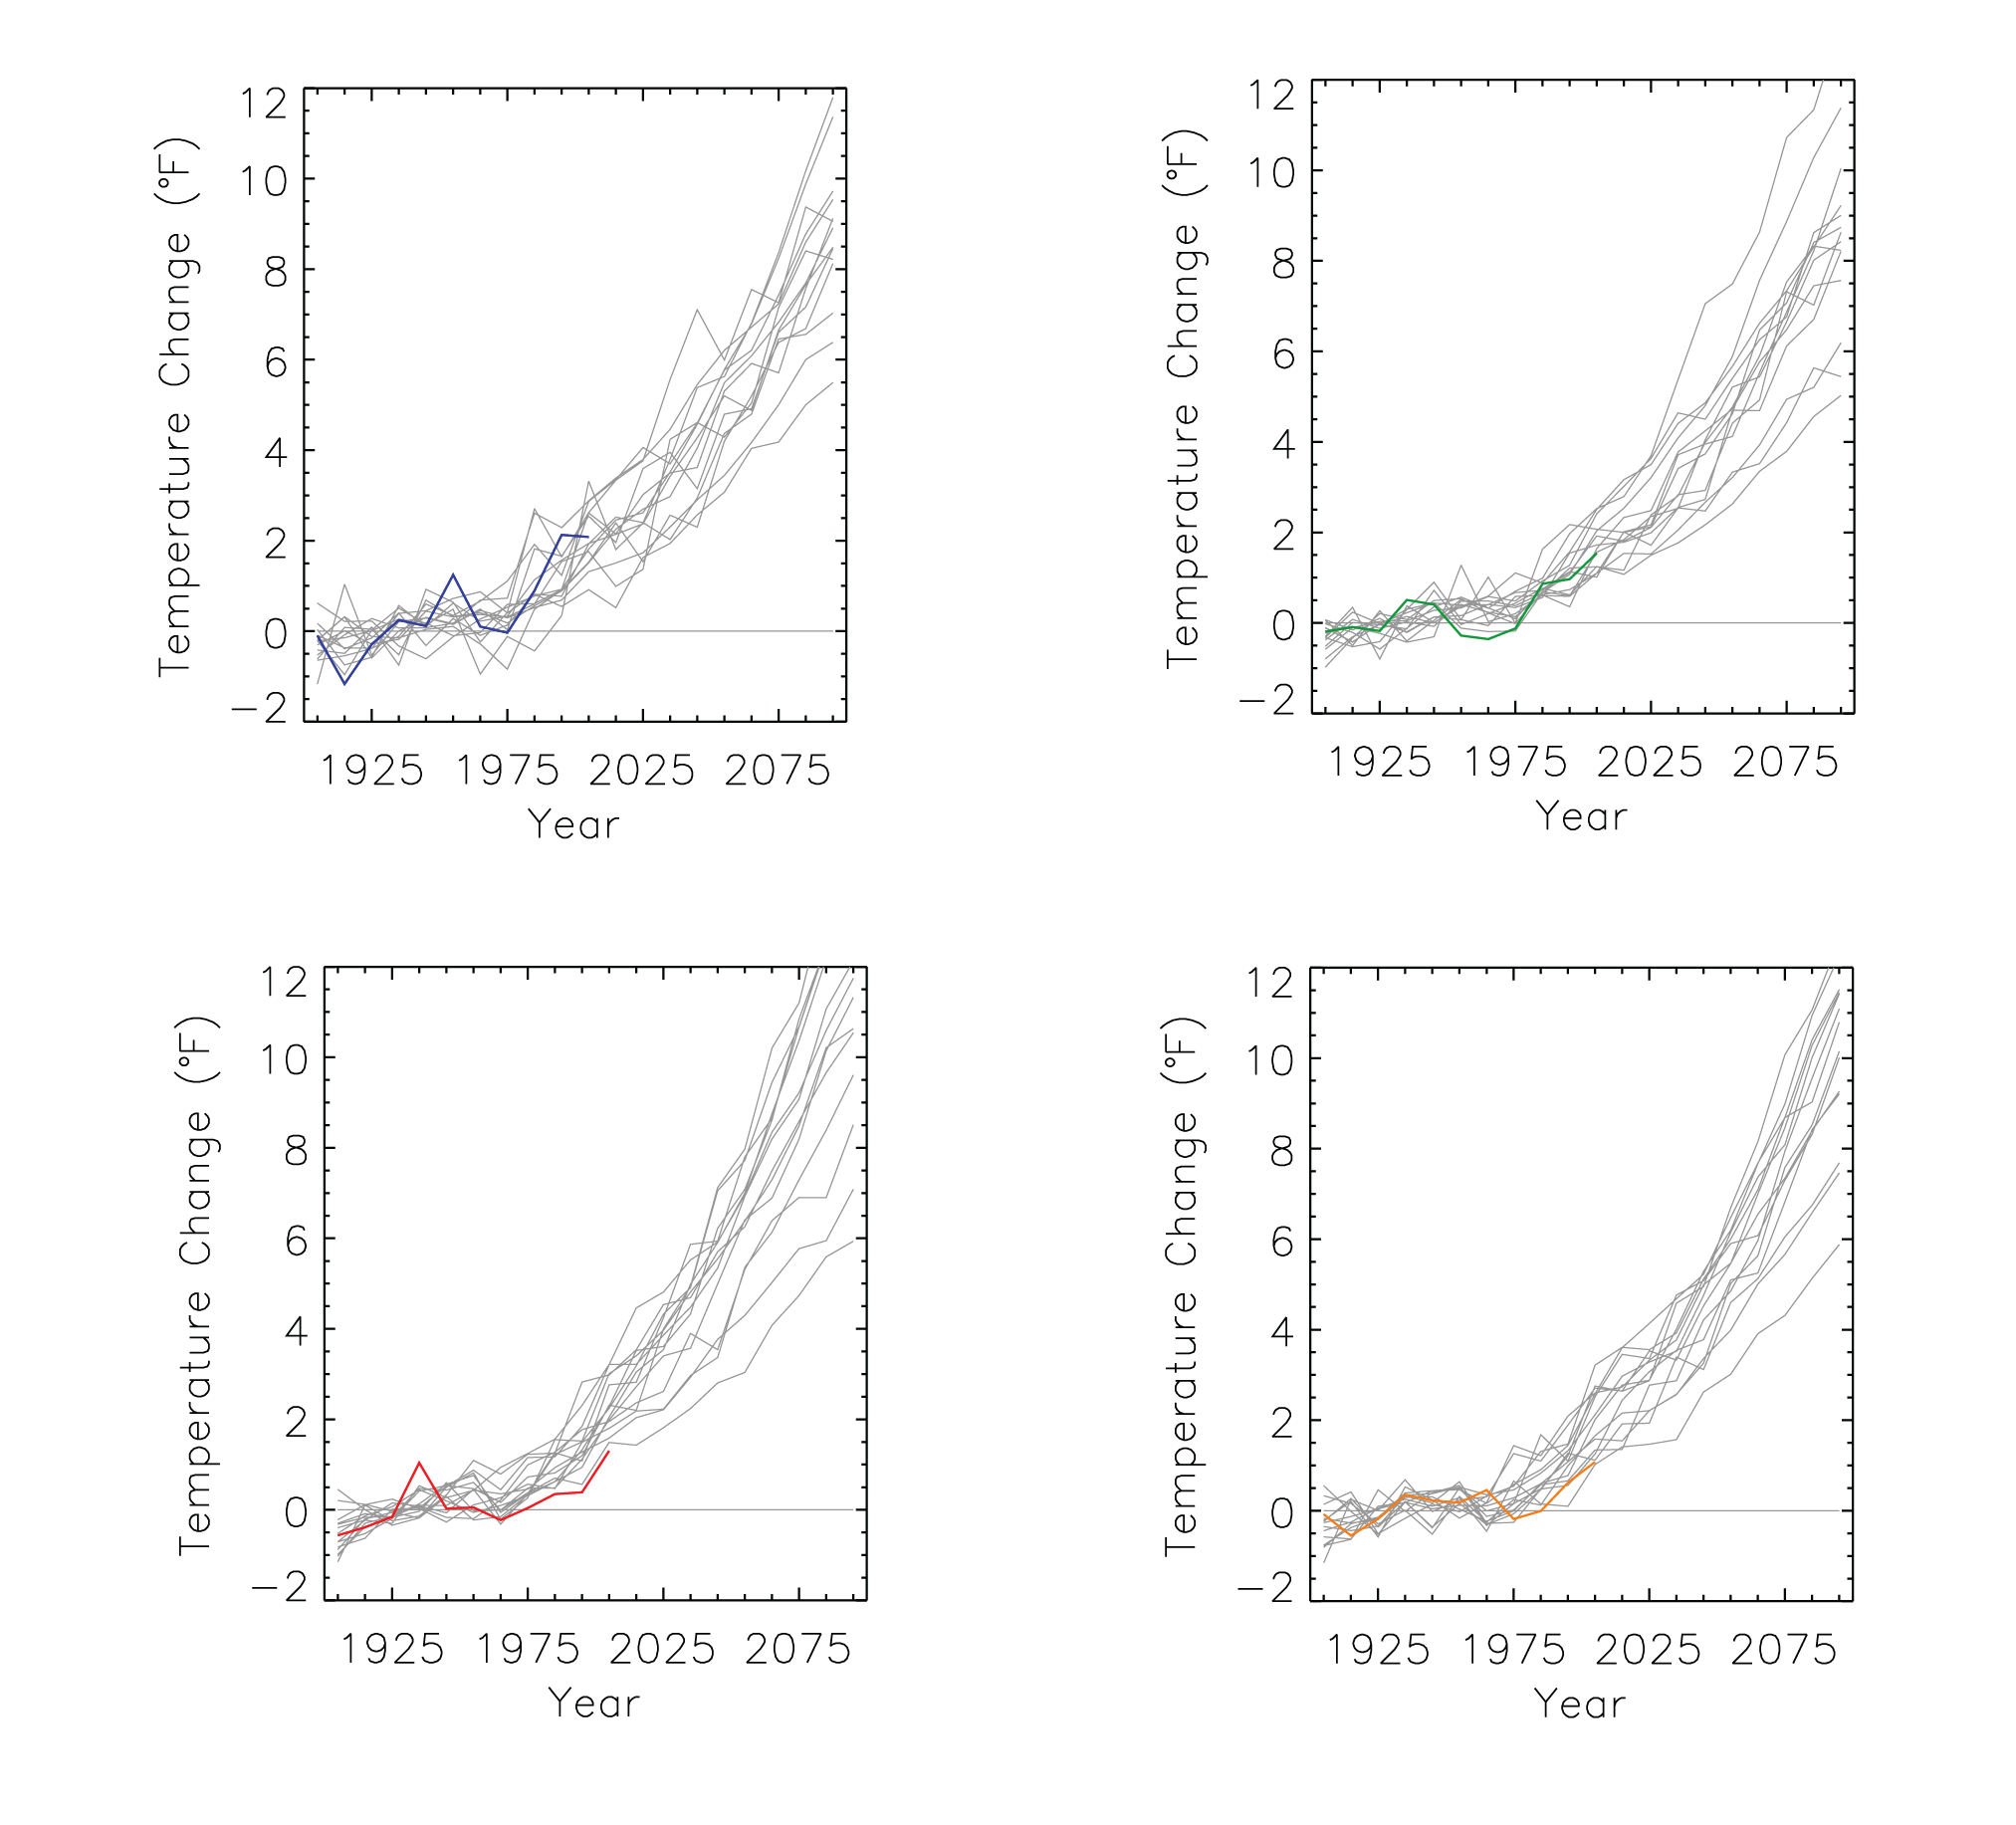
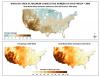
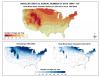
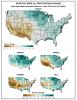
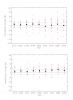
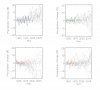
Simulated difference in annual and seasonal mean temperature |
NCA 3 |
 |
|
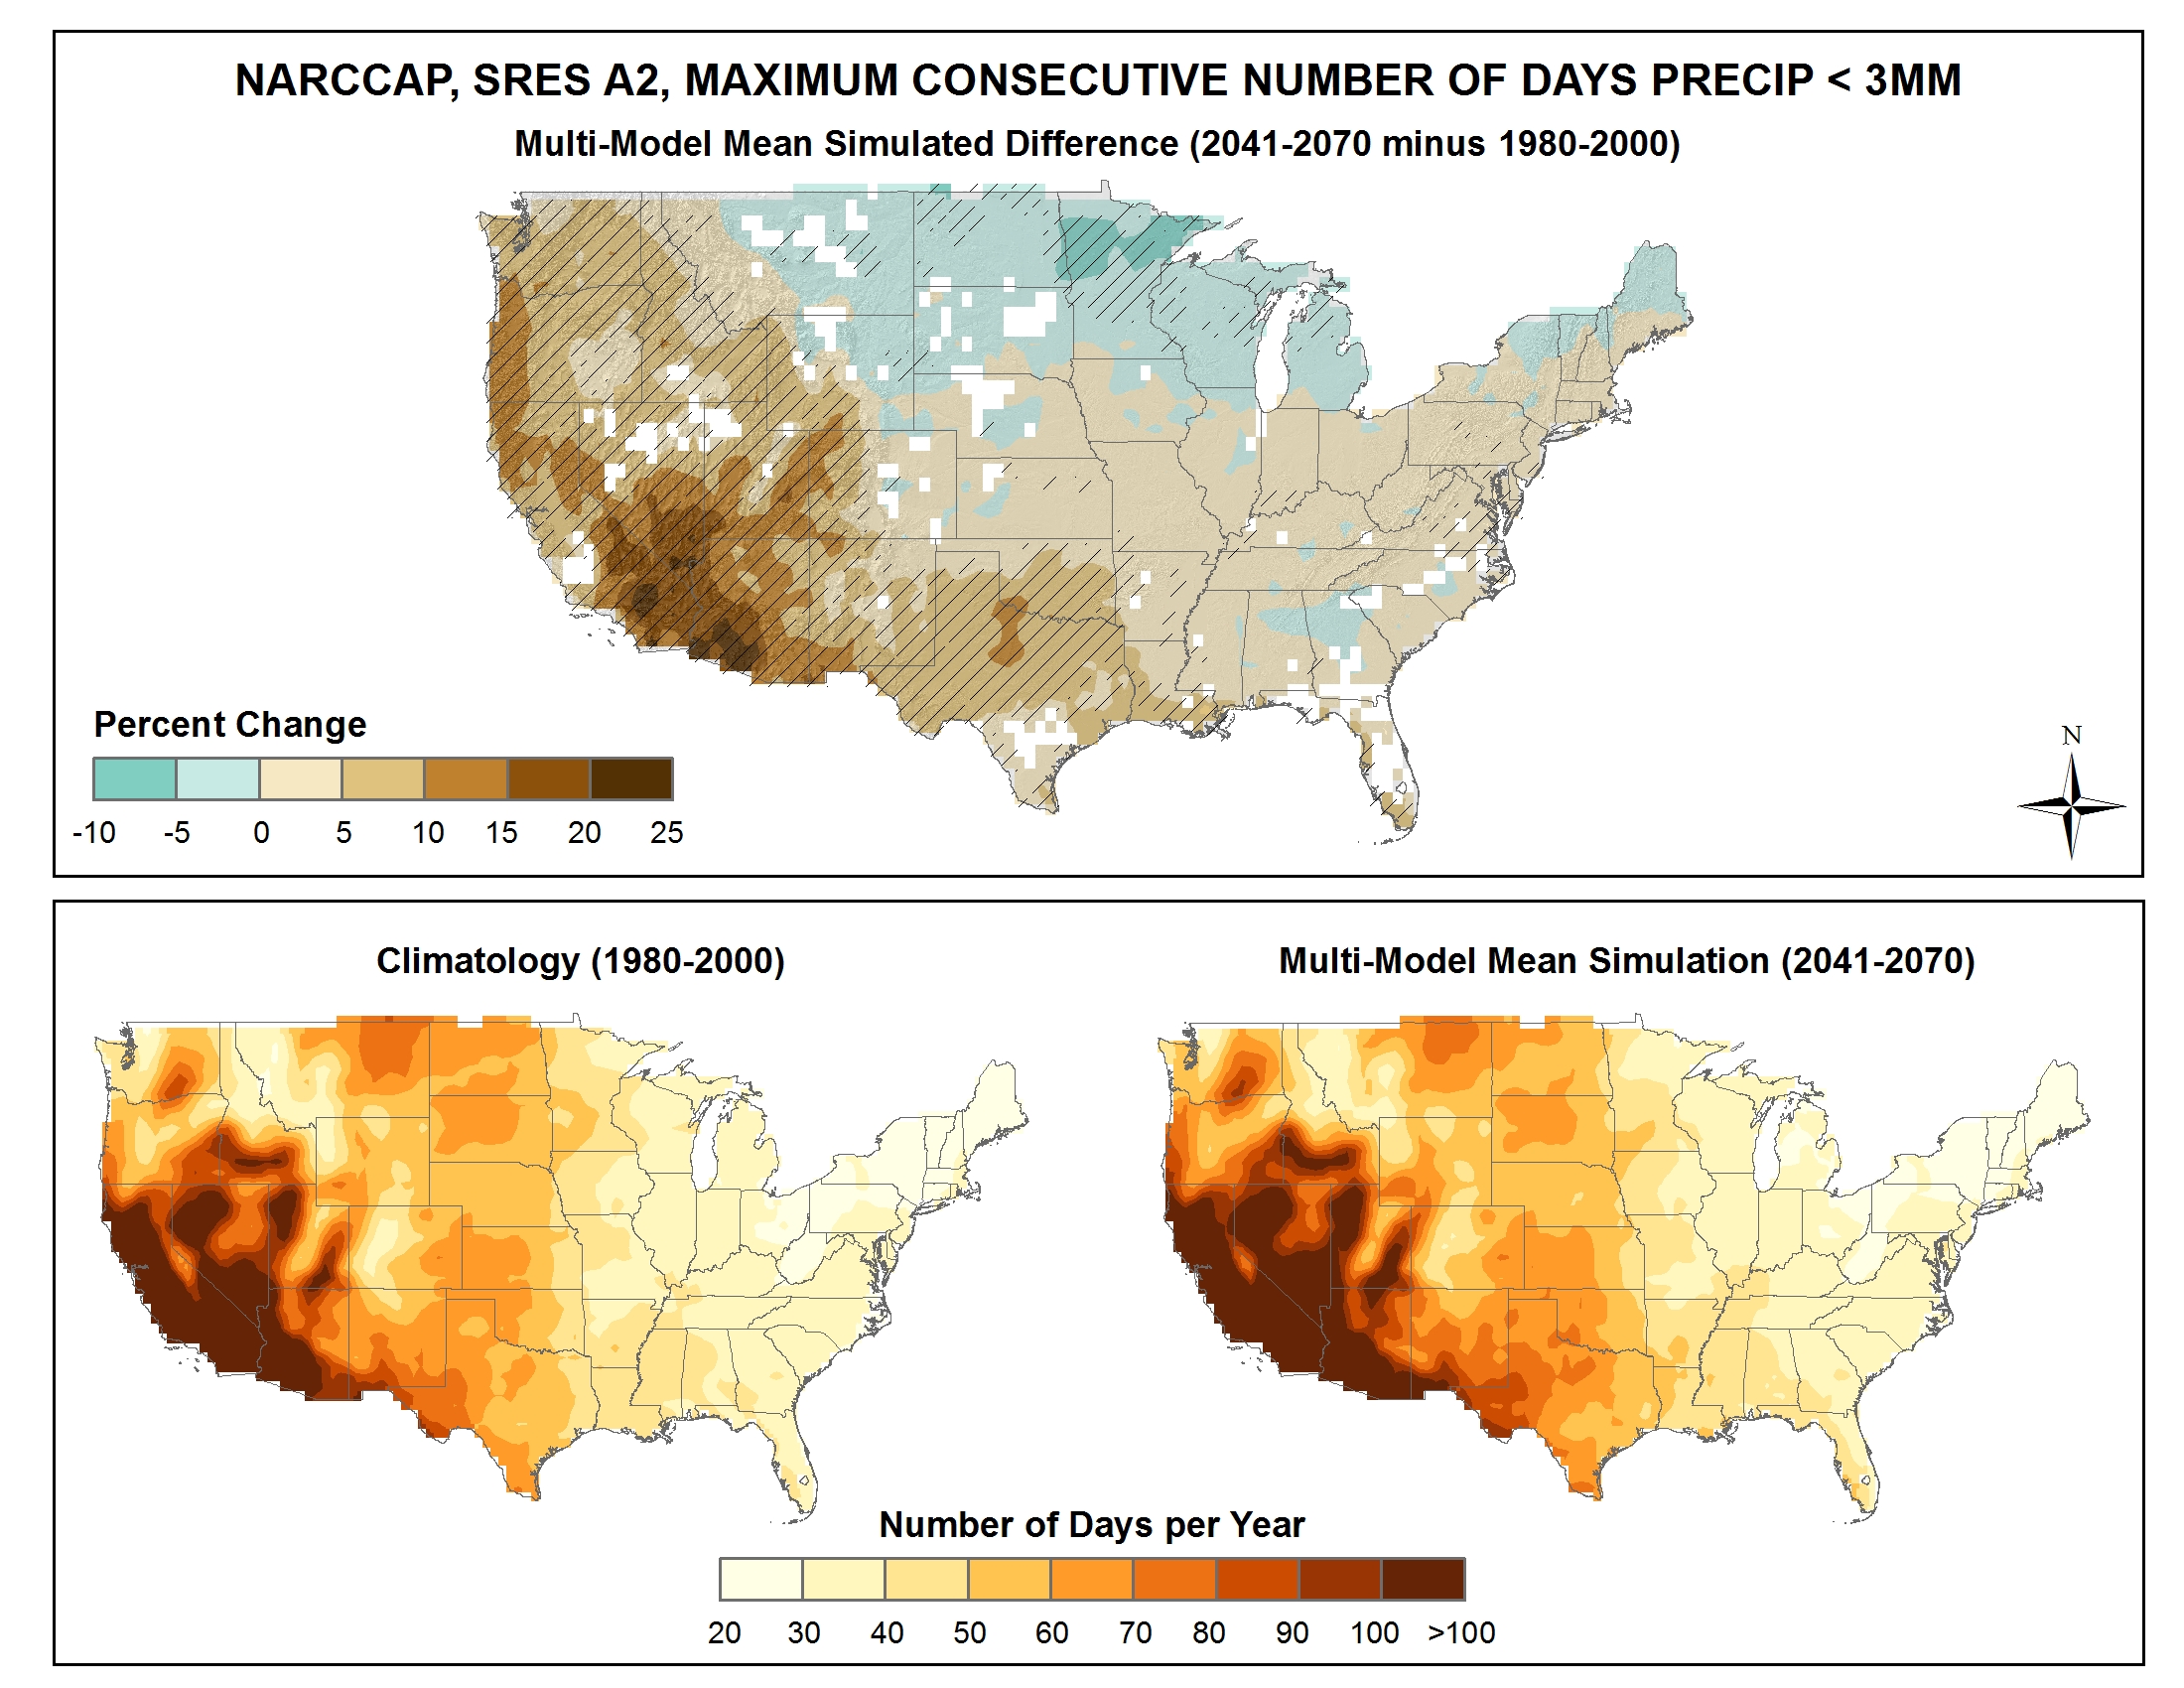
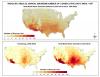
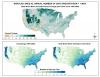
Simulated difference in the mean annual maximum number of consecutive days with precipitation of less than 0.1 inches |
NCA 3 |
 |
|
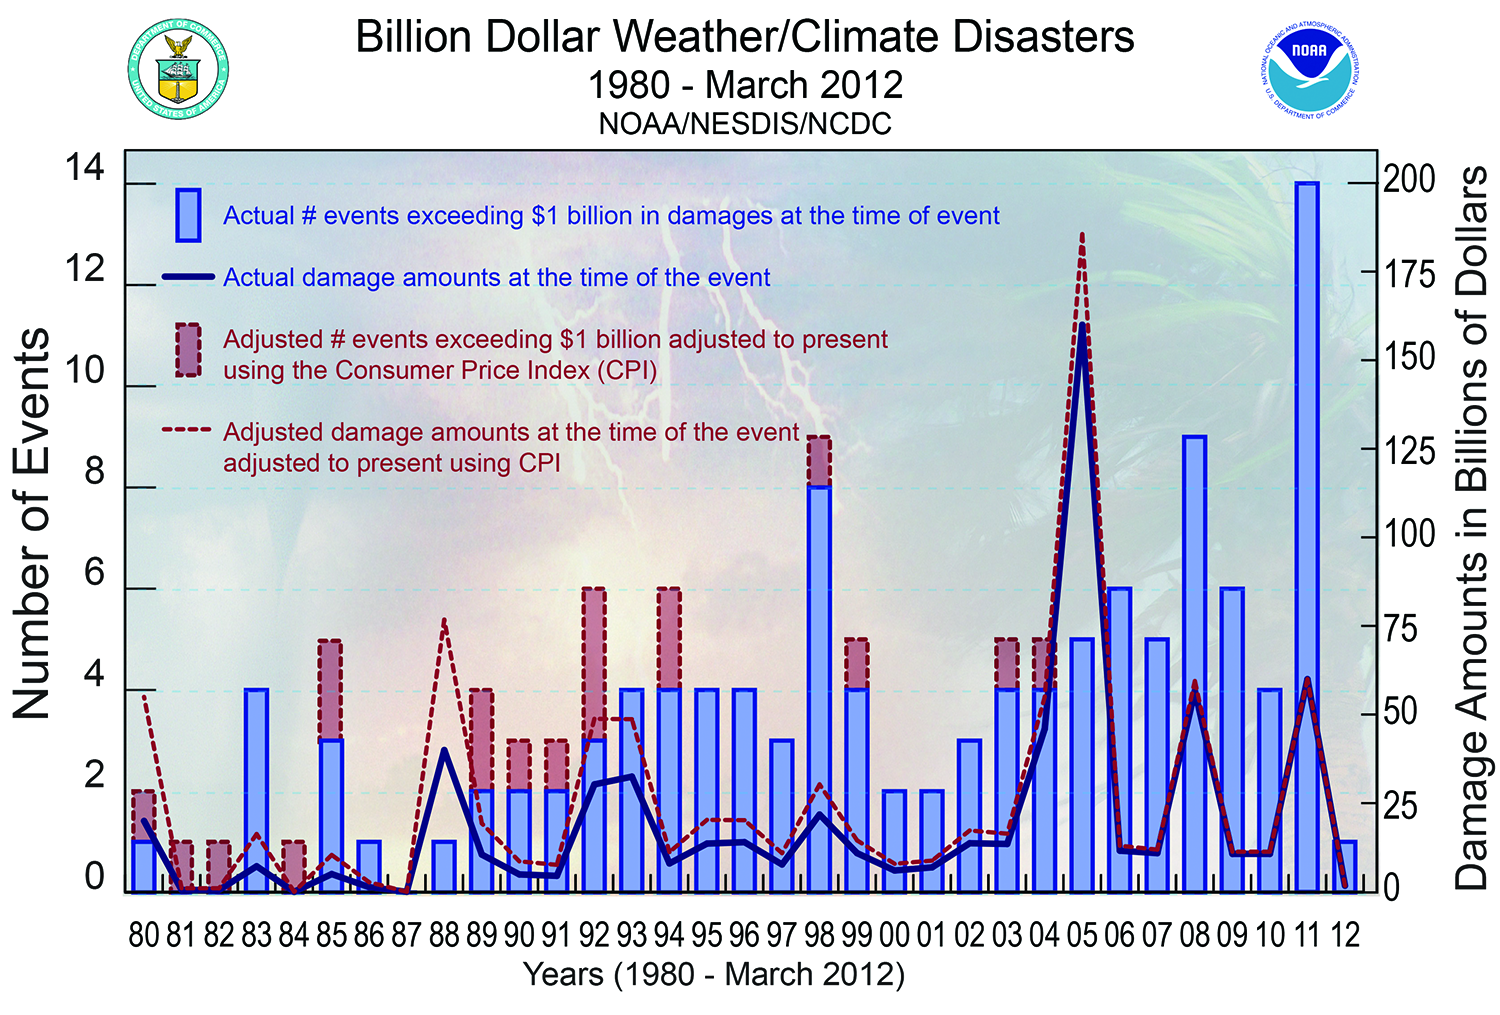
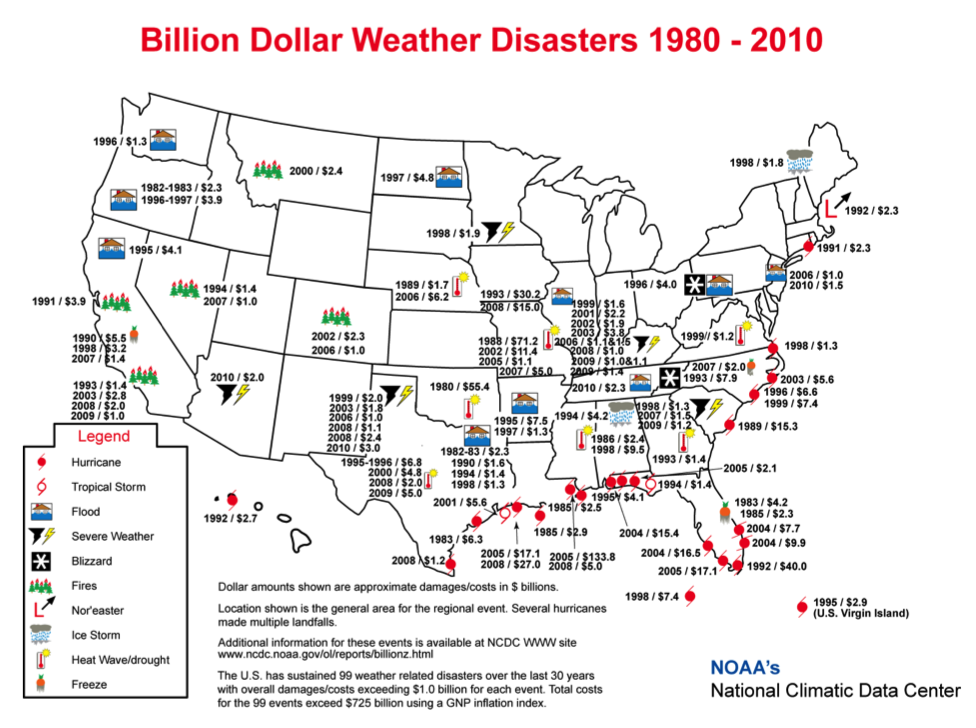
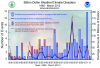
Annual number of climate events causing at least $1 billion in losses in the United States |
NCA 3 |
 |
|
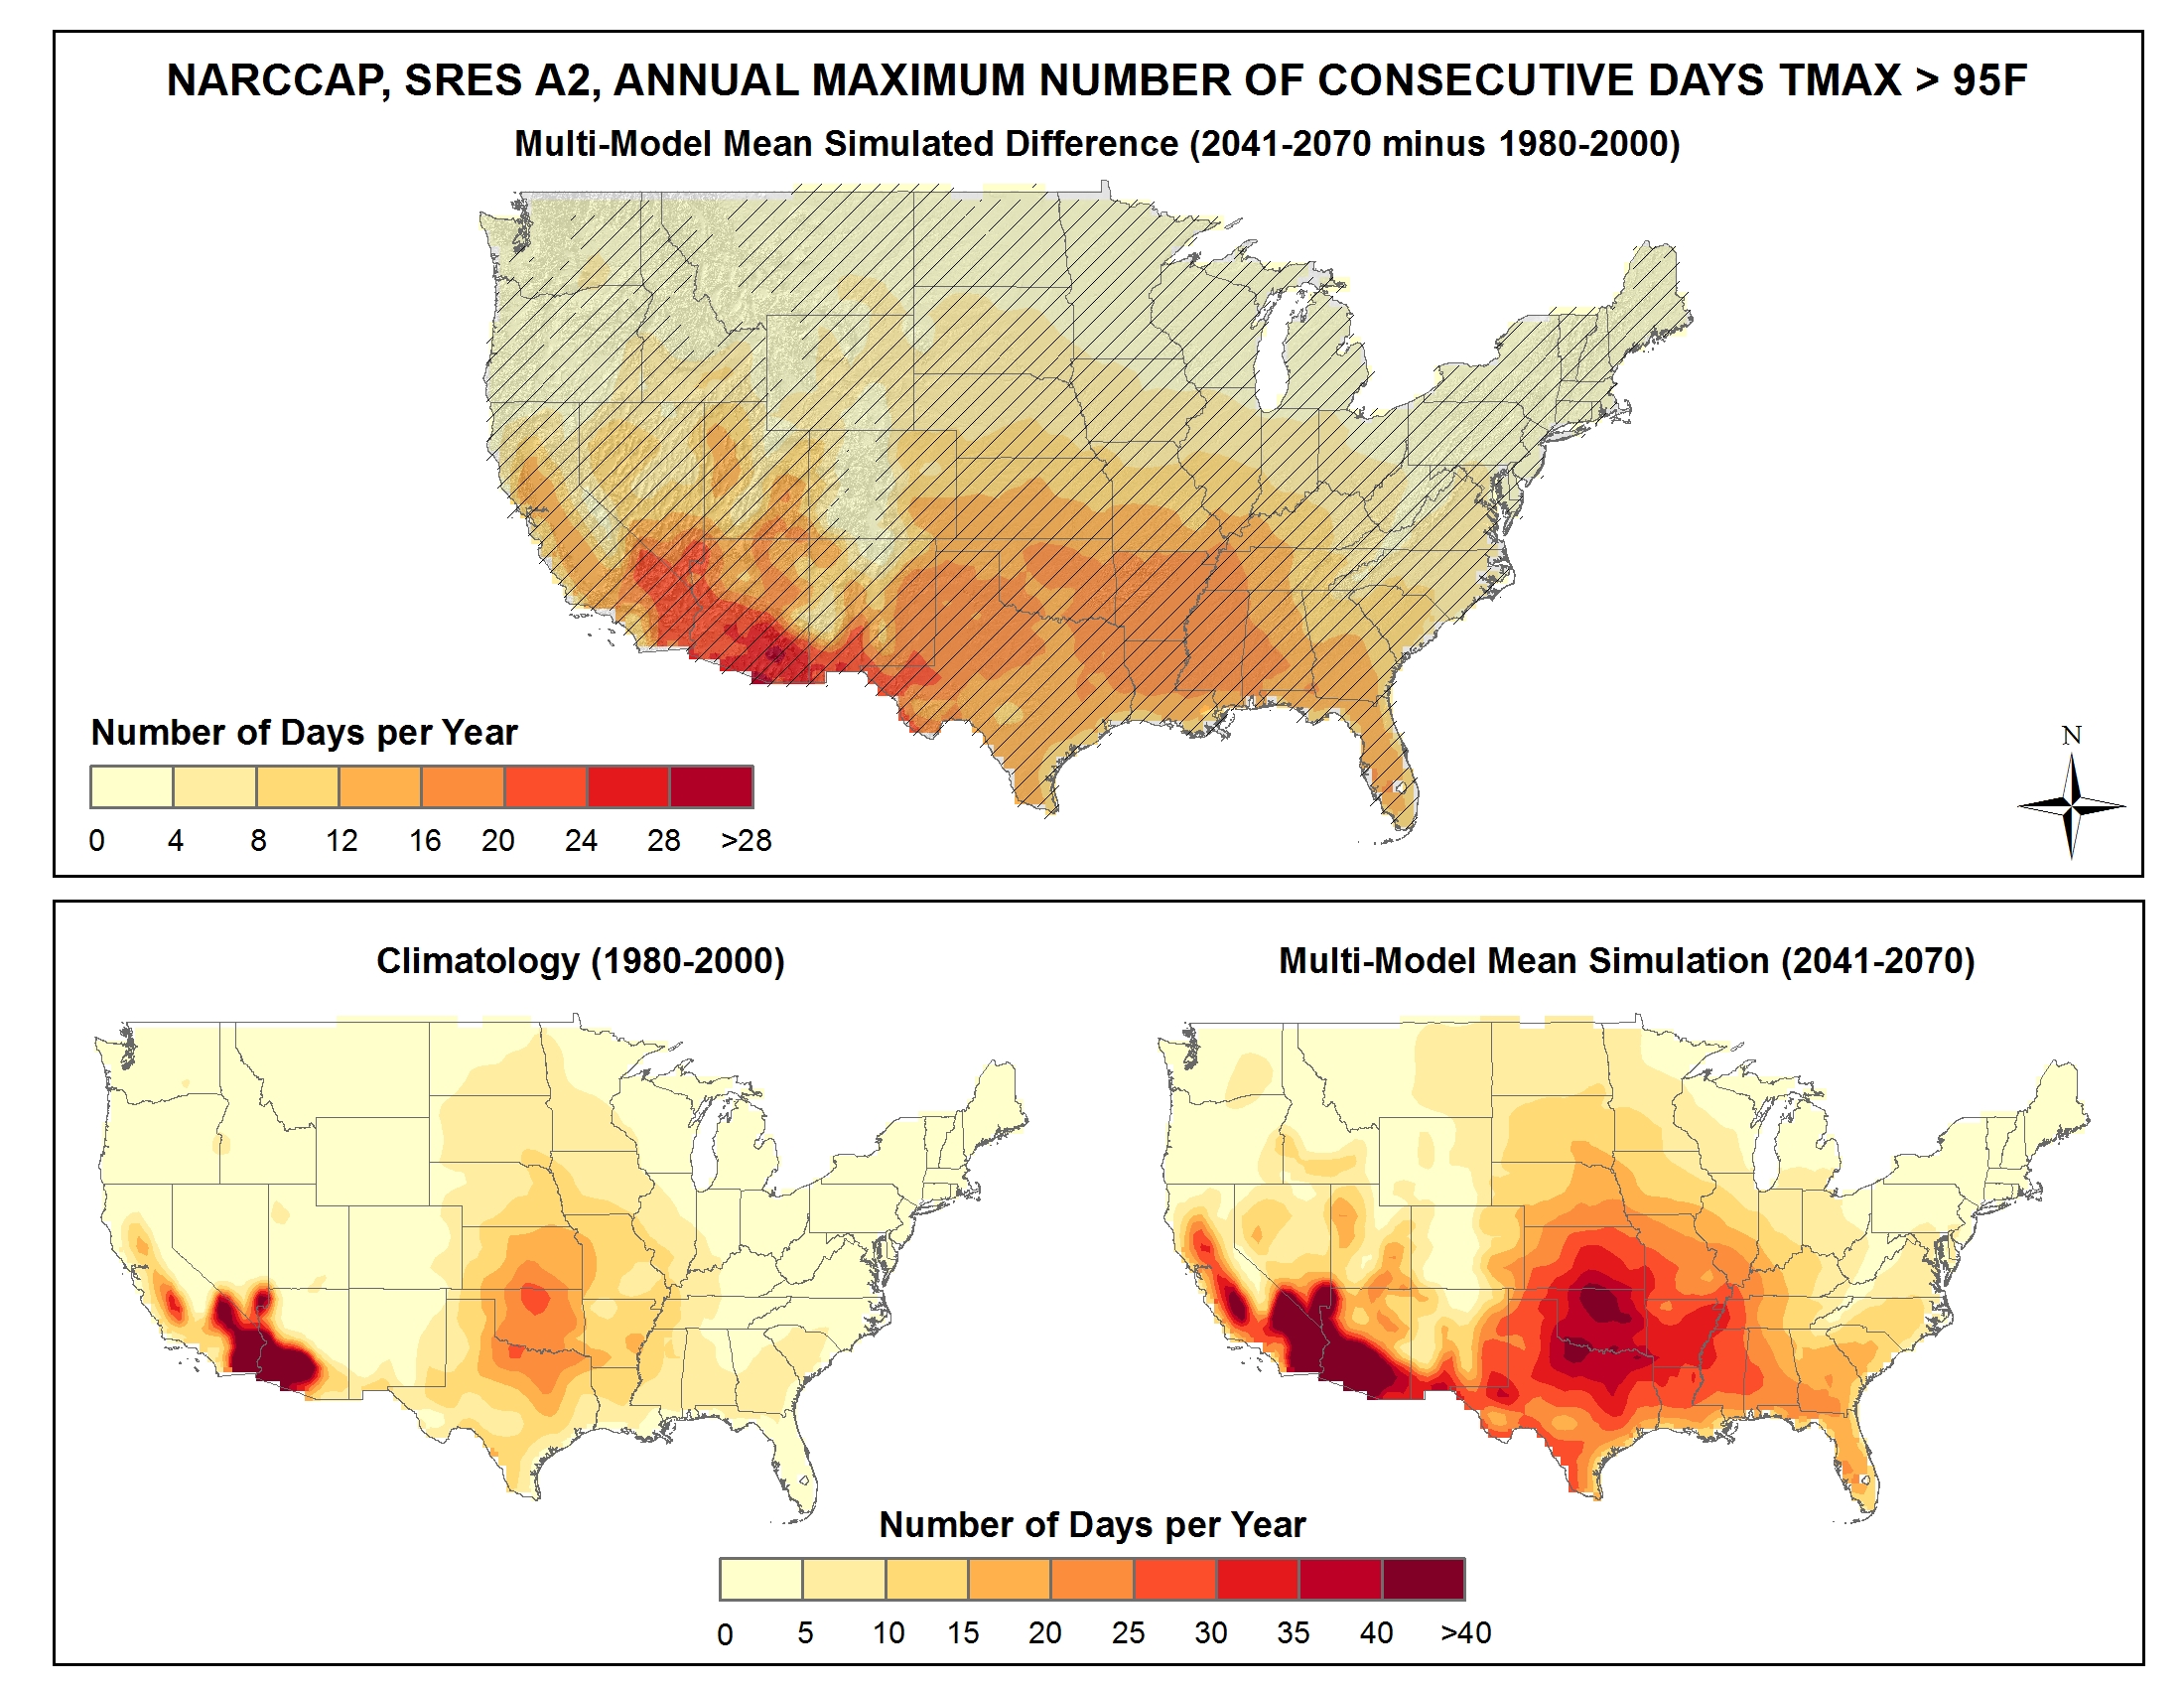
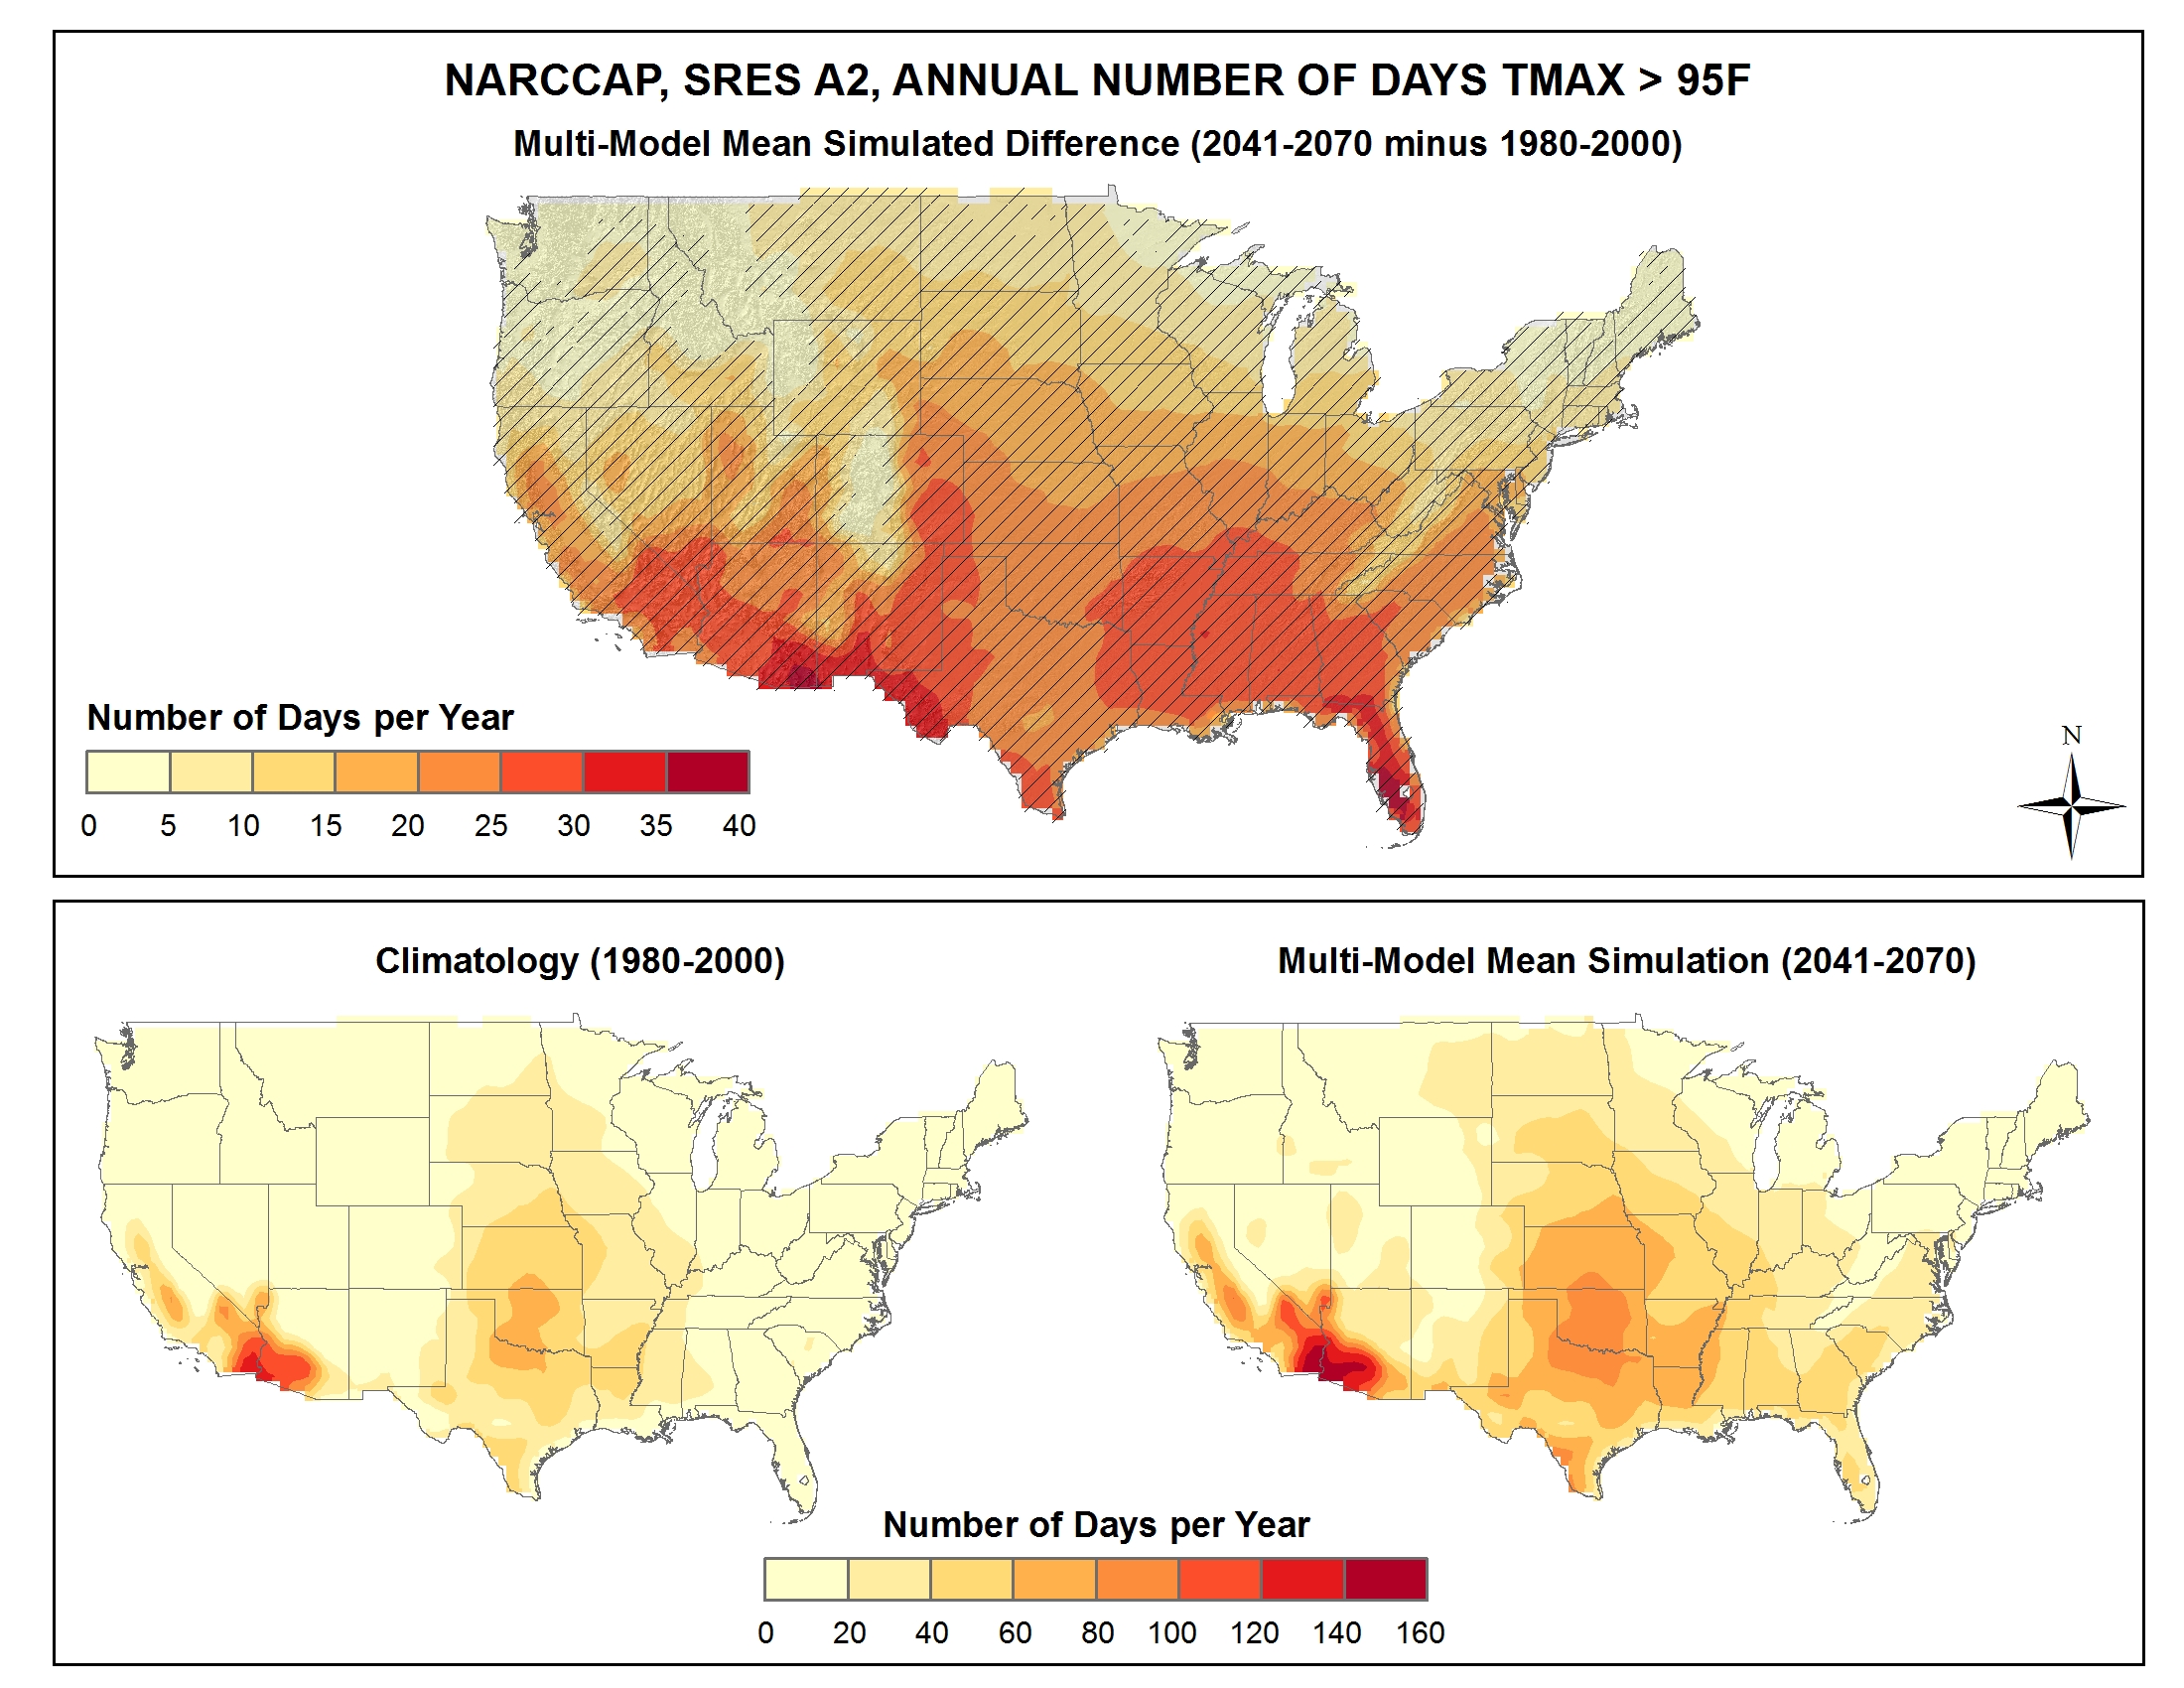
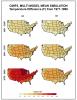
Simulated difference in the mean annual maximum number of consecutive days with a maximum temperature greater than 95F |
NCA 3 |
 |
|
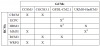
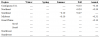
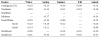
NARCCAP Models Listing |
NCA 3 |
 |
|
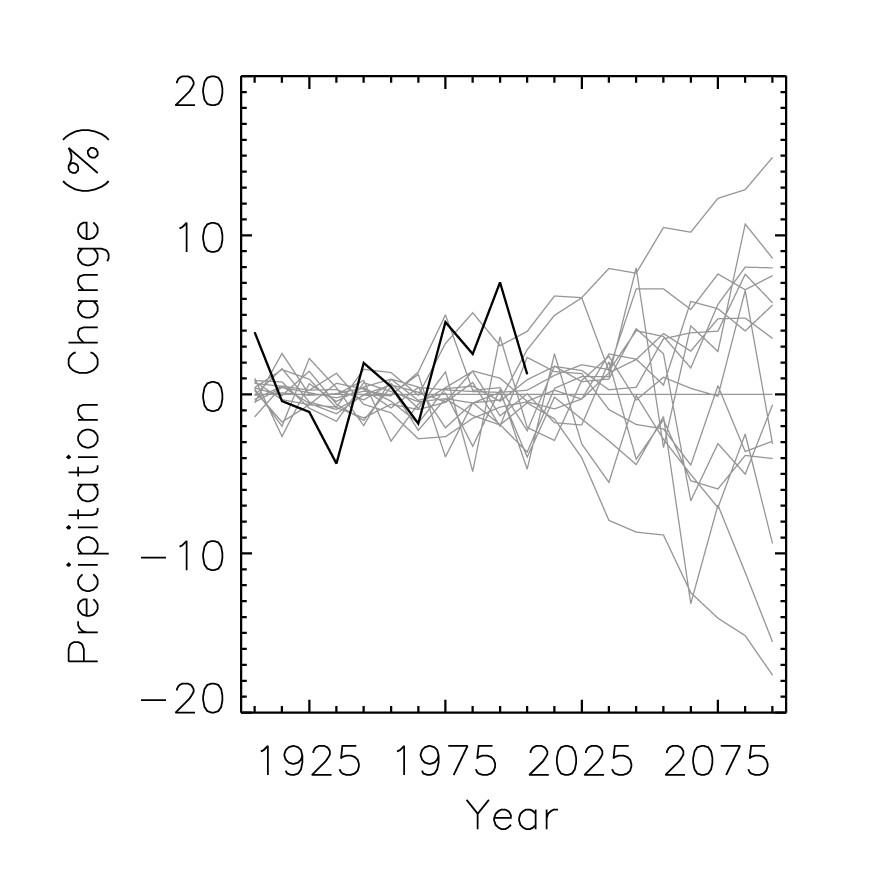
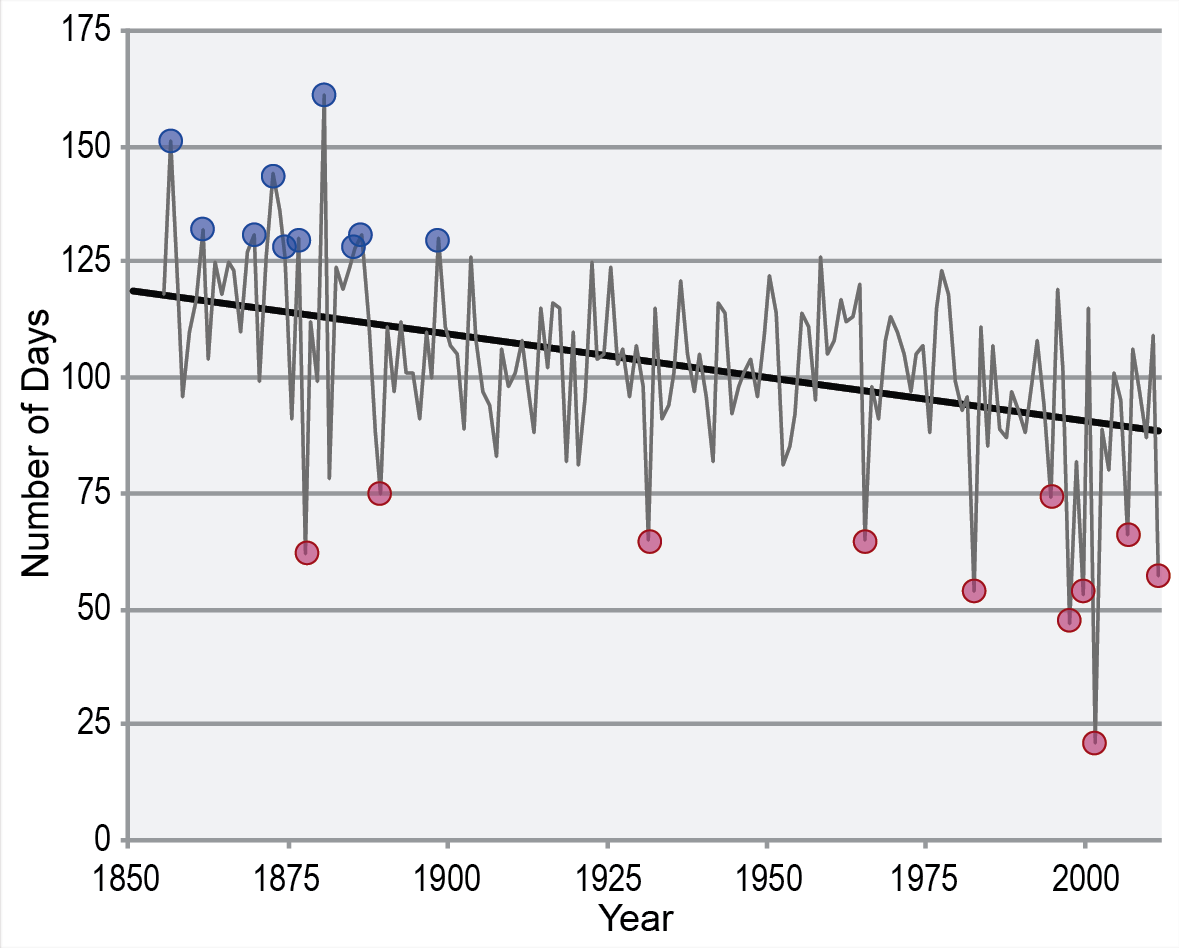
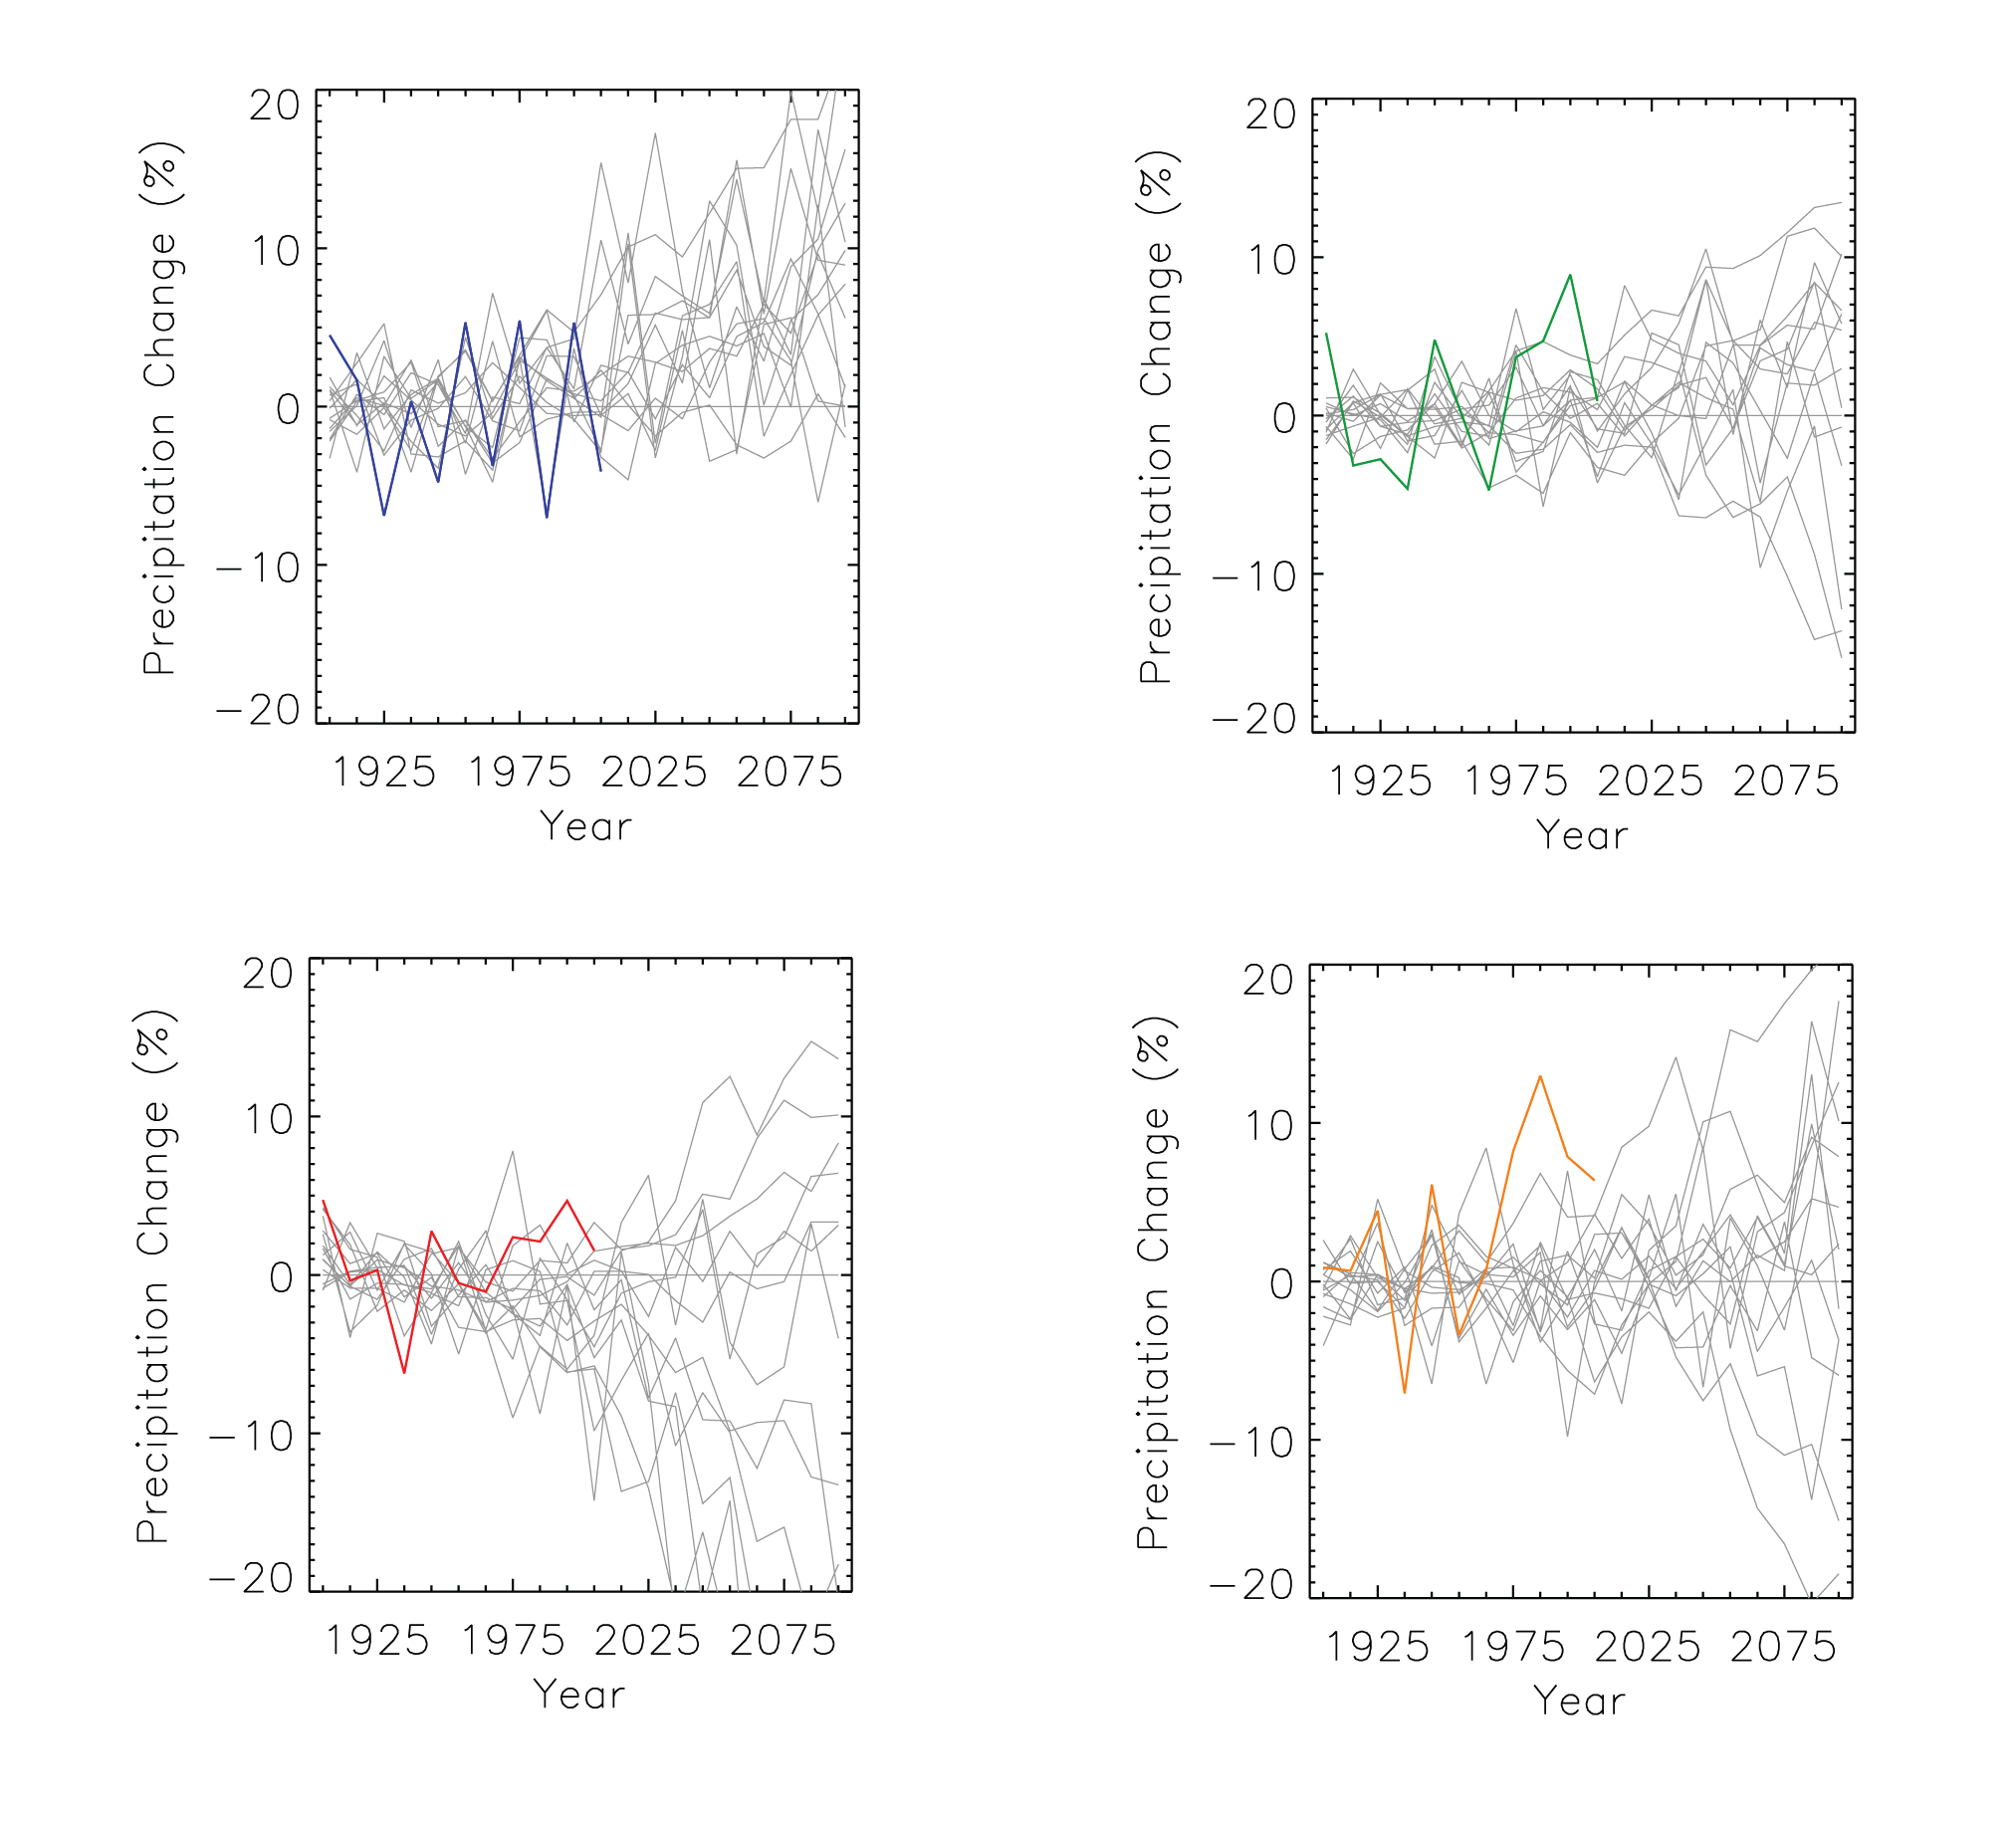
Trends in precipitation anomaly |
NCA 3 |
 |
|
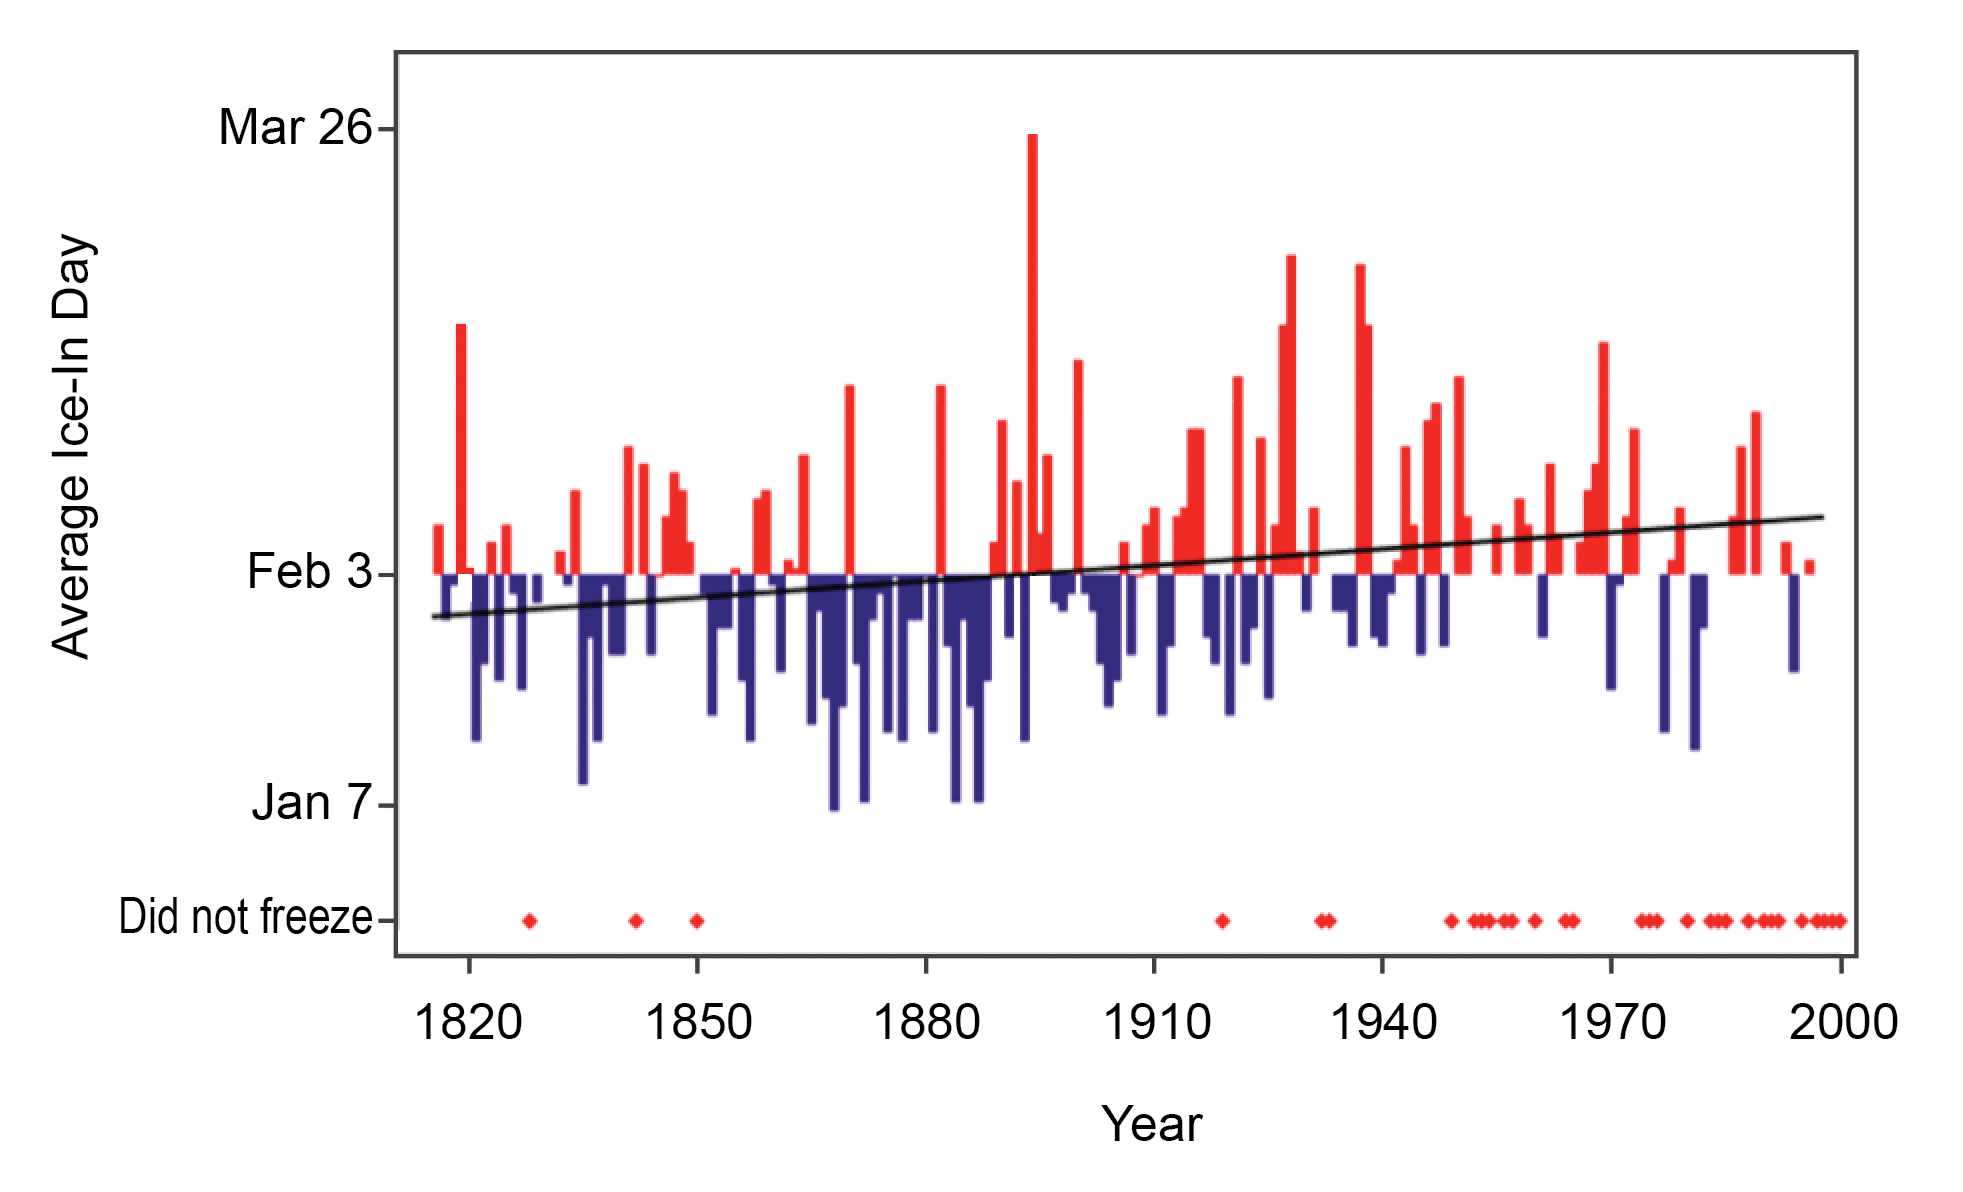
Date of ice-in on the main portion of Lake Champlain |
NCA 3 |
 |
|
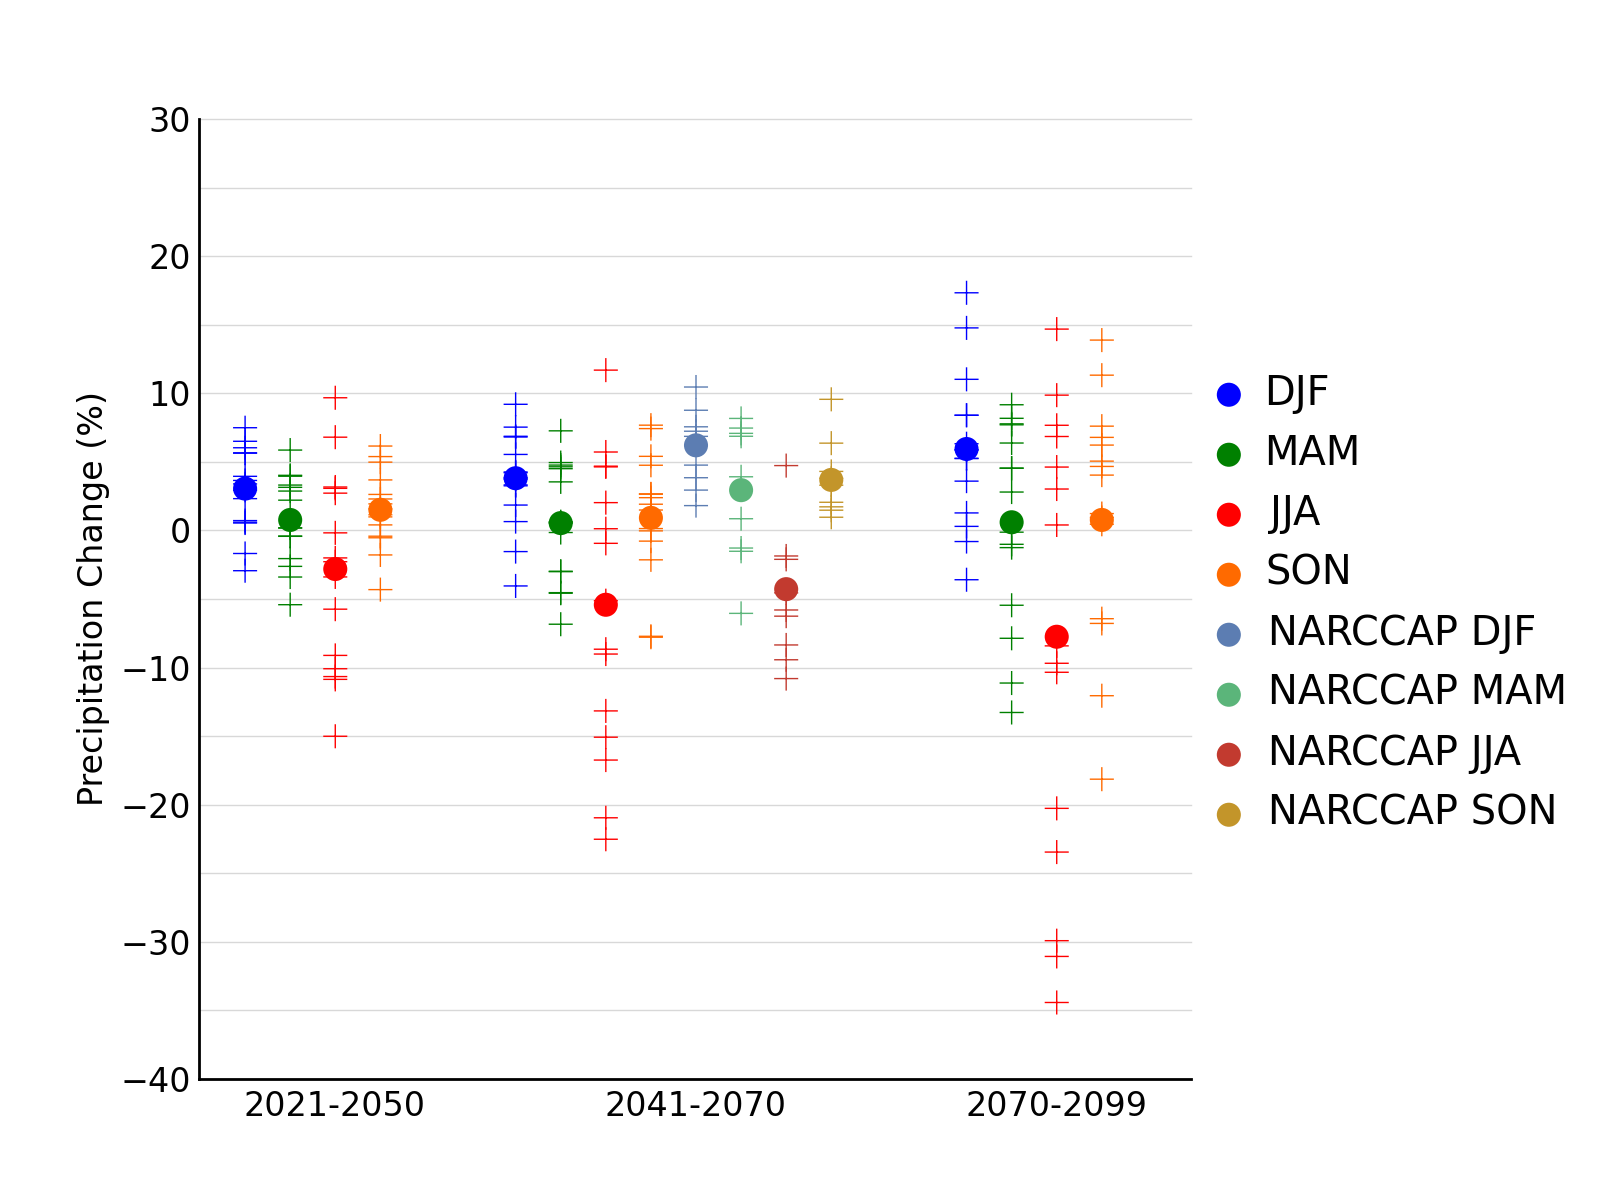
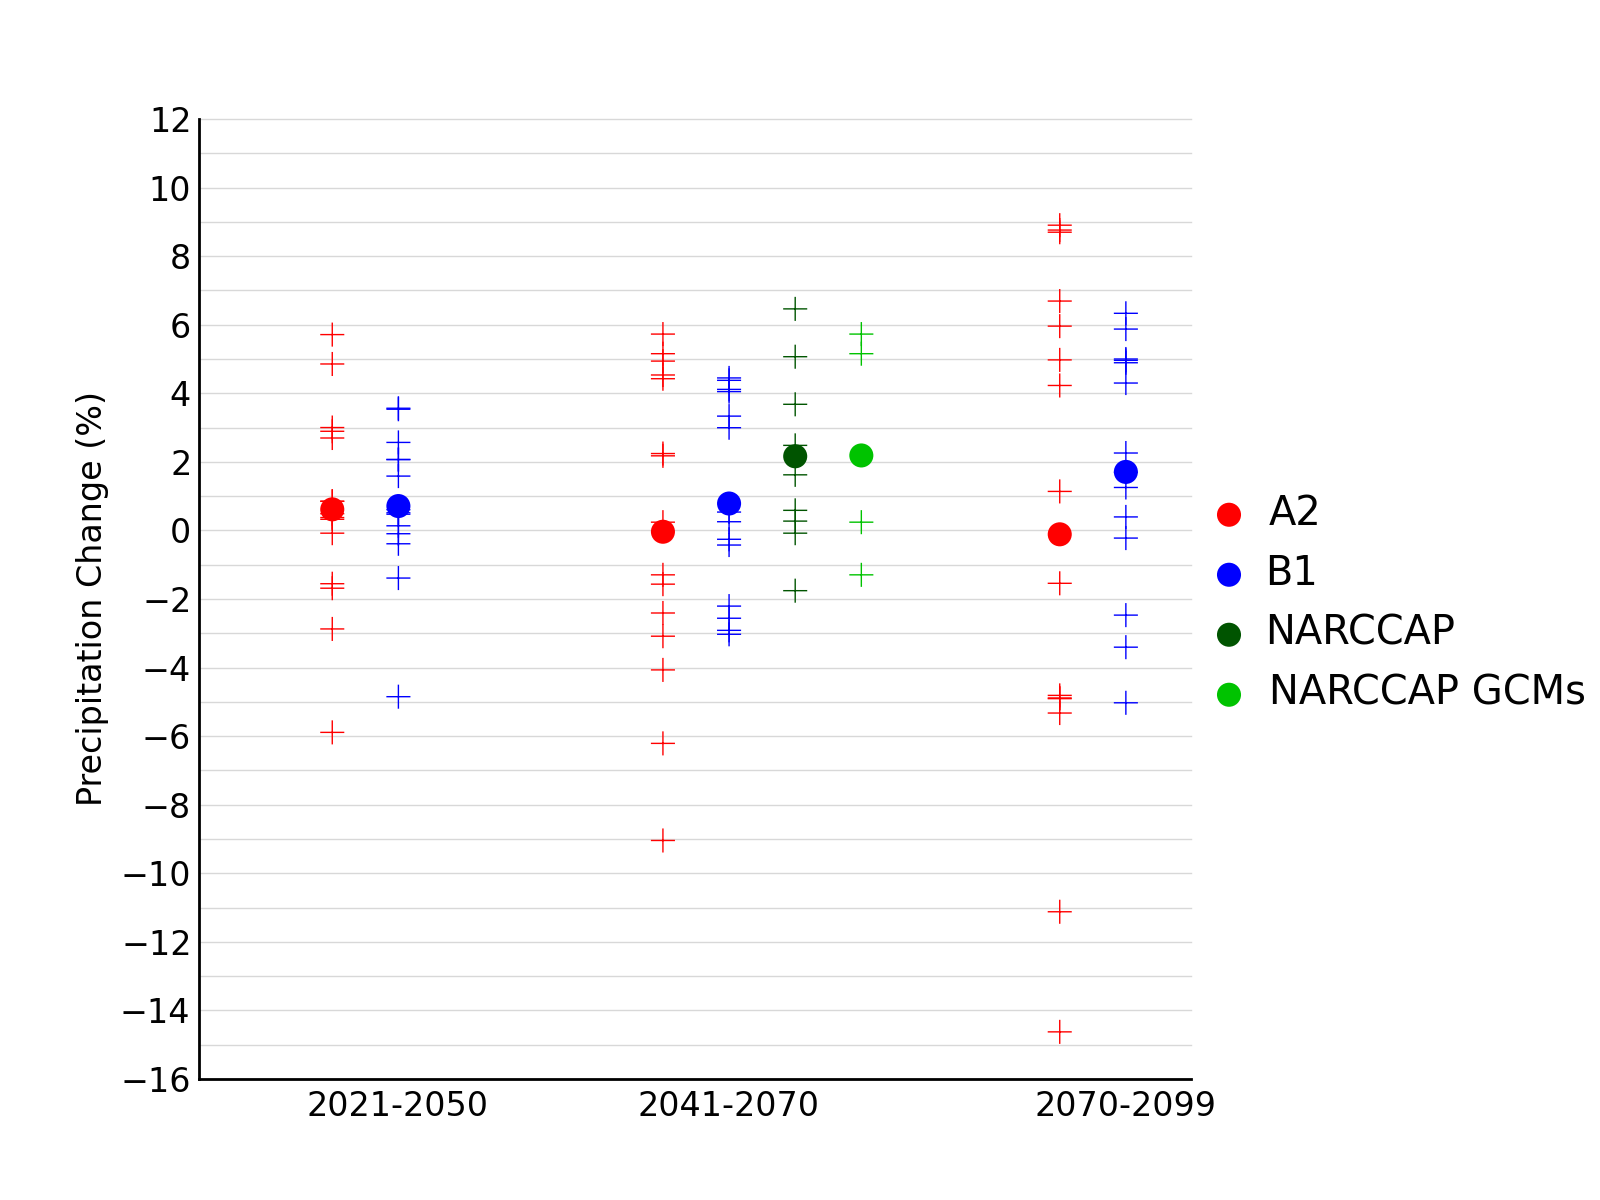
Simulated seasonal mean precipitation change |
NCA 3 |
 |
|
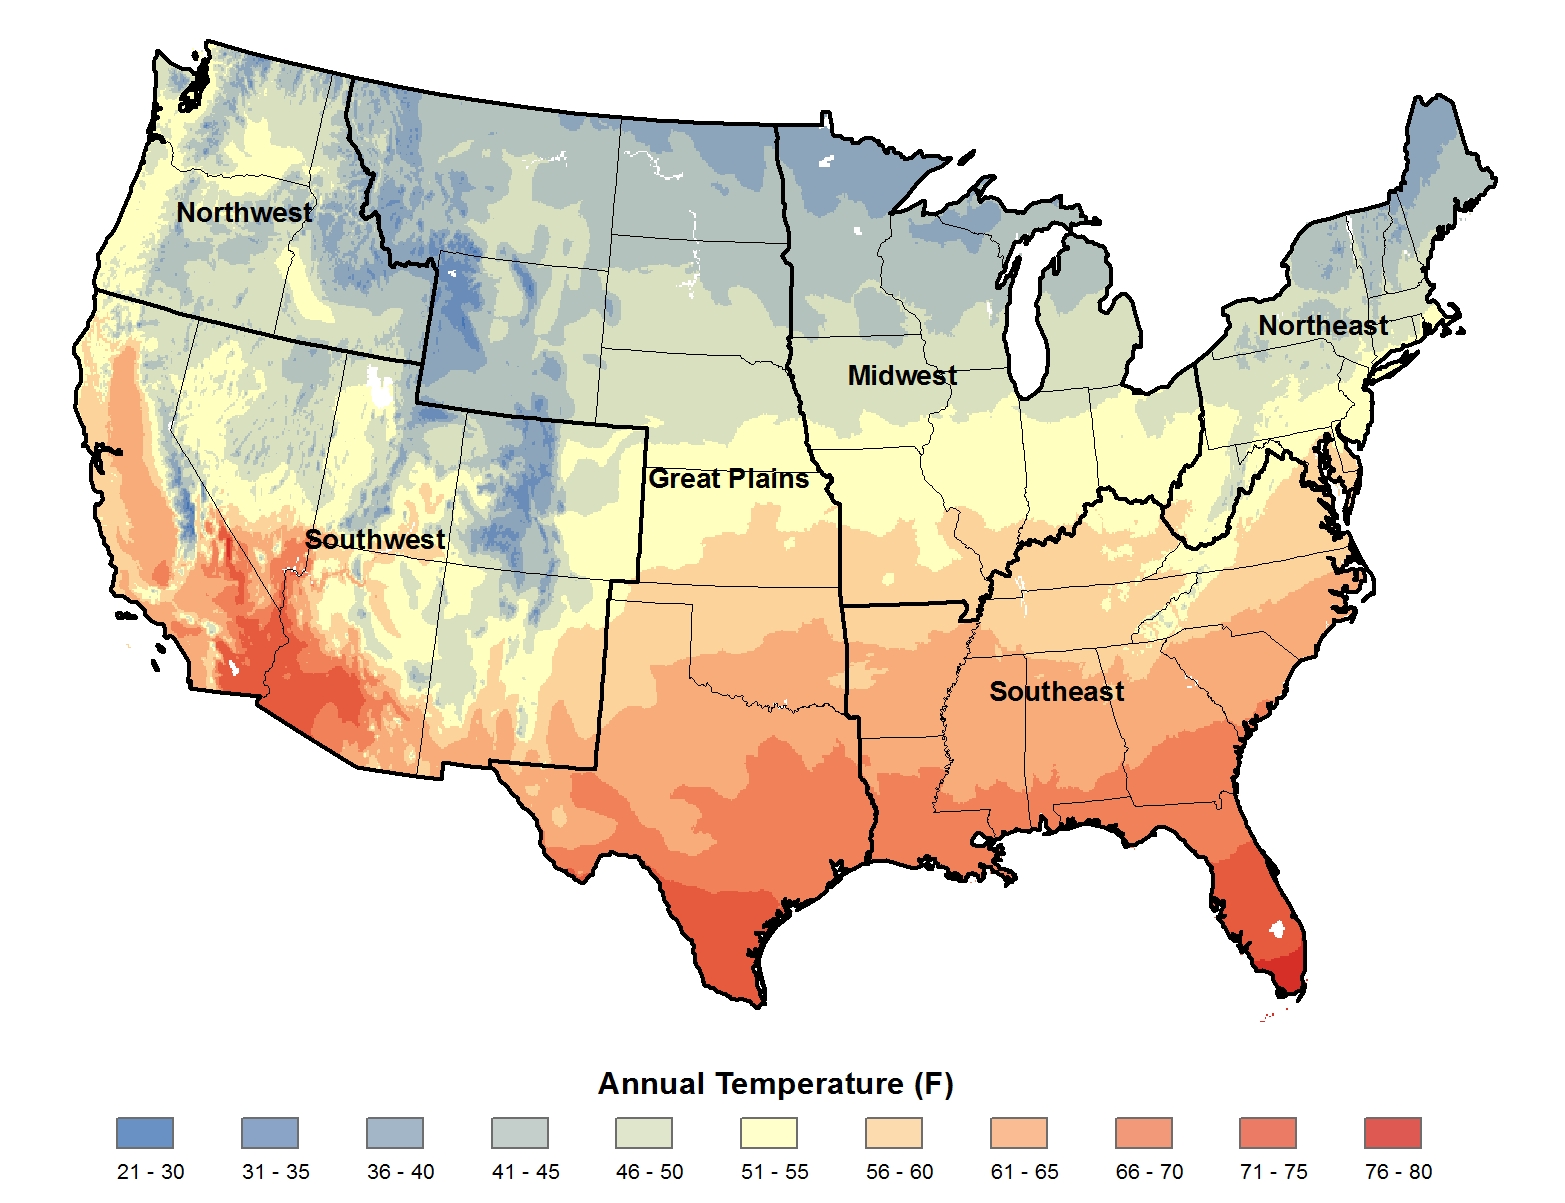
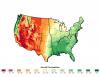
Average annual temperature |
NCA 3 |
 |
|
Simulated difference in the mean annual number of days with a minimum temperature less than 10F |
NCA 3 |
 |
|
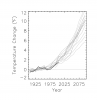
Simulated decadal mean change in annual temperature |
NCA 3 |
 |
|
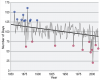
Trends in temperature anomaly |
NCA 3 |
 |
|
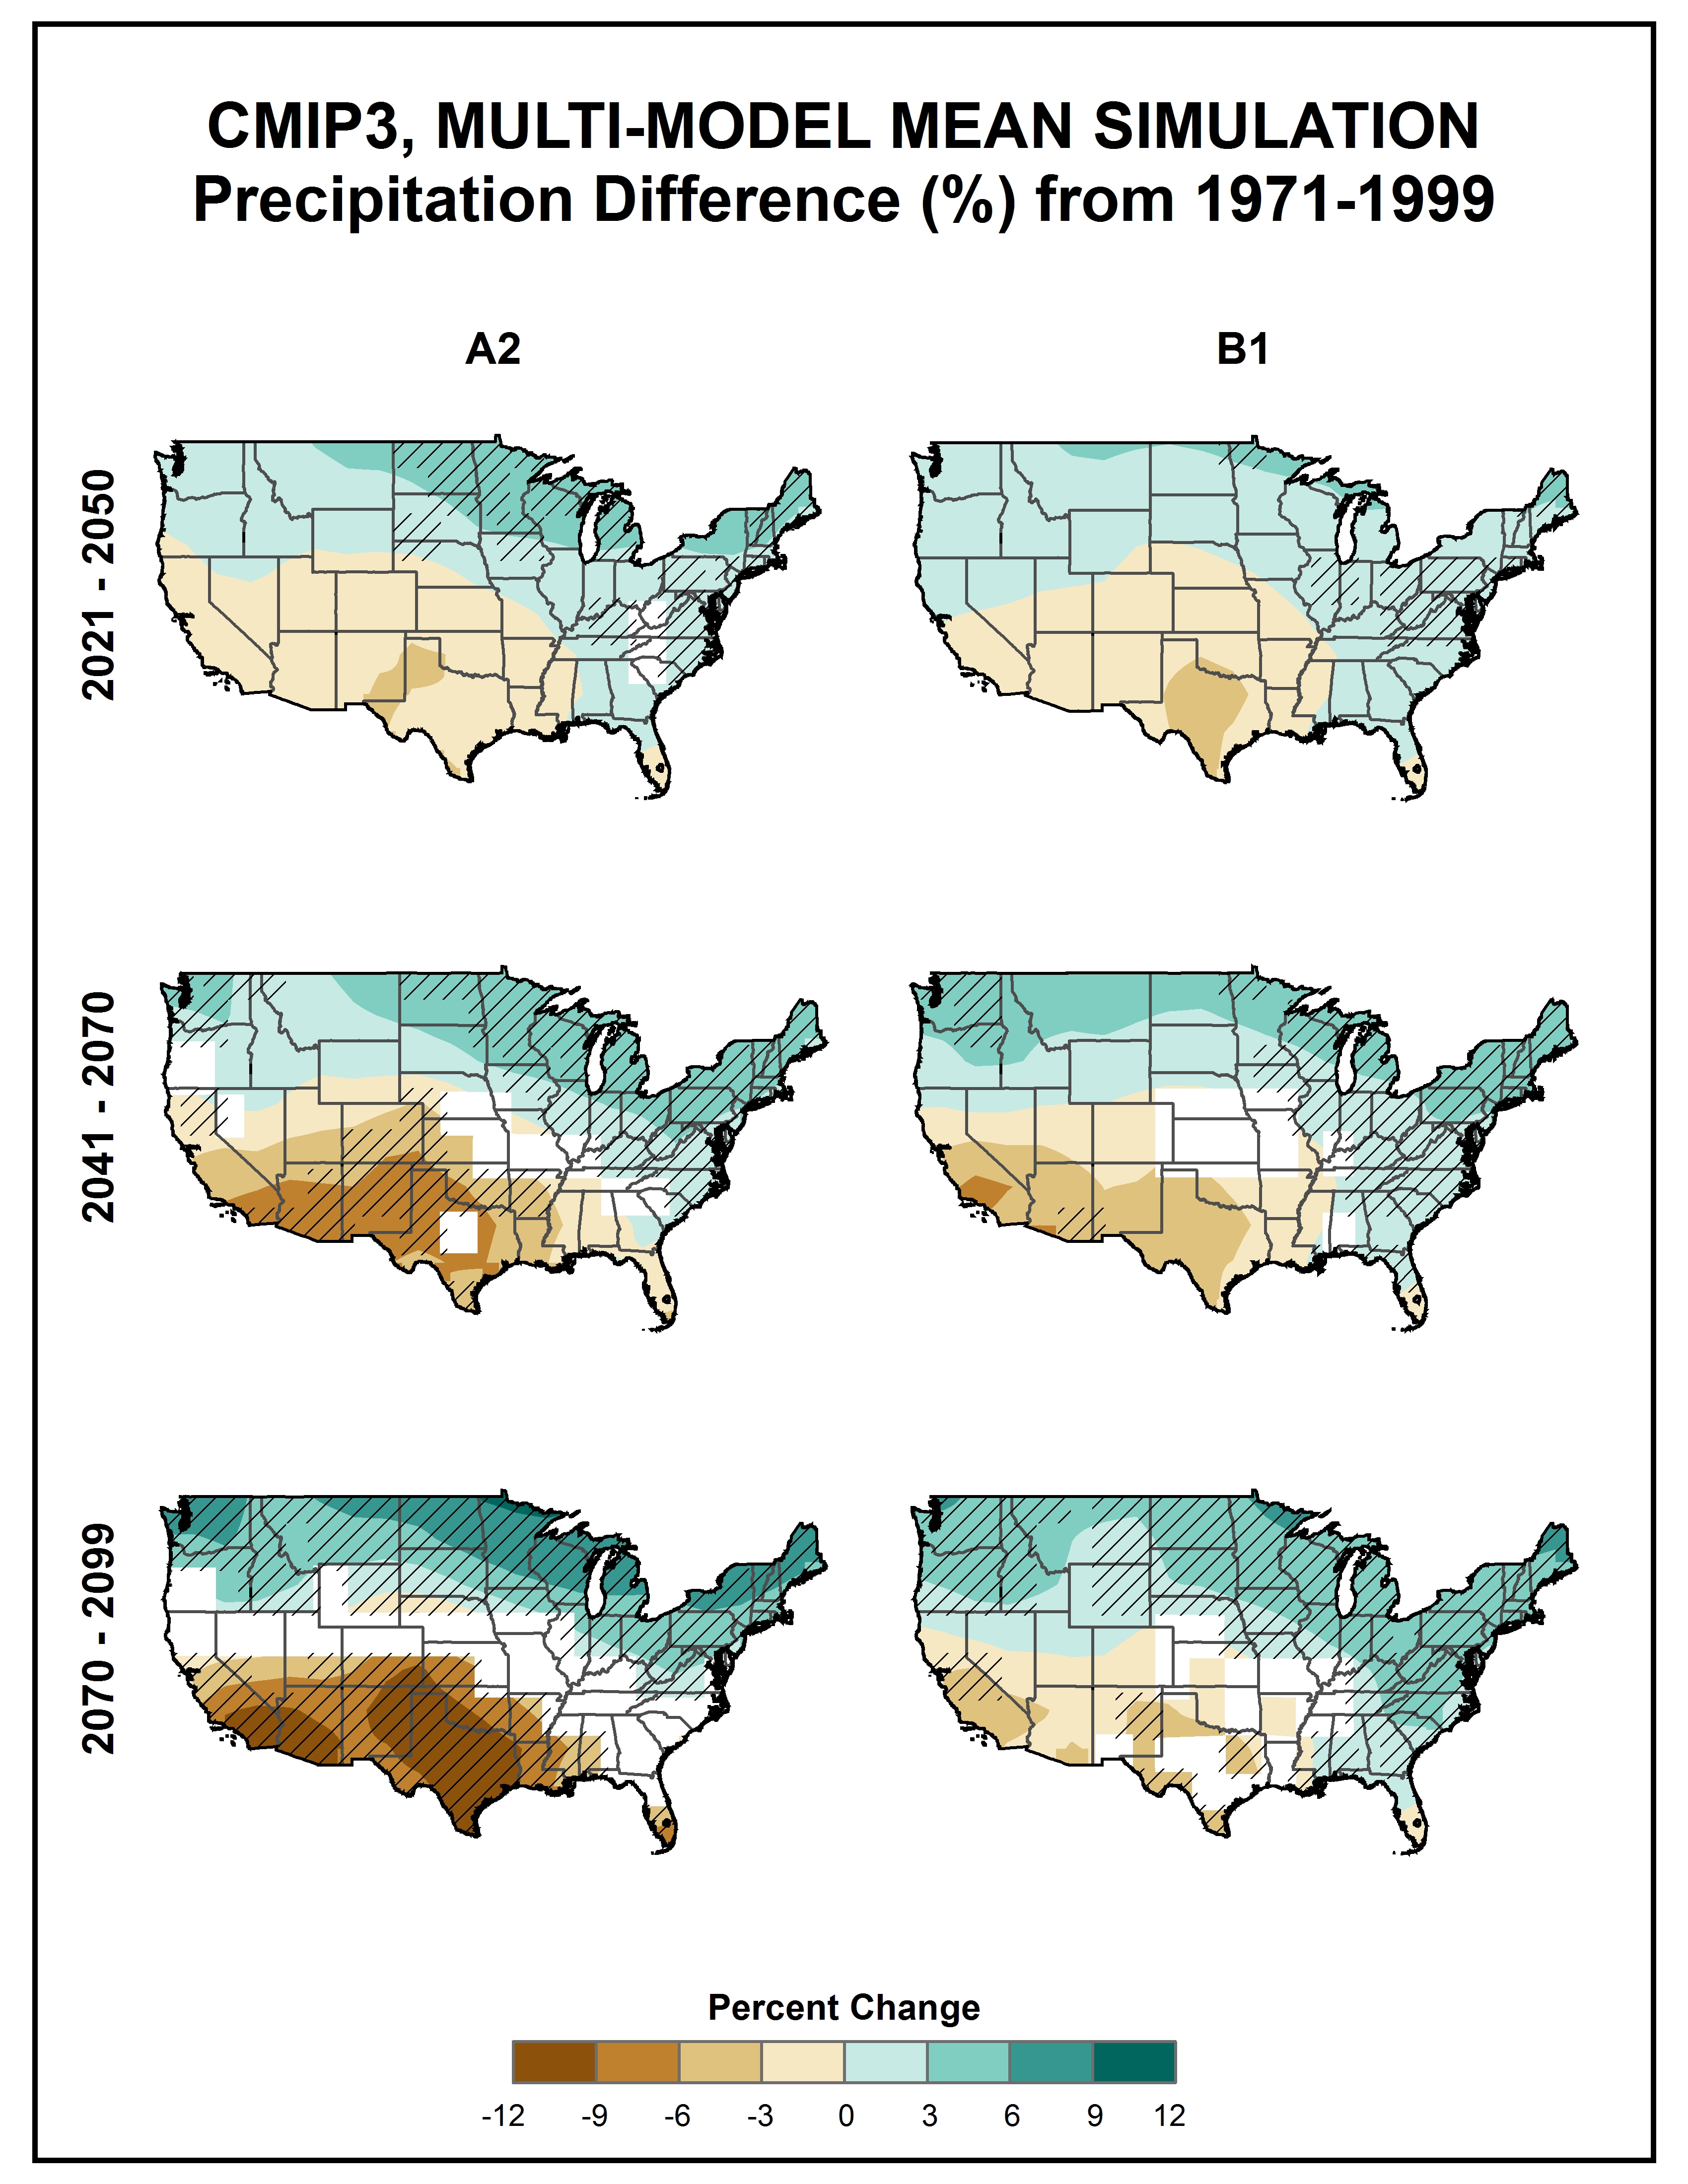
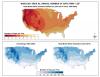
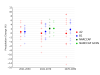
Simulated difference in annual and seasonal mean precipitation |
NCA 3 |
 |
|
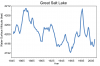
Great Salt Lake elevation |
NCA 3 |
 |
|
Simulated seasonal mean temperature change |
NCA 3 |
 |
|
Observed decadal mean annual precipitation change |
NCA 3 |
 |
|
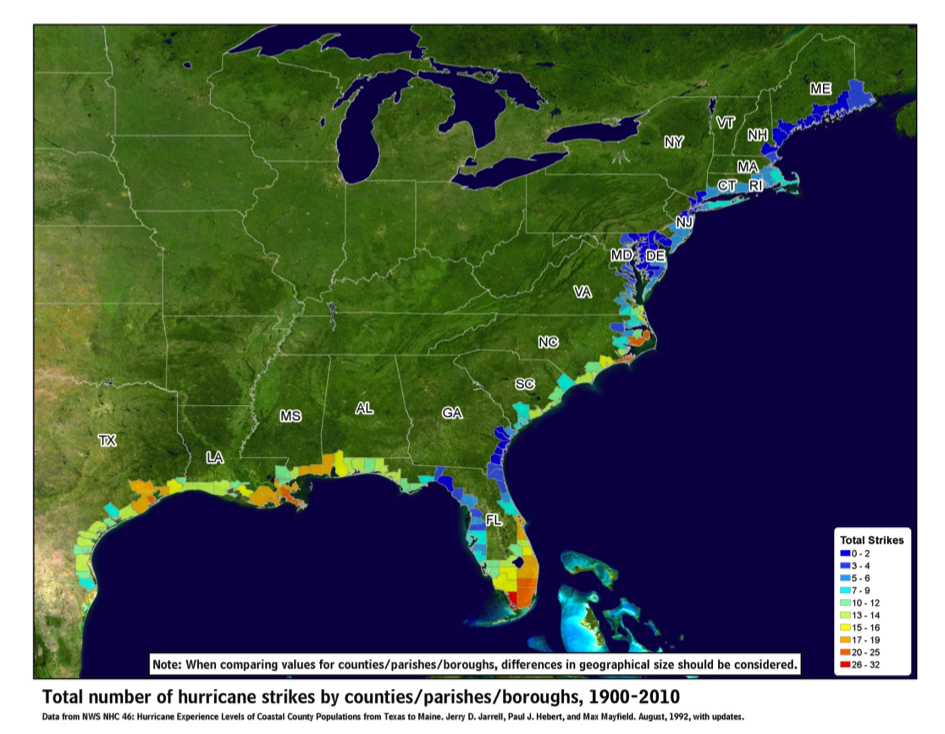
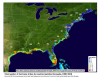
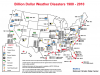
Number of hurricane strikes per county along the Northeast coast |
NCA 3 |
 |
|
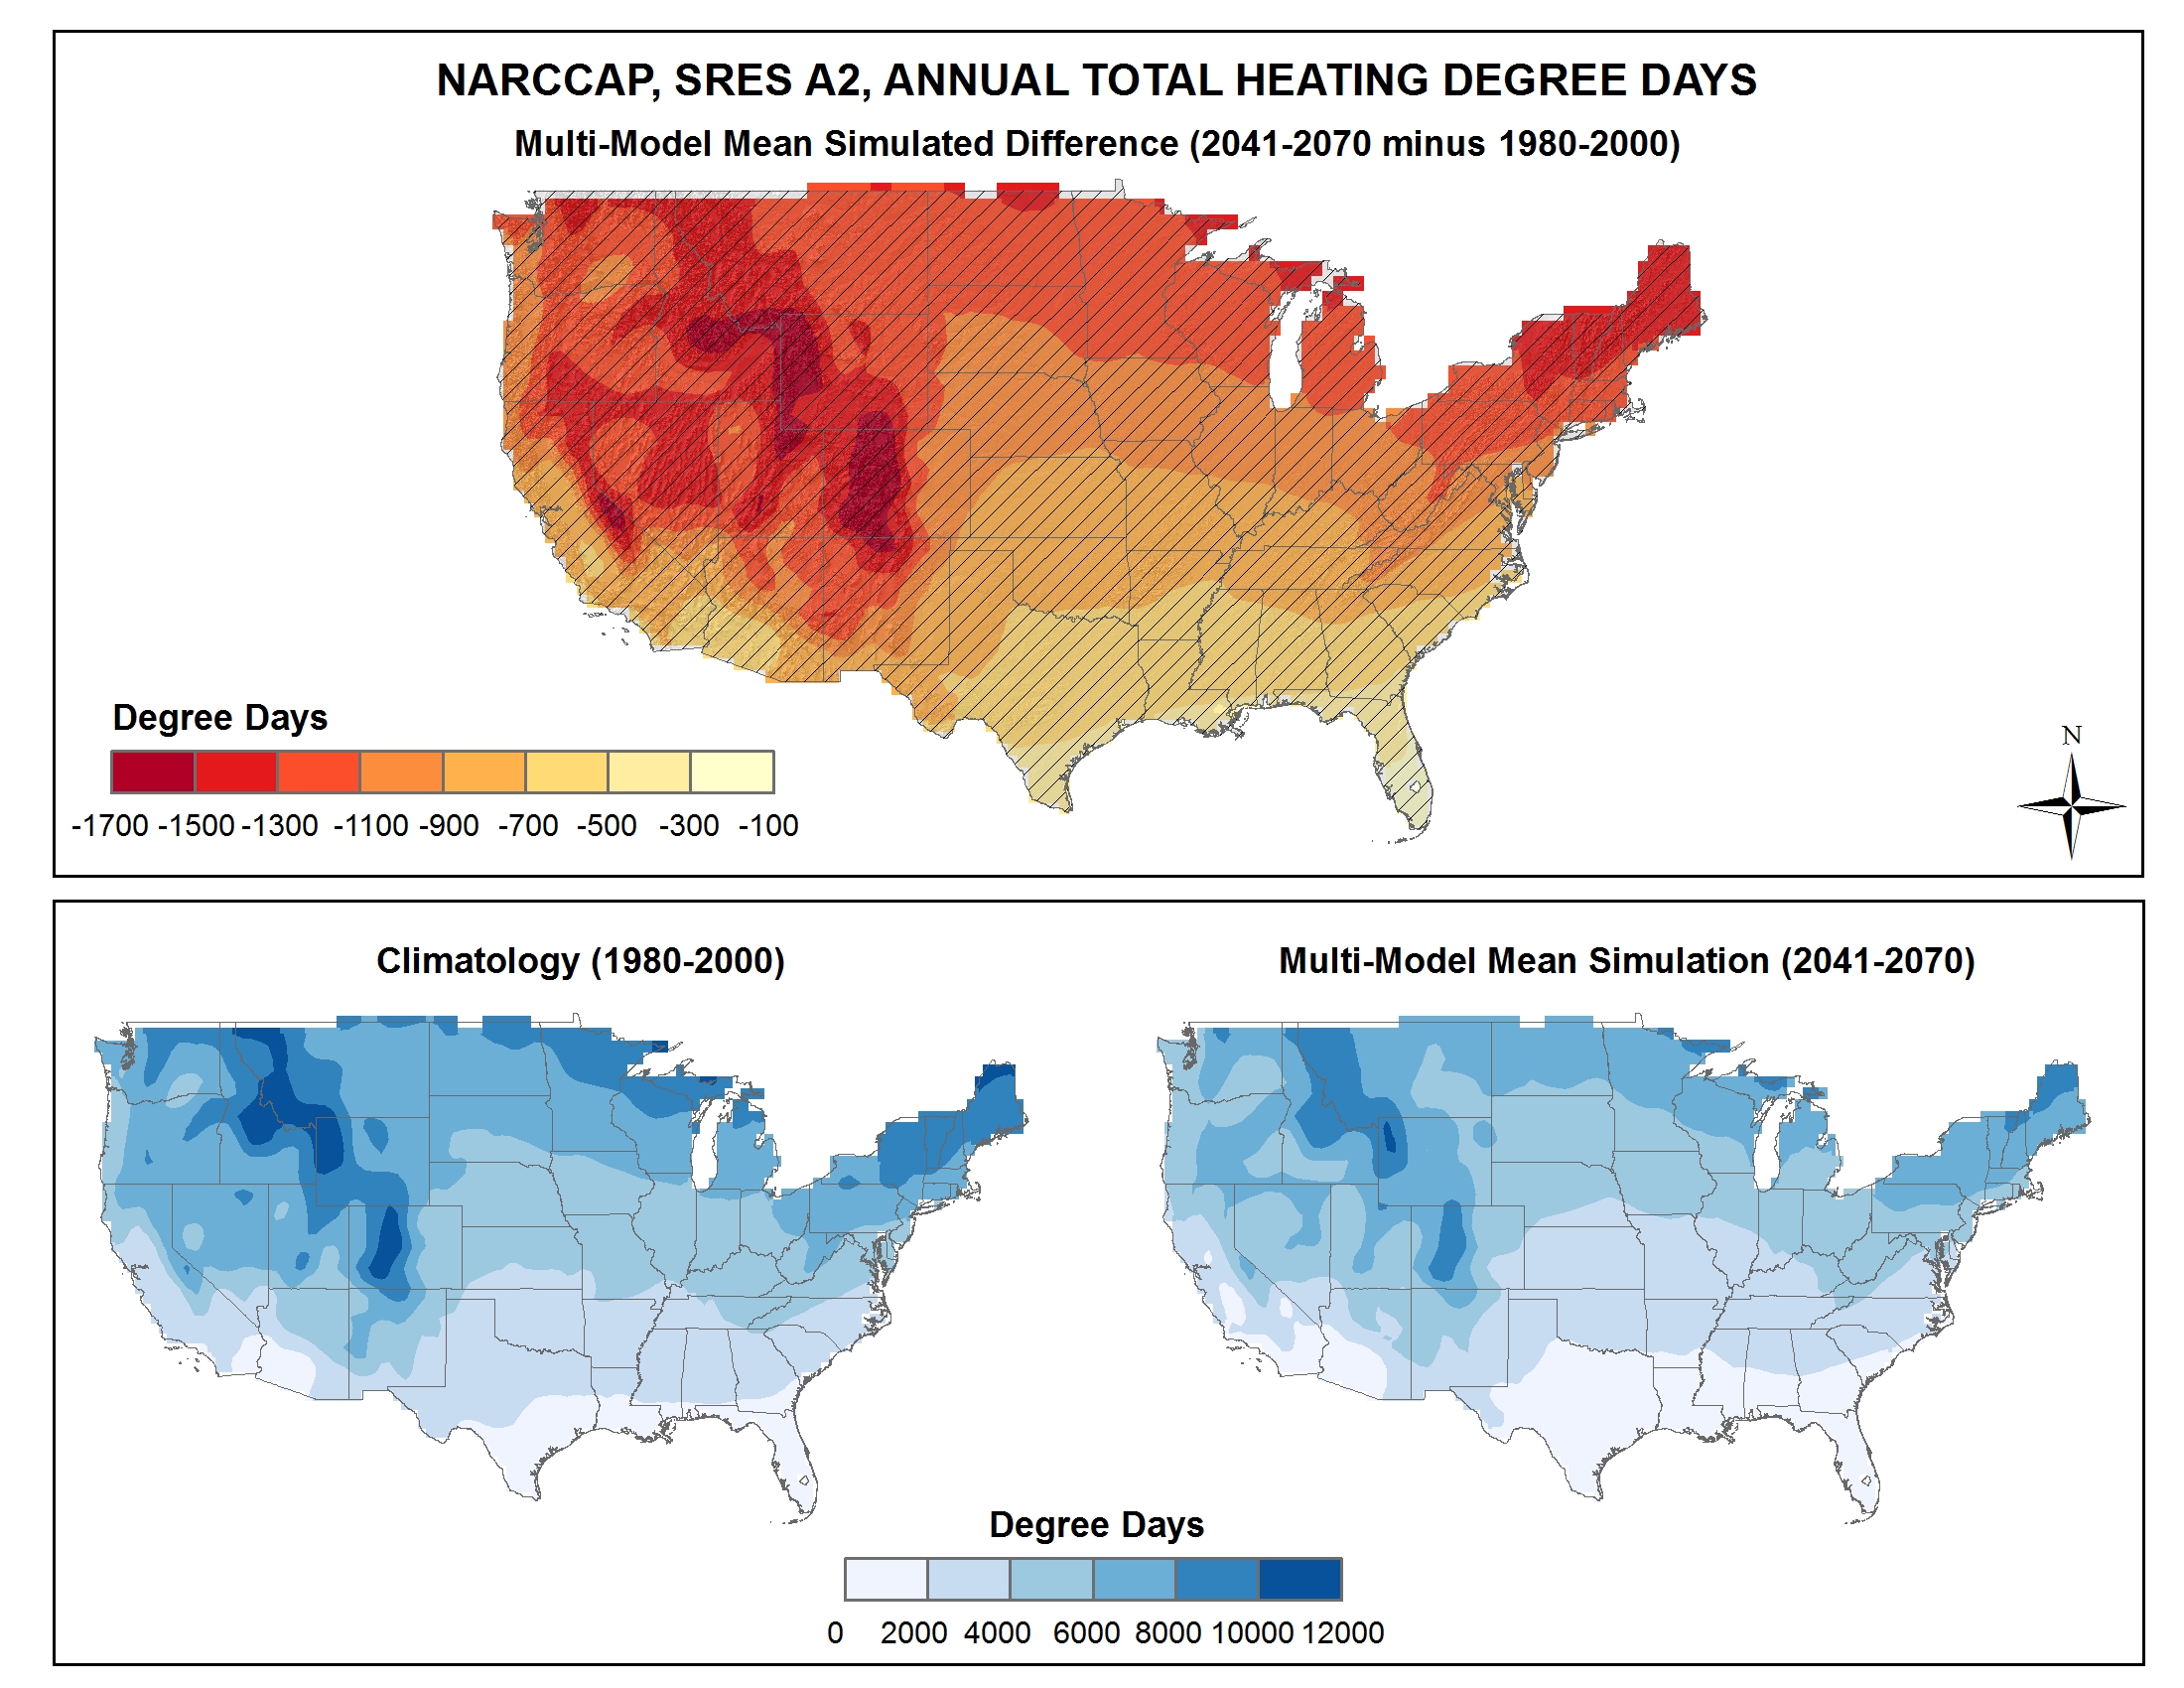
Simulated difference in the mean annual number of heating degree days |
NCA 3 |
 |
|
Time series of freeze-free season anomalies |
NCA 3 |
 |
|
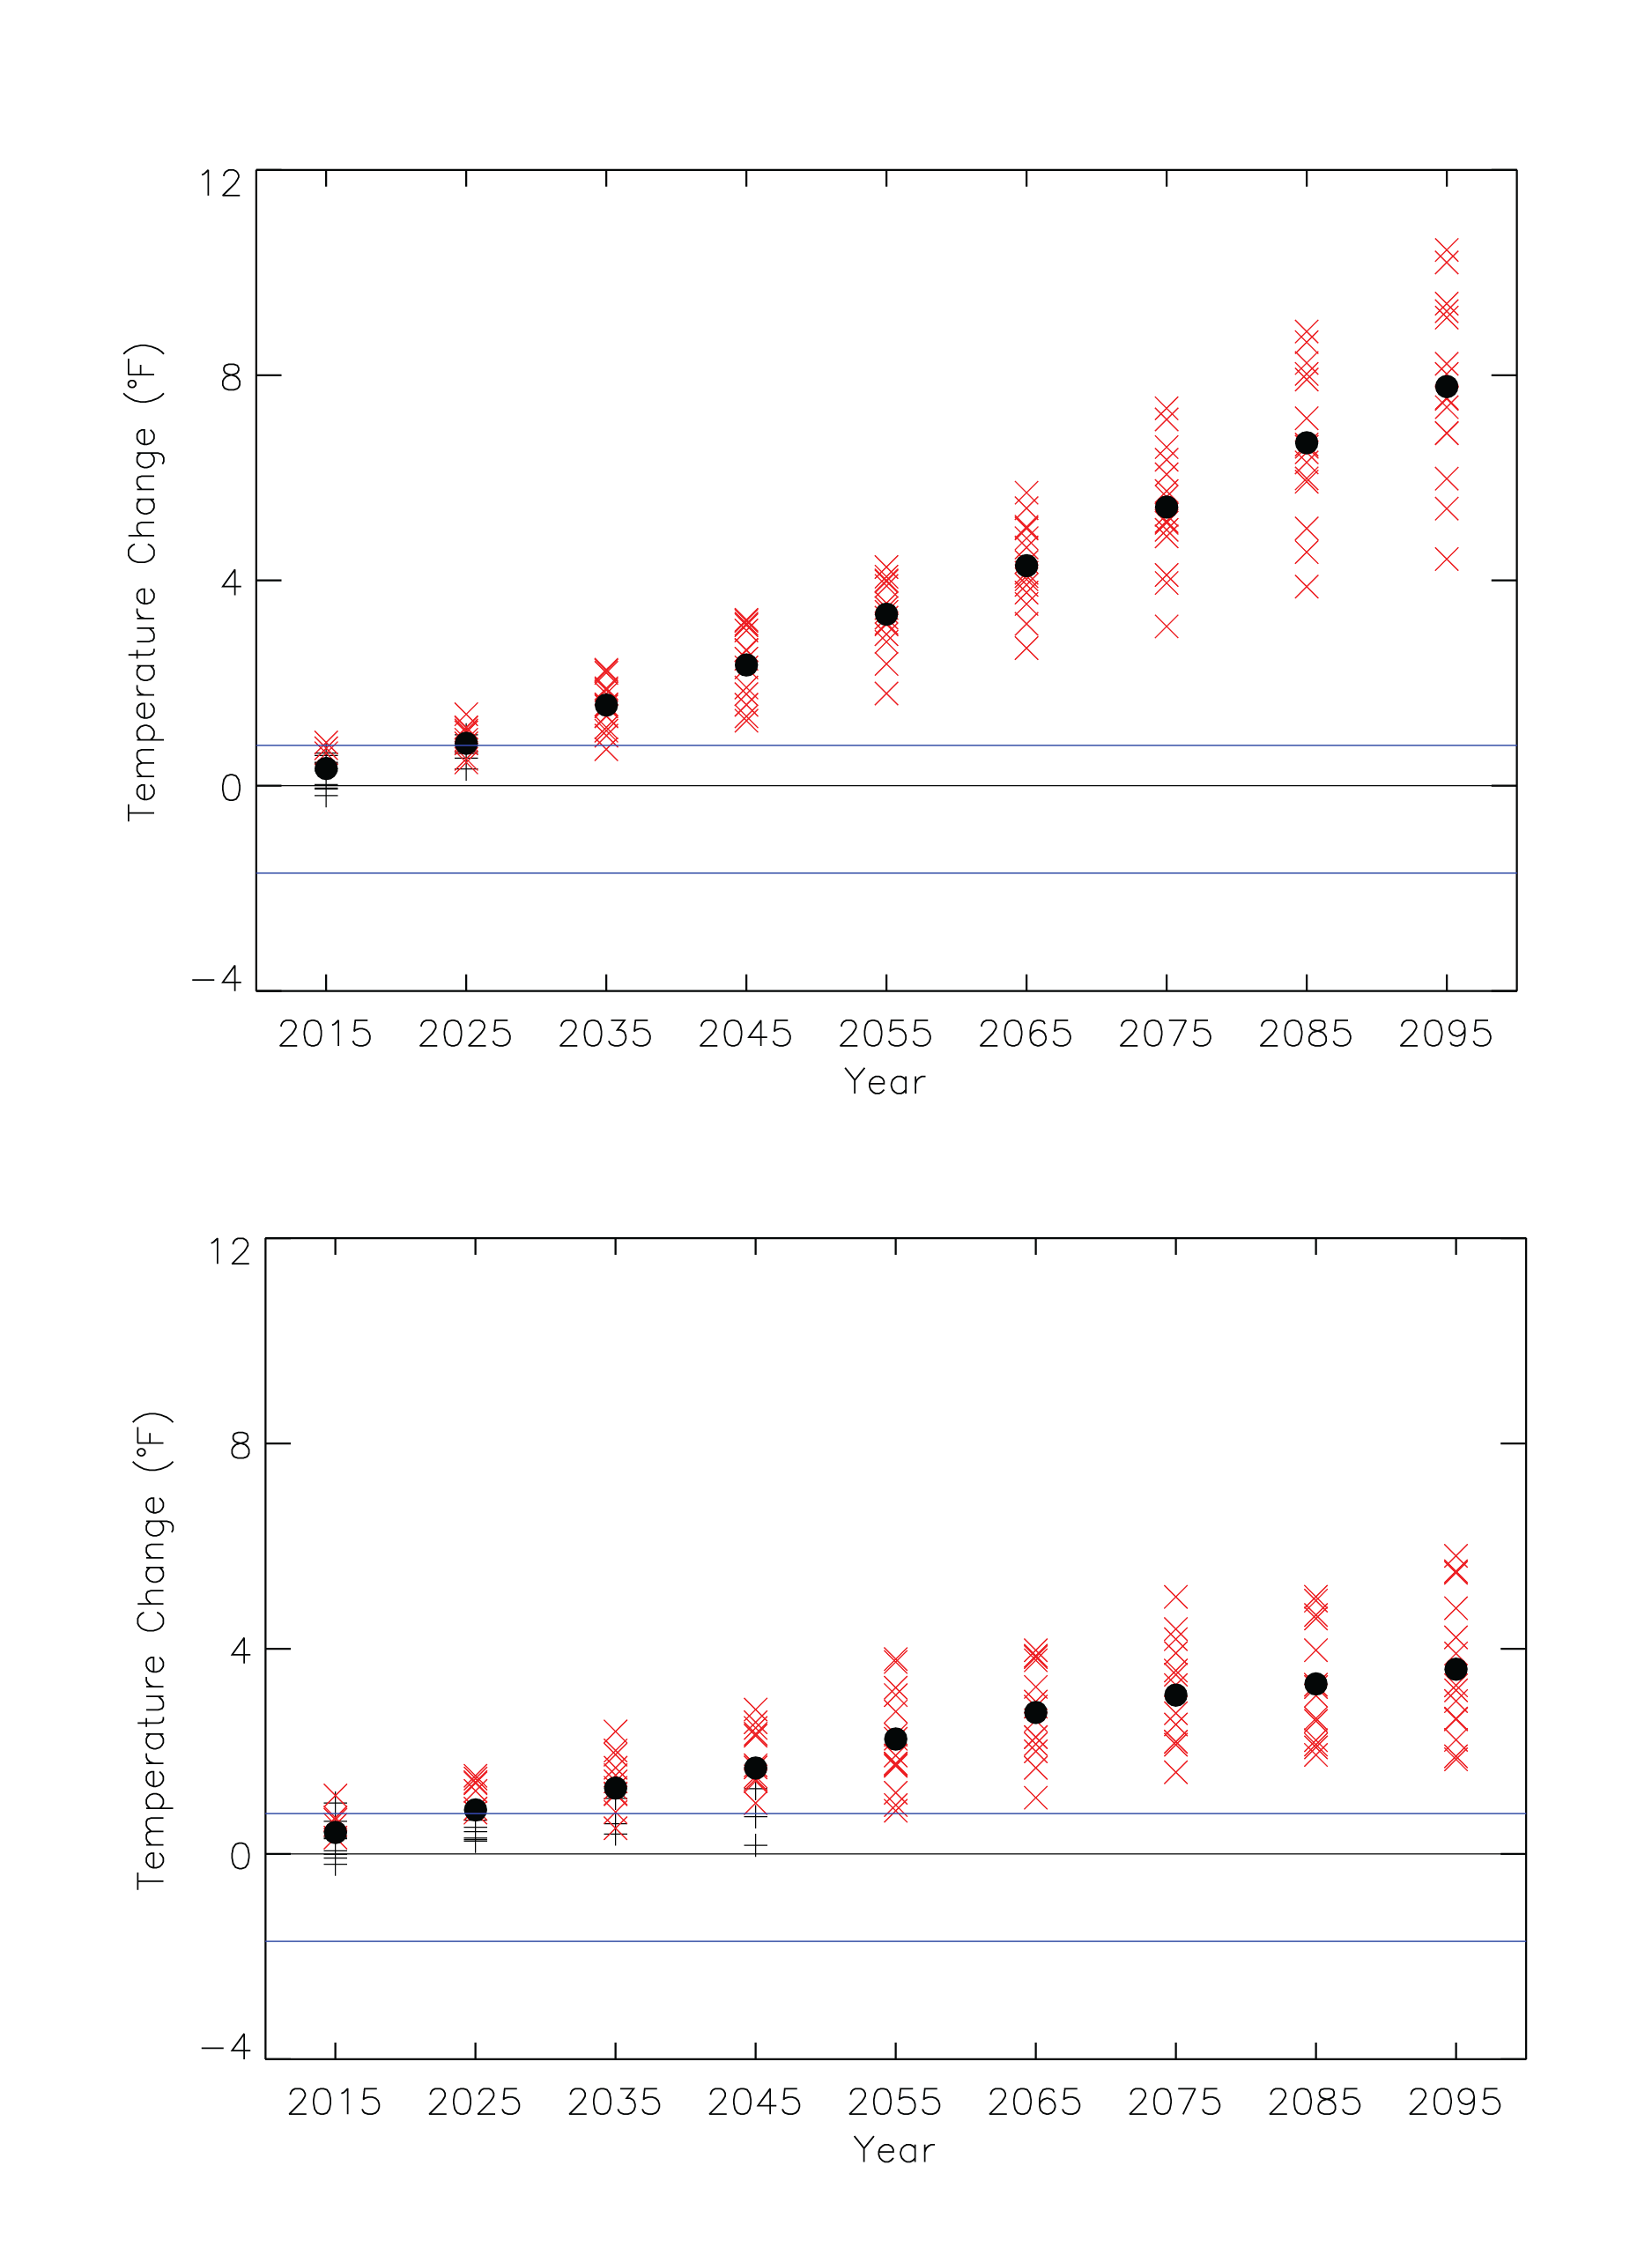
Simulated annual mean temperature change |
NCA 3 |
 |
|
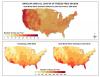
Observed decadal mean annual temperature change |
NCA 3 |
 |
|
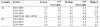
Information on U.S. billion dollar disasters |
NCA 3 |
 |
|
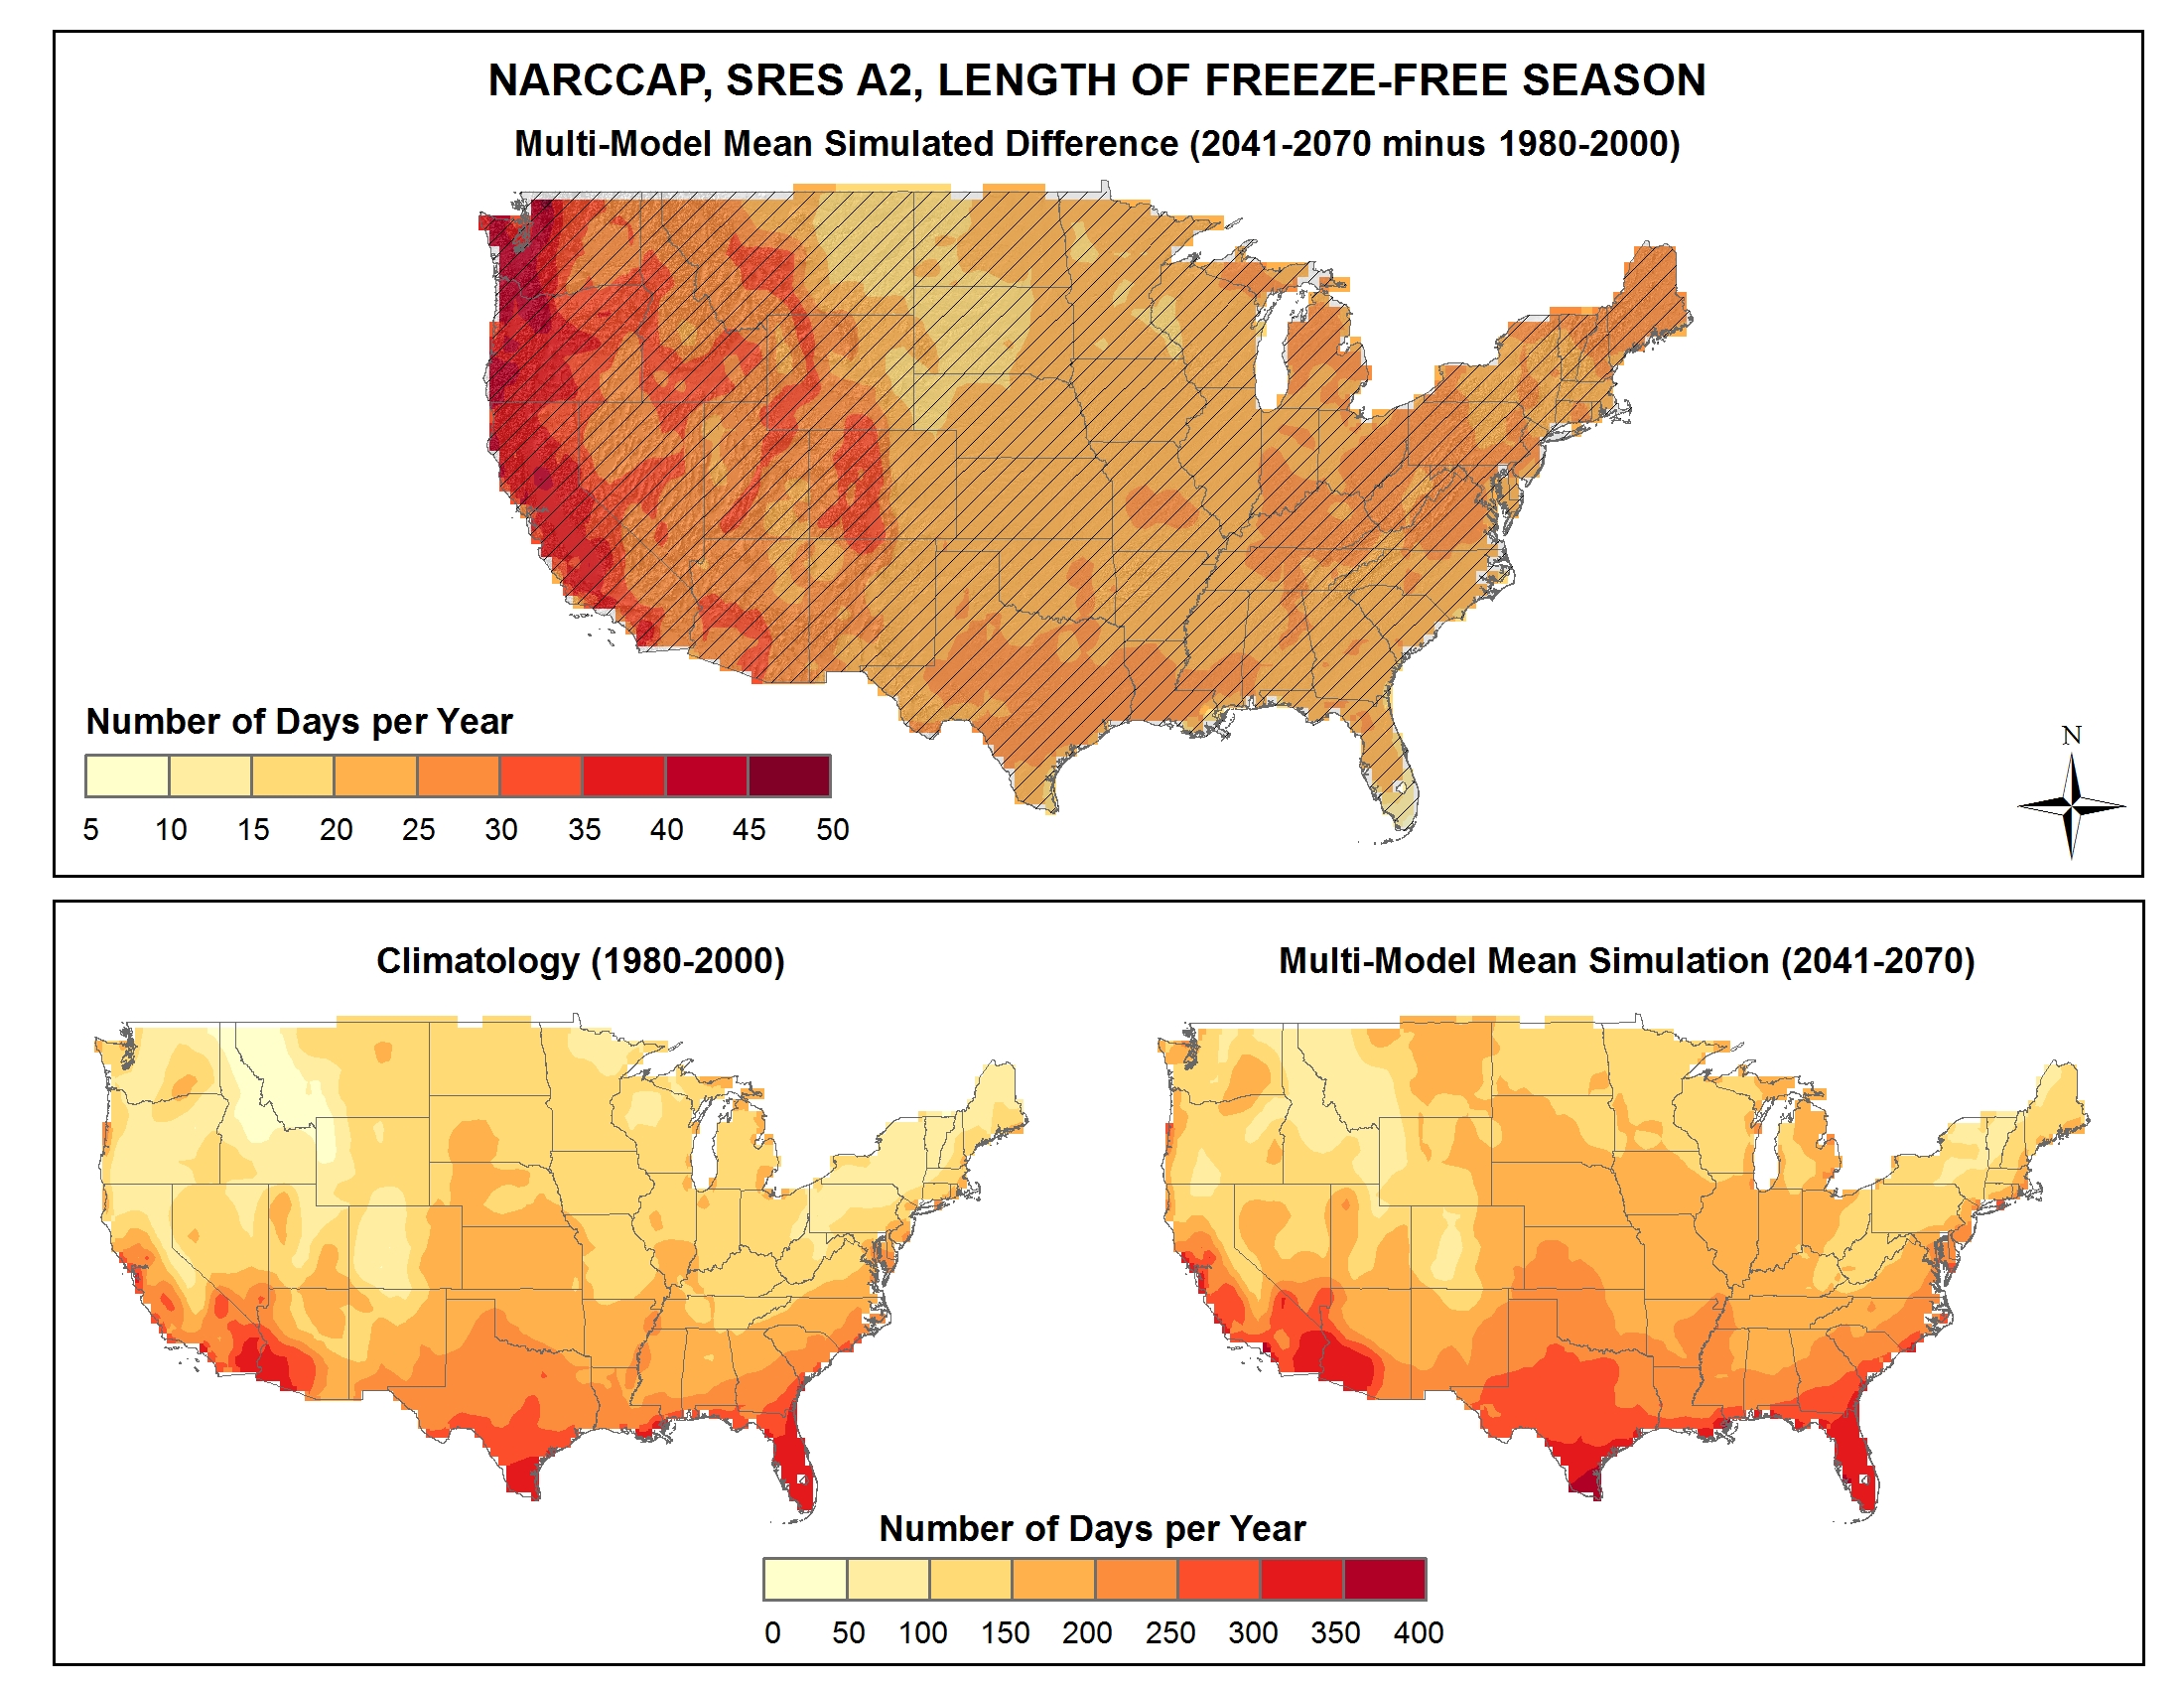
Simulated difference in the mean annual length of the freeze-free season |
NCA 3 |
 |
|
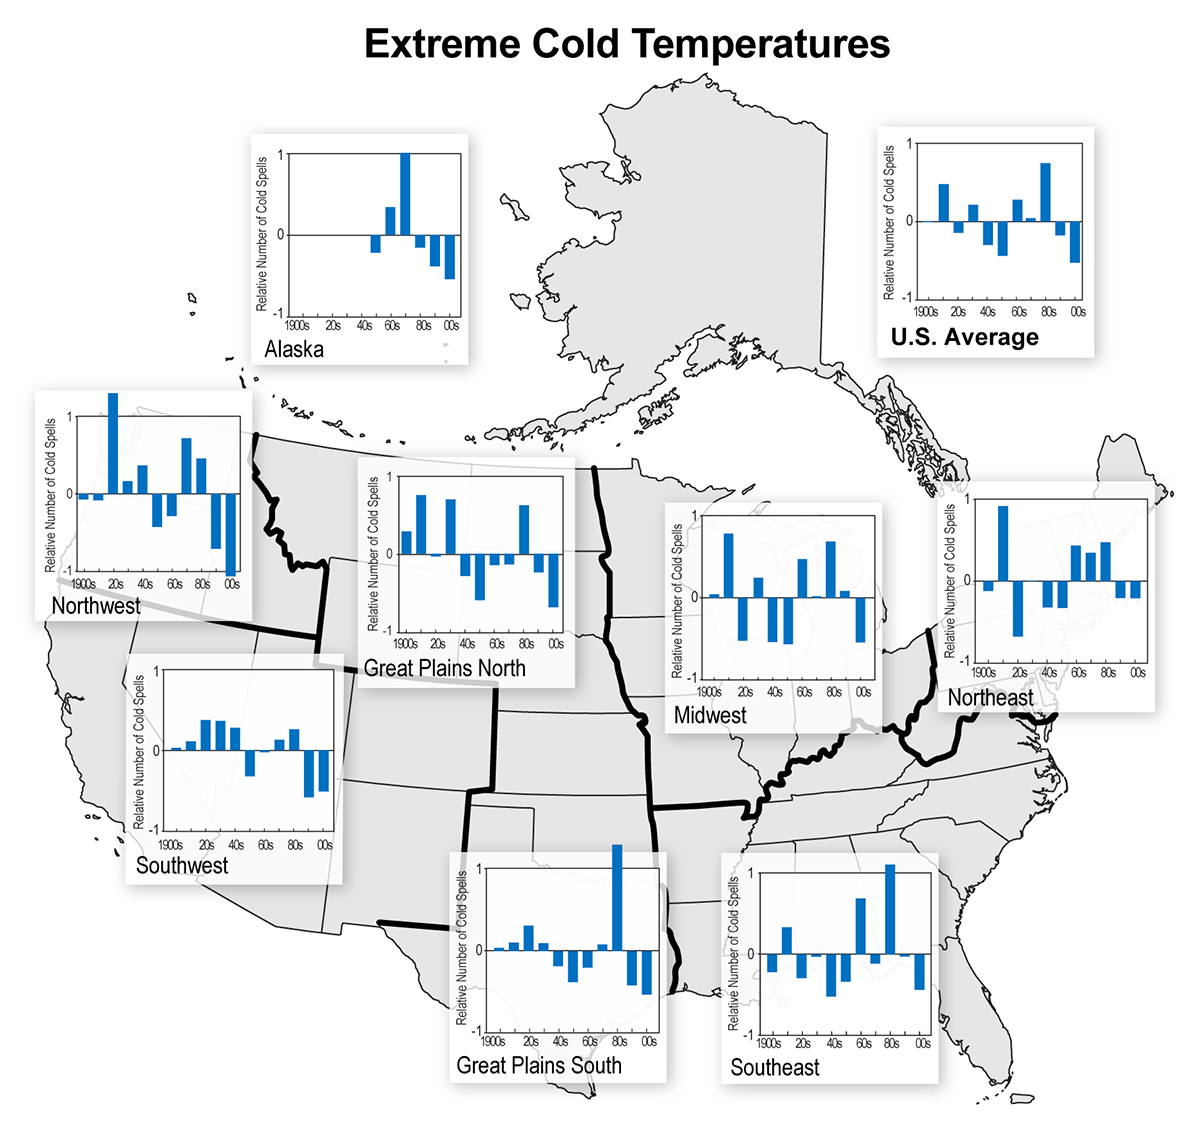
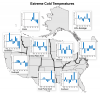
Decadal time series of cold wave indices |
NCA 3 |
 |
|
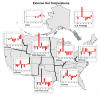
Decadal time series of heat wave indices |
NCA 3 |
 |
|
Simulated difference in mean annual temperature |
NCA 3 |
 |
|
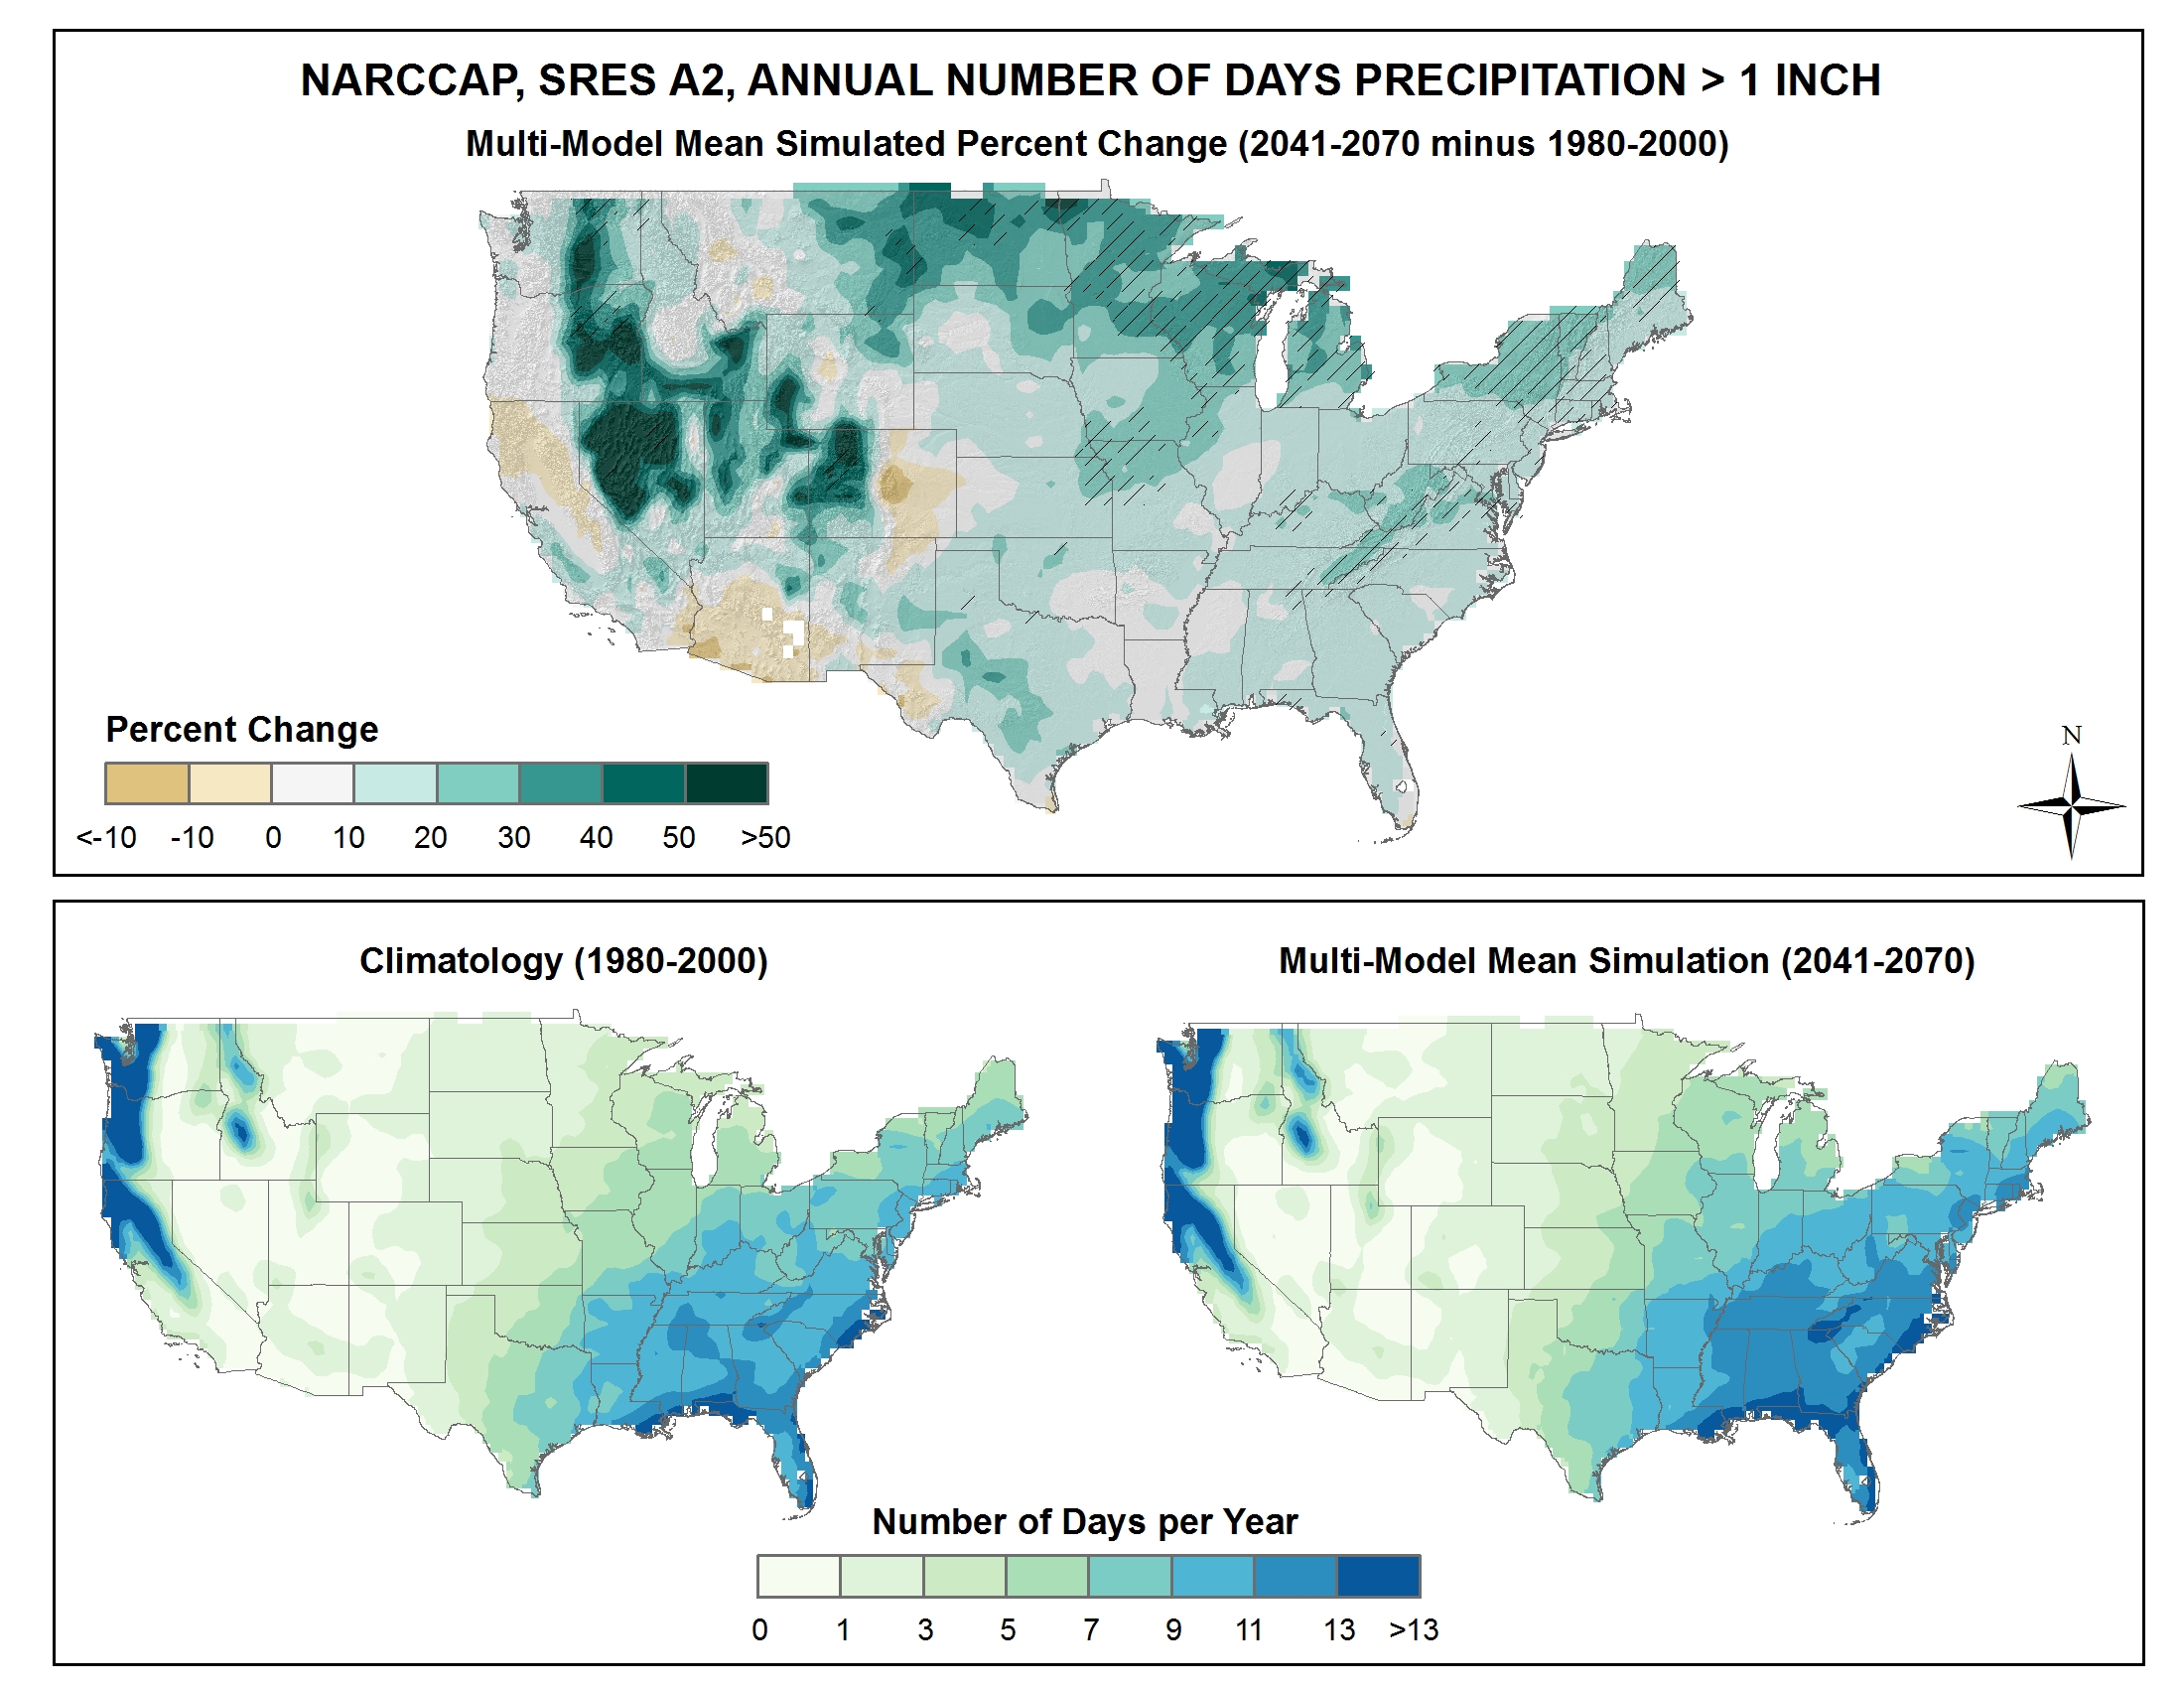
Simulated difference in the mean annual number of days with precipitation of greater than one inch |
NCA 3 |
 |
|
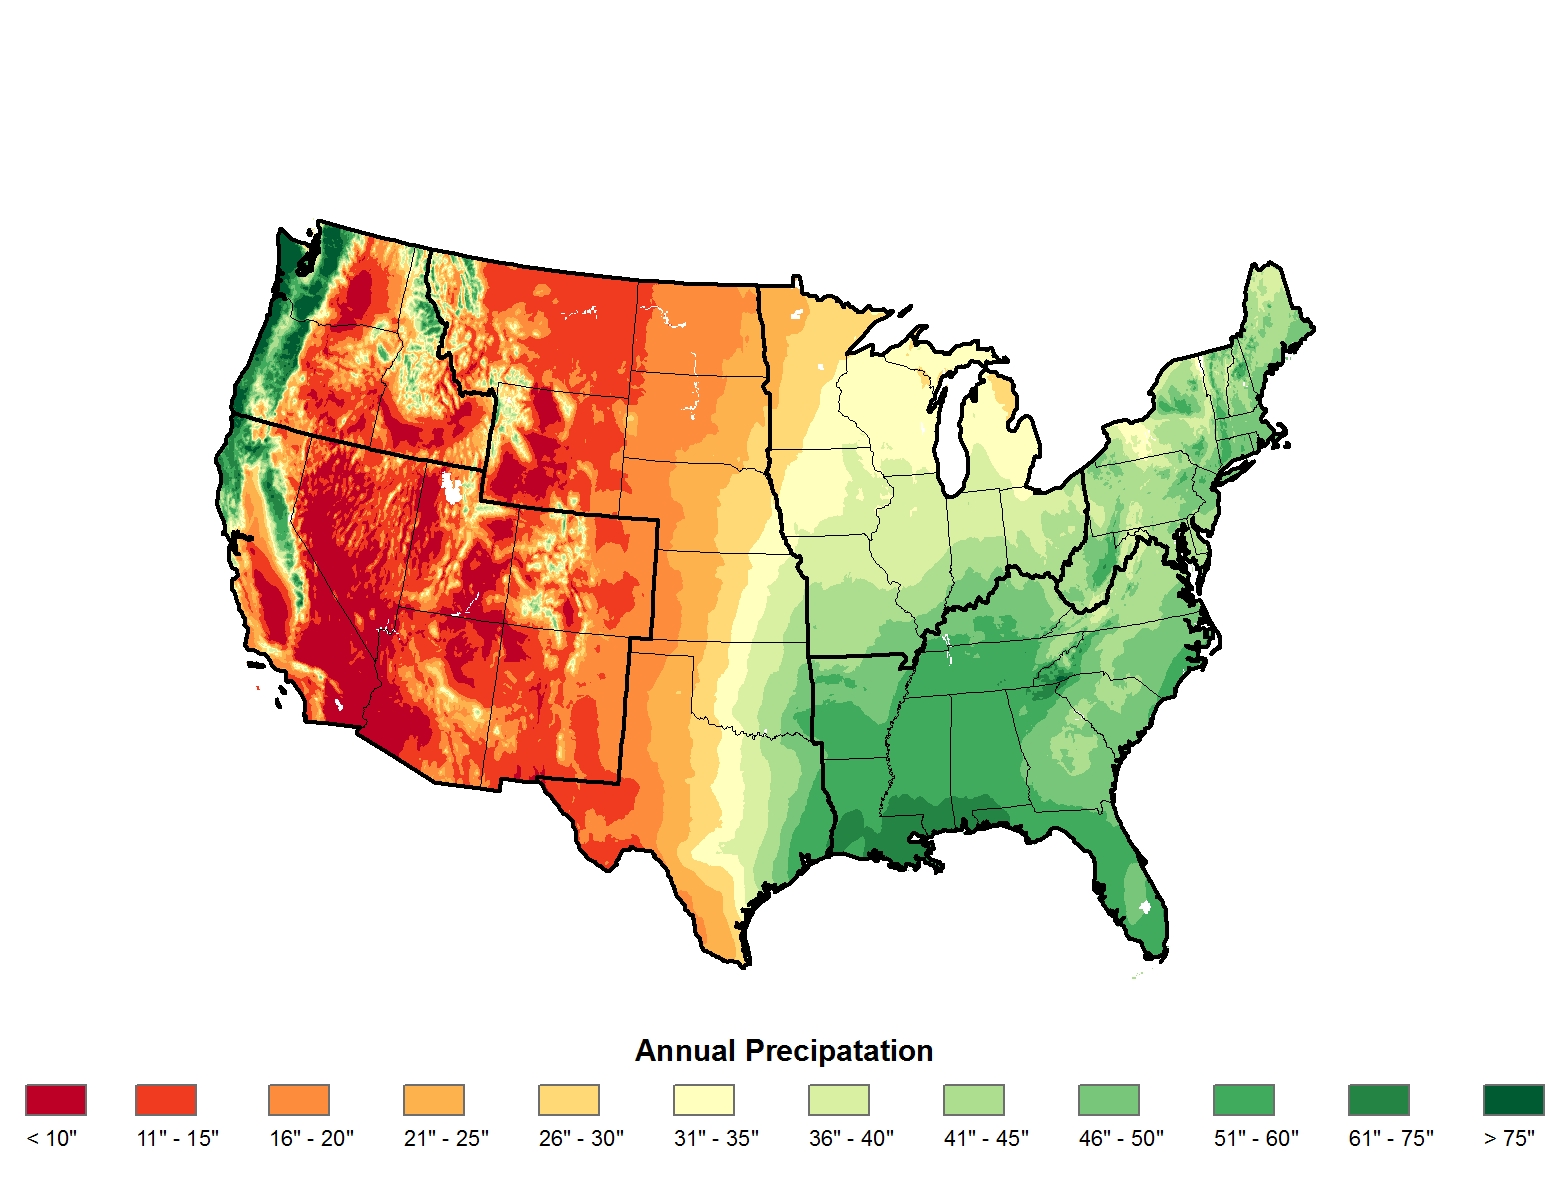
Average annual precipitation |
NCA 3 |
 |
|
Simulated difference in the mean annual number of days with a minimum temperature less than 32F |
NCA 3 |
 |
|
Simulated decadal mean change in annual precipitation |
NCA 3 |
 |
|
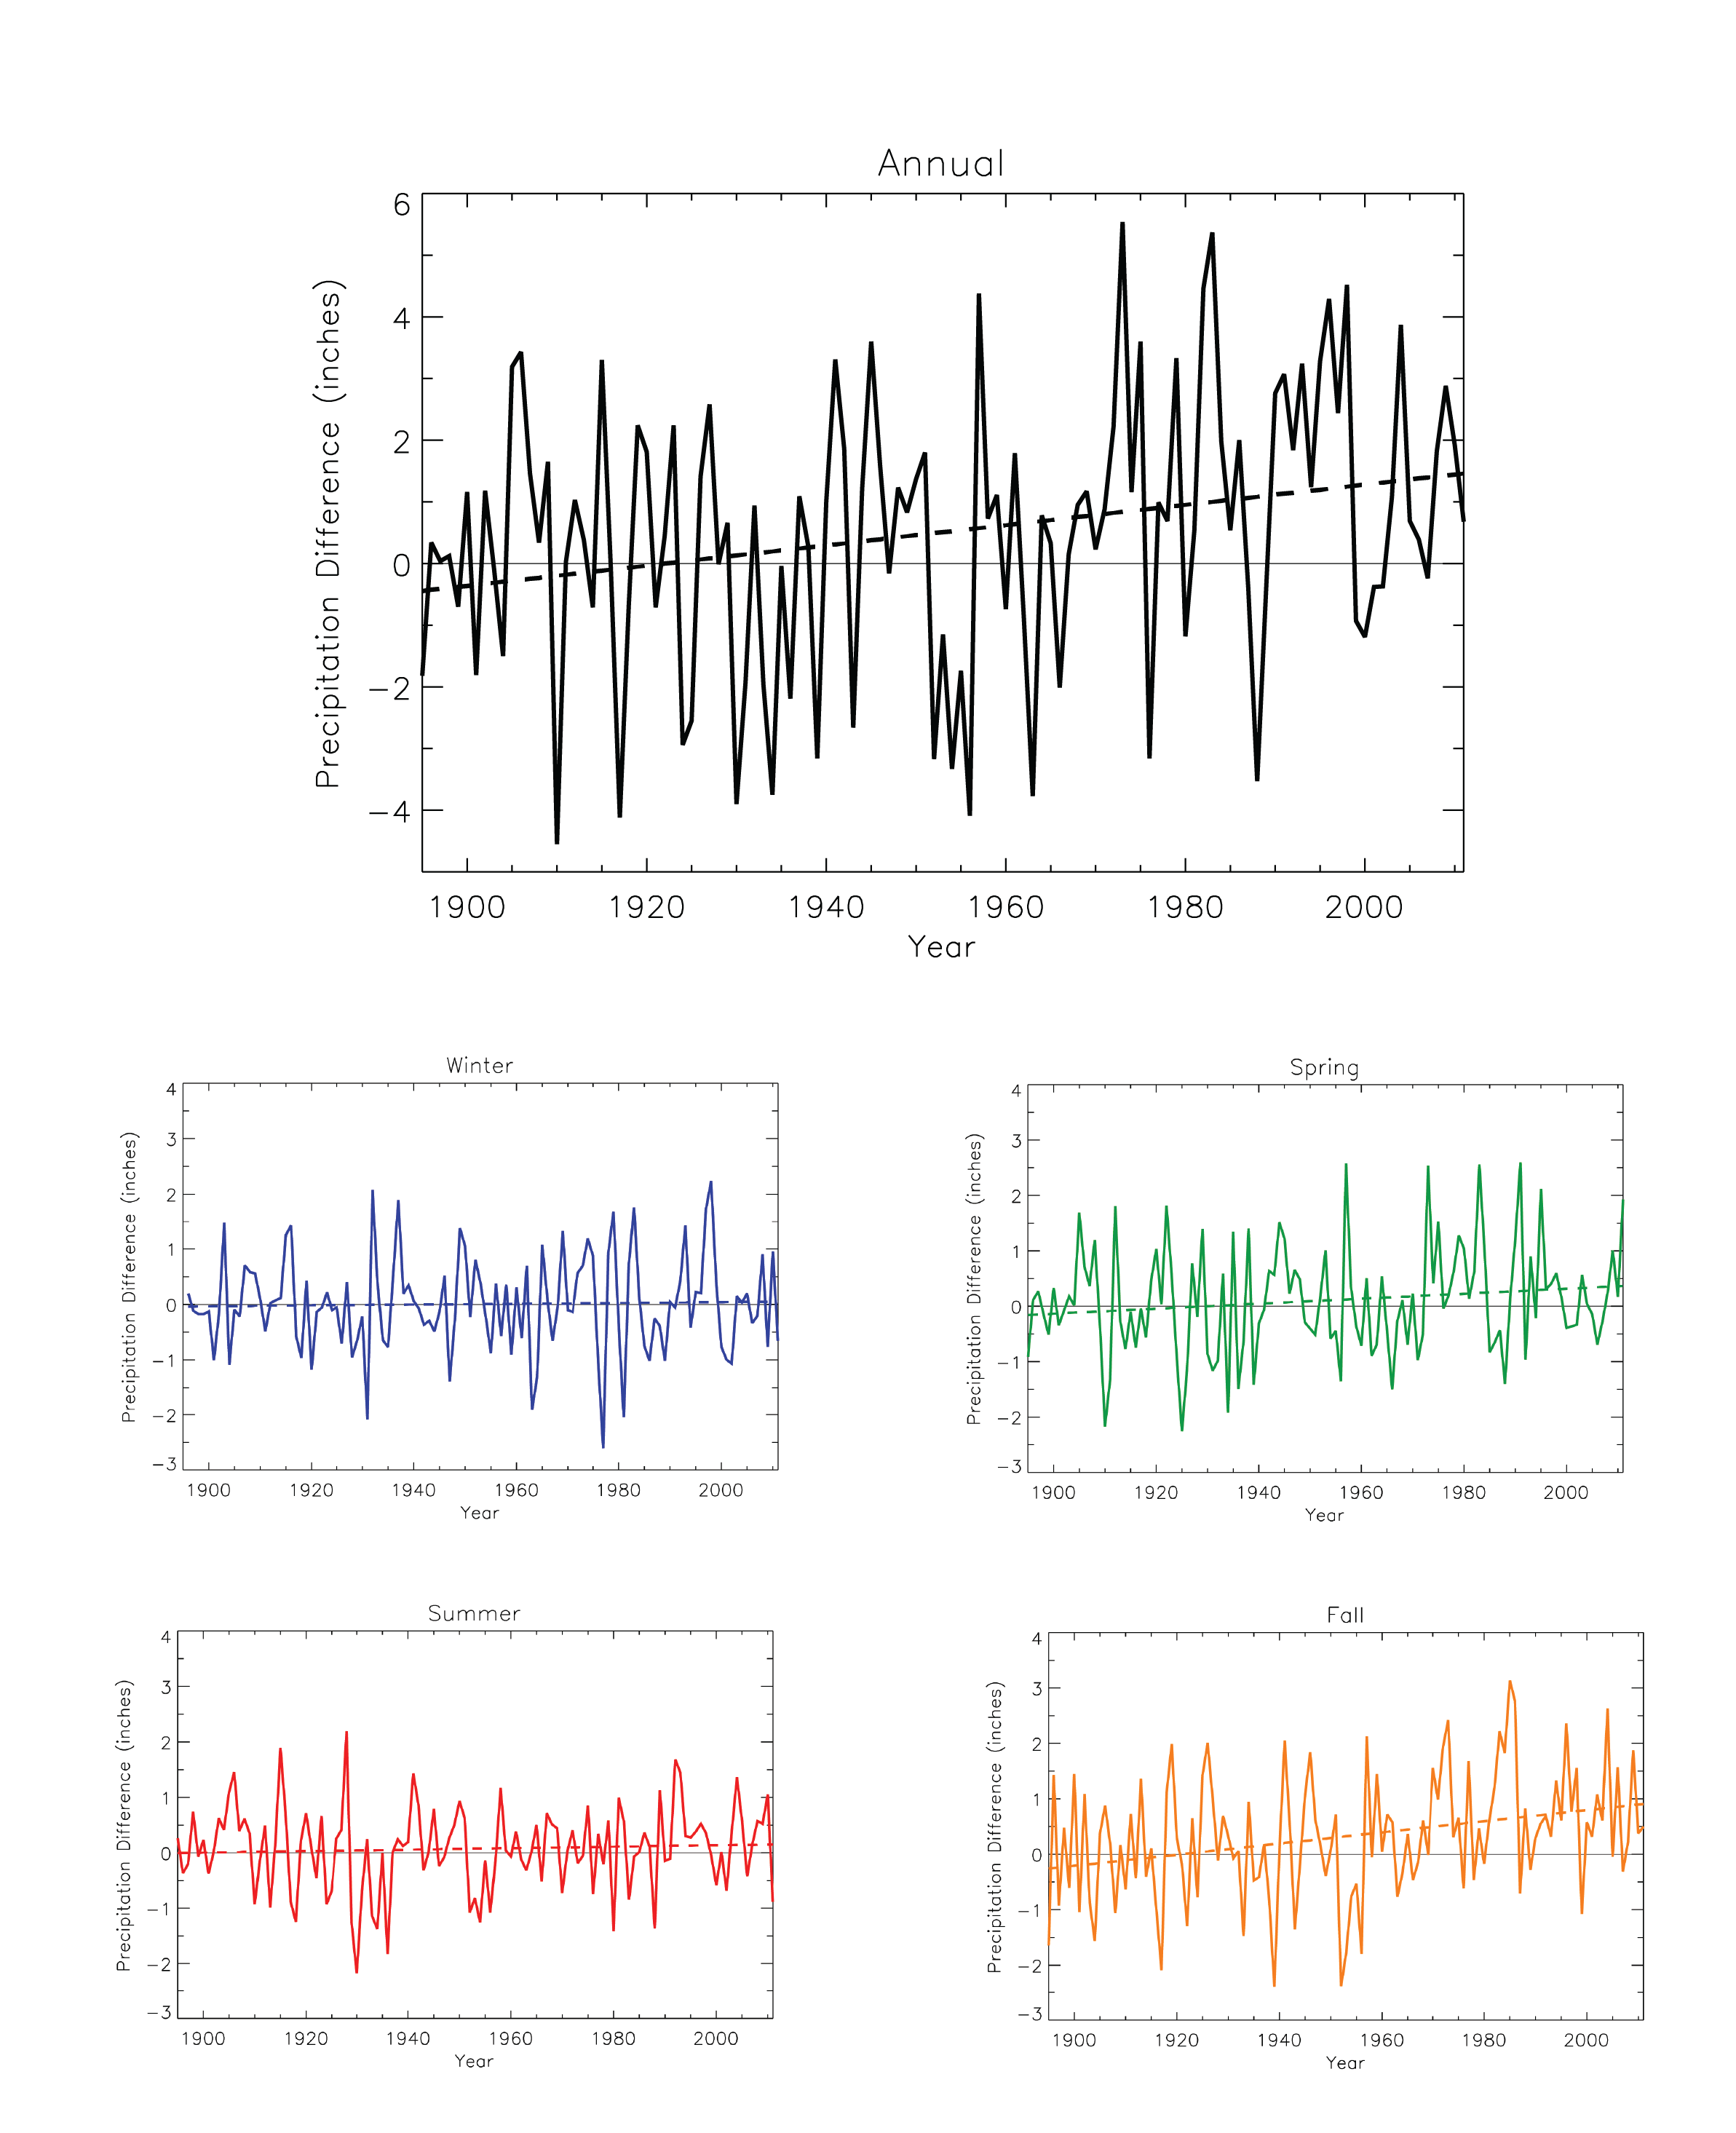
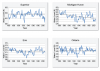
Annual and seasonal precipitation anomaly |
NCA 3 |
 |
|
Long-term change in ice-cover duration for Lake Mendota, WI |
NCA 3 |
 |
|
Simulated annual mean precipitation change |
NCA 3 |
 |
|
Simulated difference in the mean annual number of days with a maximum temperature greater than 95F |
NCA 3 |
 |
|
Observed decadal mean seasonal precipitation change |
NCA 3 |
 |
|
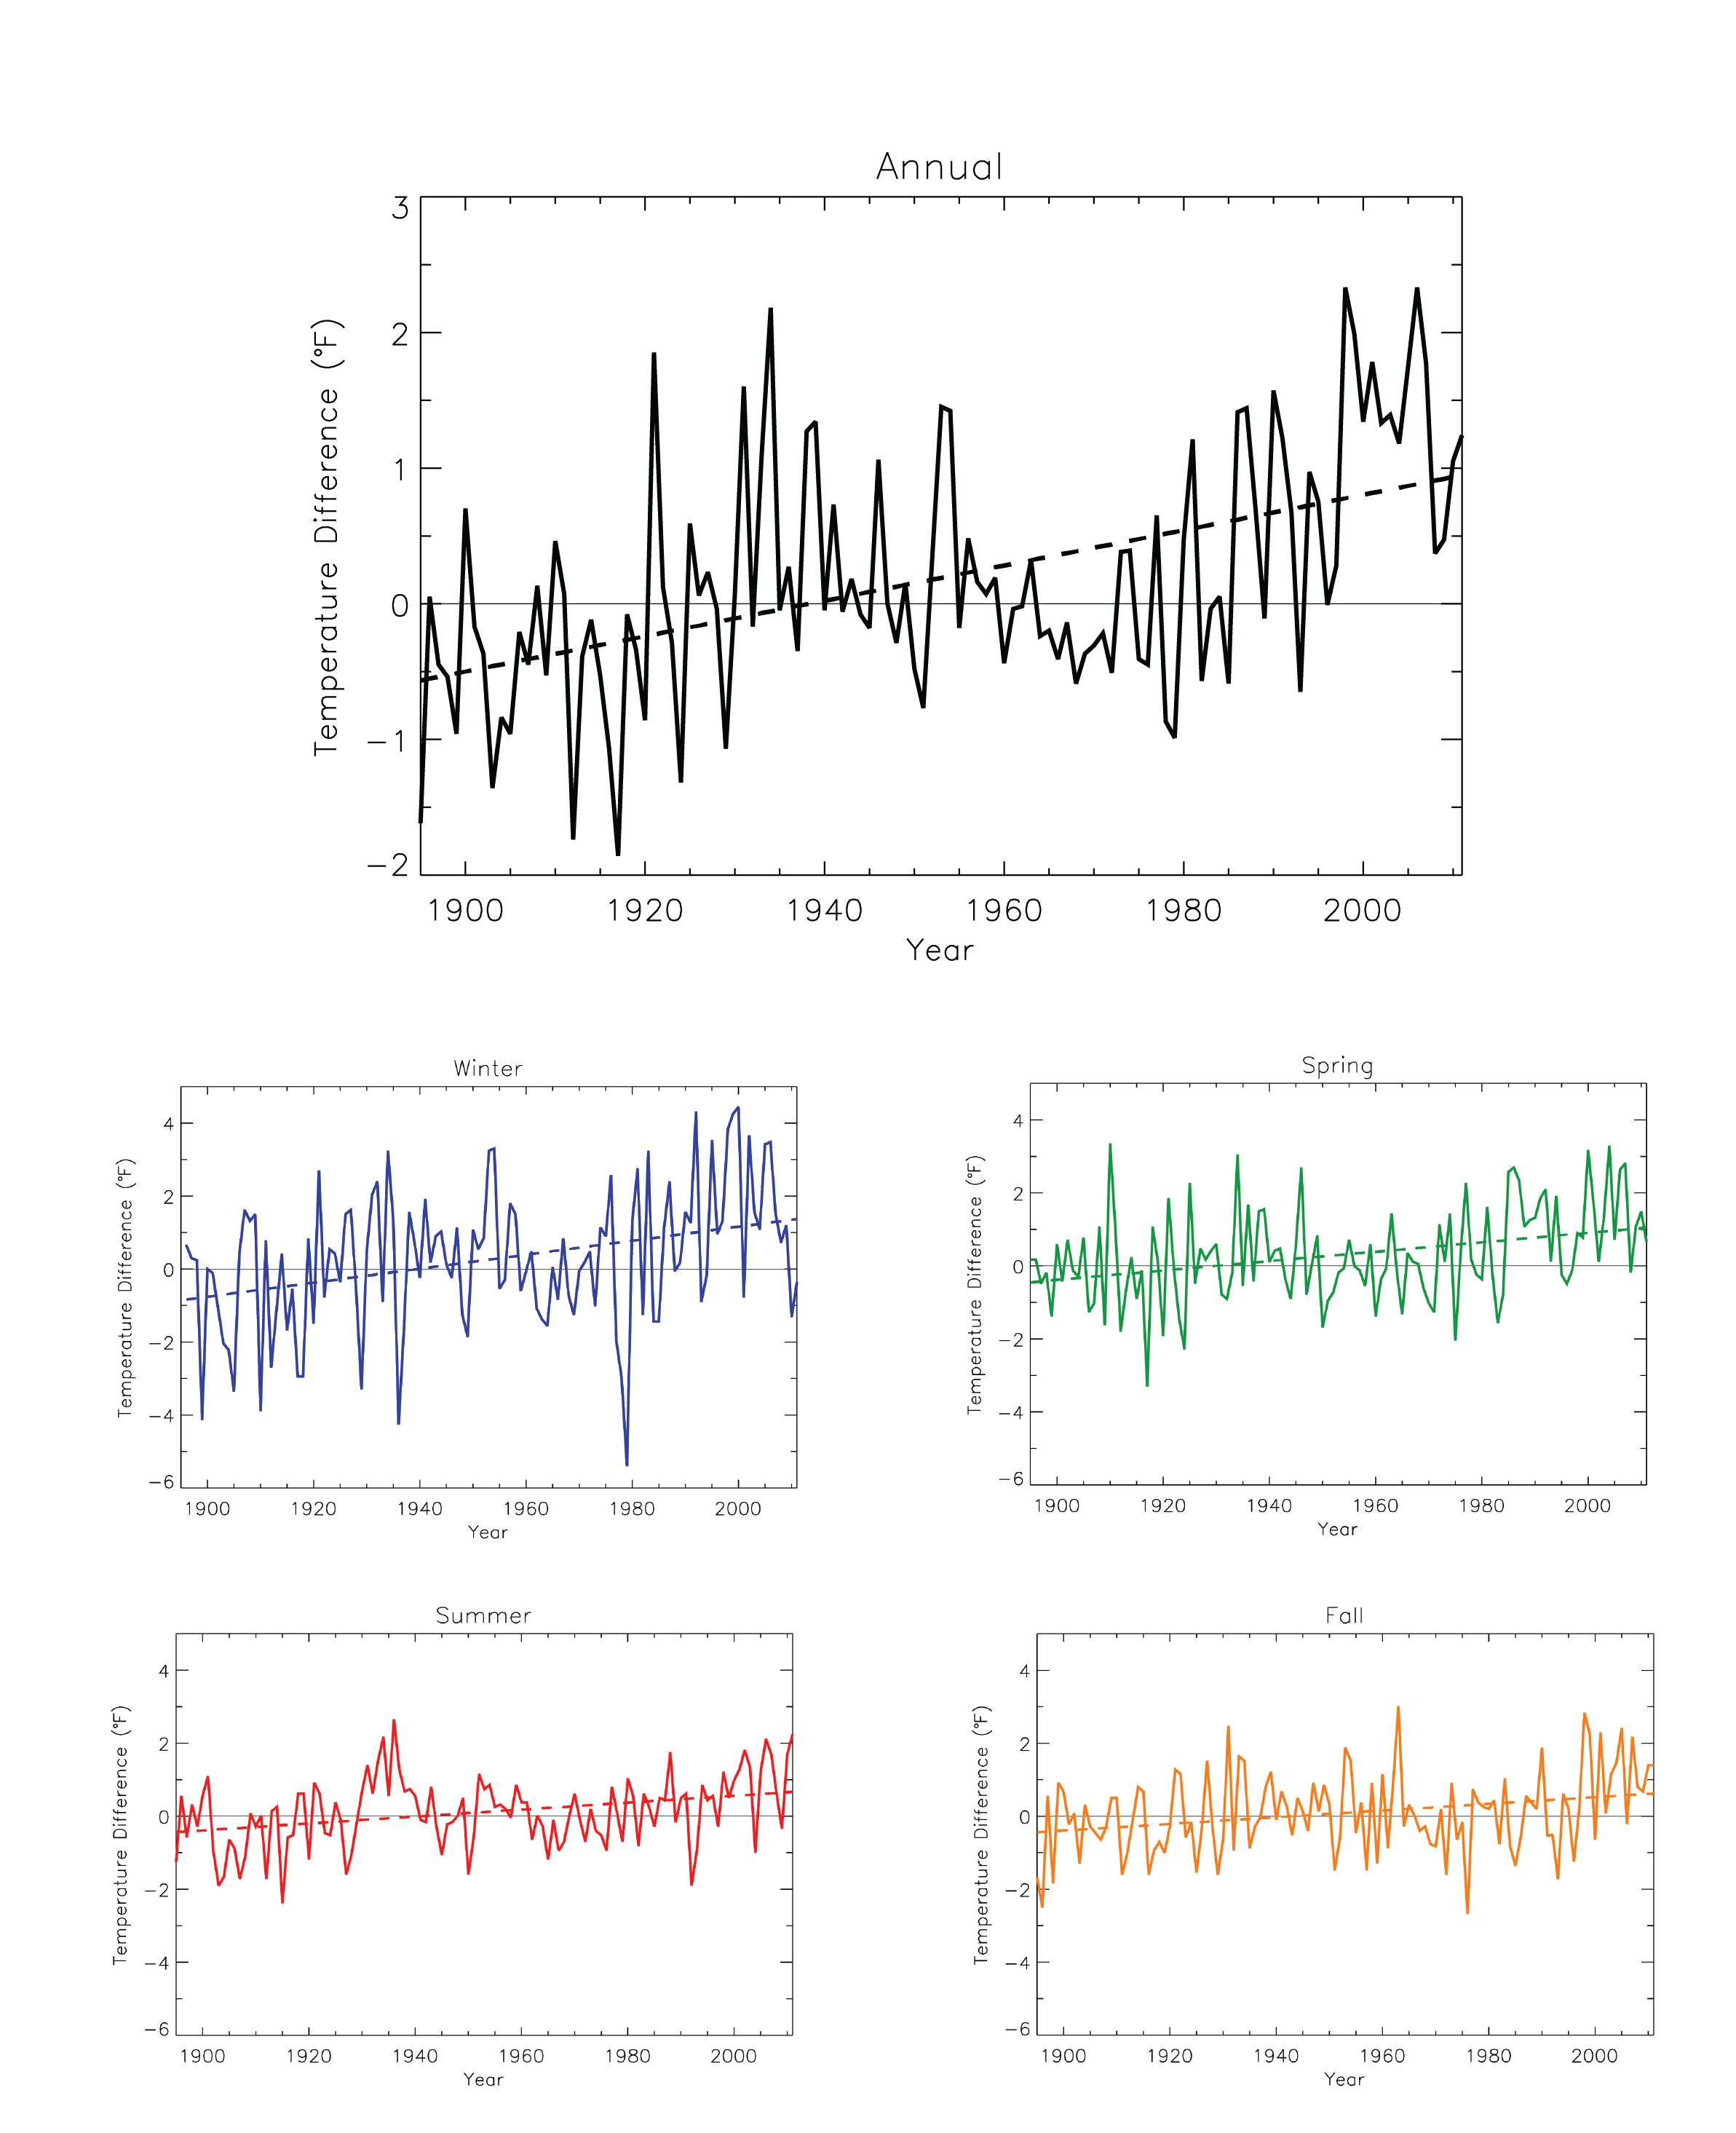
Annual and seasonal temperature anomaly |
NCA 3 |
 |
|
Simulated difference in mean annual precipitation |
NCA 3 |
 |
|
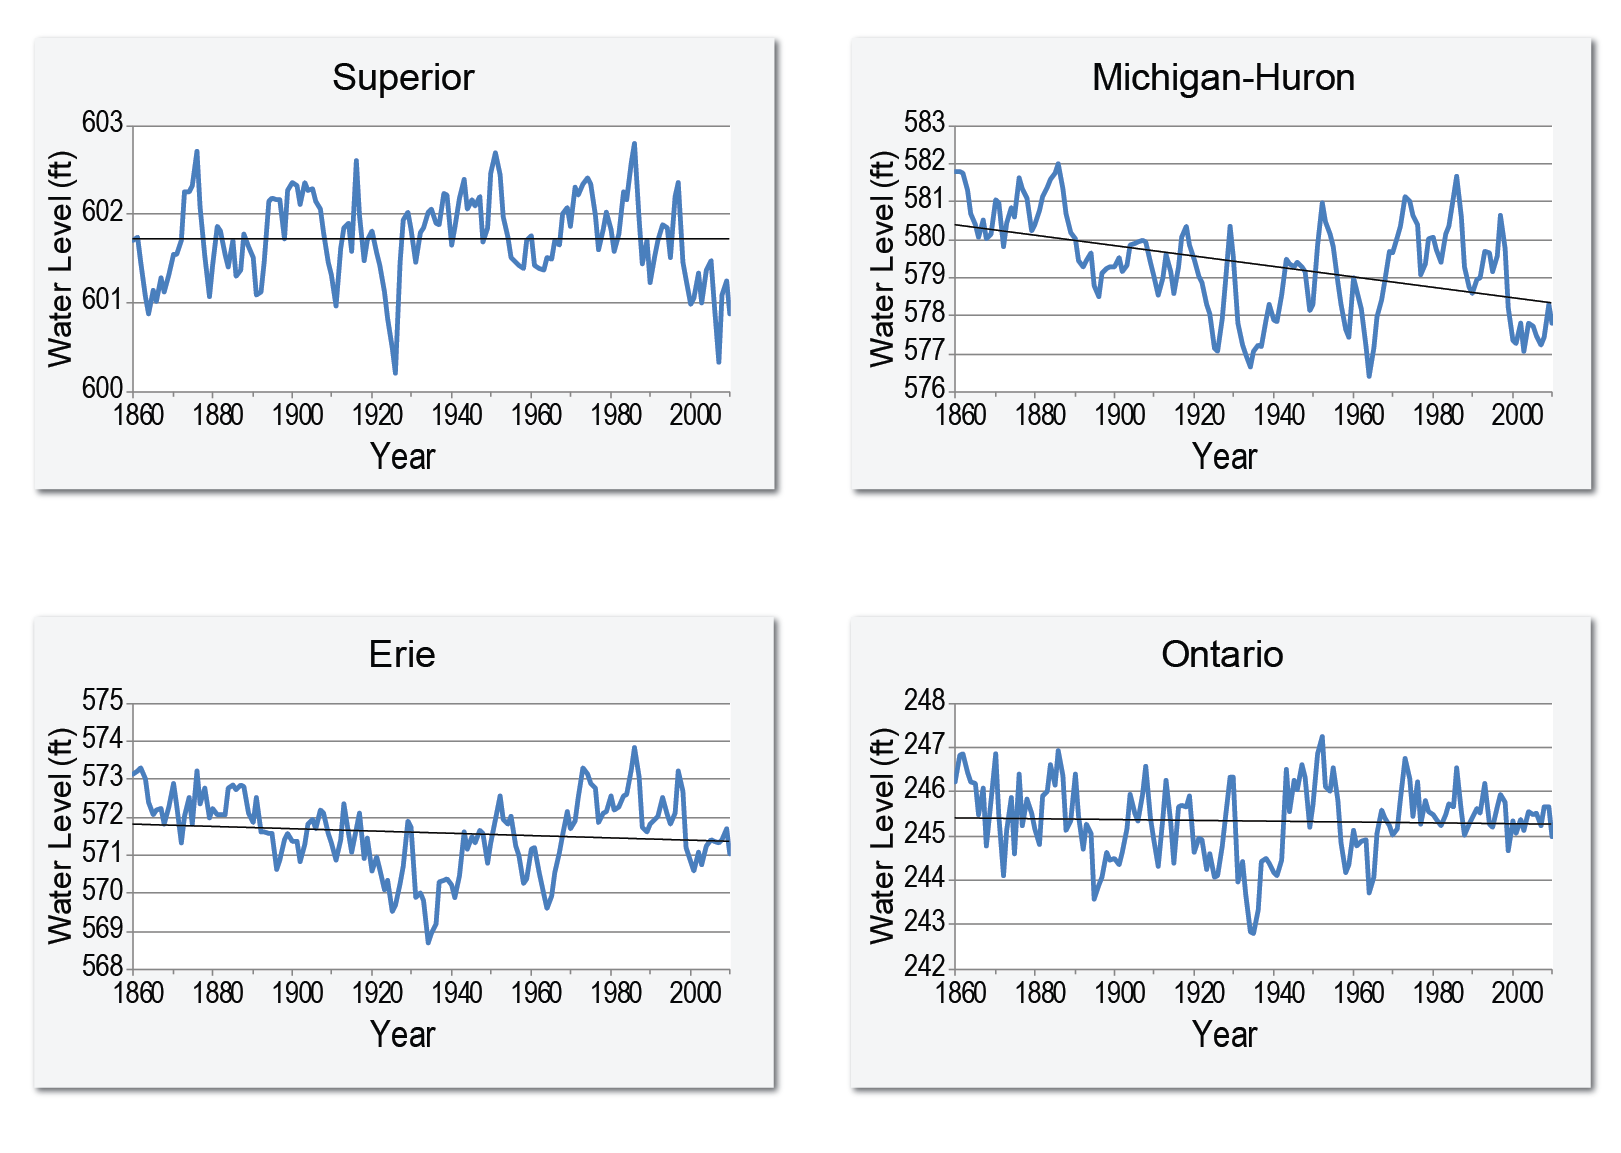
Hydrographs of lake levels for each of the Great Lakes |
NCA 3 |
 |
|
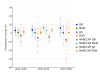
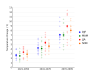
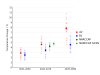
Distribution of the simulated change in annual mean temperature |
NCA 3 |
 |
|
Observed decadal mean seasonal temperature change |
NCA 3 |
 |
|
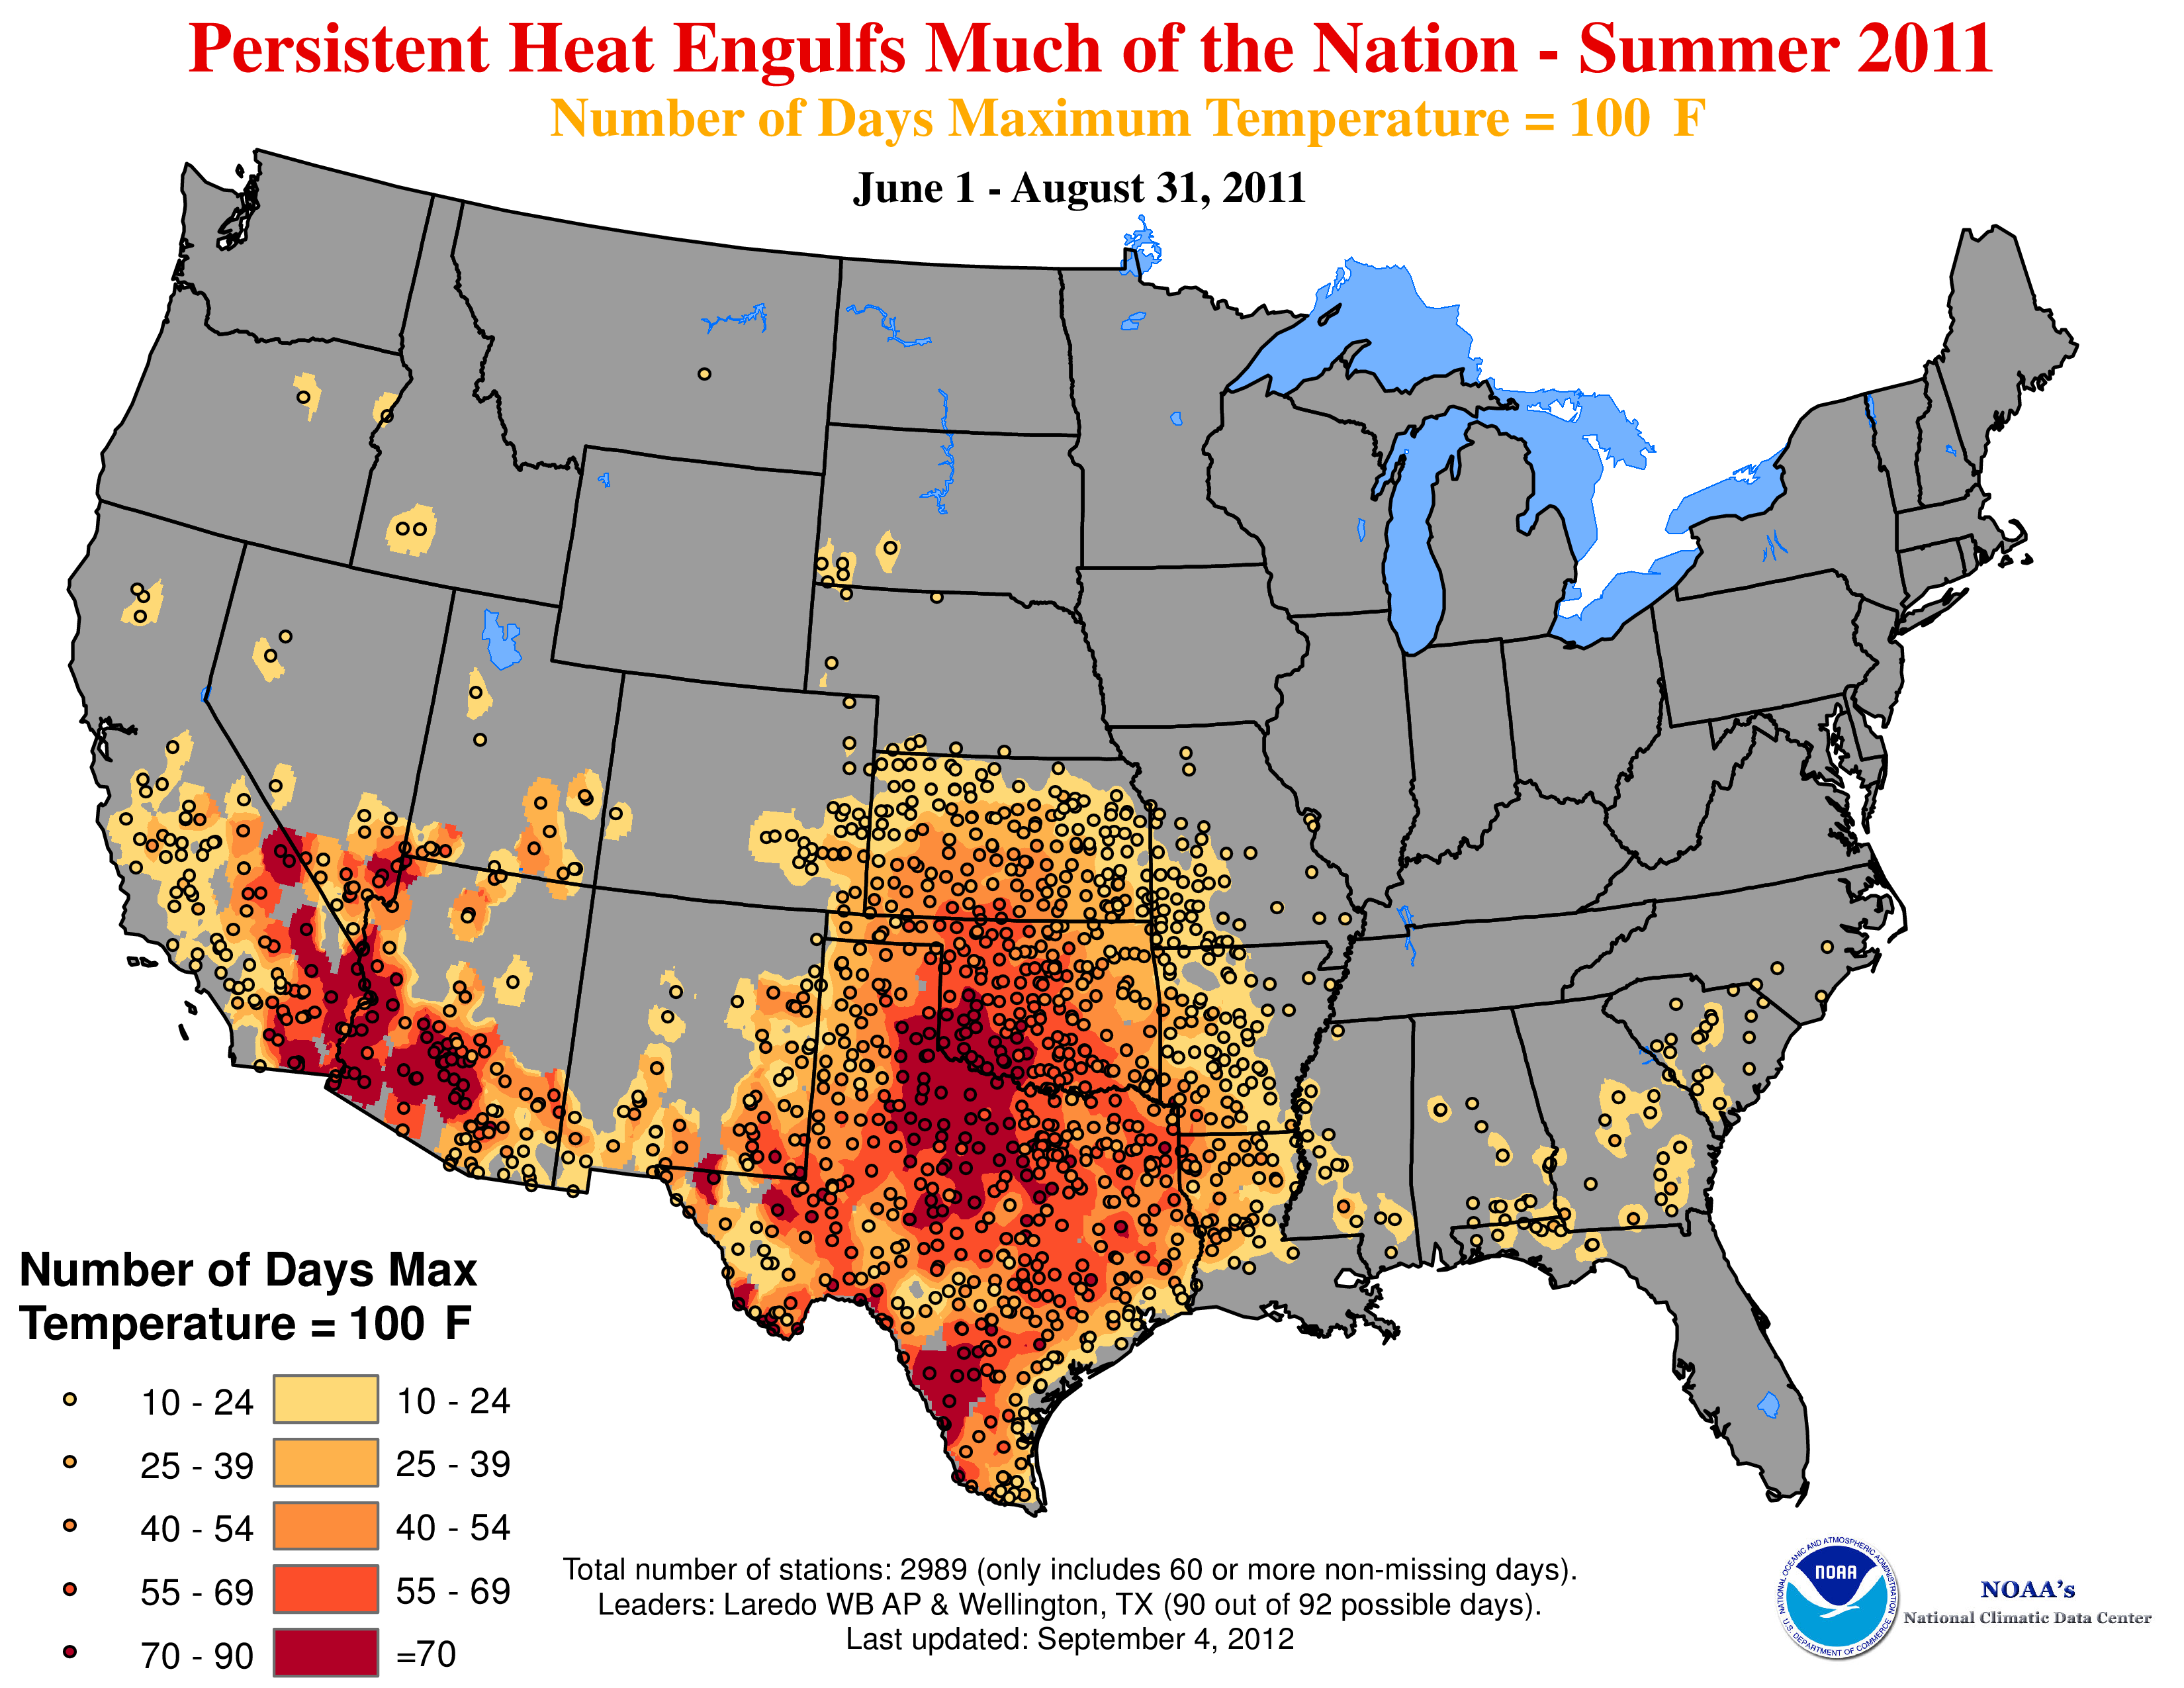
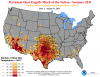
Number of days with maximum temperature exceeding 100F |
NCA 3 |
 |
|
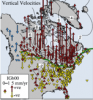
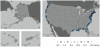
Vertical GPS site motions with respect to IGb00 |
NCA 3 |
 |
|
Contribution of GIA to net changes in RSL |
NCA 3 |
 |
|
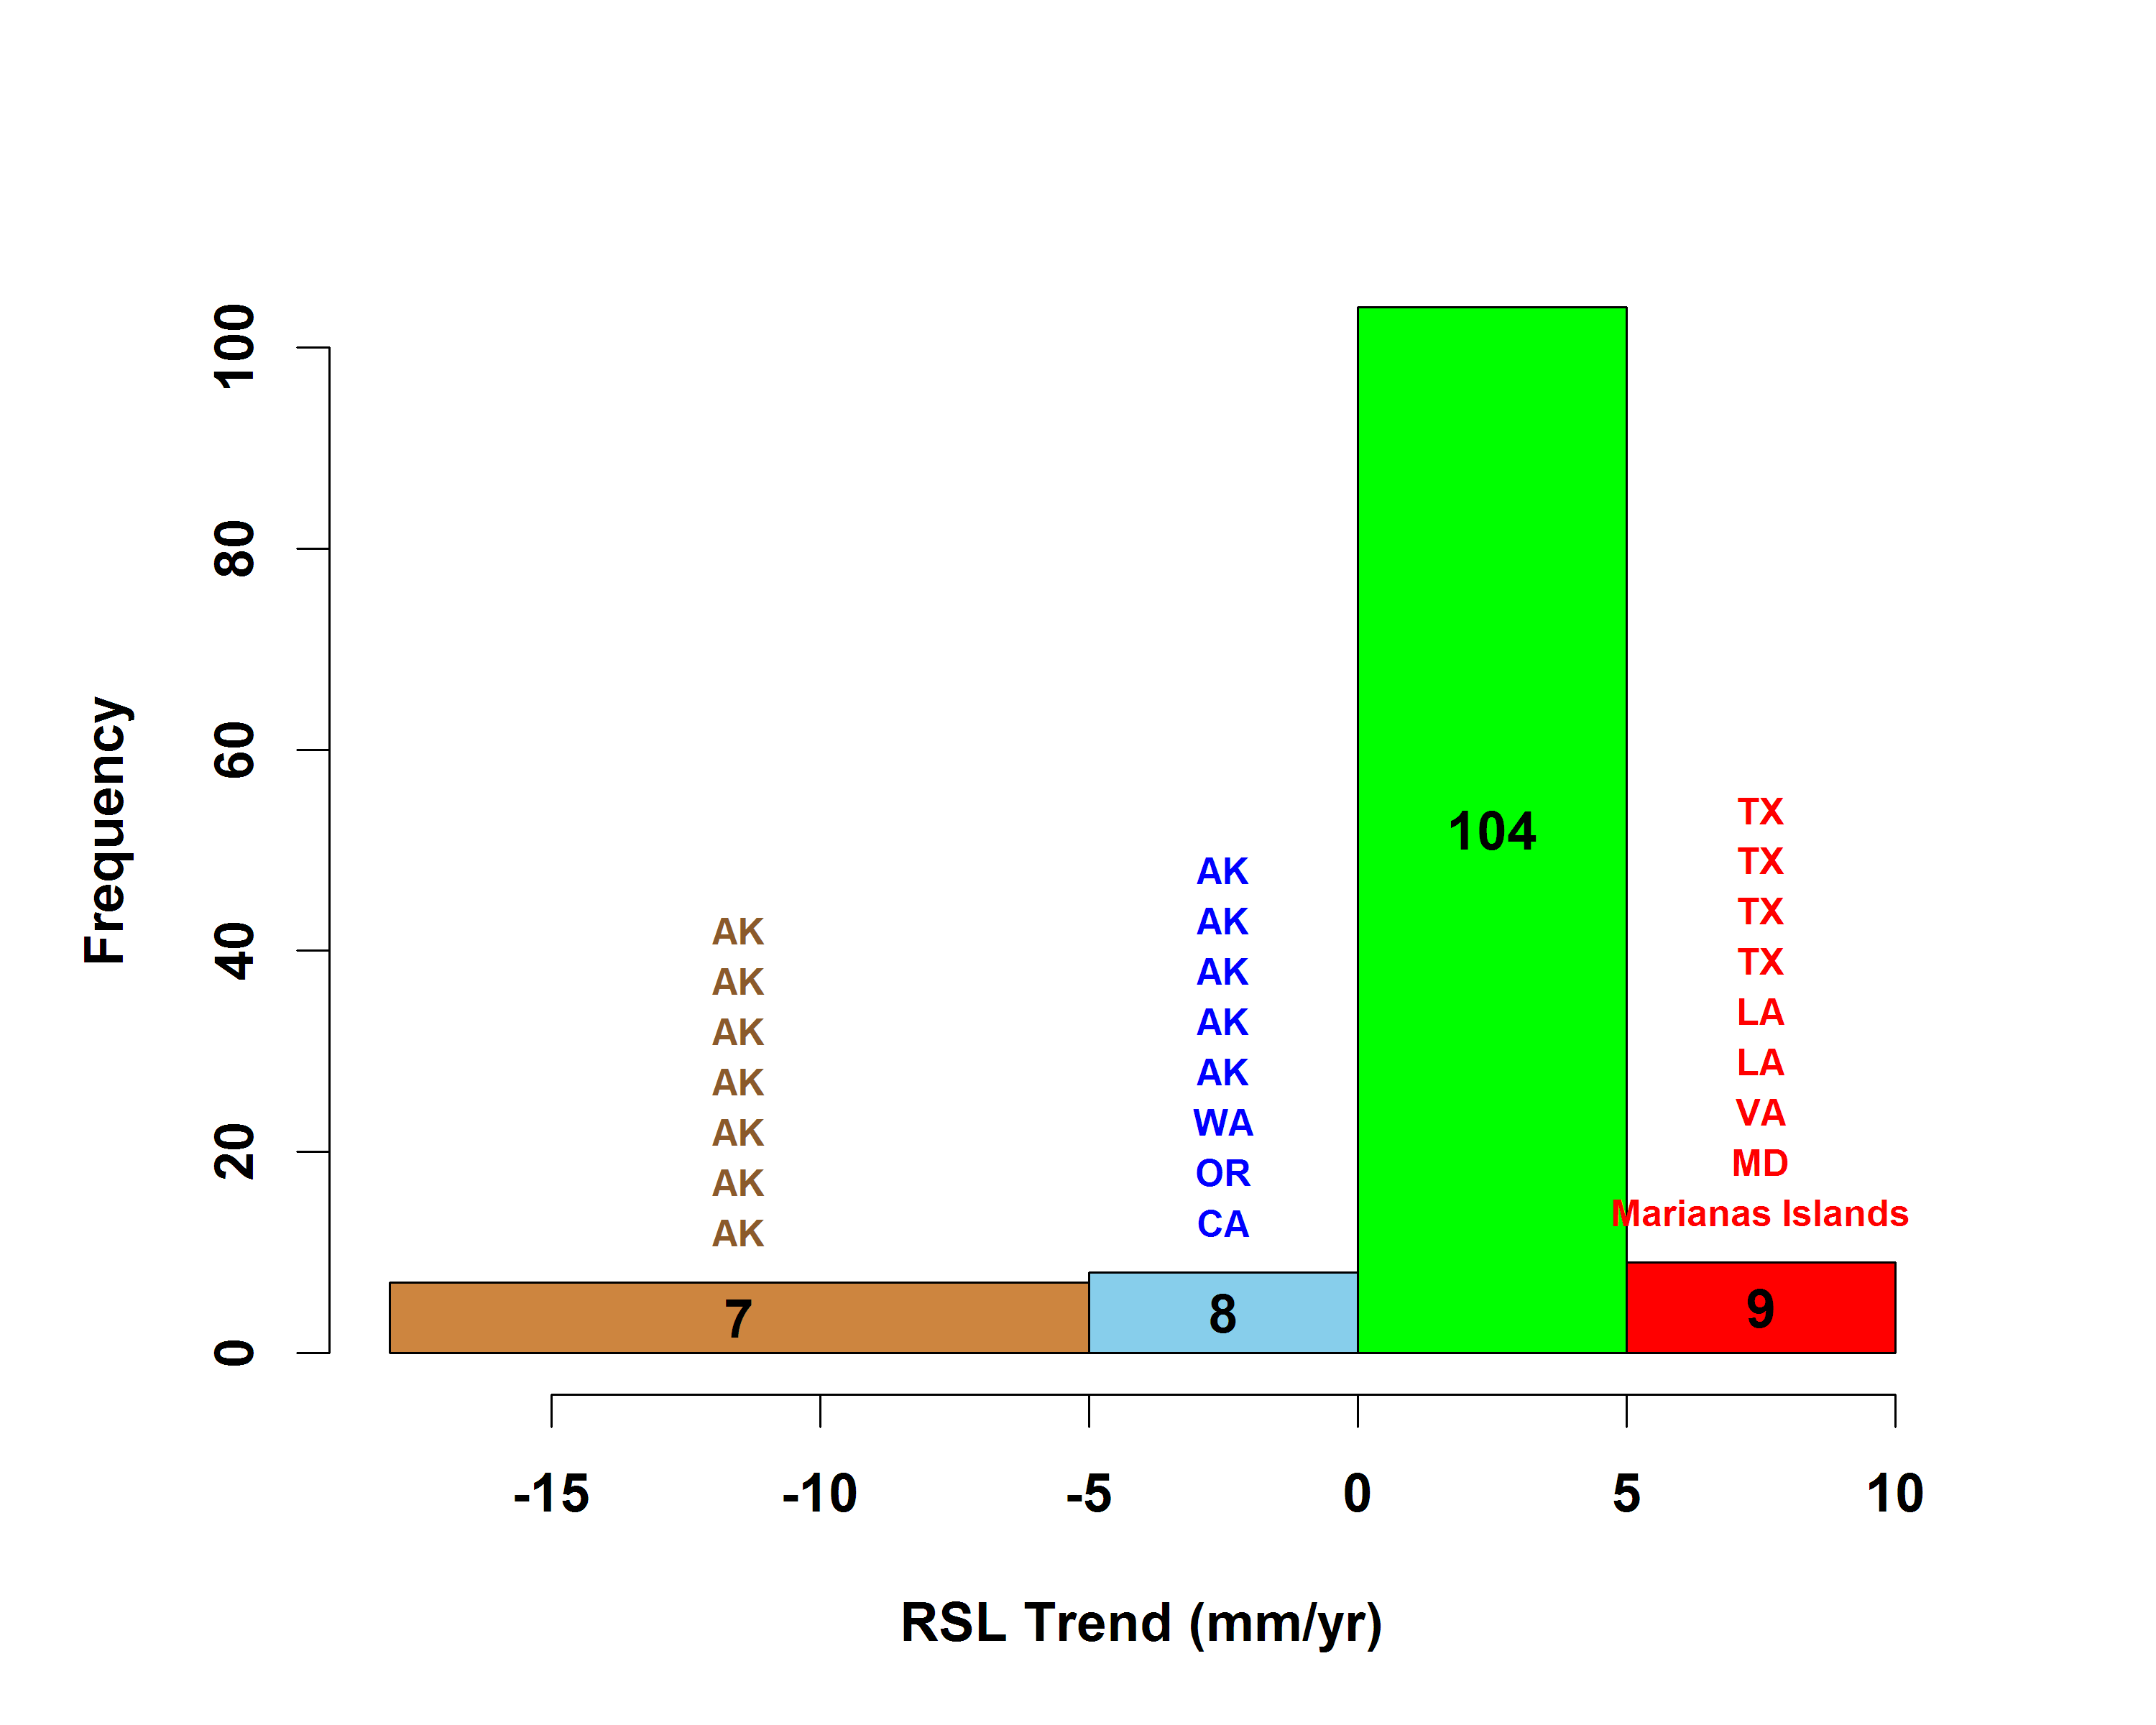
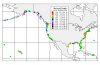
Number of US tide gauges reflecting RSL variations |
NCA 3 |
 |
|
Relative Sea Level (RSL) Variations of the United States (1854 to 2006) |
NCA 3 |
 |