|
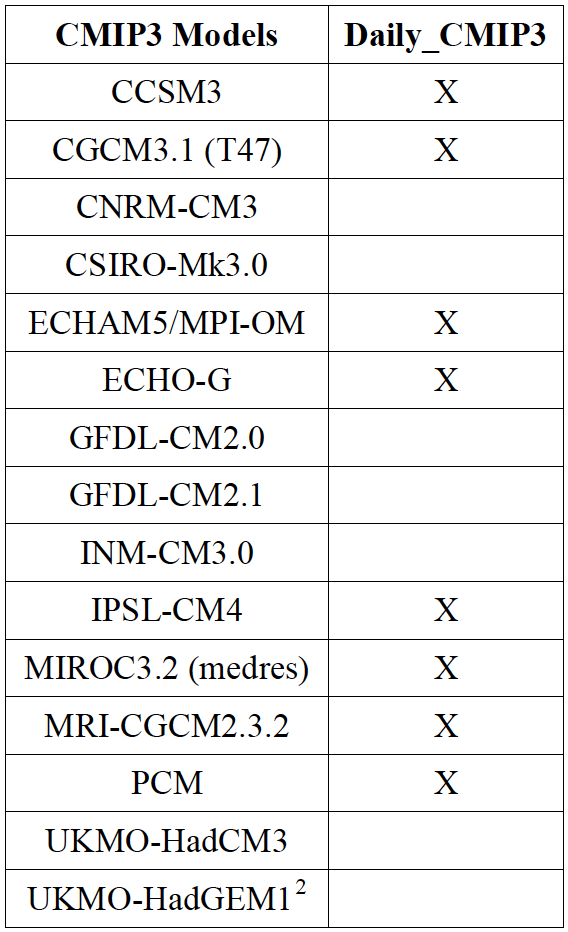
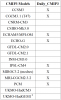
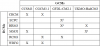
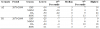
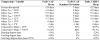
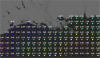
CMIP3 Models Listing |
NCA 3 |
 |
|
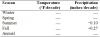
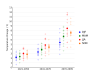
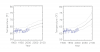
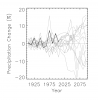
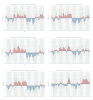
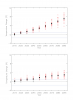
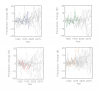
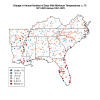
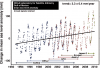
Trends in temperature and precipitation anomaly |
NCA 3 |
 |
|
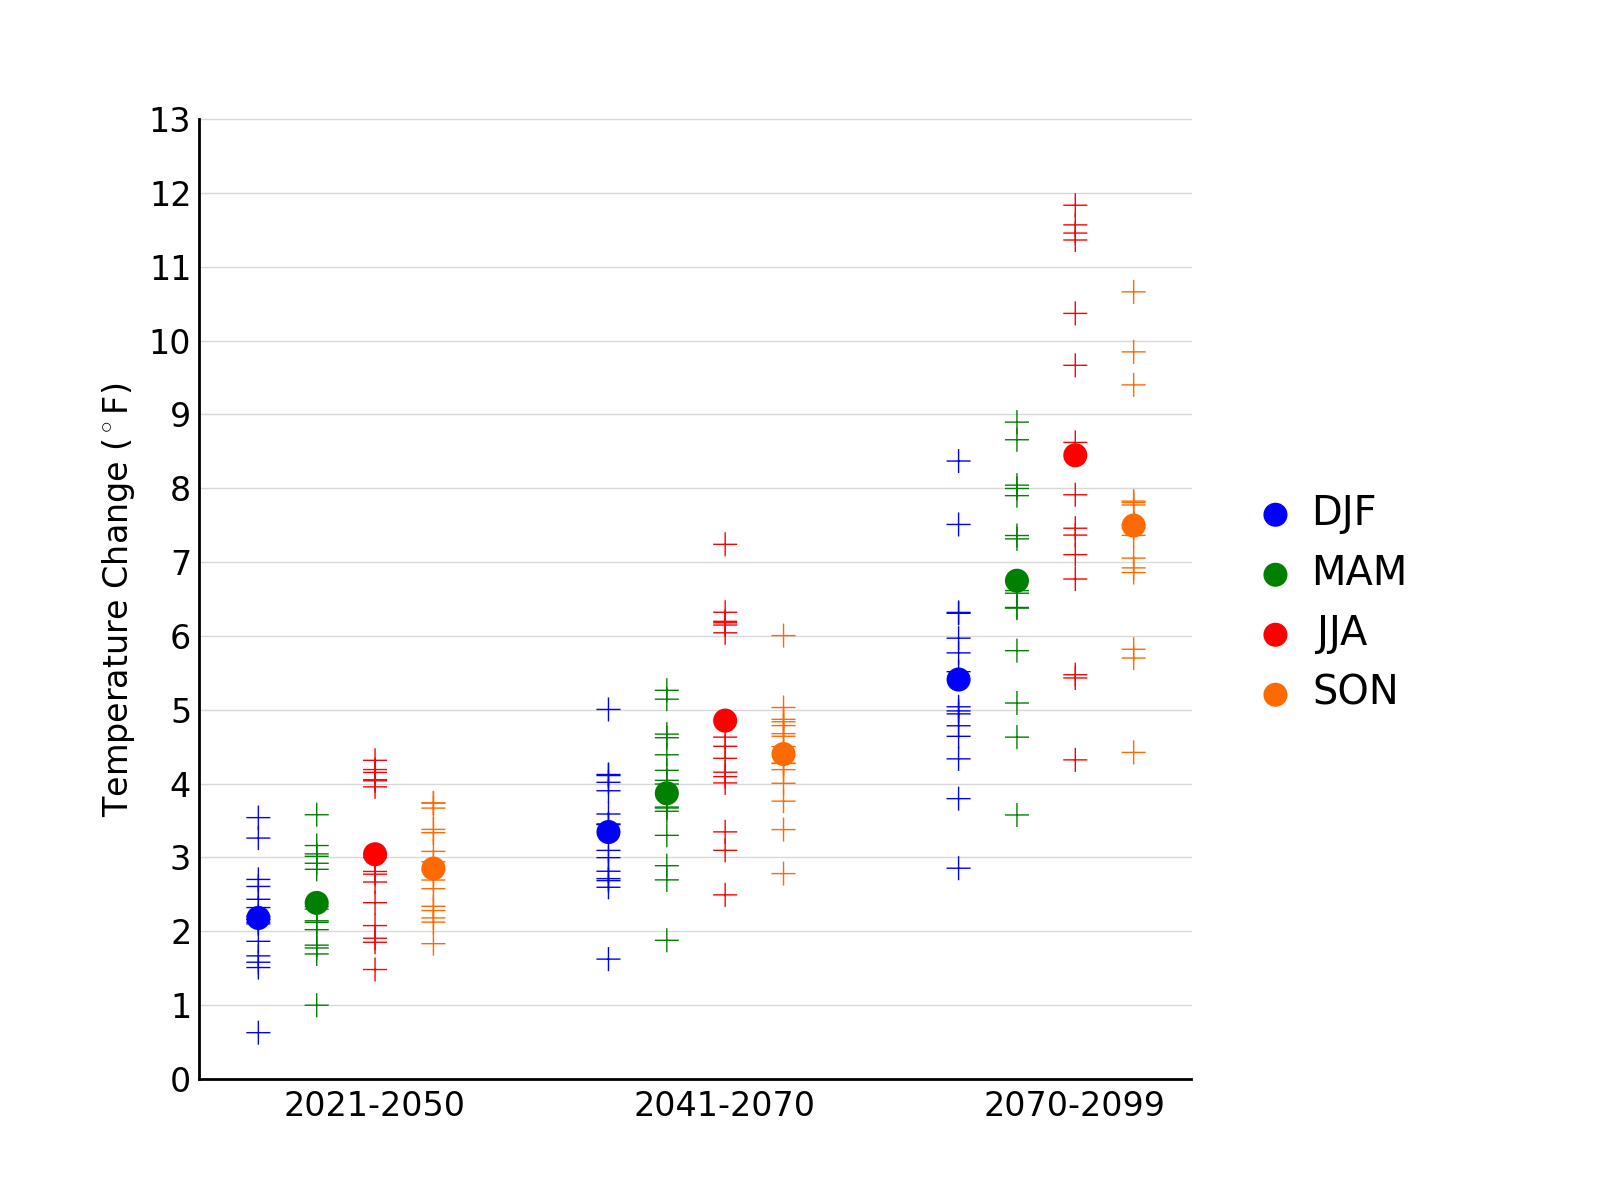
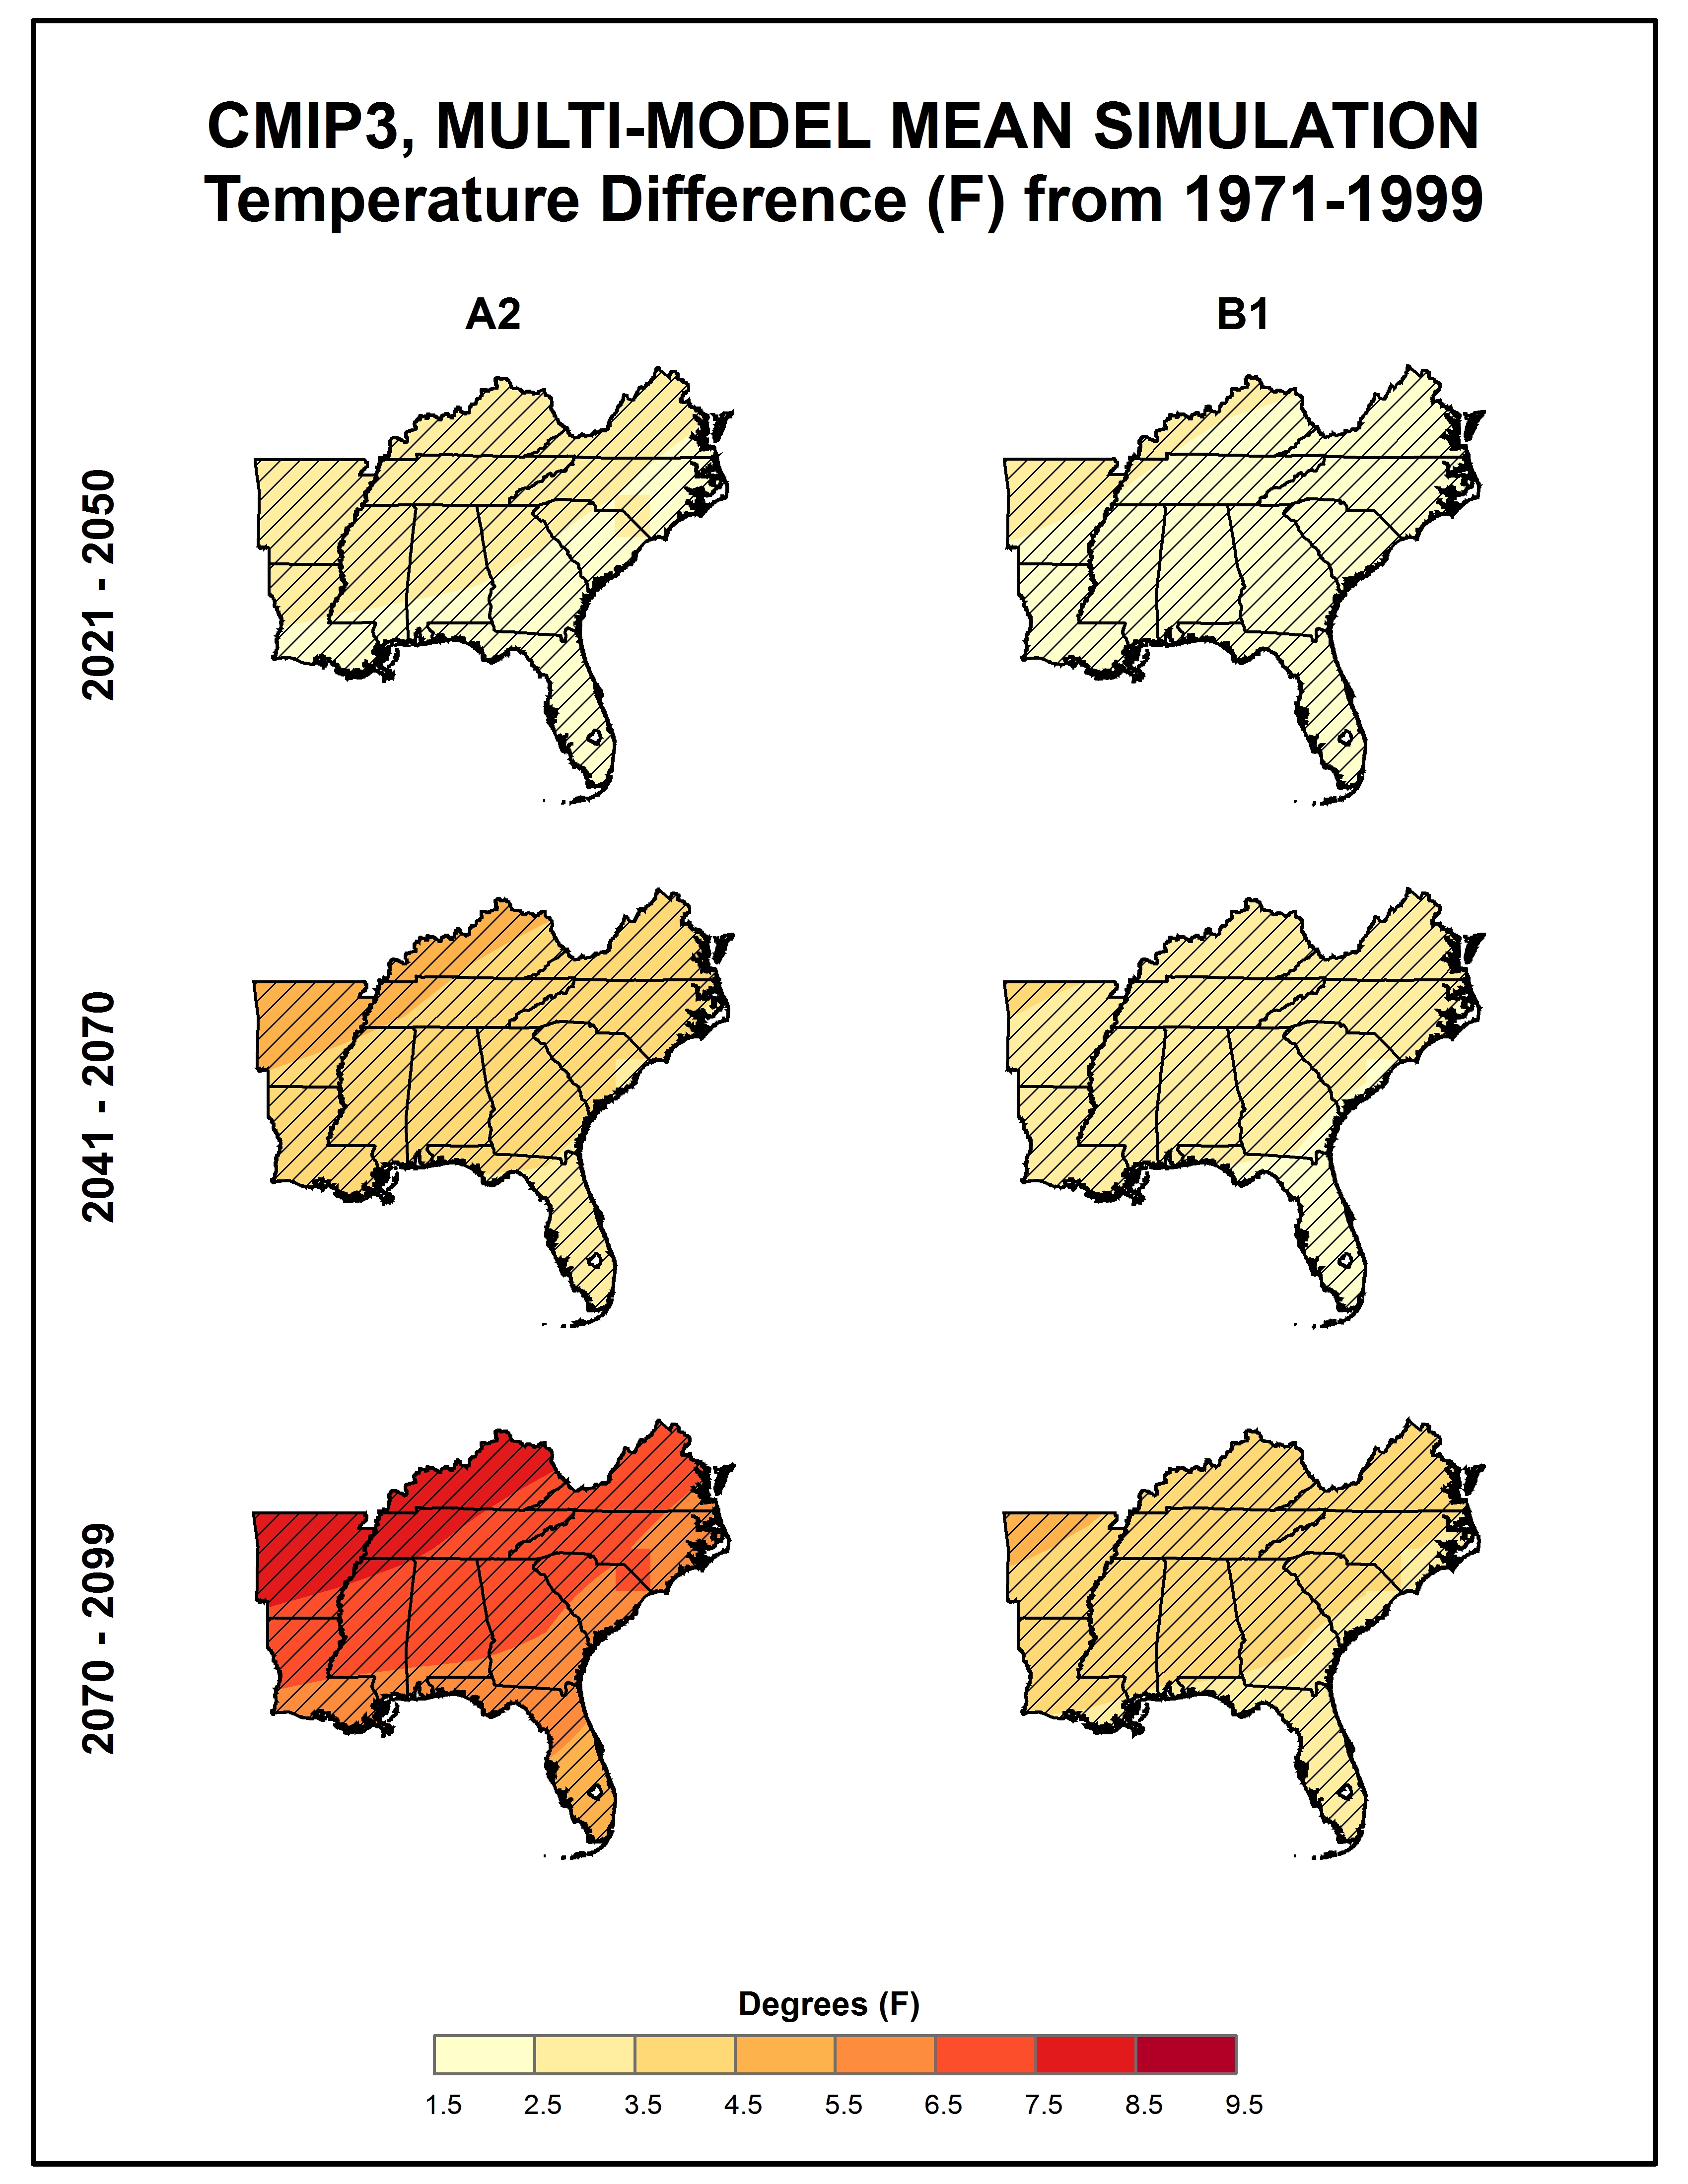
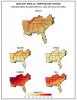
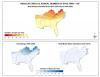
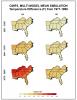
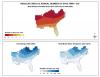
Simulated seasonal mean temperature change |
NCA 3 |
 |
|
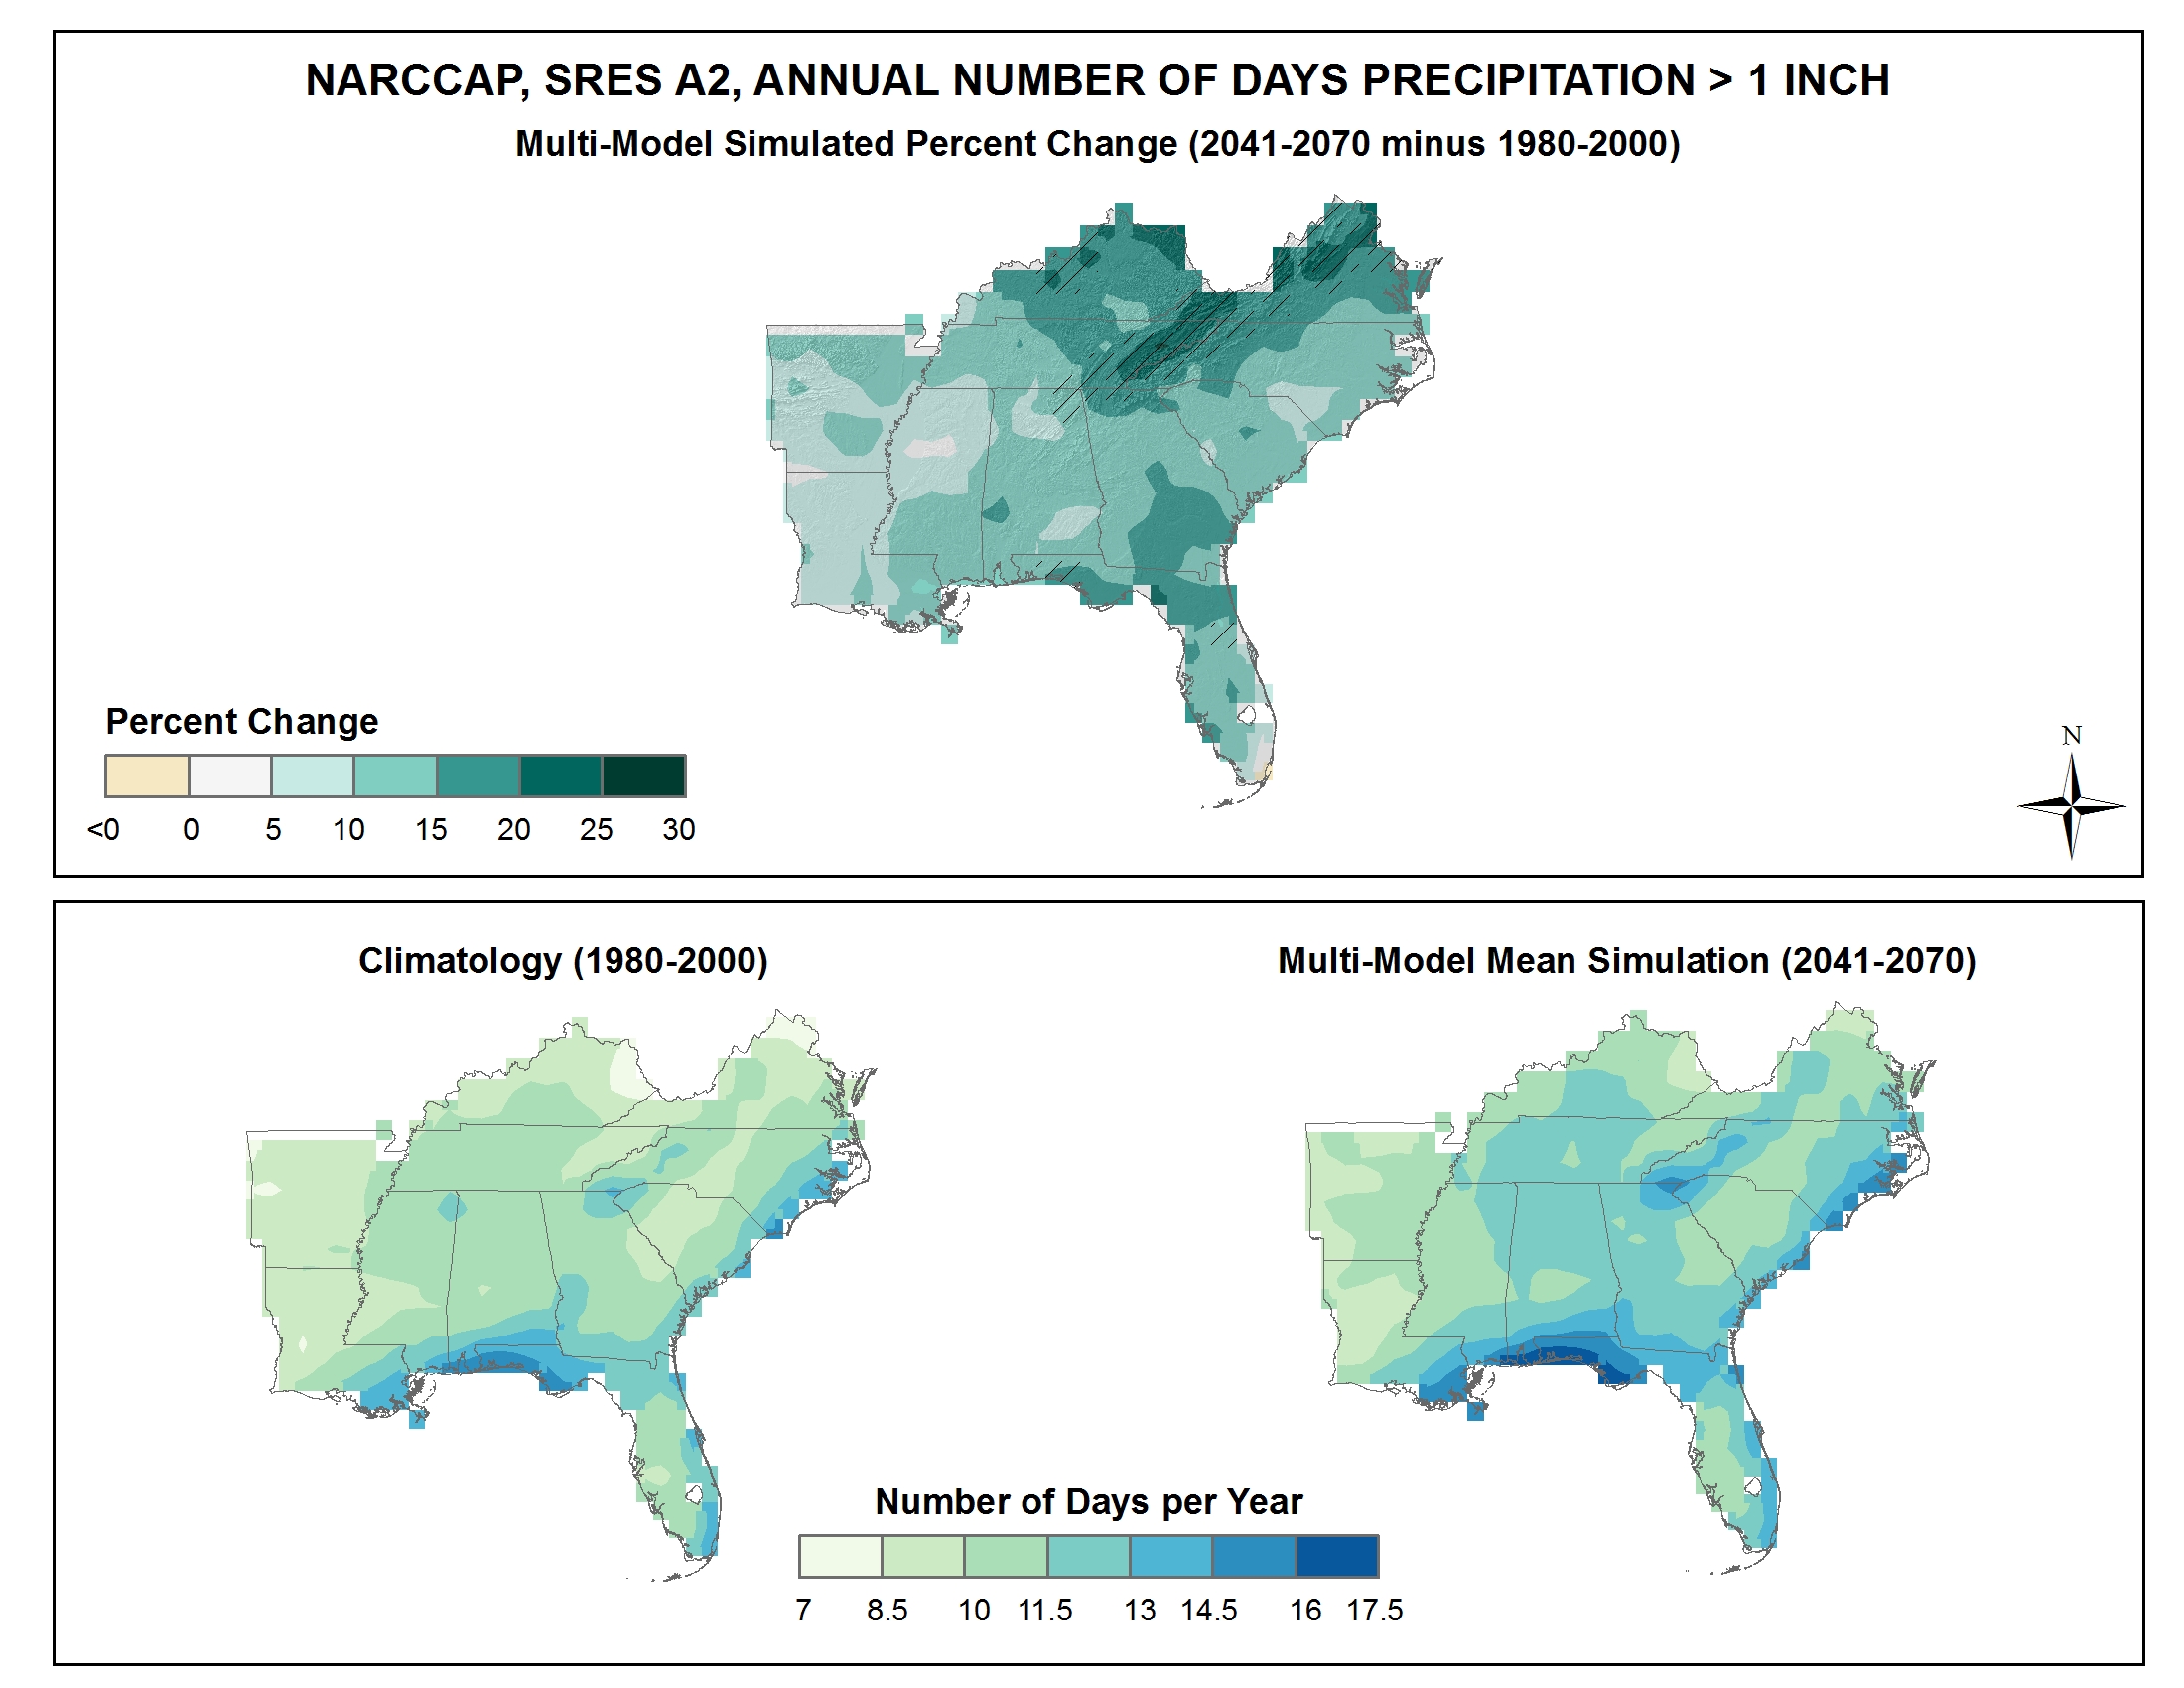
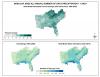
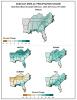
Simulated difference in the mean annual number of days with precipitation of greater than one inch |
NCA 3 |
 |
|
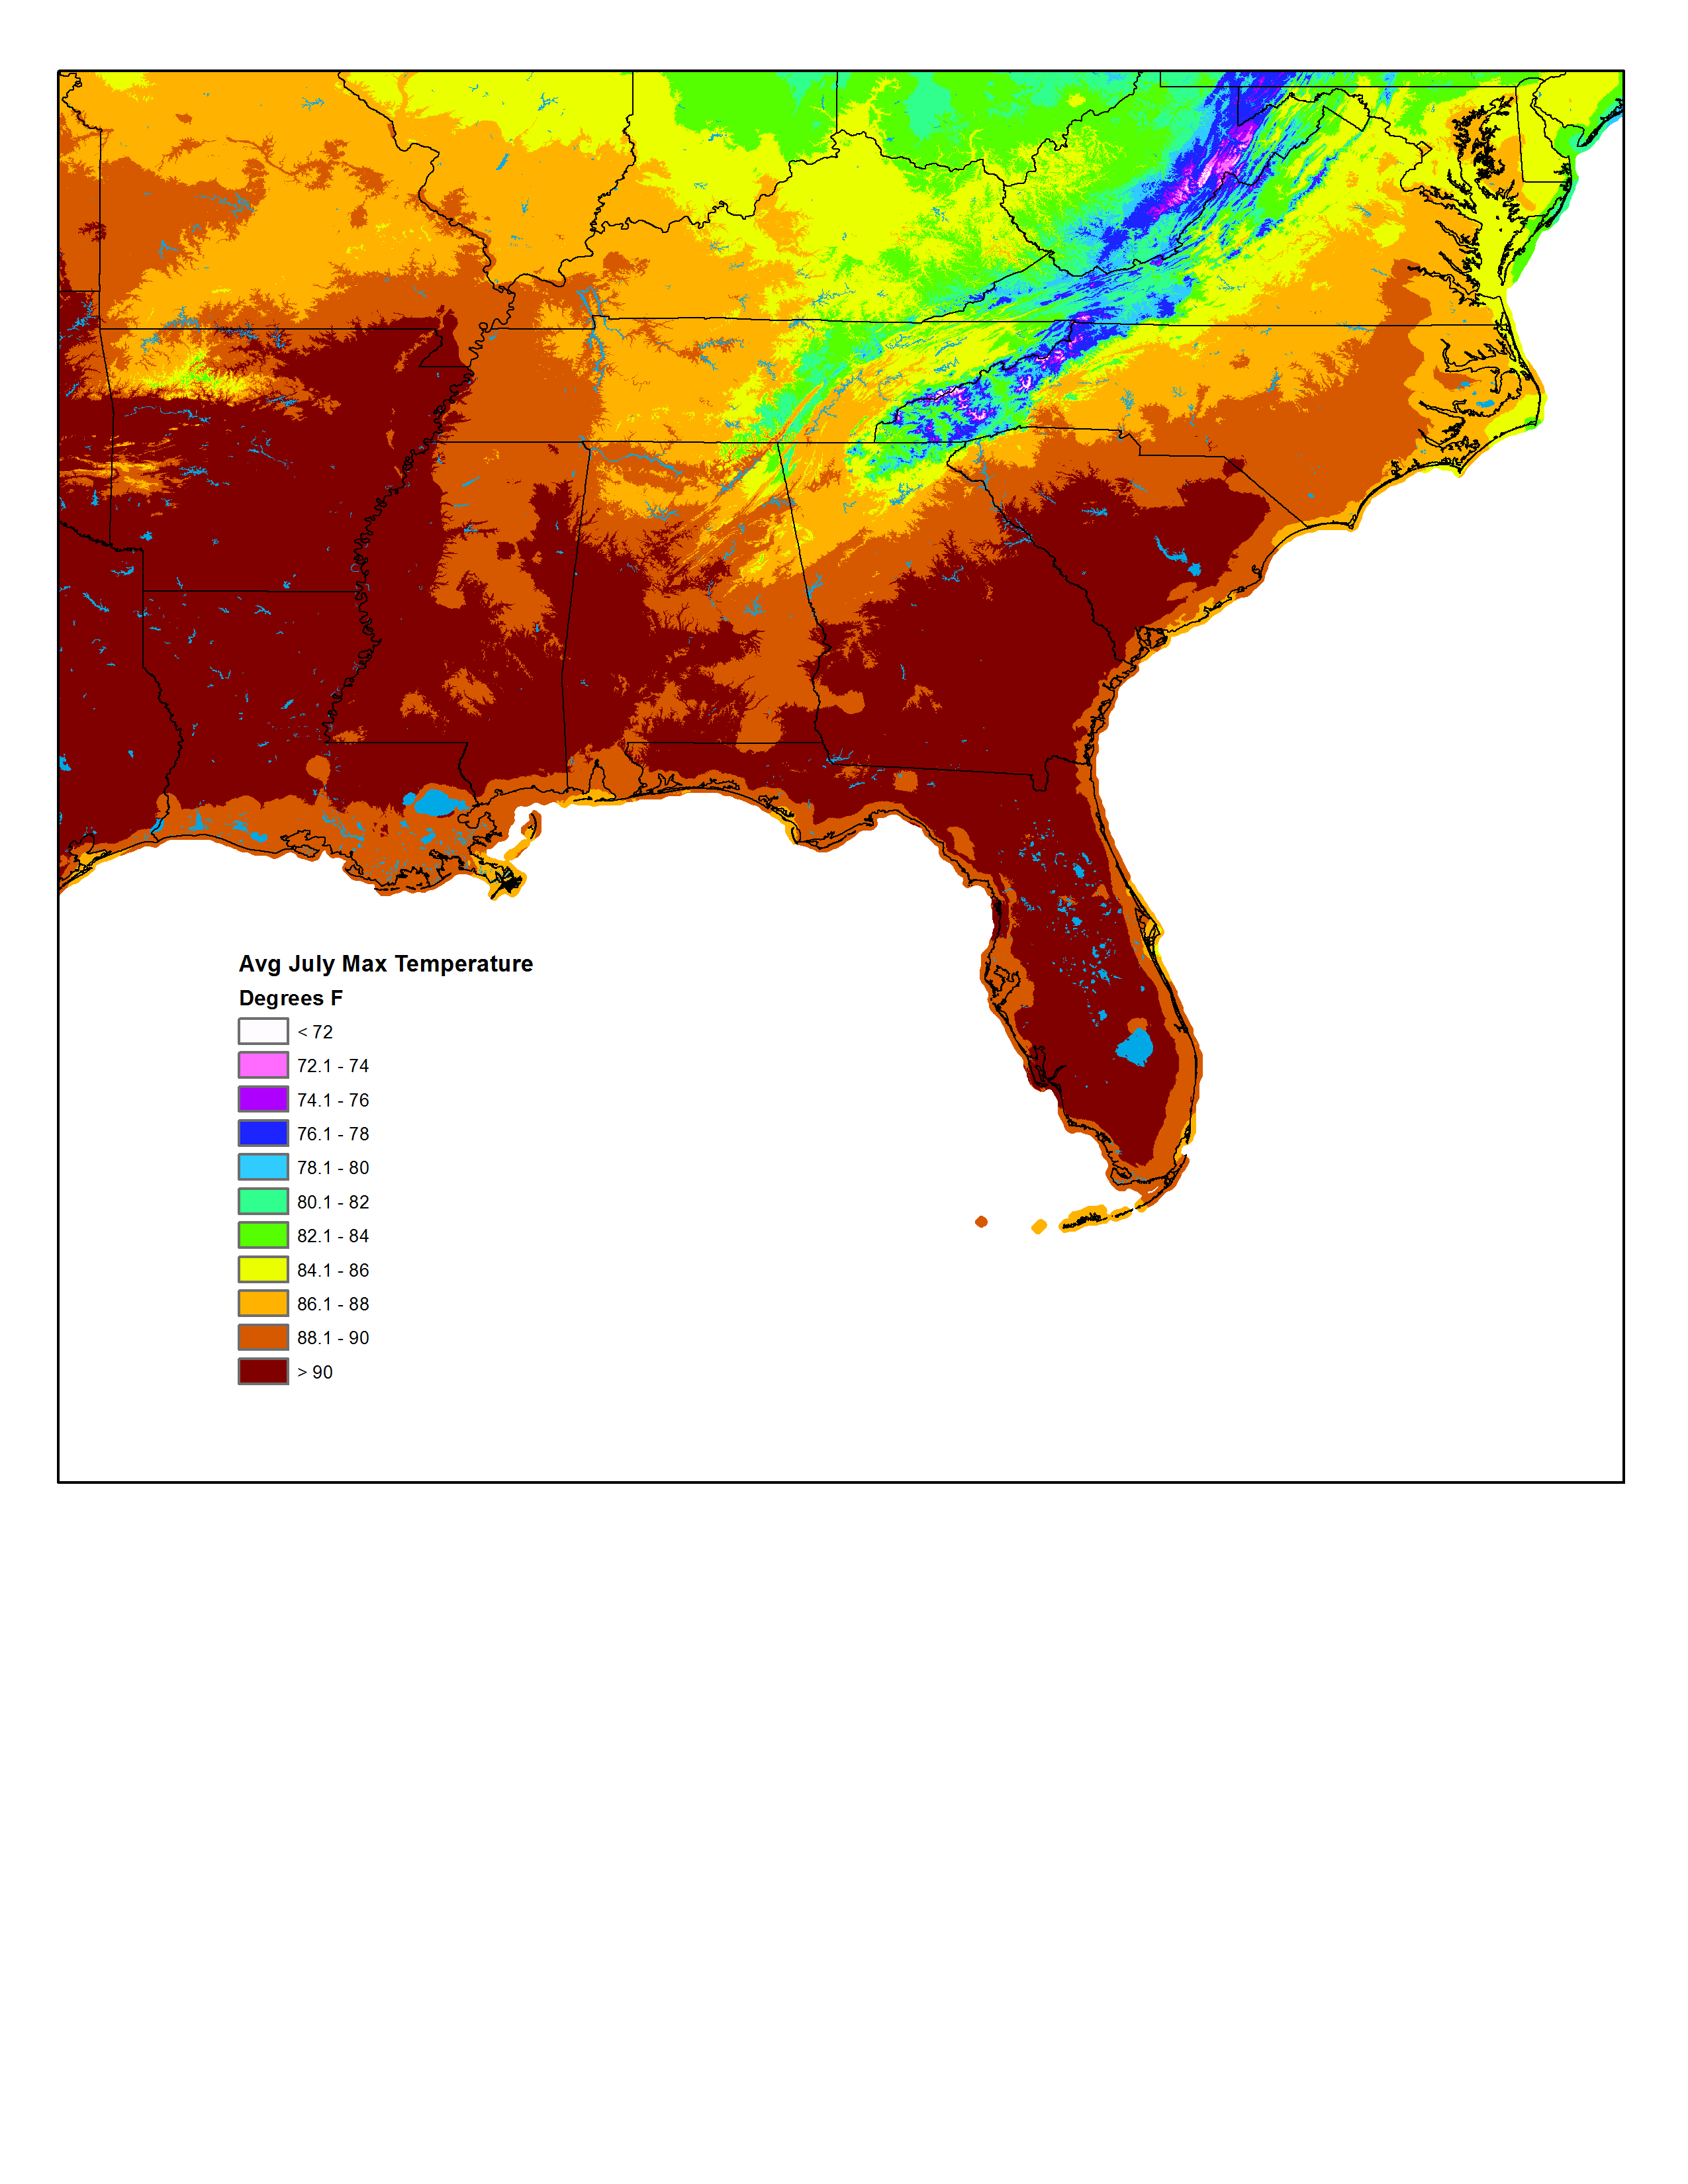
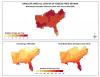
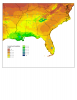
Average daily July maximum temperature |
NCA 3 |
 |
|
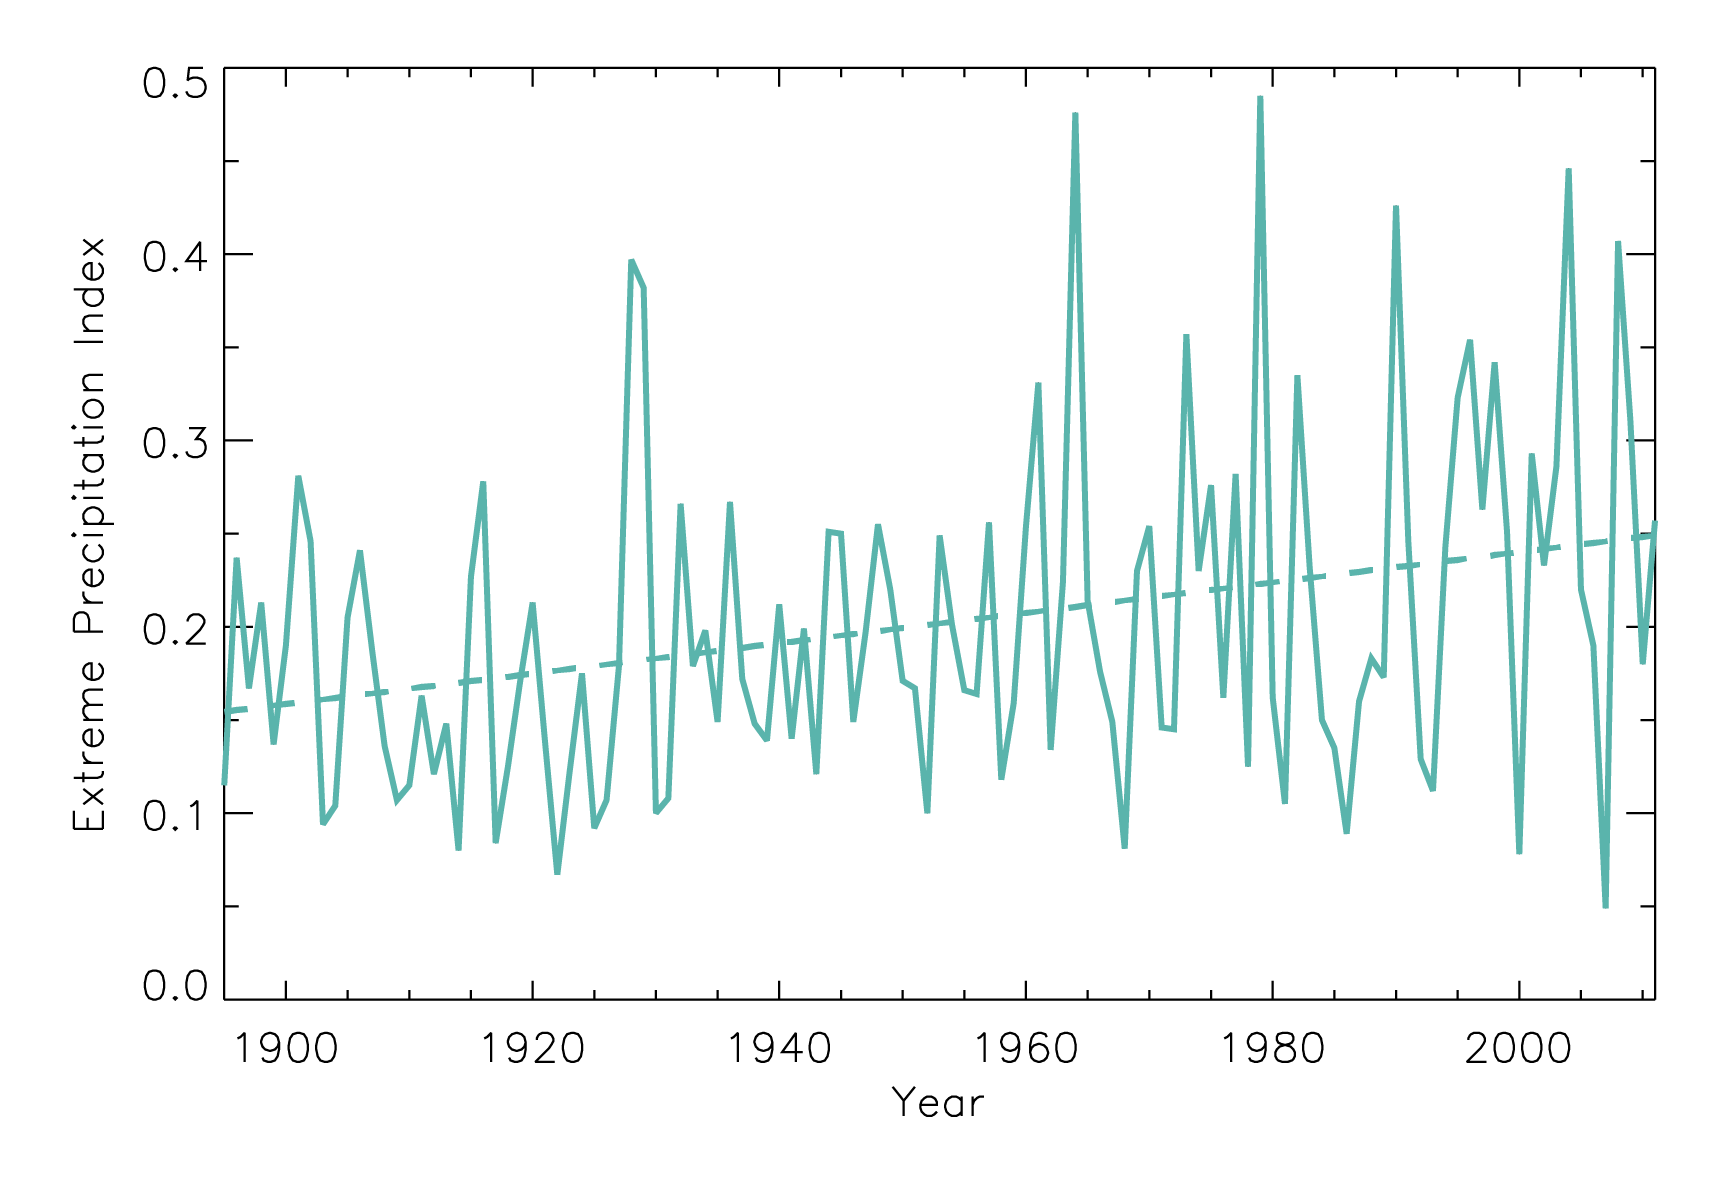
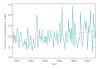
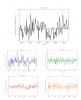
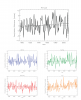
Time series of extreme precipitation index for the occurrence of 1-day, 1 in 5-year extreme precipitation |
NCA 3 |
 |
|
Simulated difference in the mean annual length of the freeze-free season |
NCA 3 |
 |
|
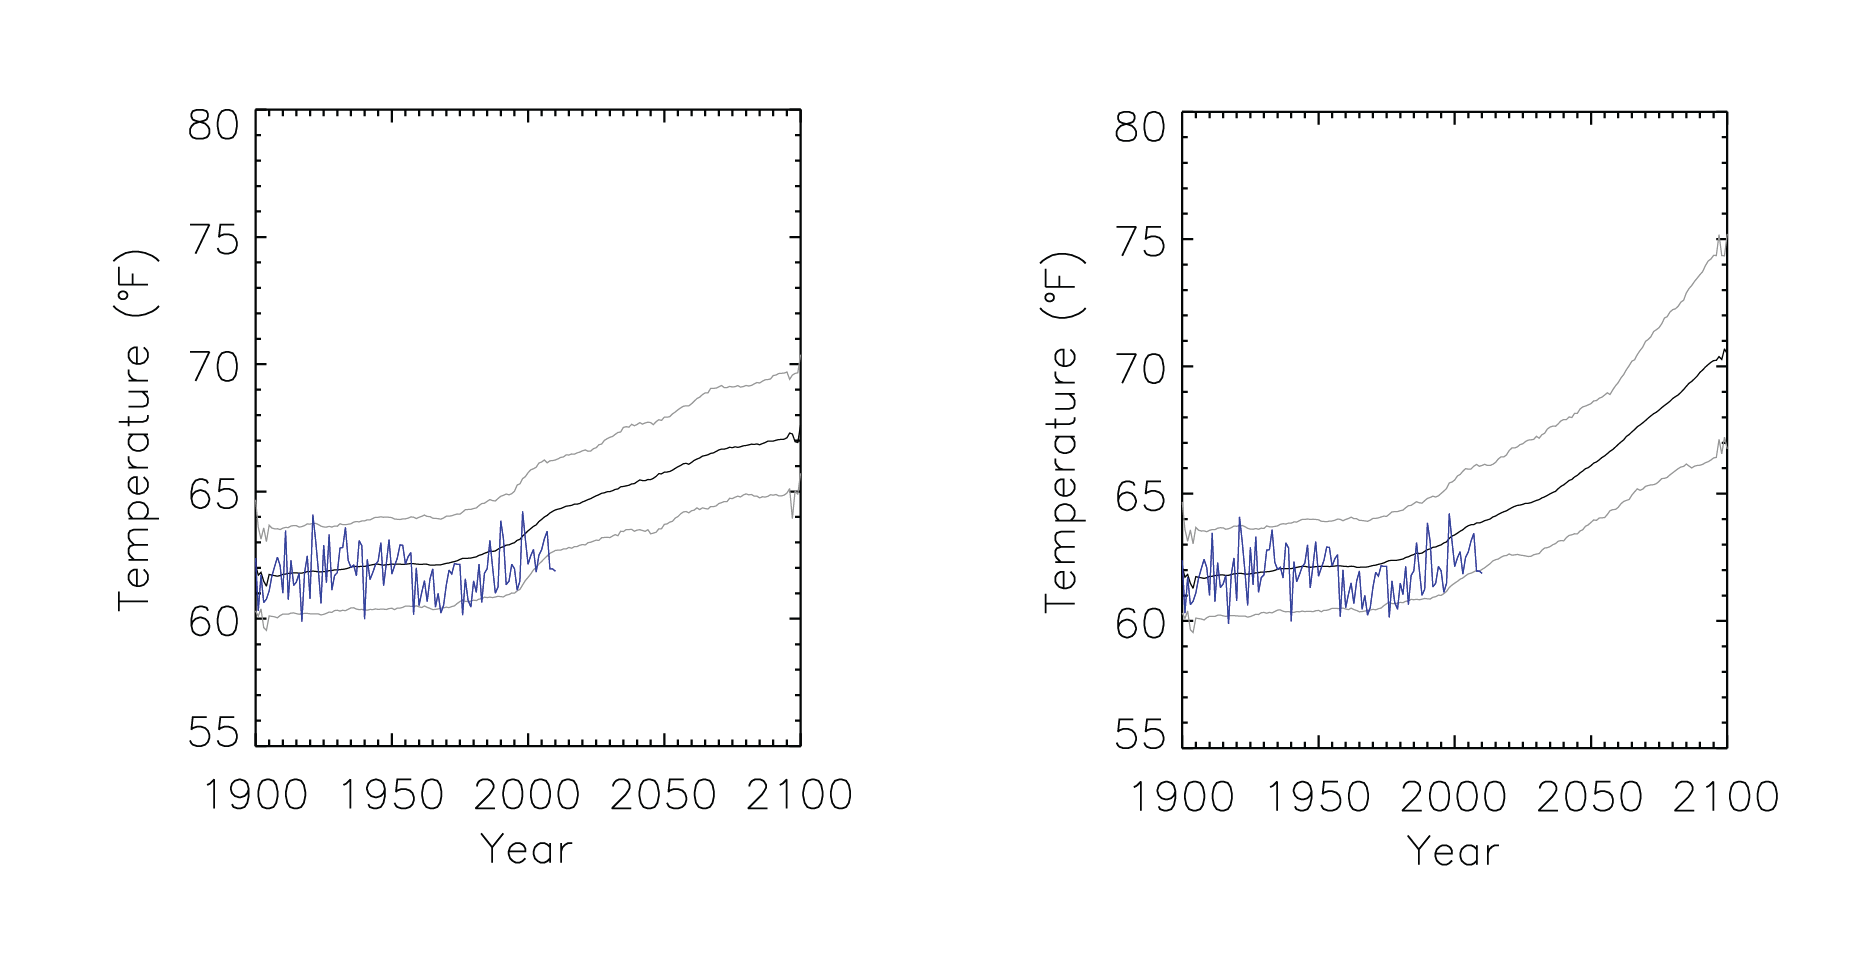
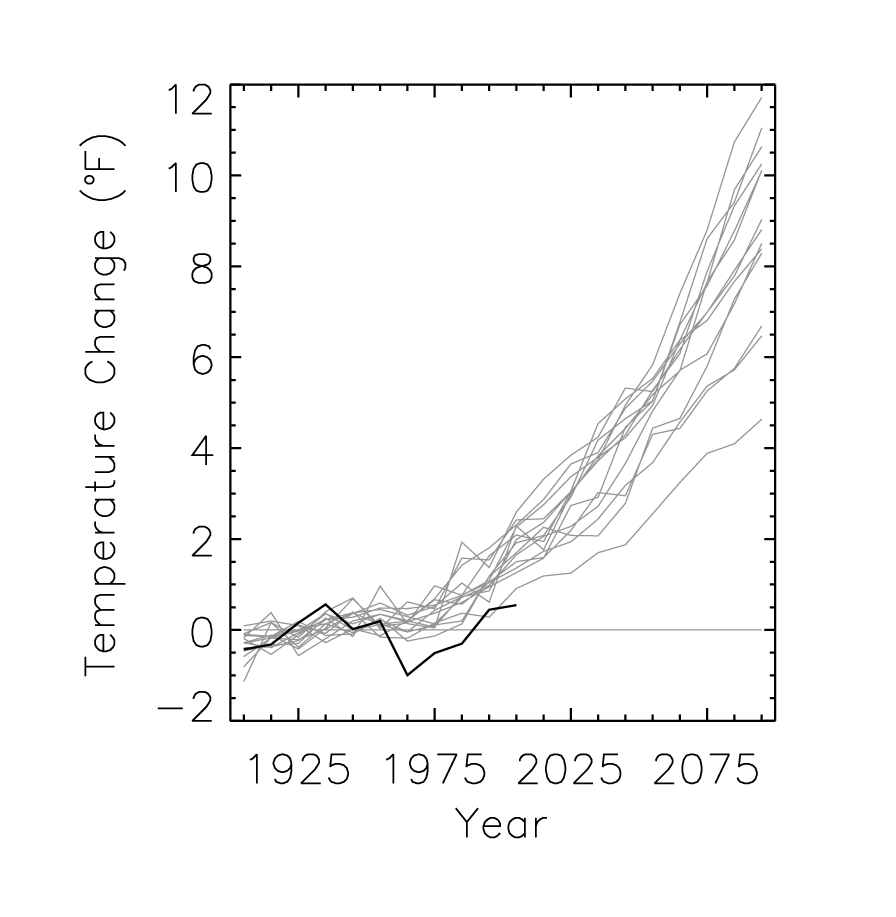
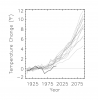
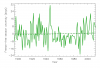
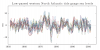
Time series of mean annual temperature |
NCA 3 |
 |
|
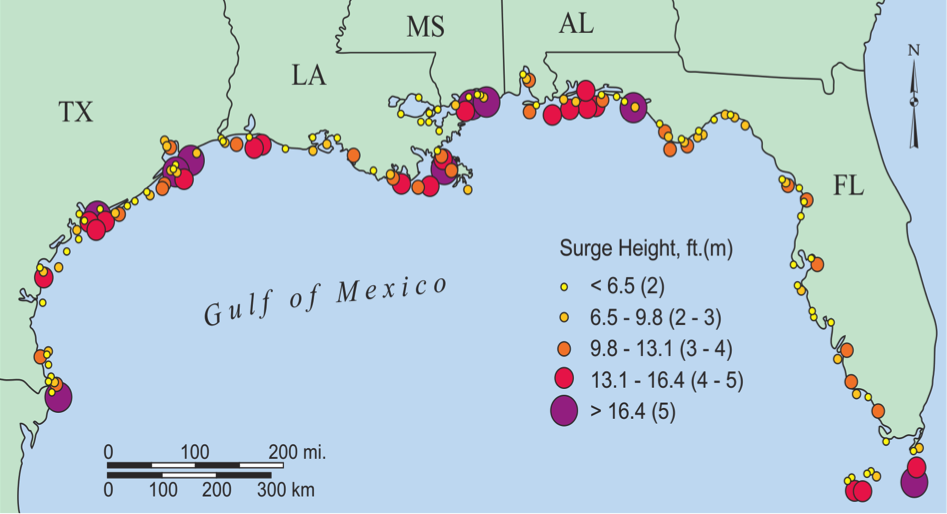
The location and height of peak storm surges along the U.S. Gulf Coast |
NCA 3 |
 |
|
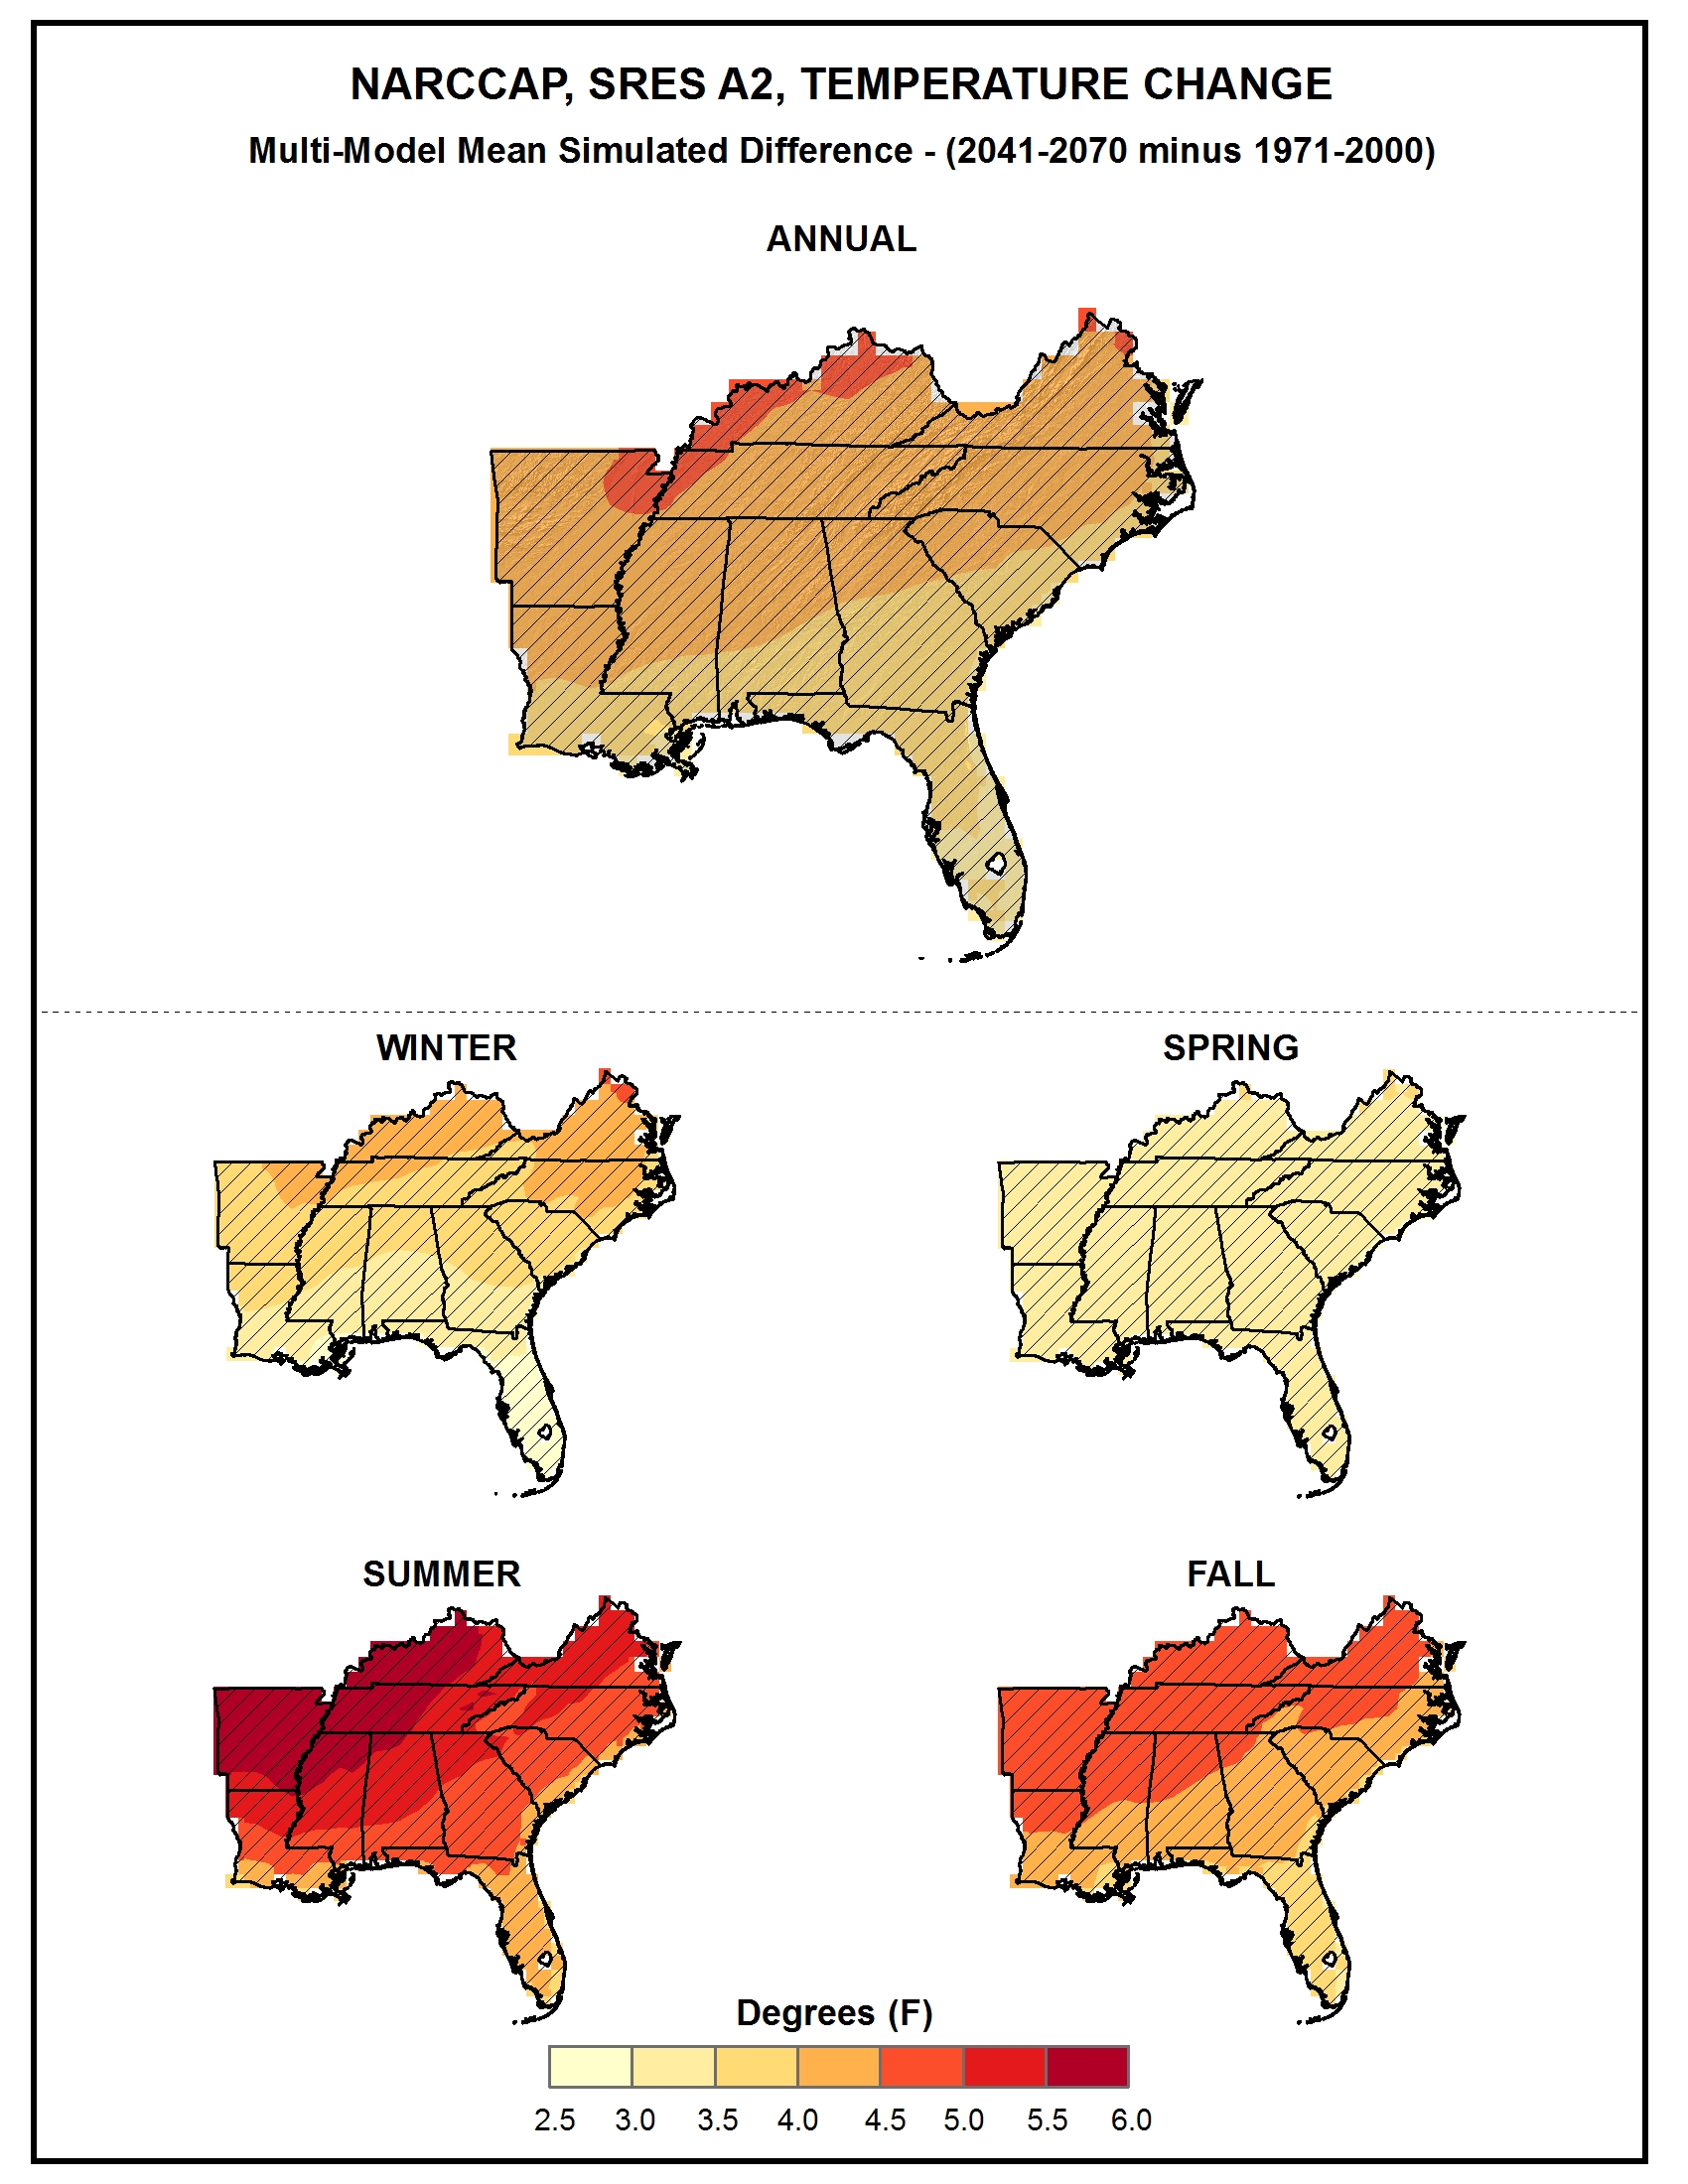
Simulated difference in annual and seasonal mean temperature |
NCA 3 |
 |
|
Simulated annual mean precipitation change |
NCA 3 |
 |
|
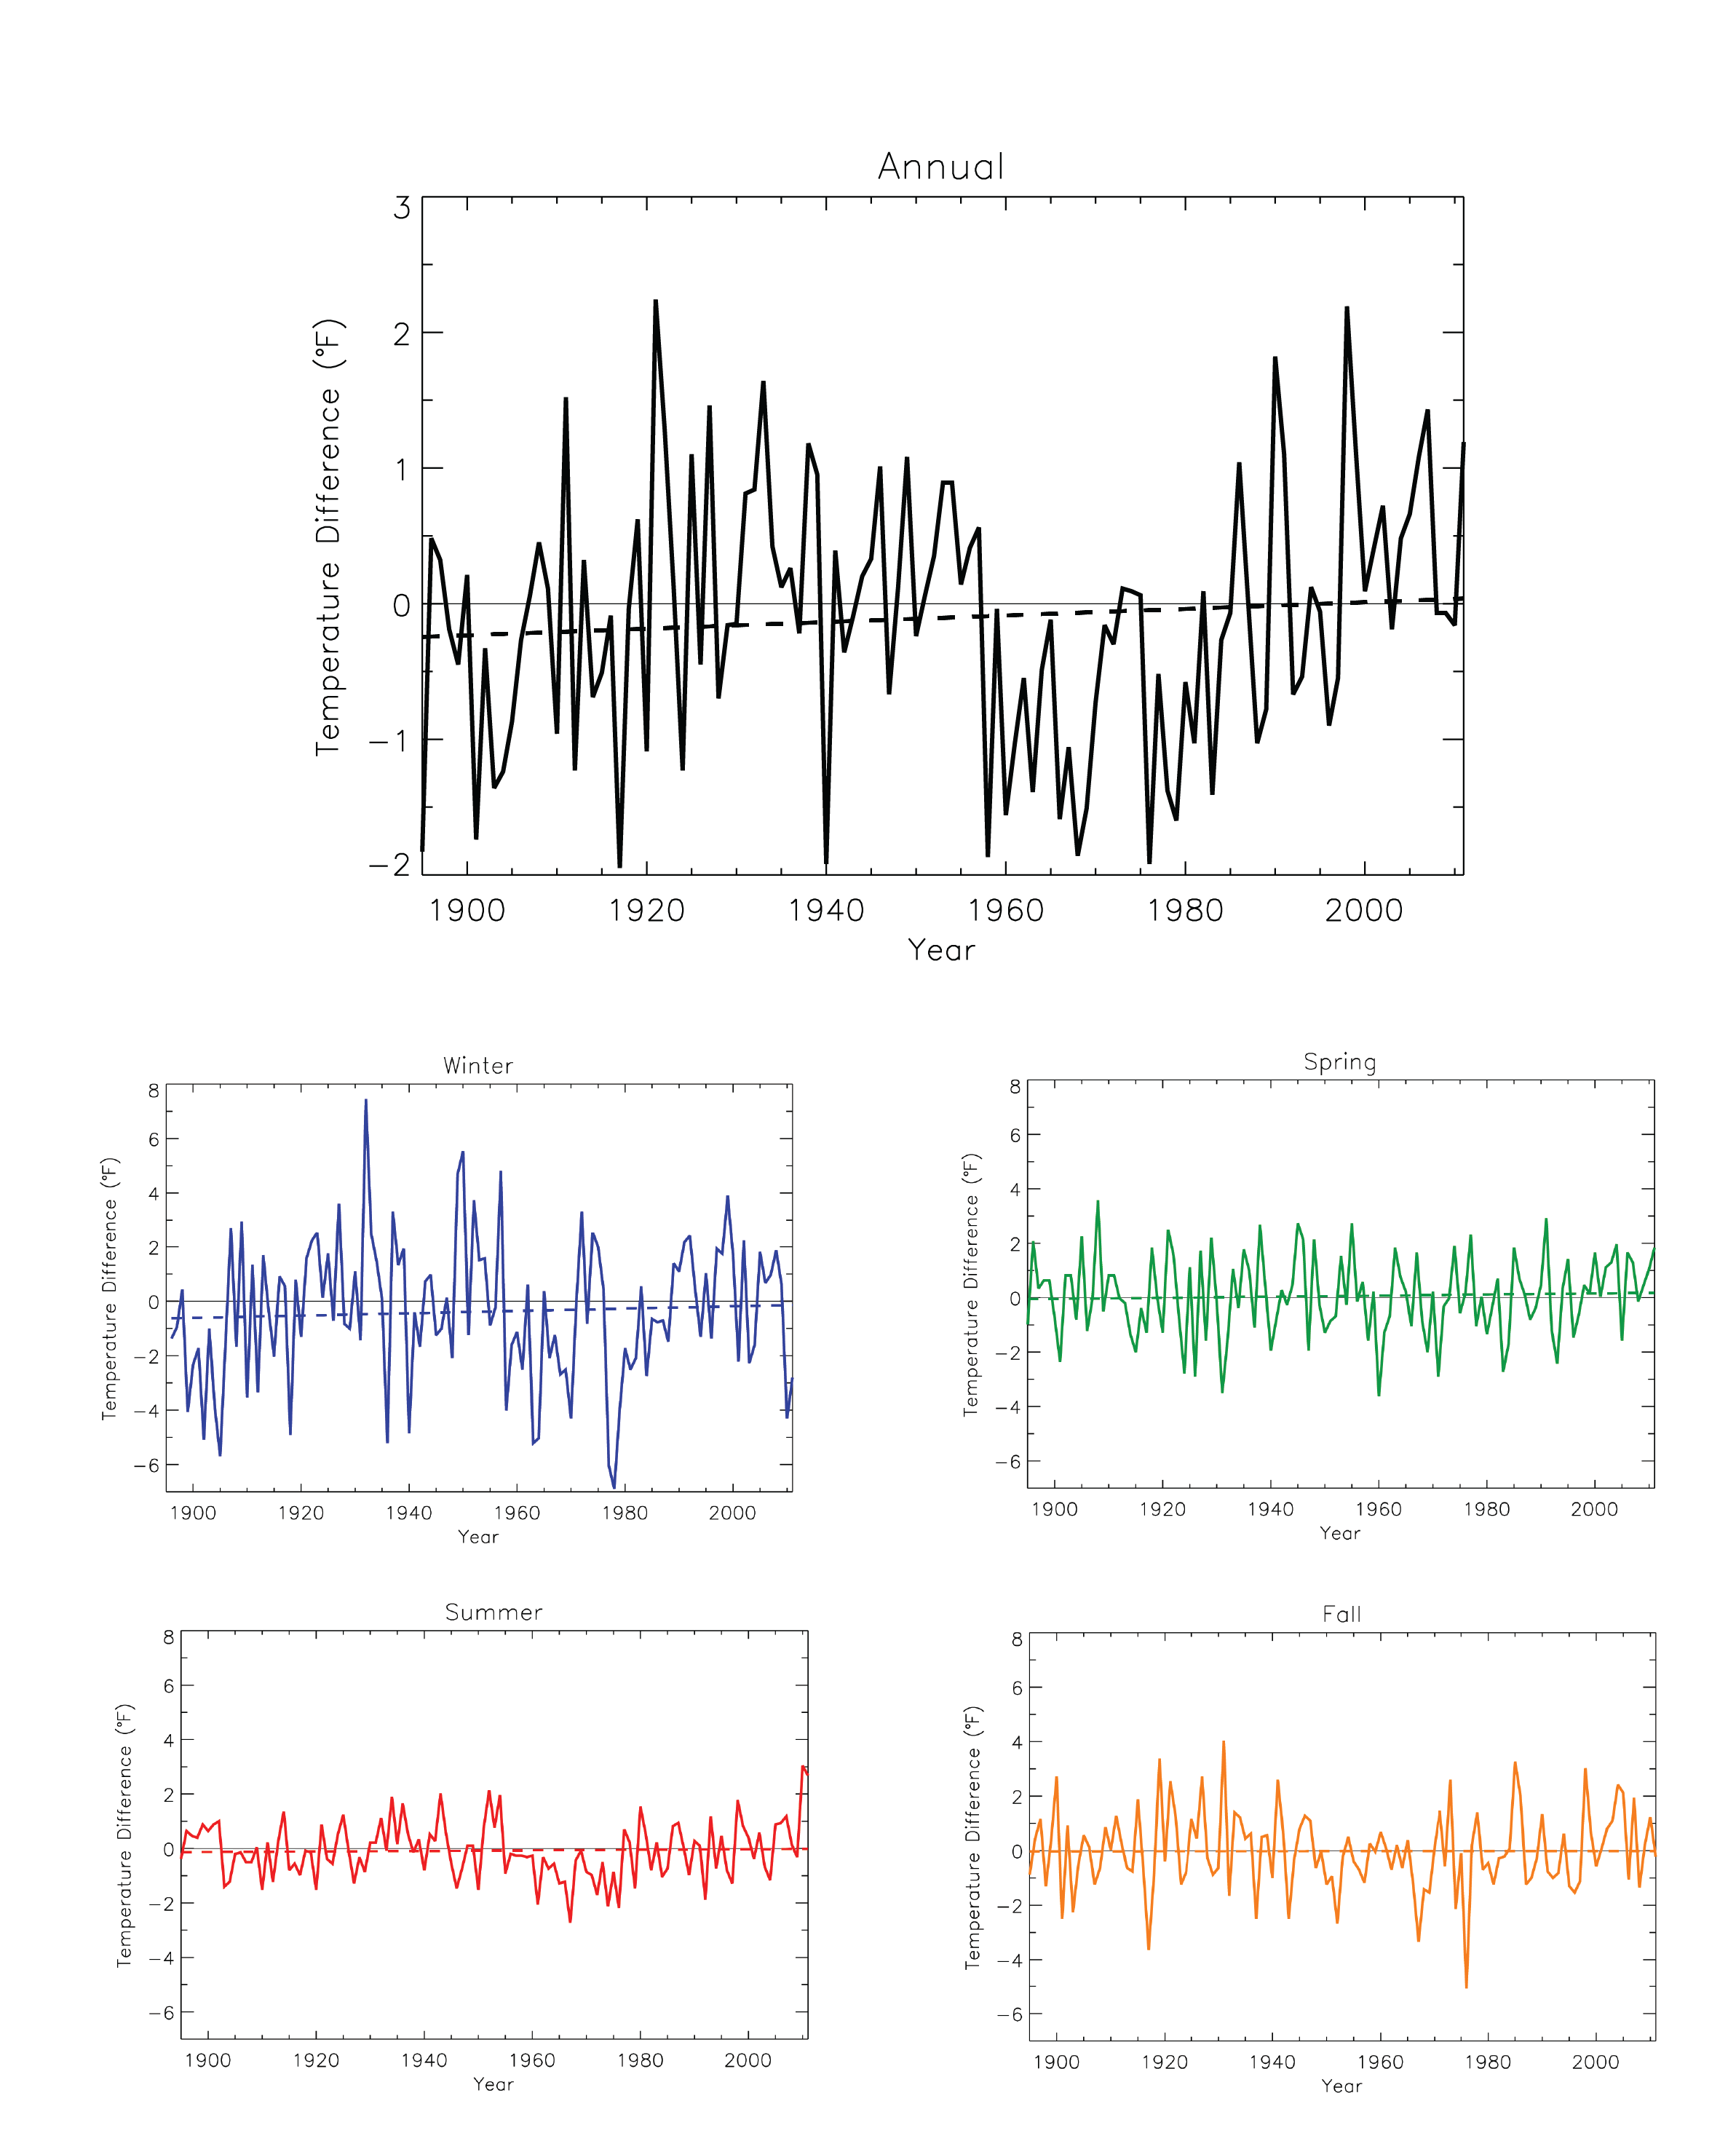
Annual and seasonal temperature anomaly |
NCA 3 |
 |
|
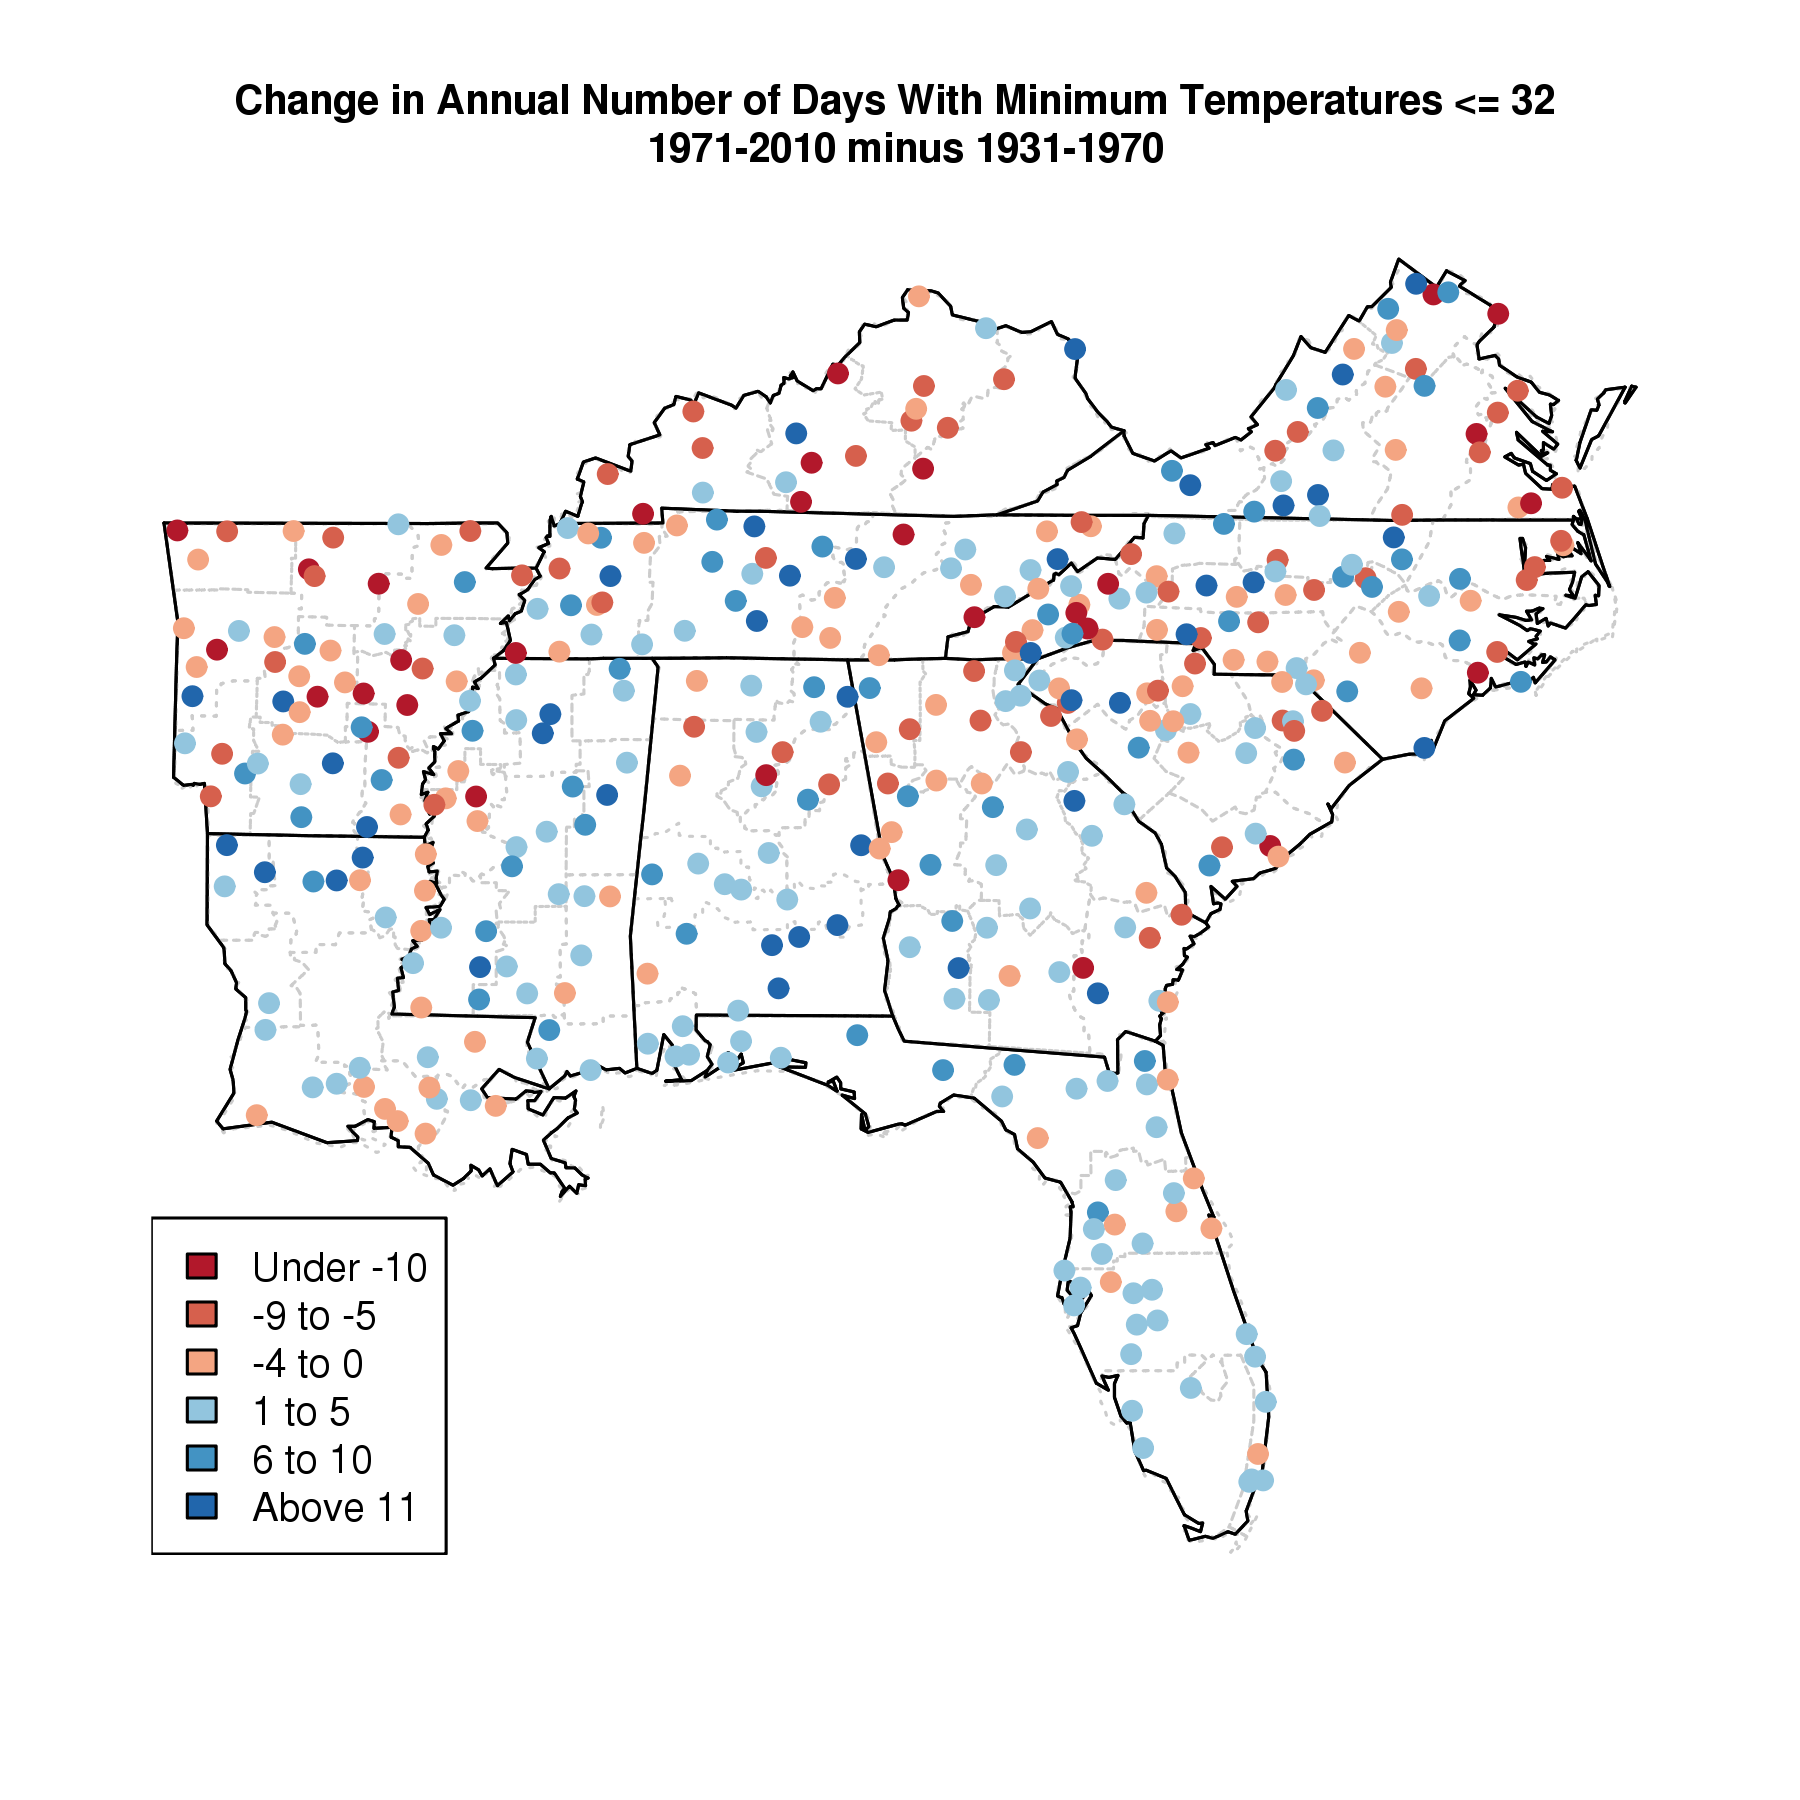
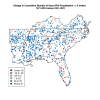
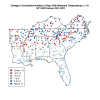
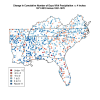
Difference in cumulative number of days with a minimum temperature <=32F |
NCA 3 |
 |
|
Simulated difference in the mean annual maximum number of consecutive days with a maximum temperature greater than 95F |
NCA 3 |
 |
|
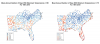
Observed decadal mean annual precipitation change |
NCA 3 |
 |
|
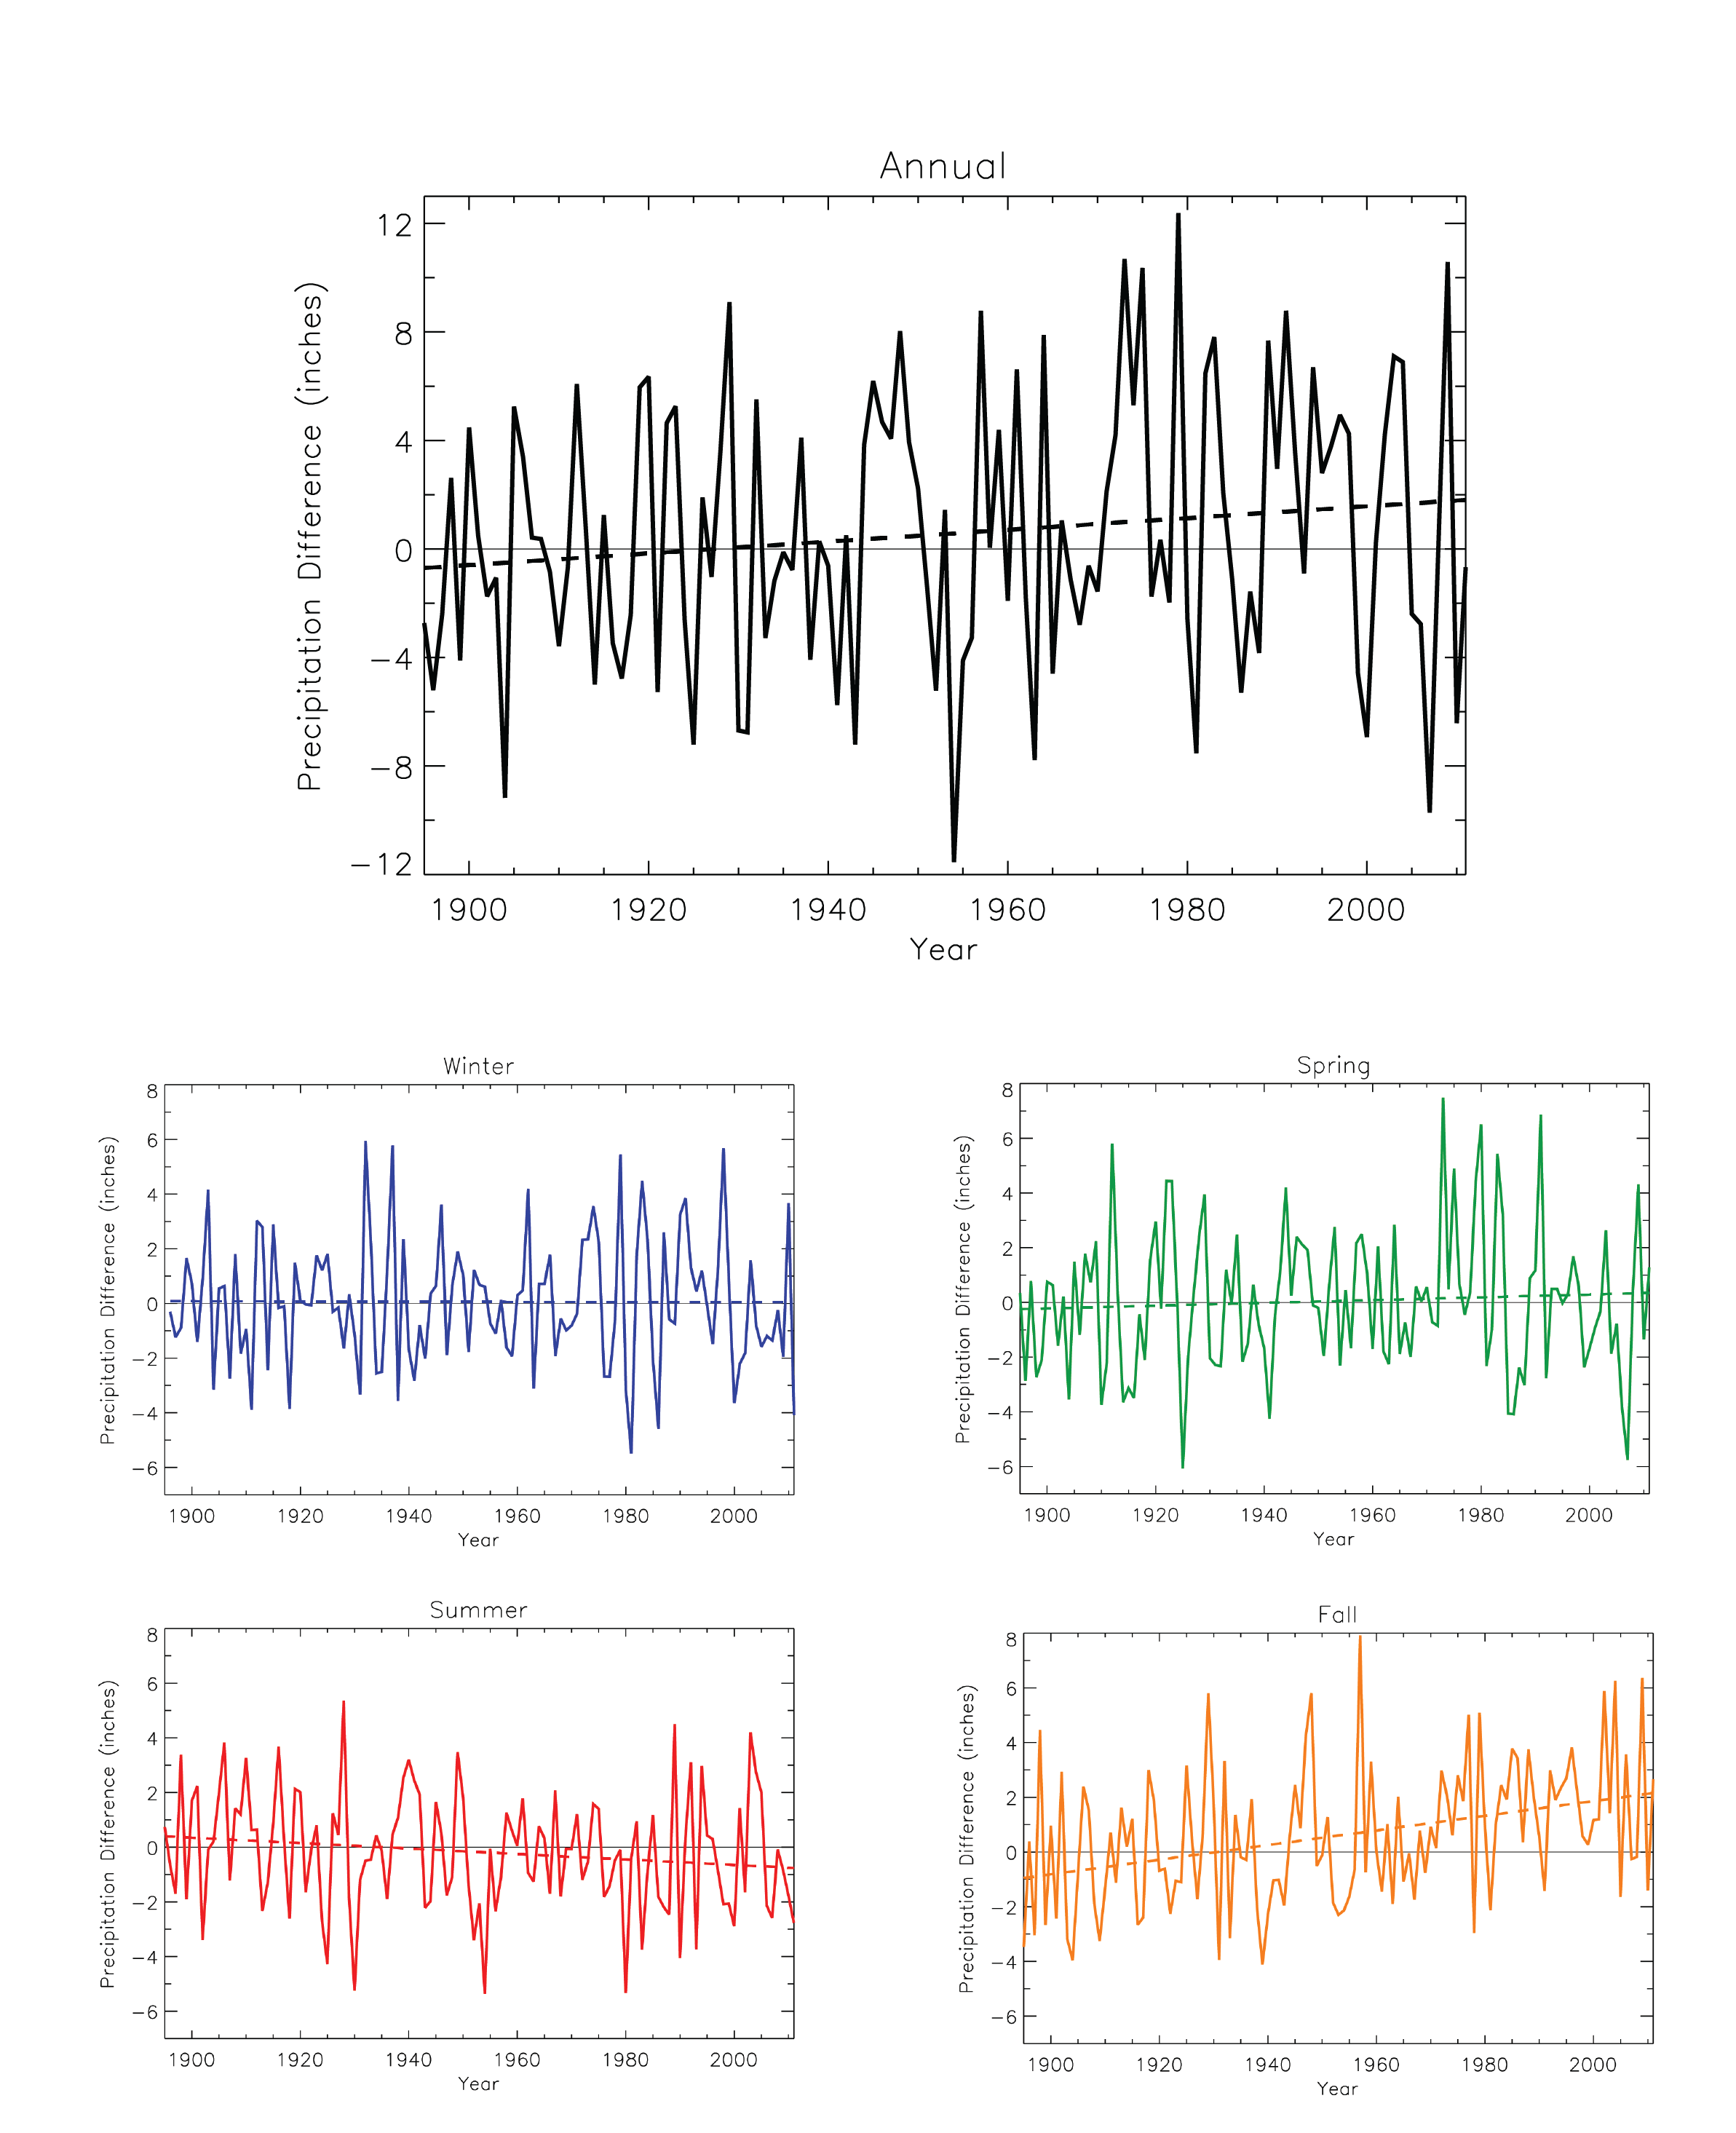
Annual and seasonal precipitation anomaly |
NCA 3 |
 |
|
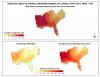
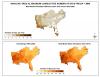
Mean annual number of days with a maximum temperature >=95F and a minimum temperature >=75F |
NCA 3 |
 |
|
NARCCAP Models Listing |
NCA 3 |
 |
|
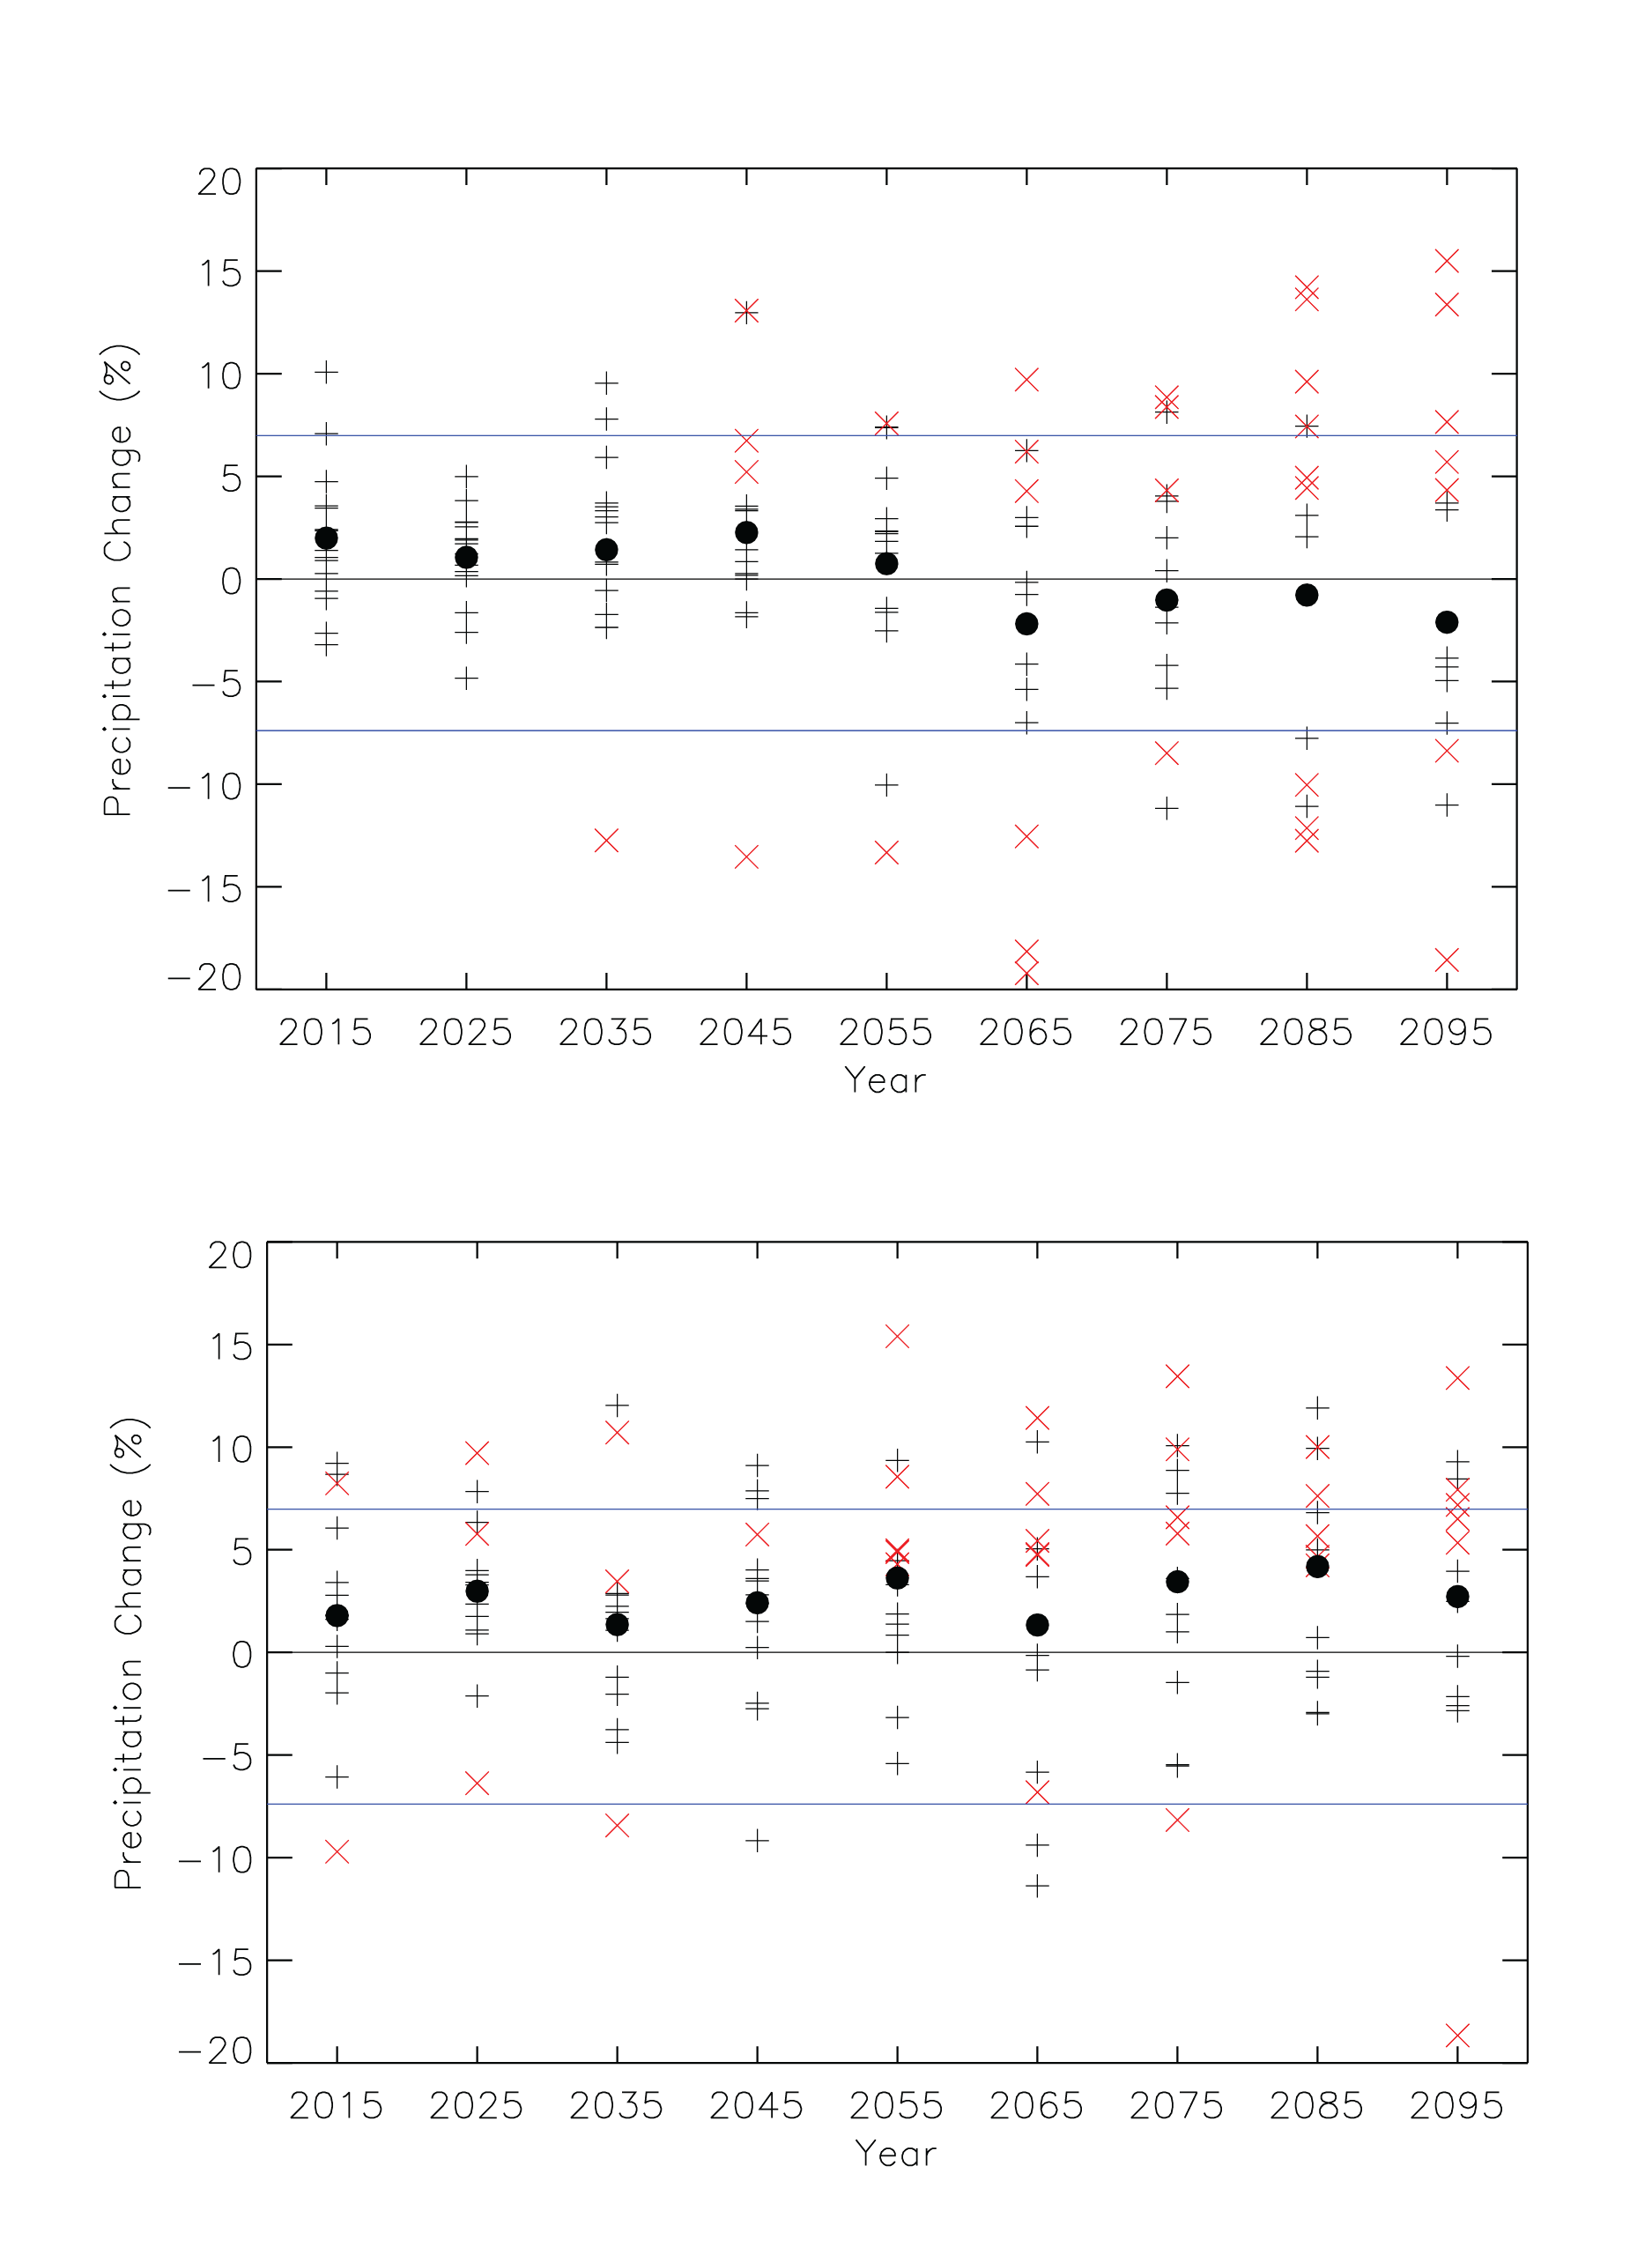
Distribution of the simulated change in seasonal mean precipitation |
NCA 3 |
 |
|
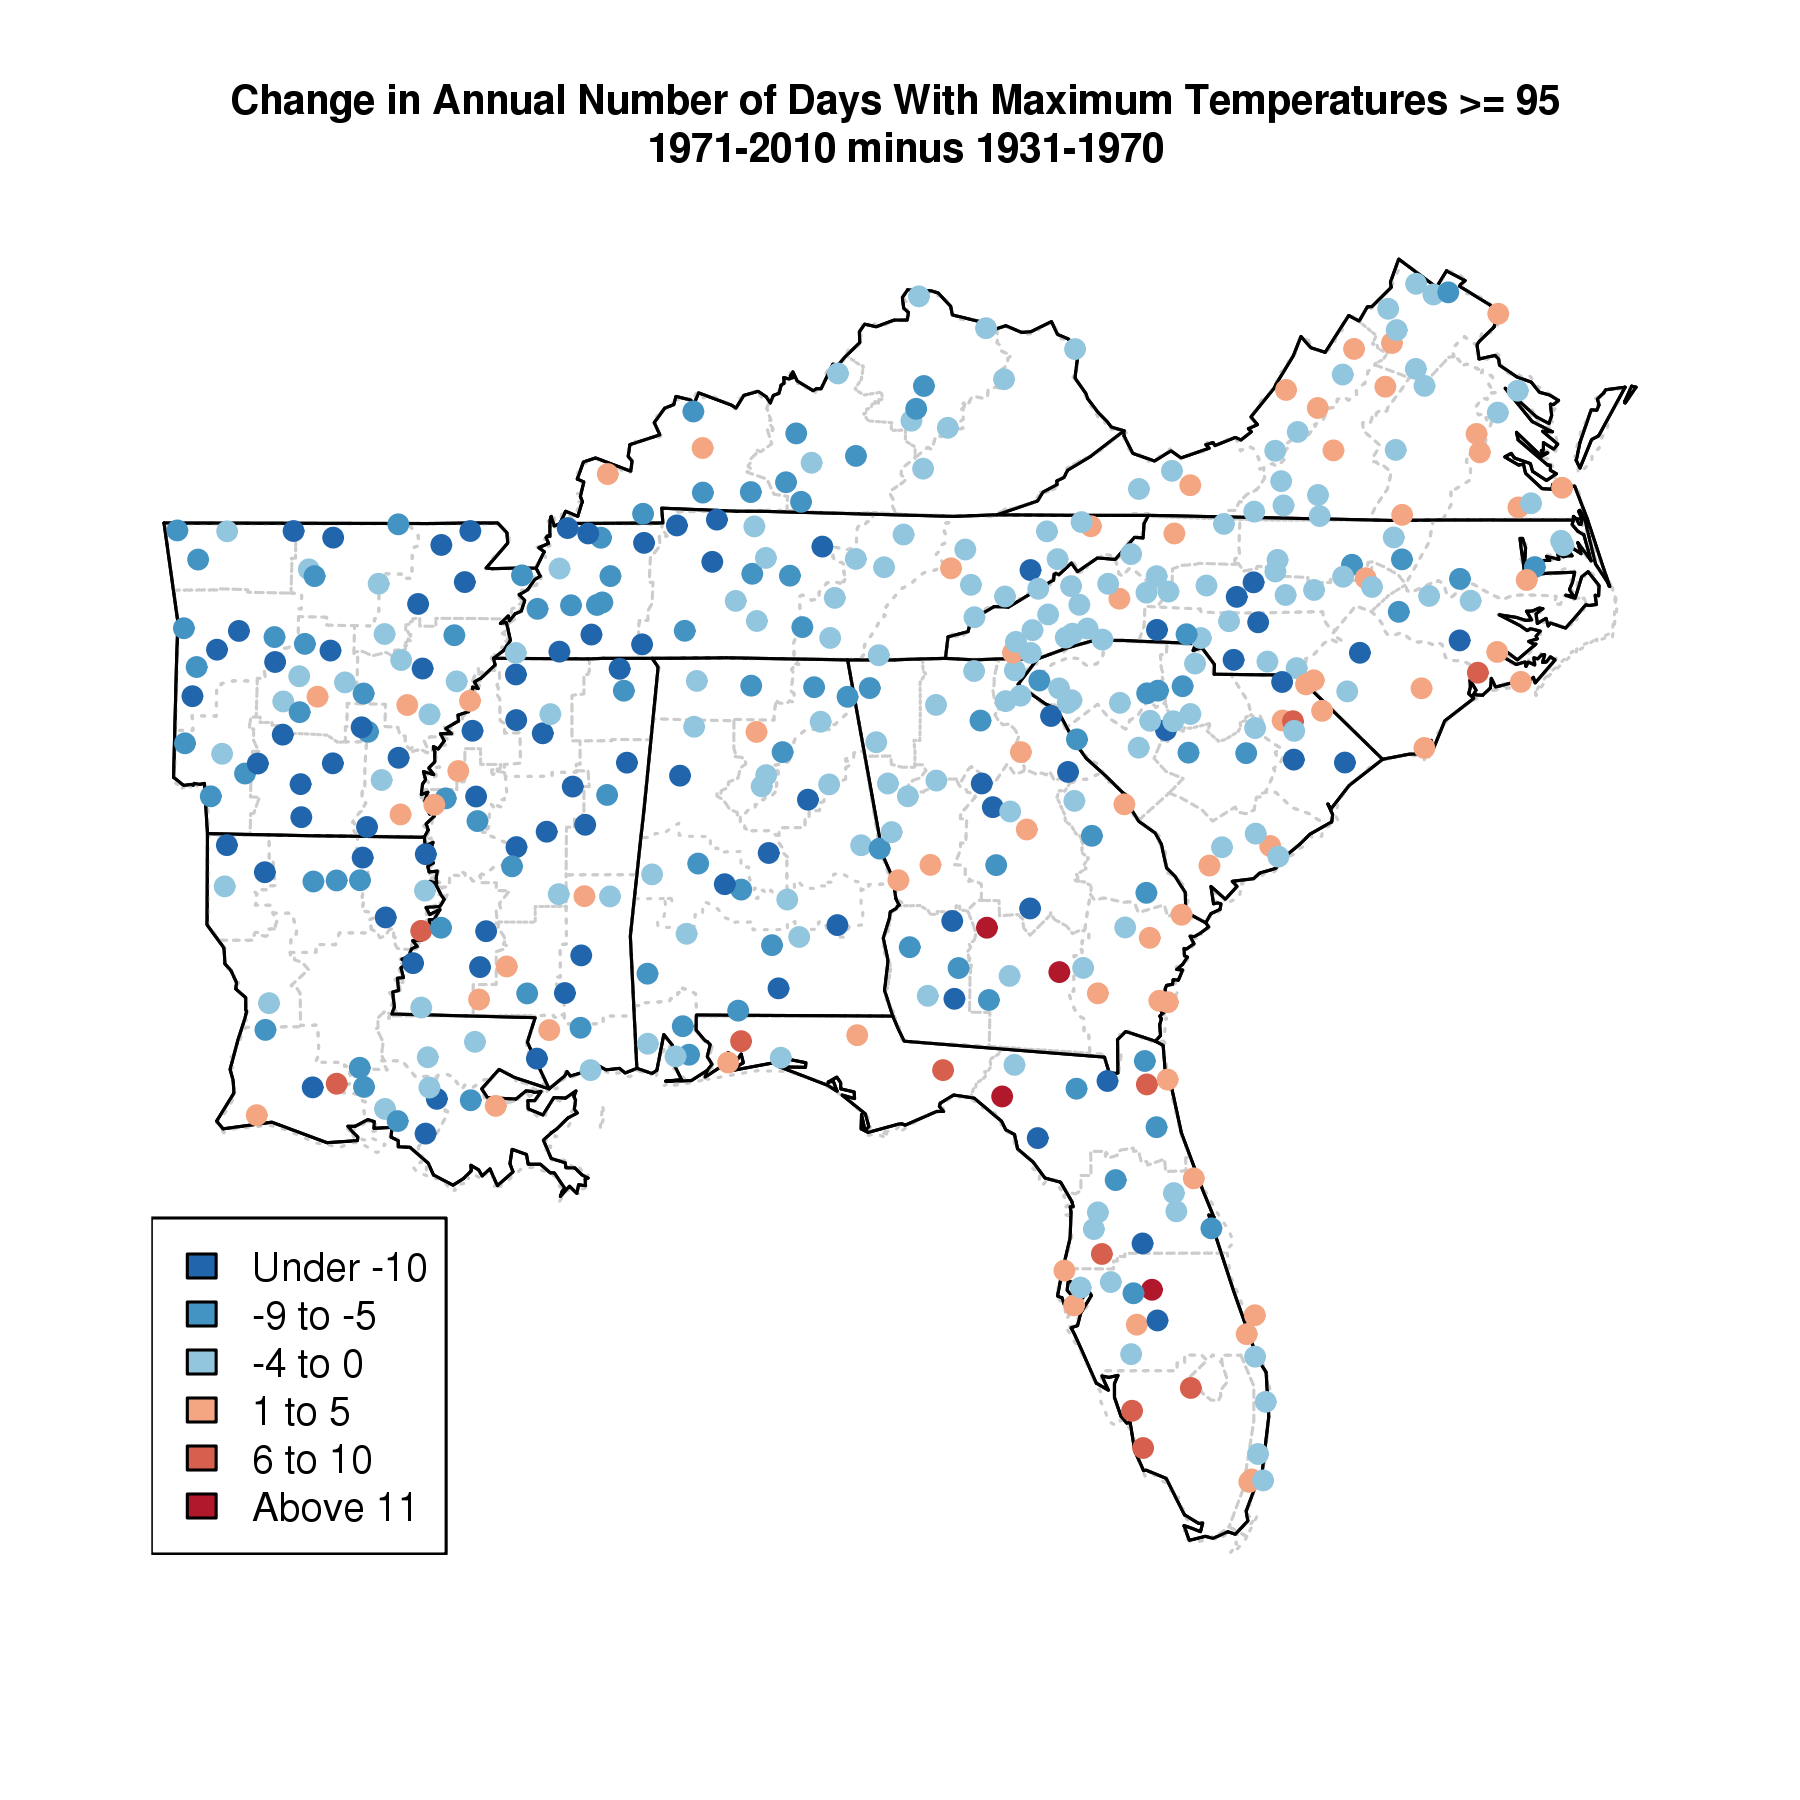
Difference in cumulative number of days with a maximum temperature >=95F |
NCA 3 |
 |
|
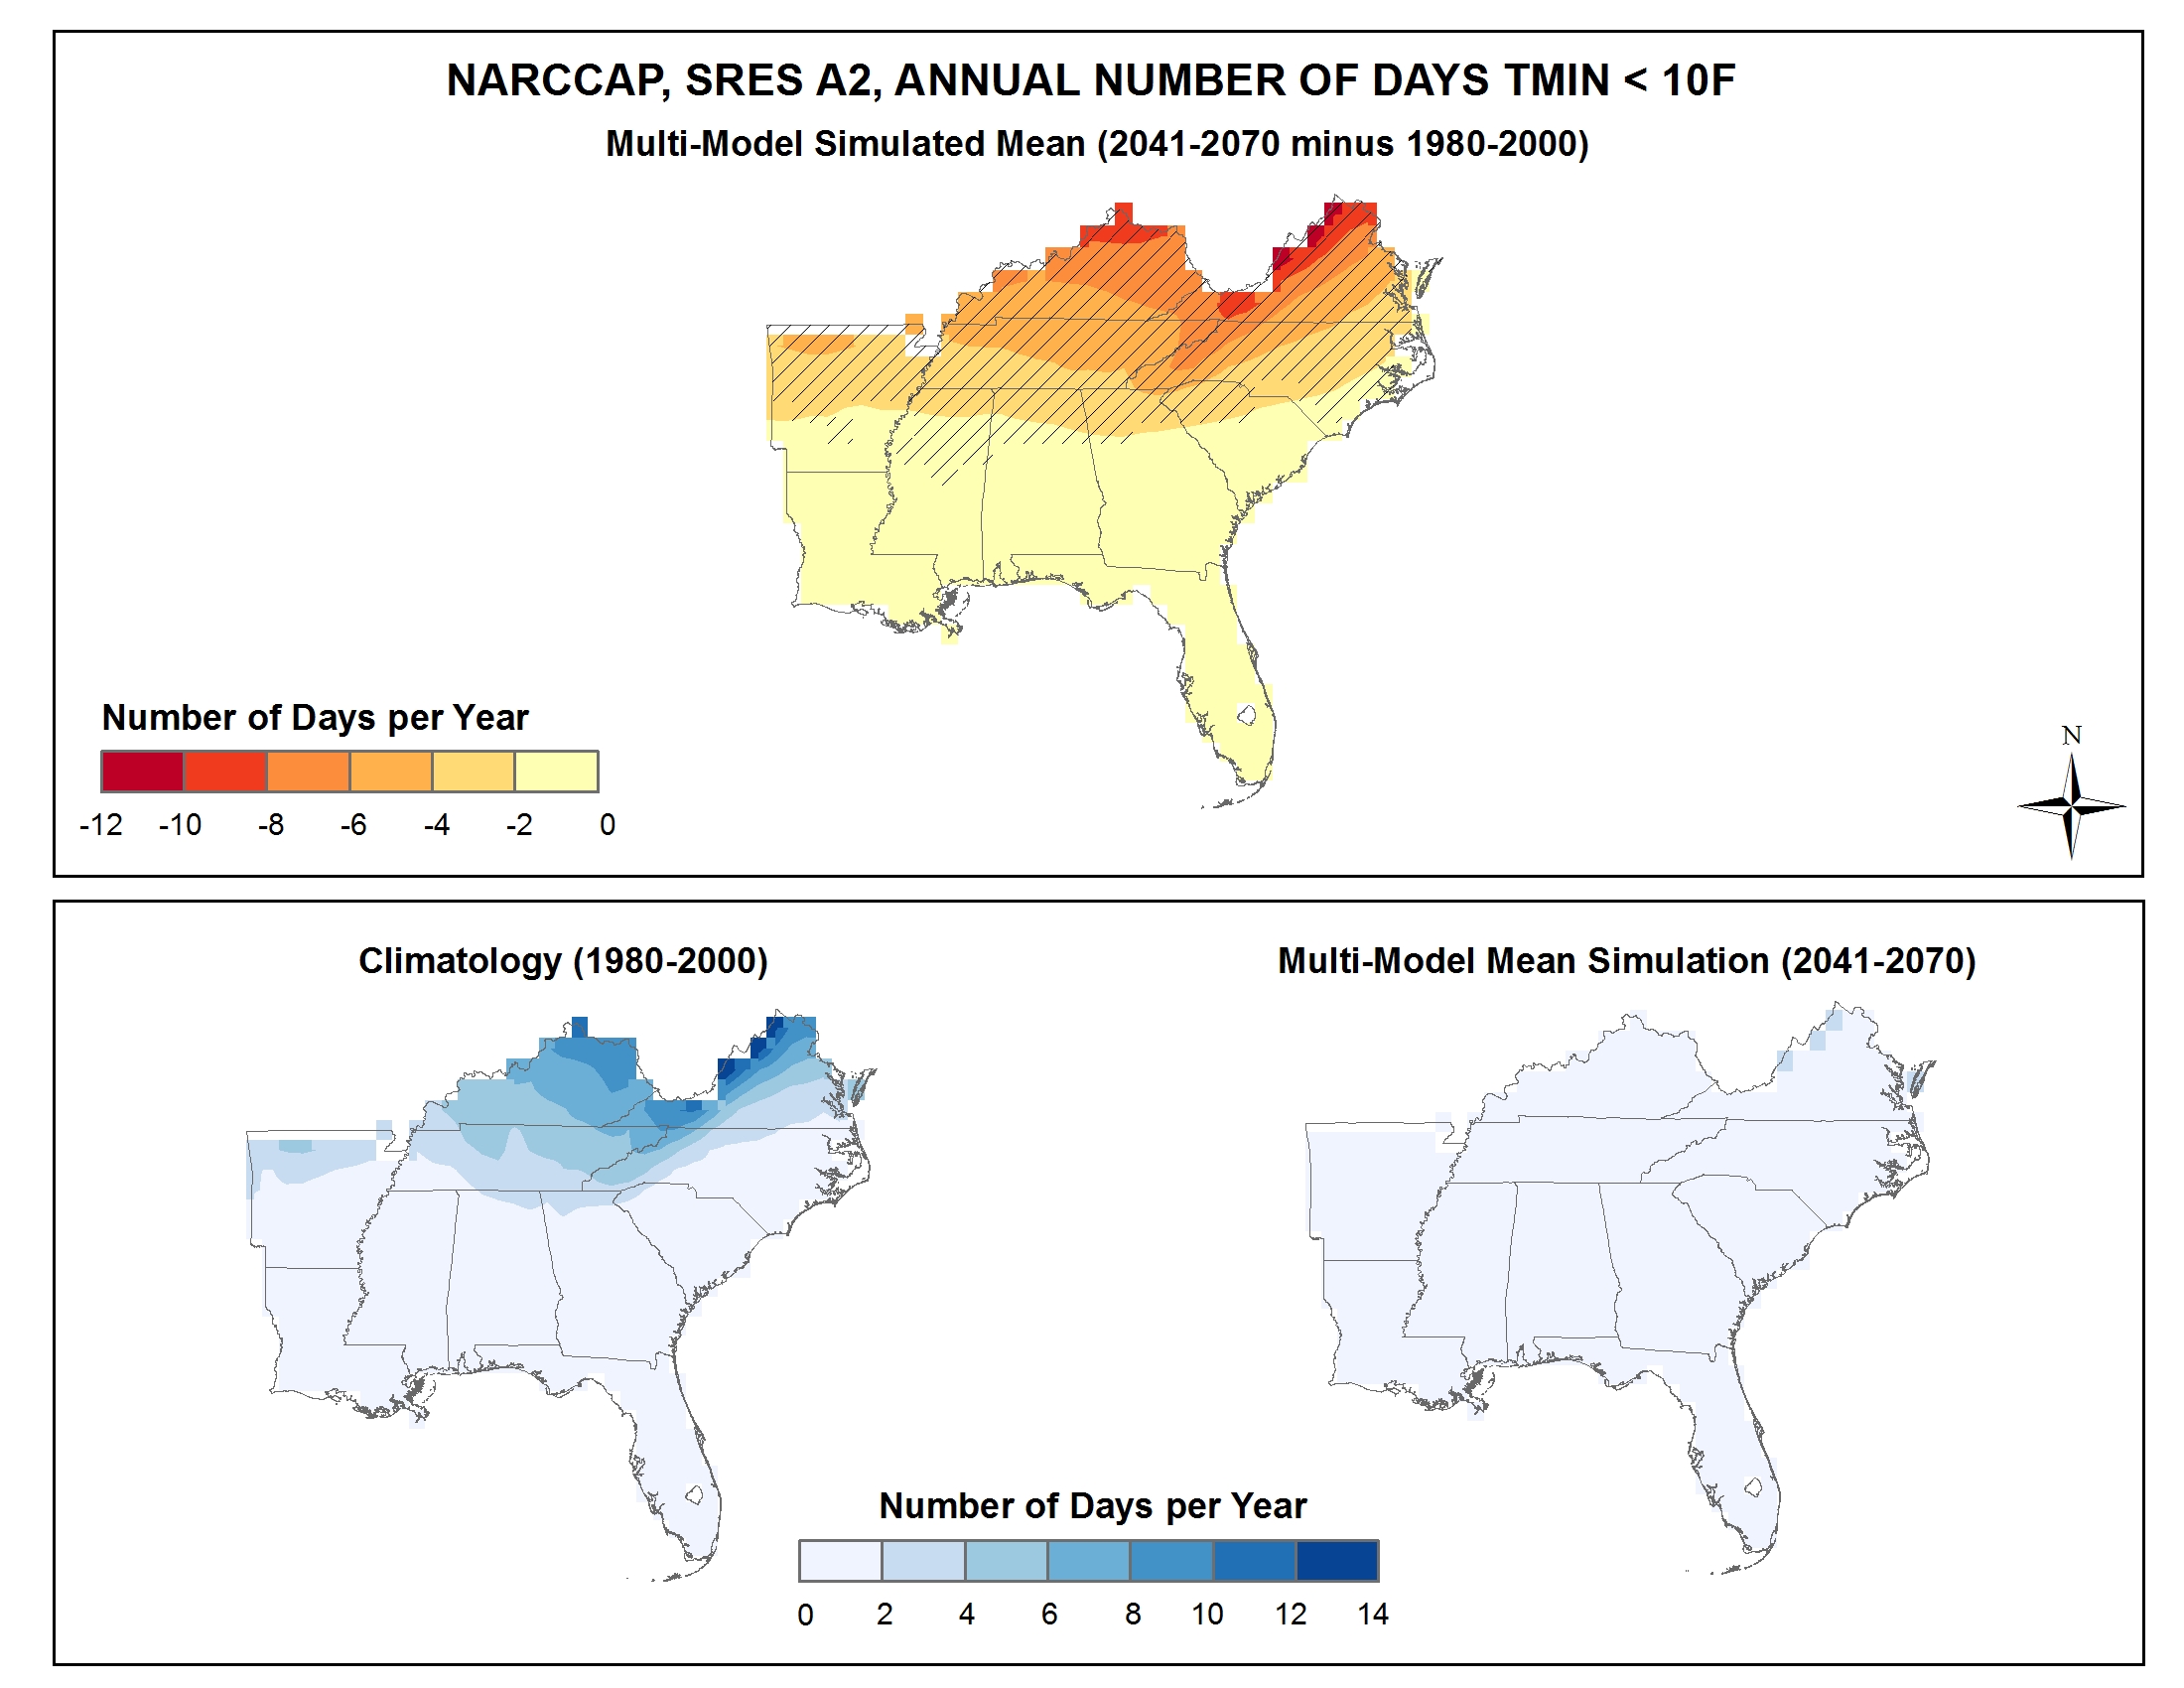
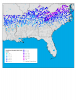
Simulated difference in the mean annual number of days with a minimum temperature less than 10F |
NCA 3 |
 |
|
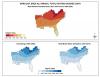
Observed decadal mean annual temperature change |
NCA 3 |
 |
|
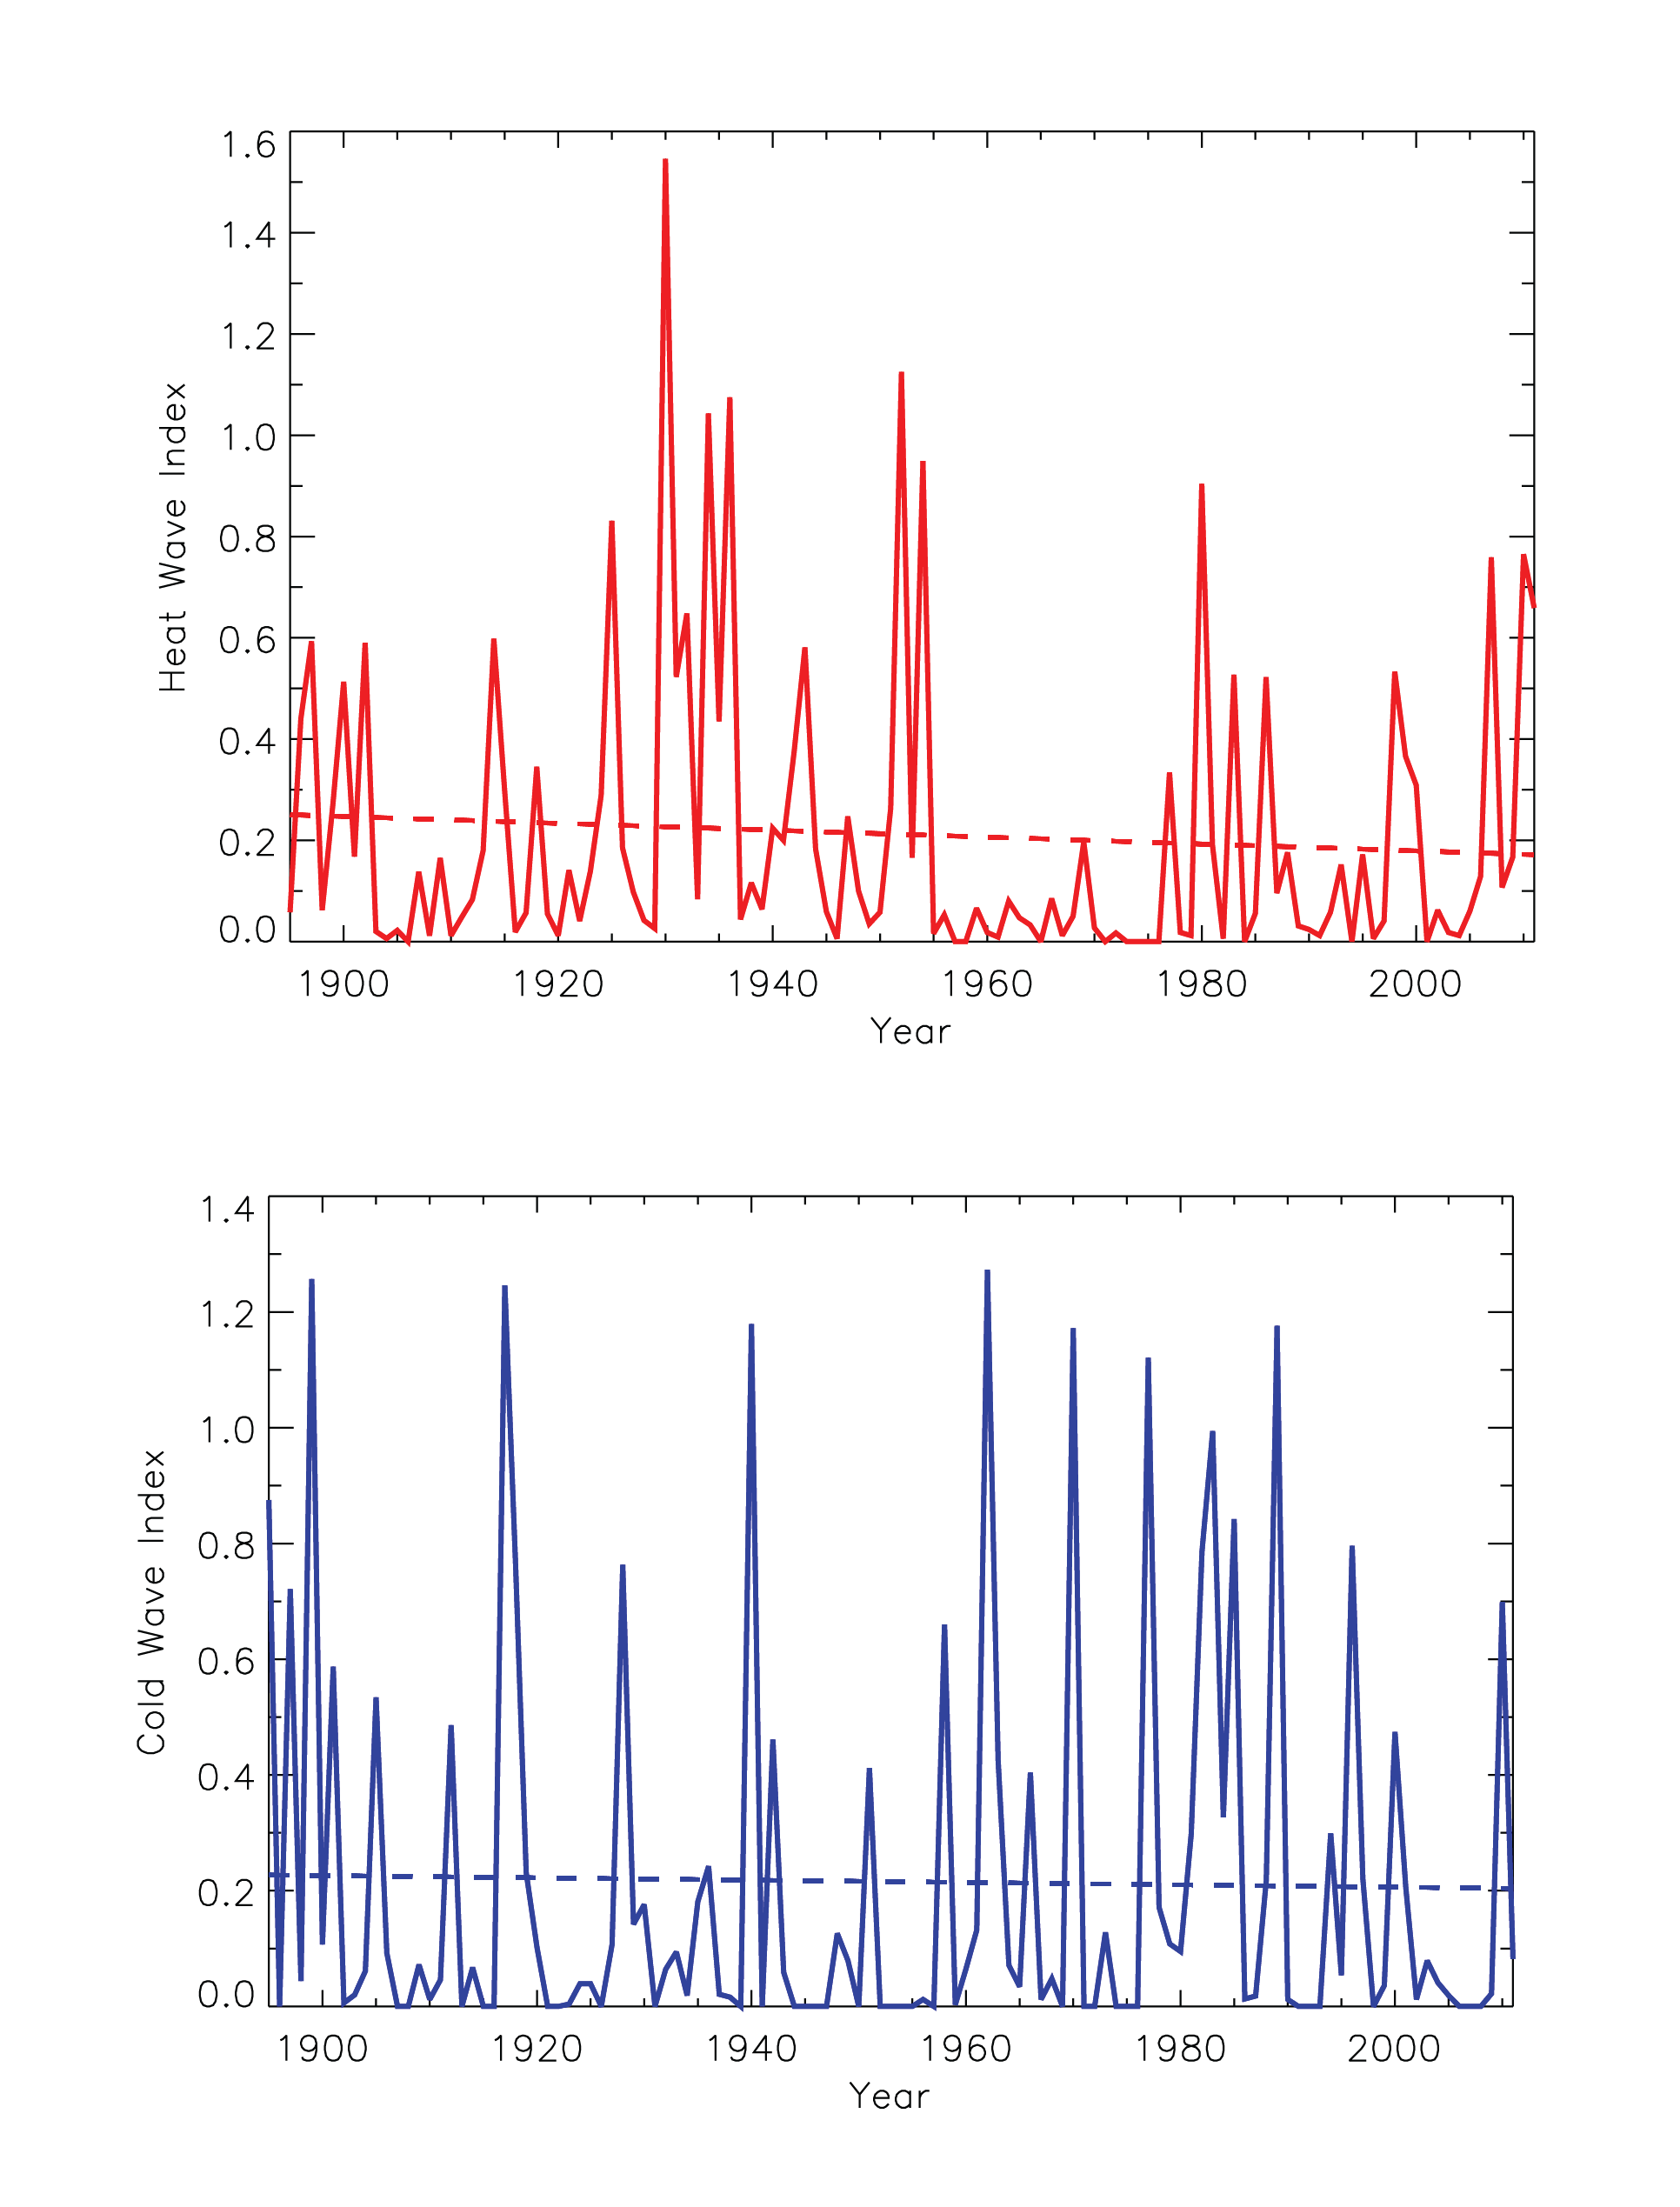
Time series of an index for the occurrence of heat waves and cold waves |
NCA 3 |
 |
|
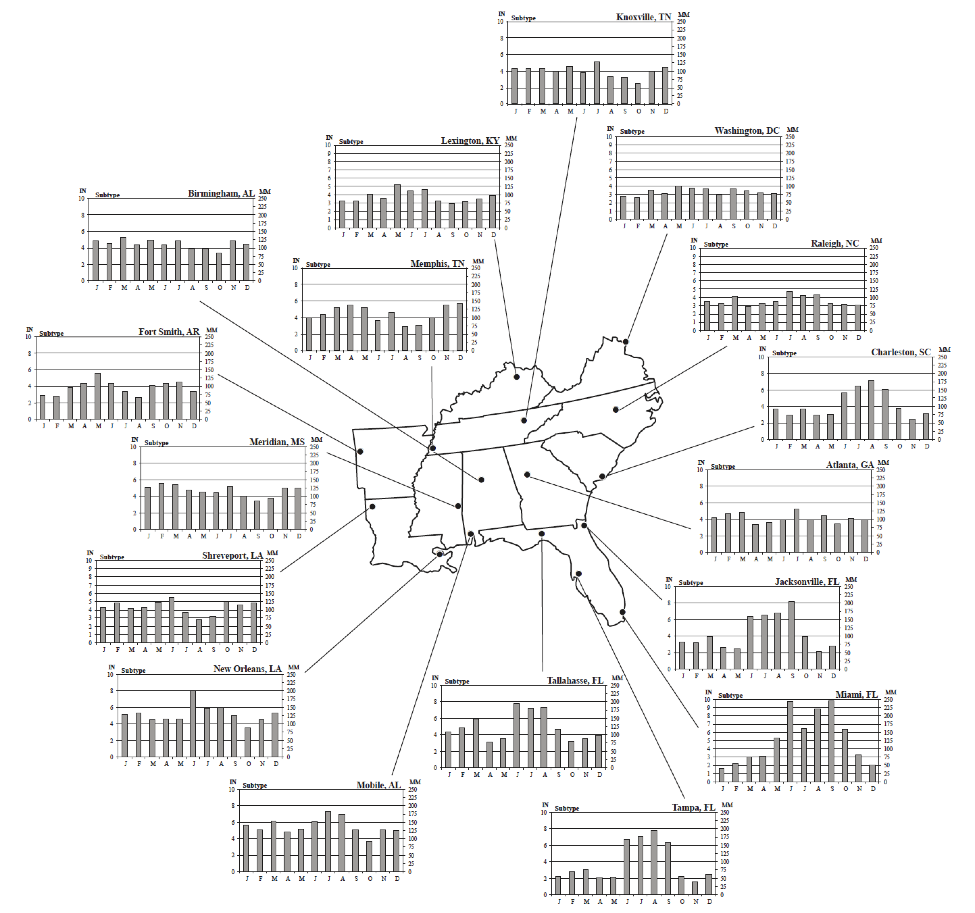
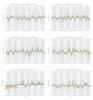
Monthly precipitation normals |
NCA 3 |
 |
|
Difference in cumulative number of days with precipitation >= 2 inches |
NCA 3 |
 |
|
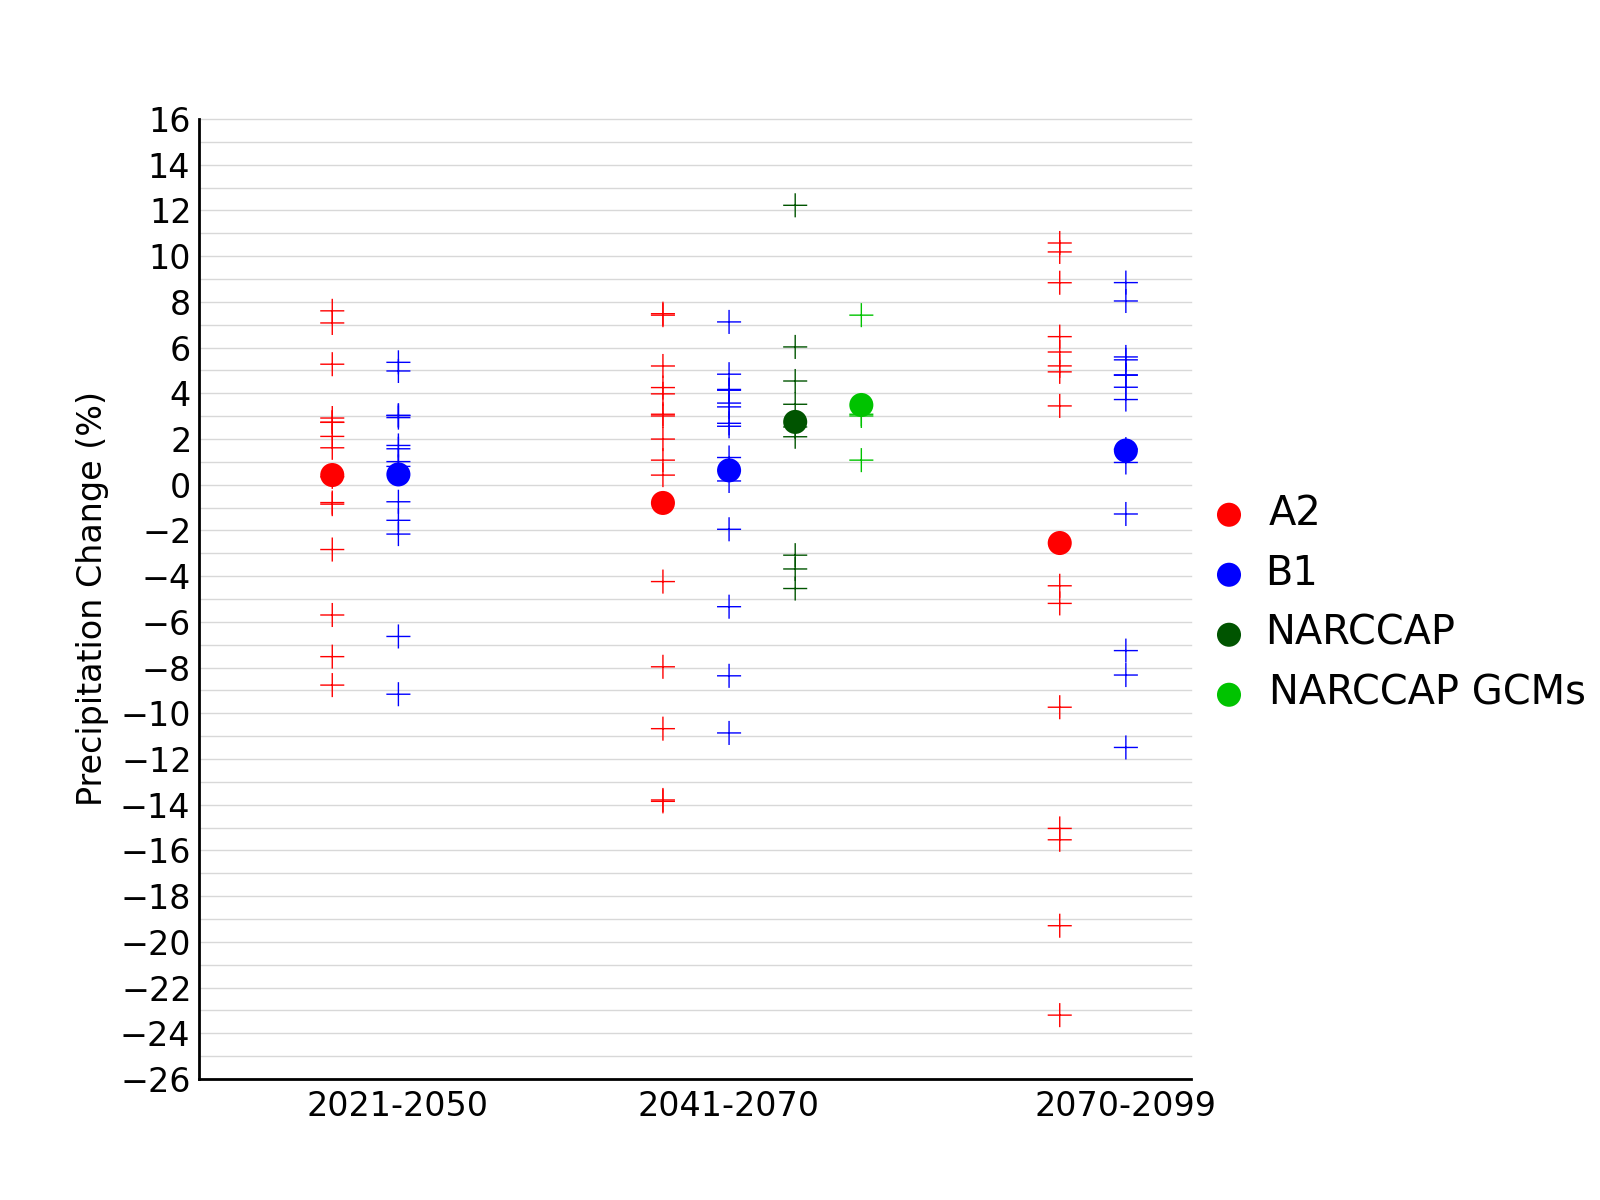
Distribution of the simulated change in annual mean precipitation |
NCA 3 |
 |
|
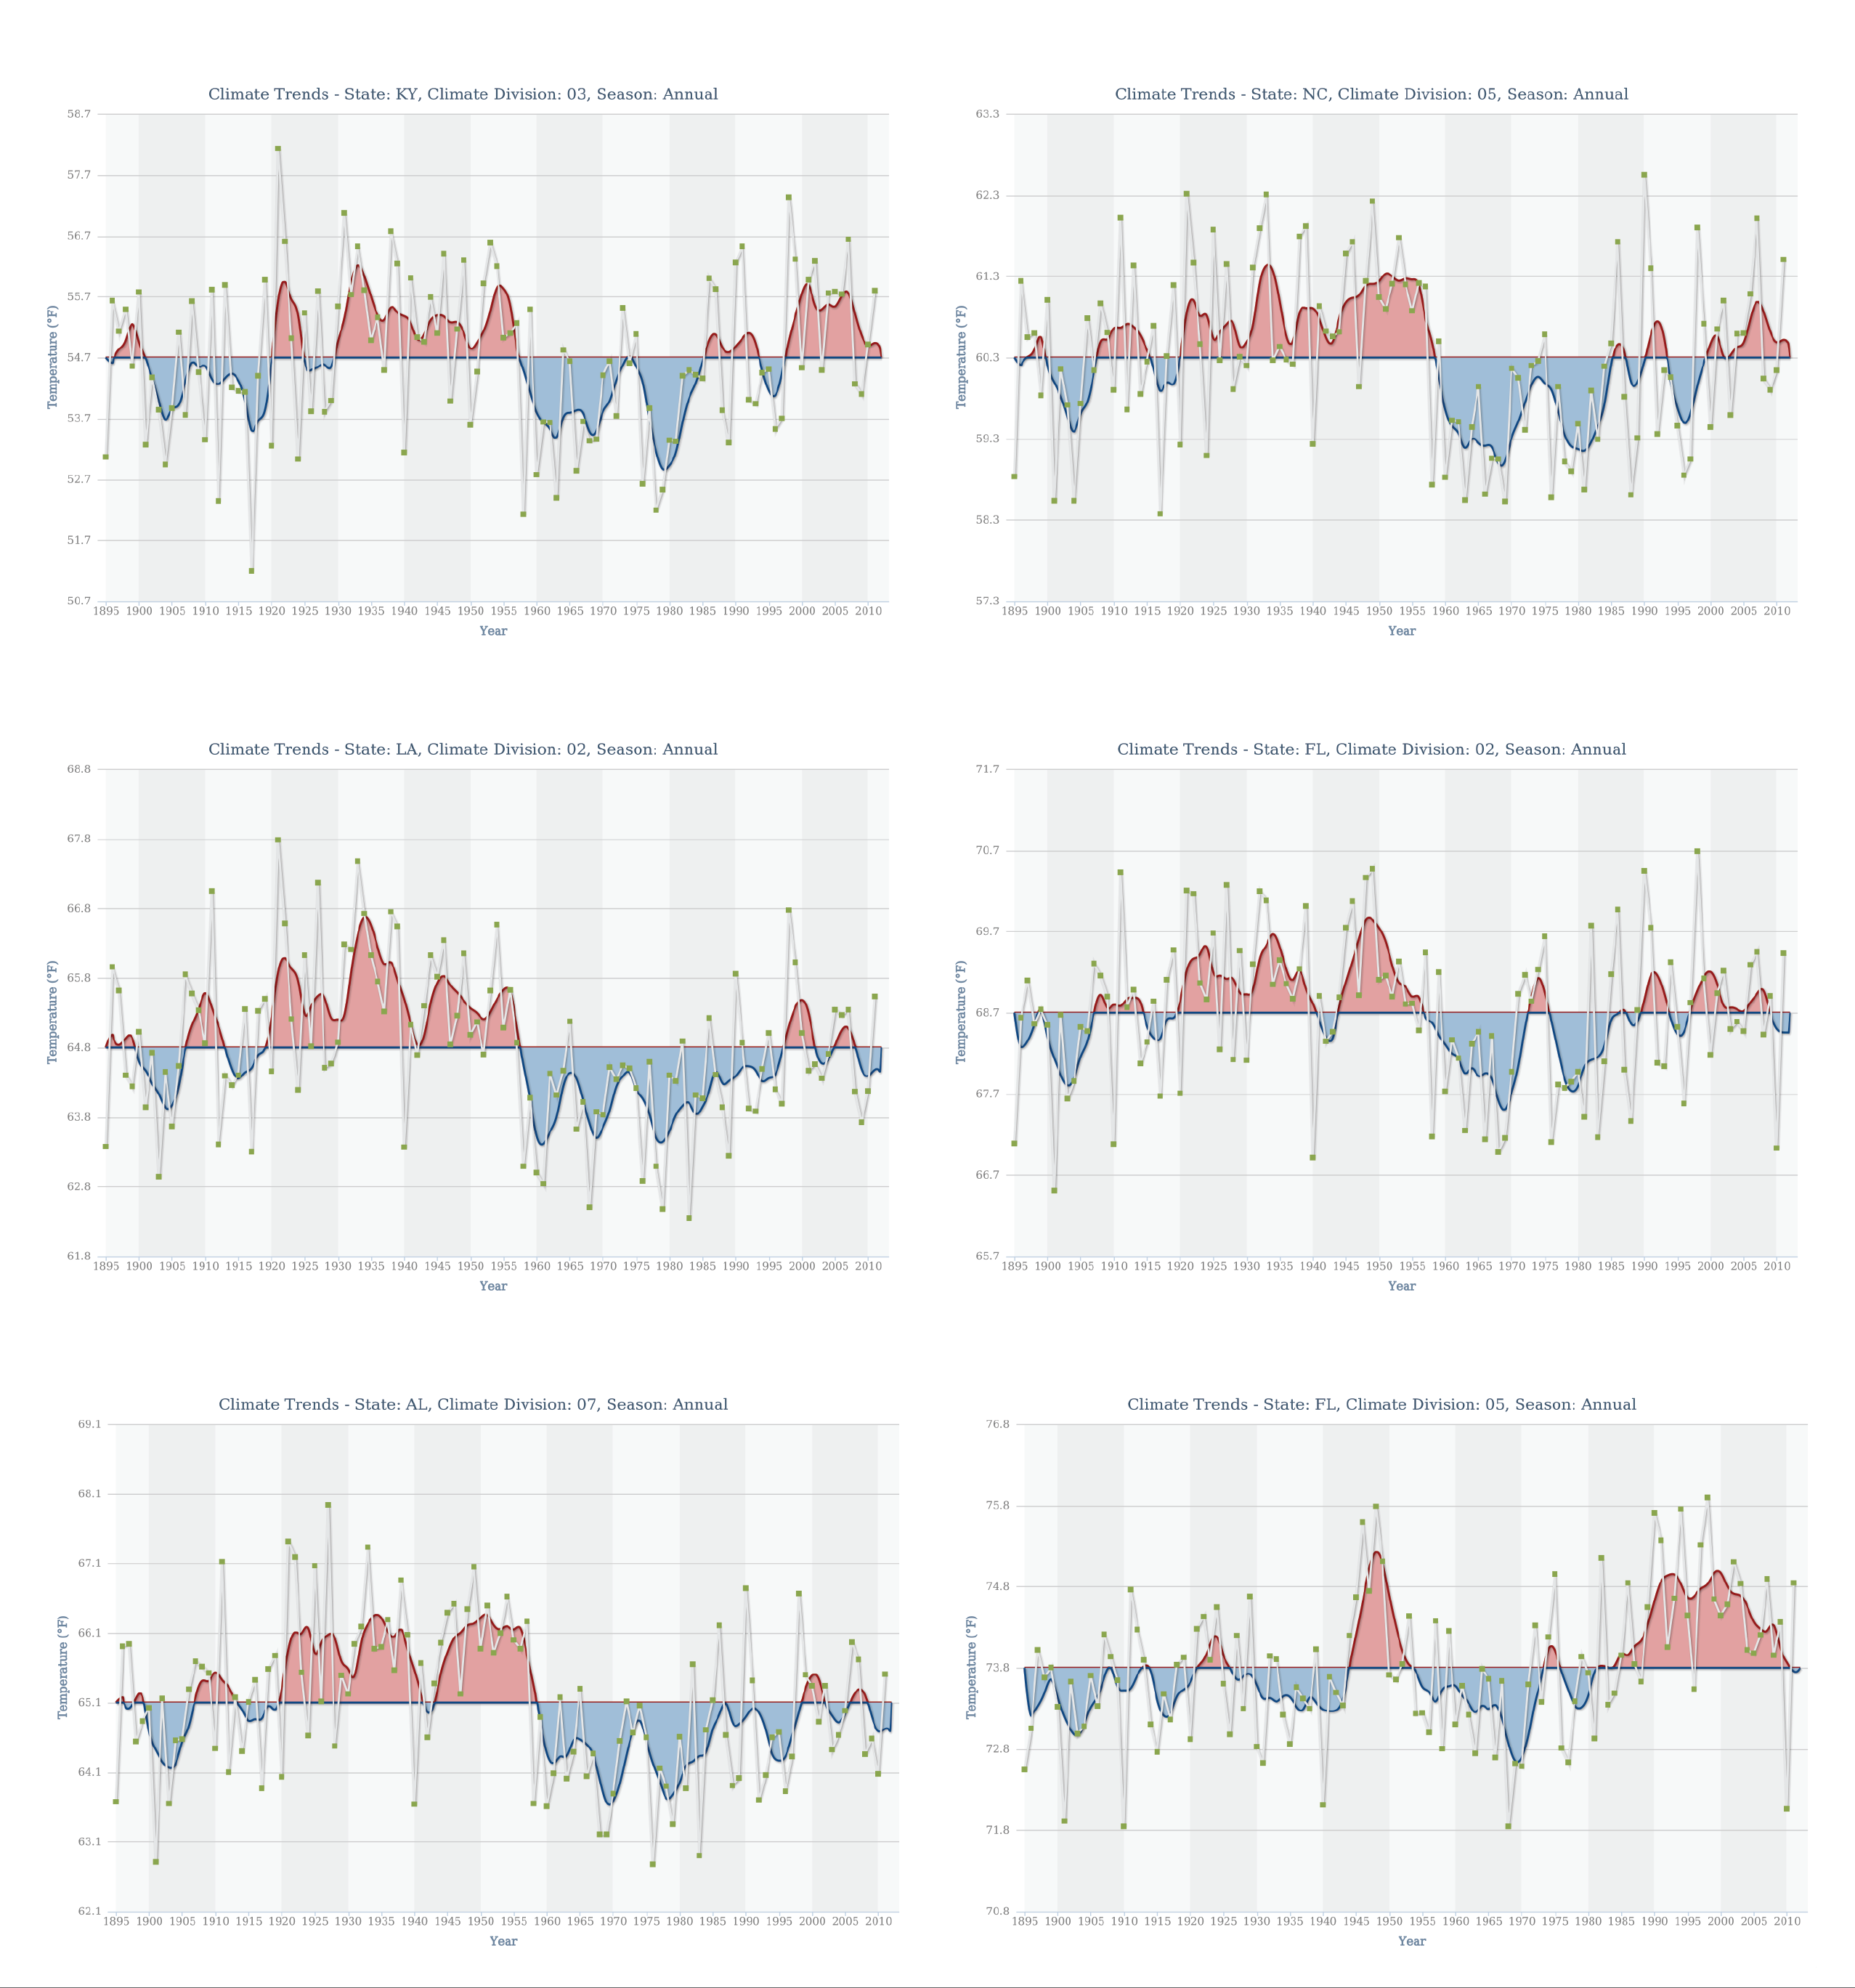
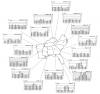
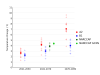
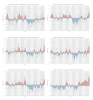
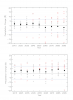
Annual temperature trends at six climate divisions in the Southeast region |
NCA 3 |
 |
|
Distribution of the simulated change in annual mean temperature |
NCA 3 |
 |
|
Simulated difference in the mean annual maximum number of consecutive days with precipitation of less than 0.1 inches |
NCA 3 |
 |
|
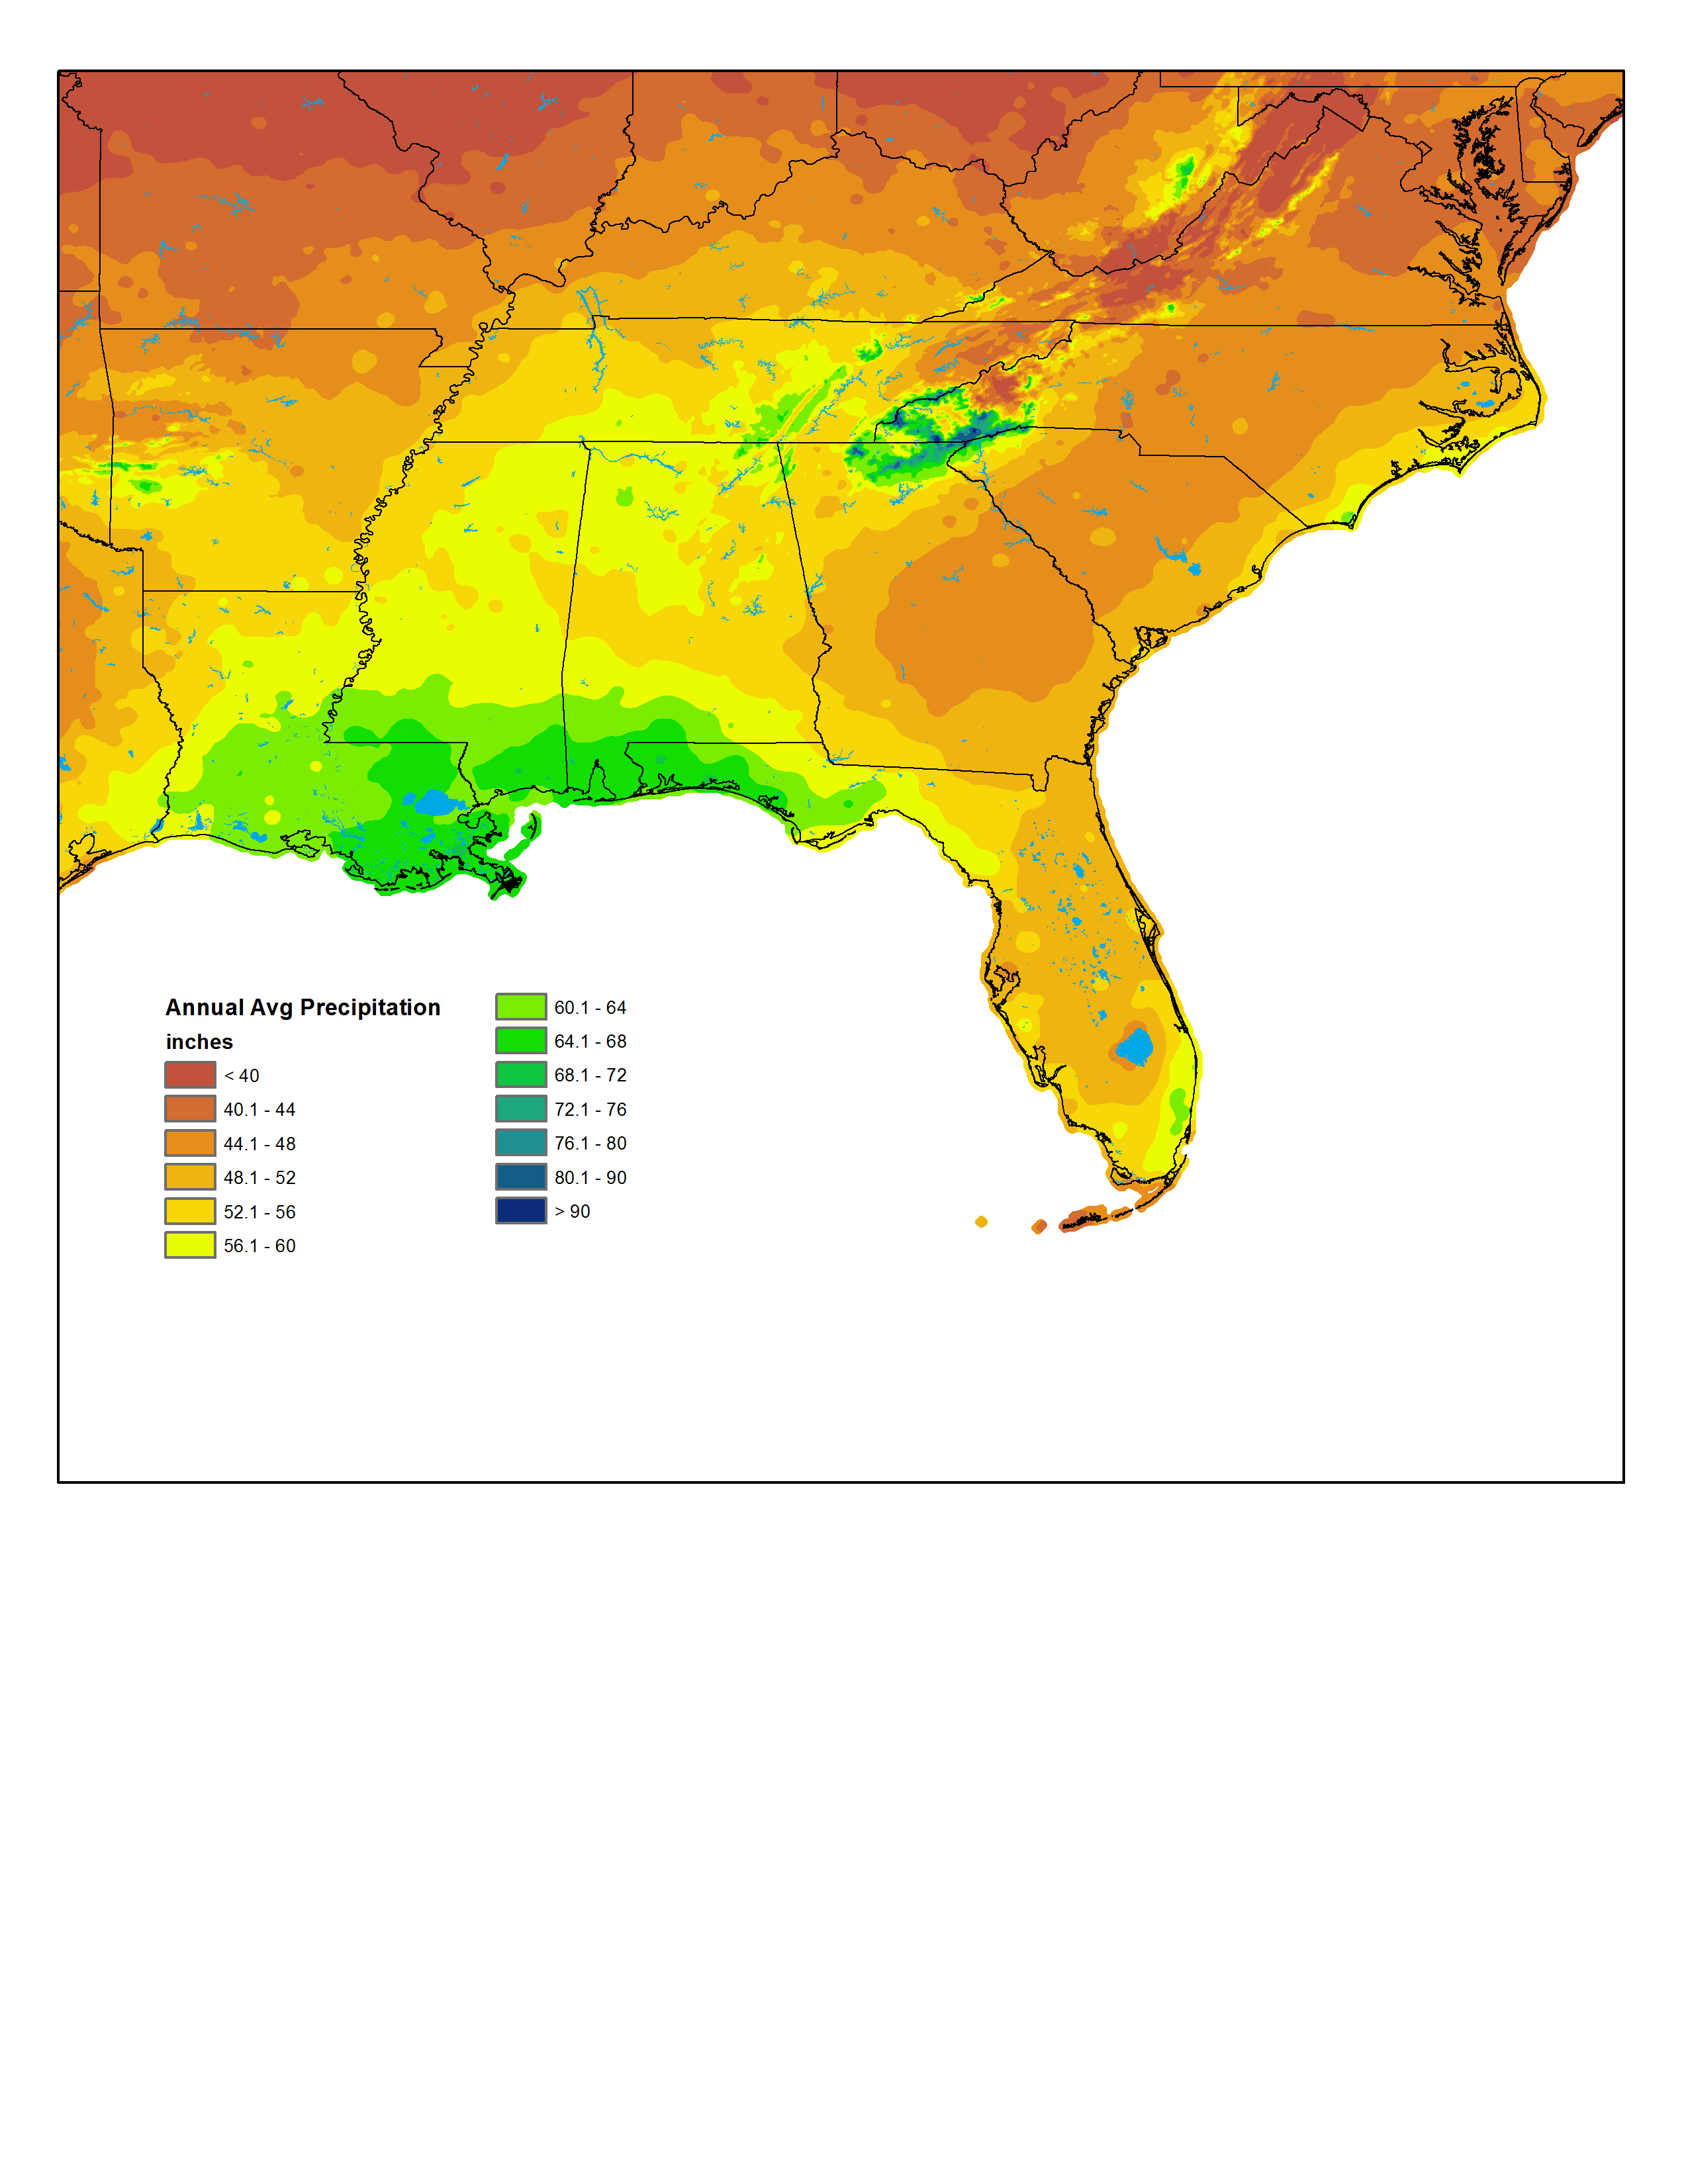
Annual average precipitation |
NCA 3 |
 |
|
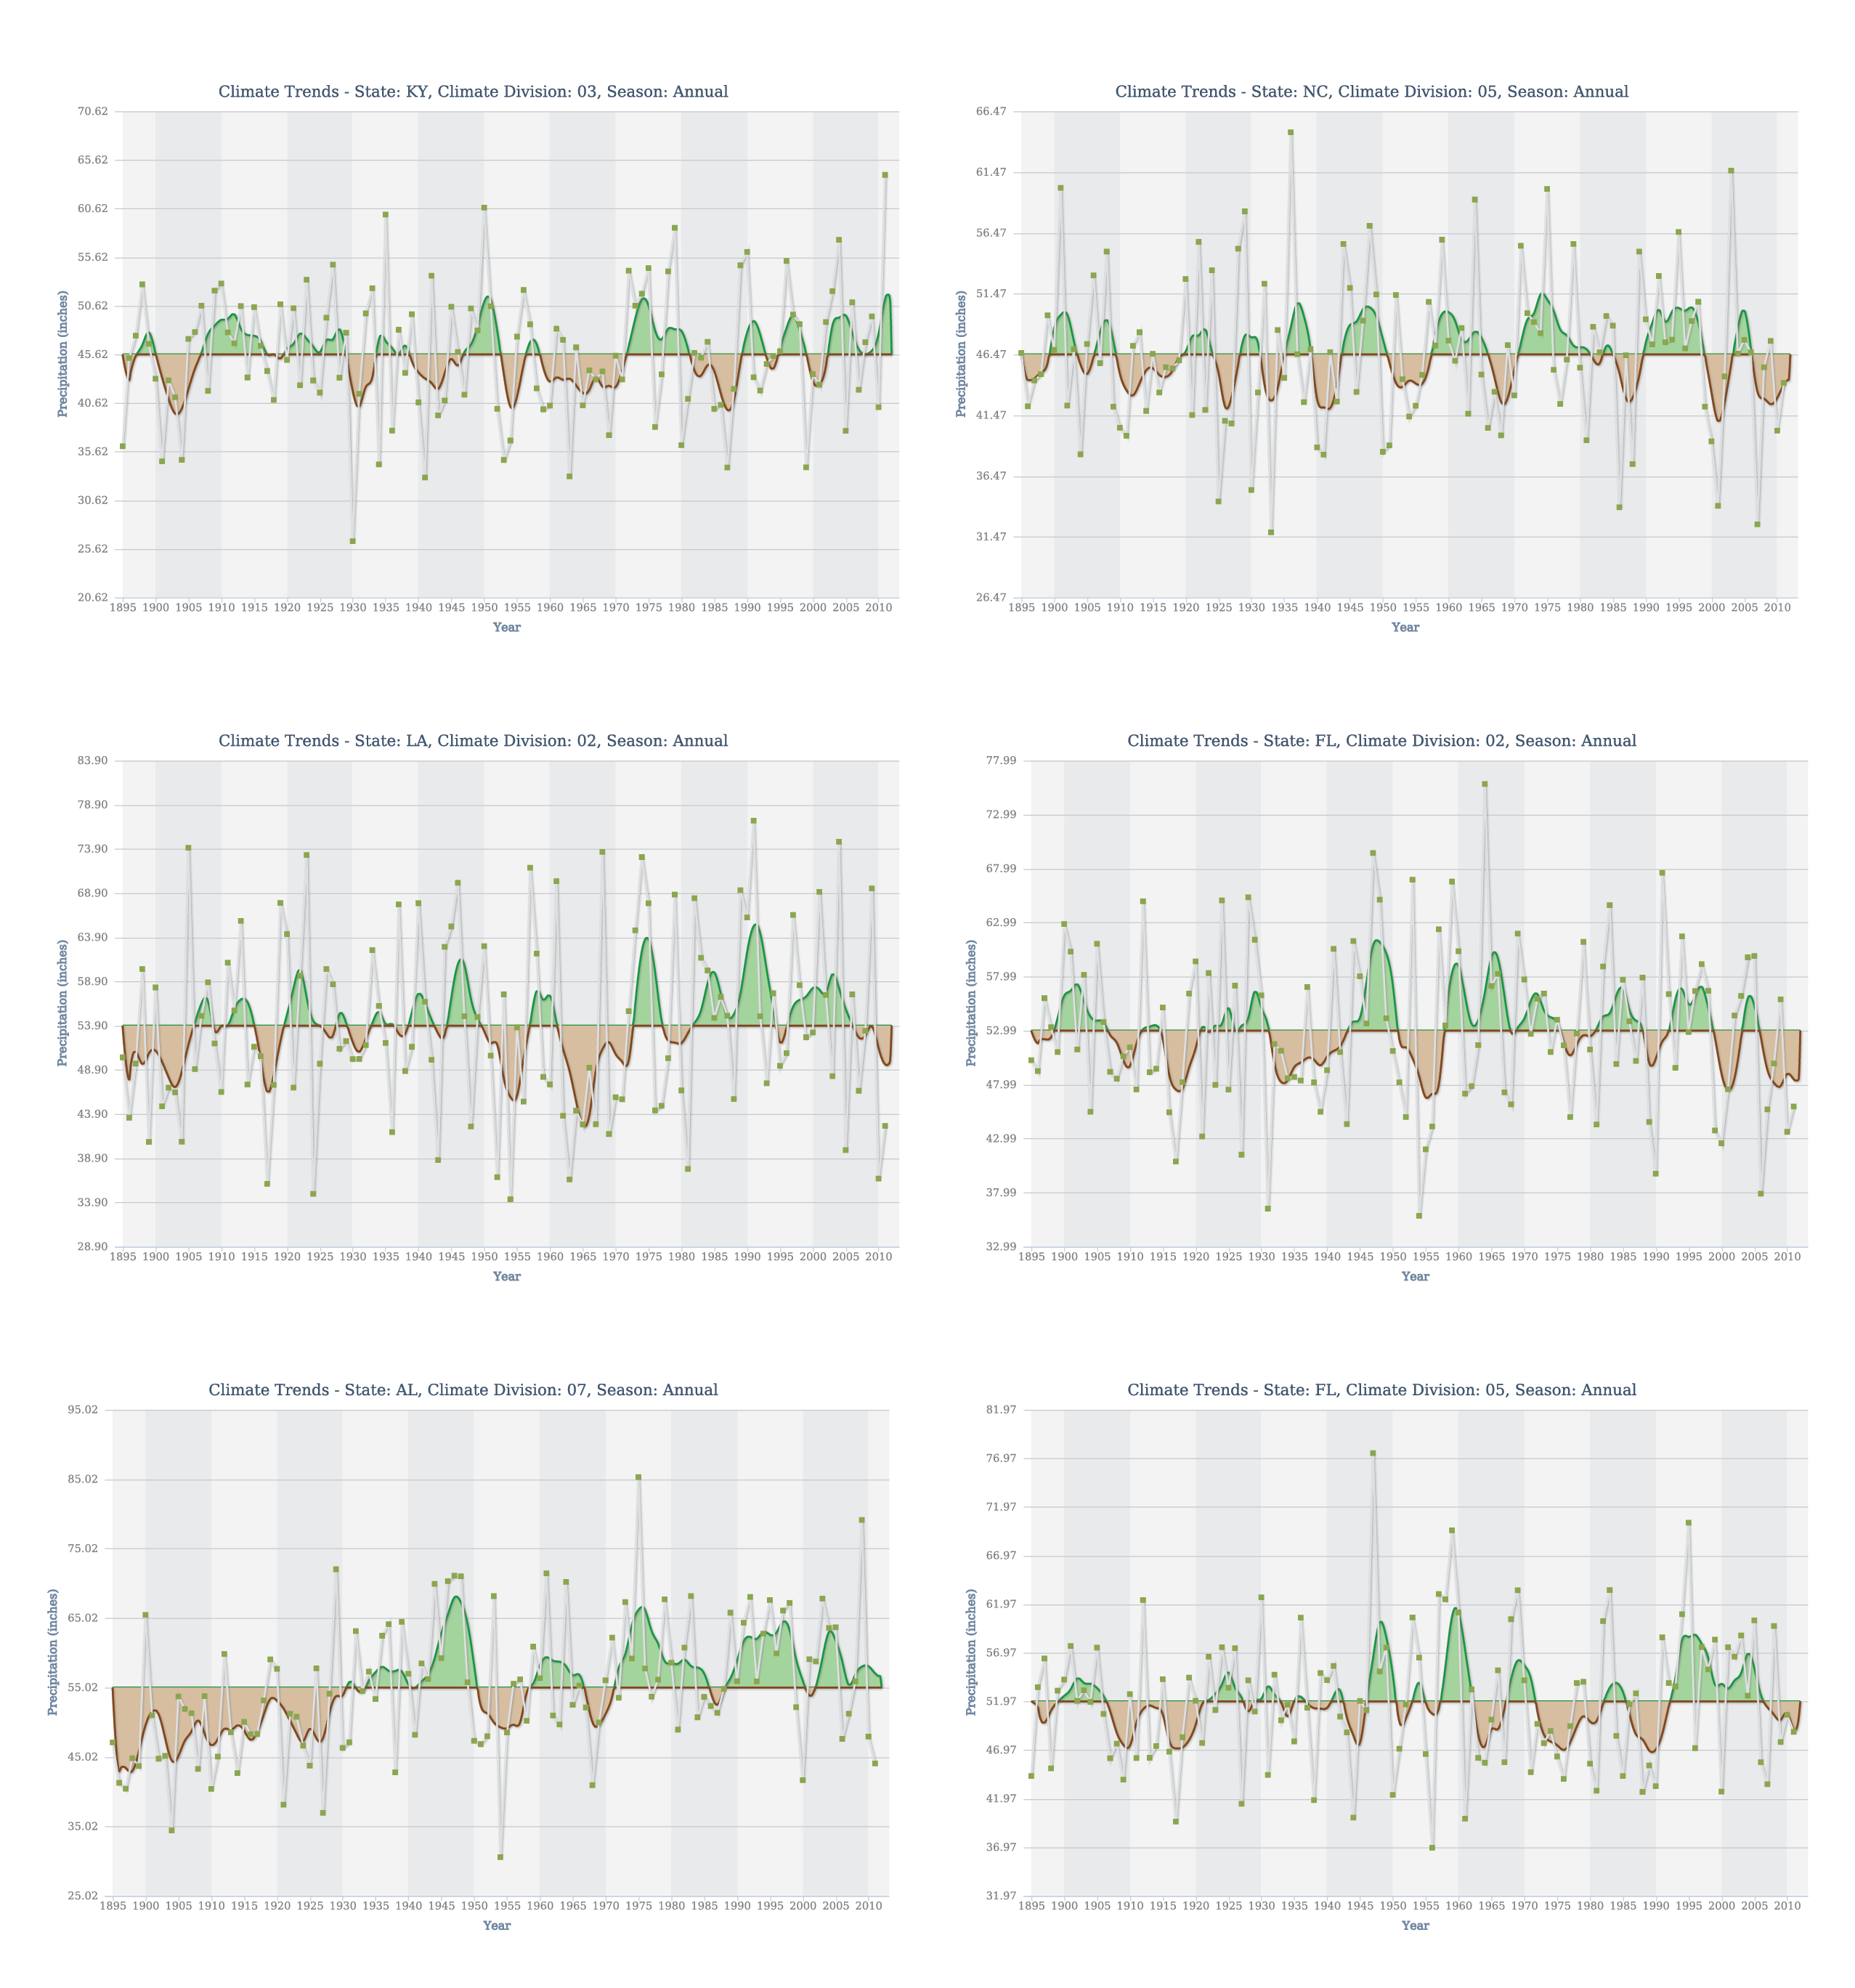
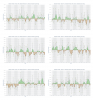
Annual precipitation trends at six climate divisions in the Southeast region. |
NCA 3 |
 |
|
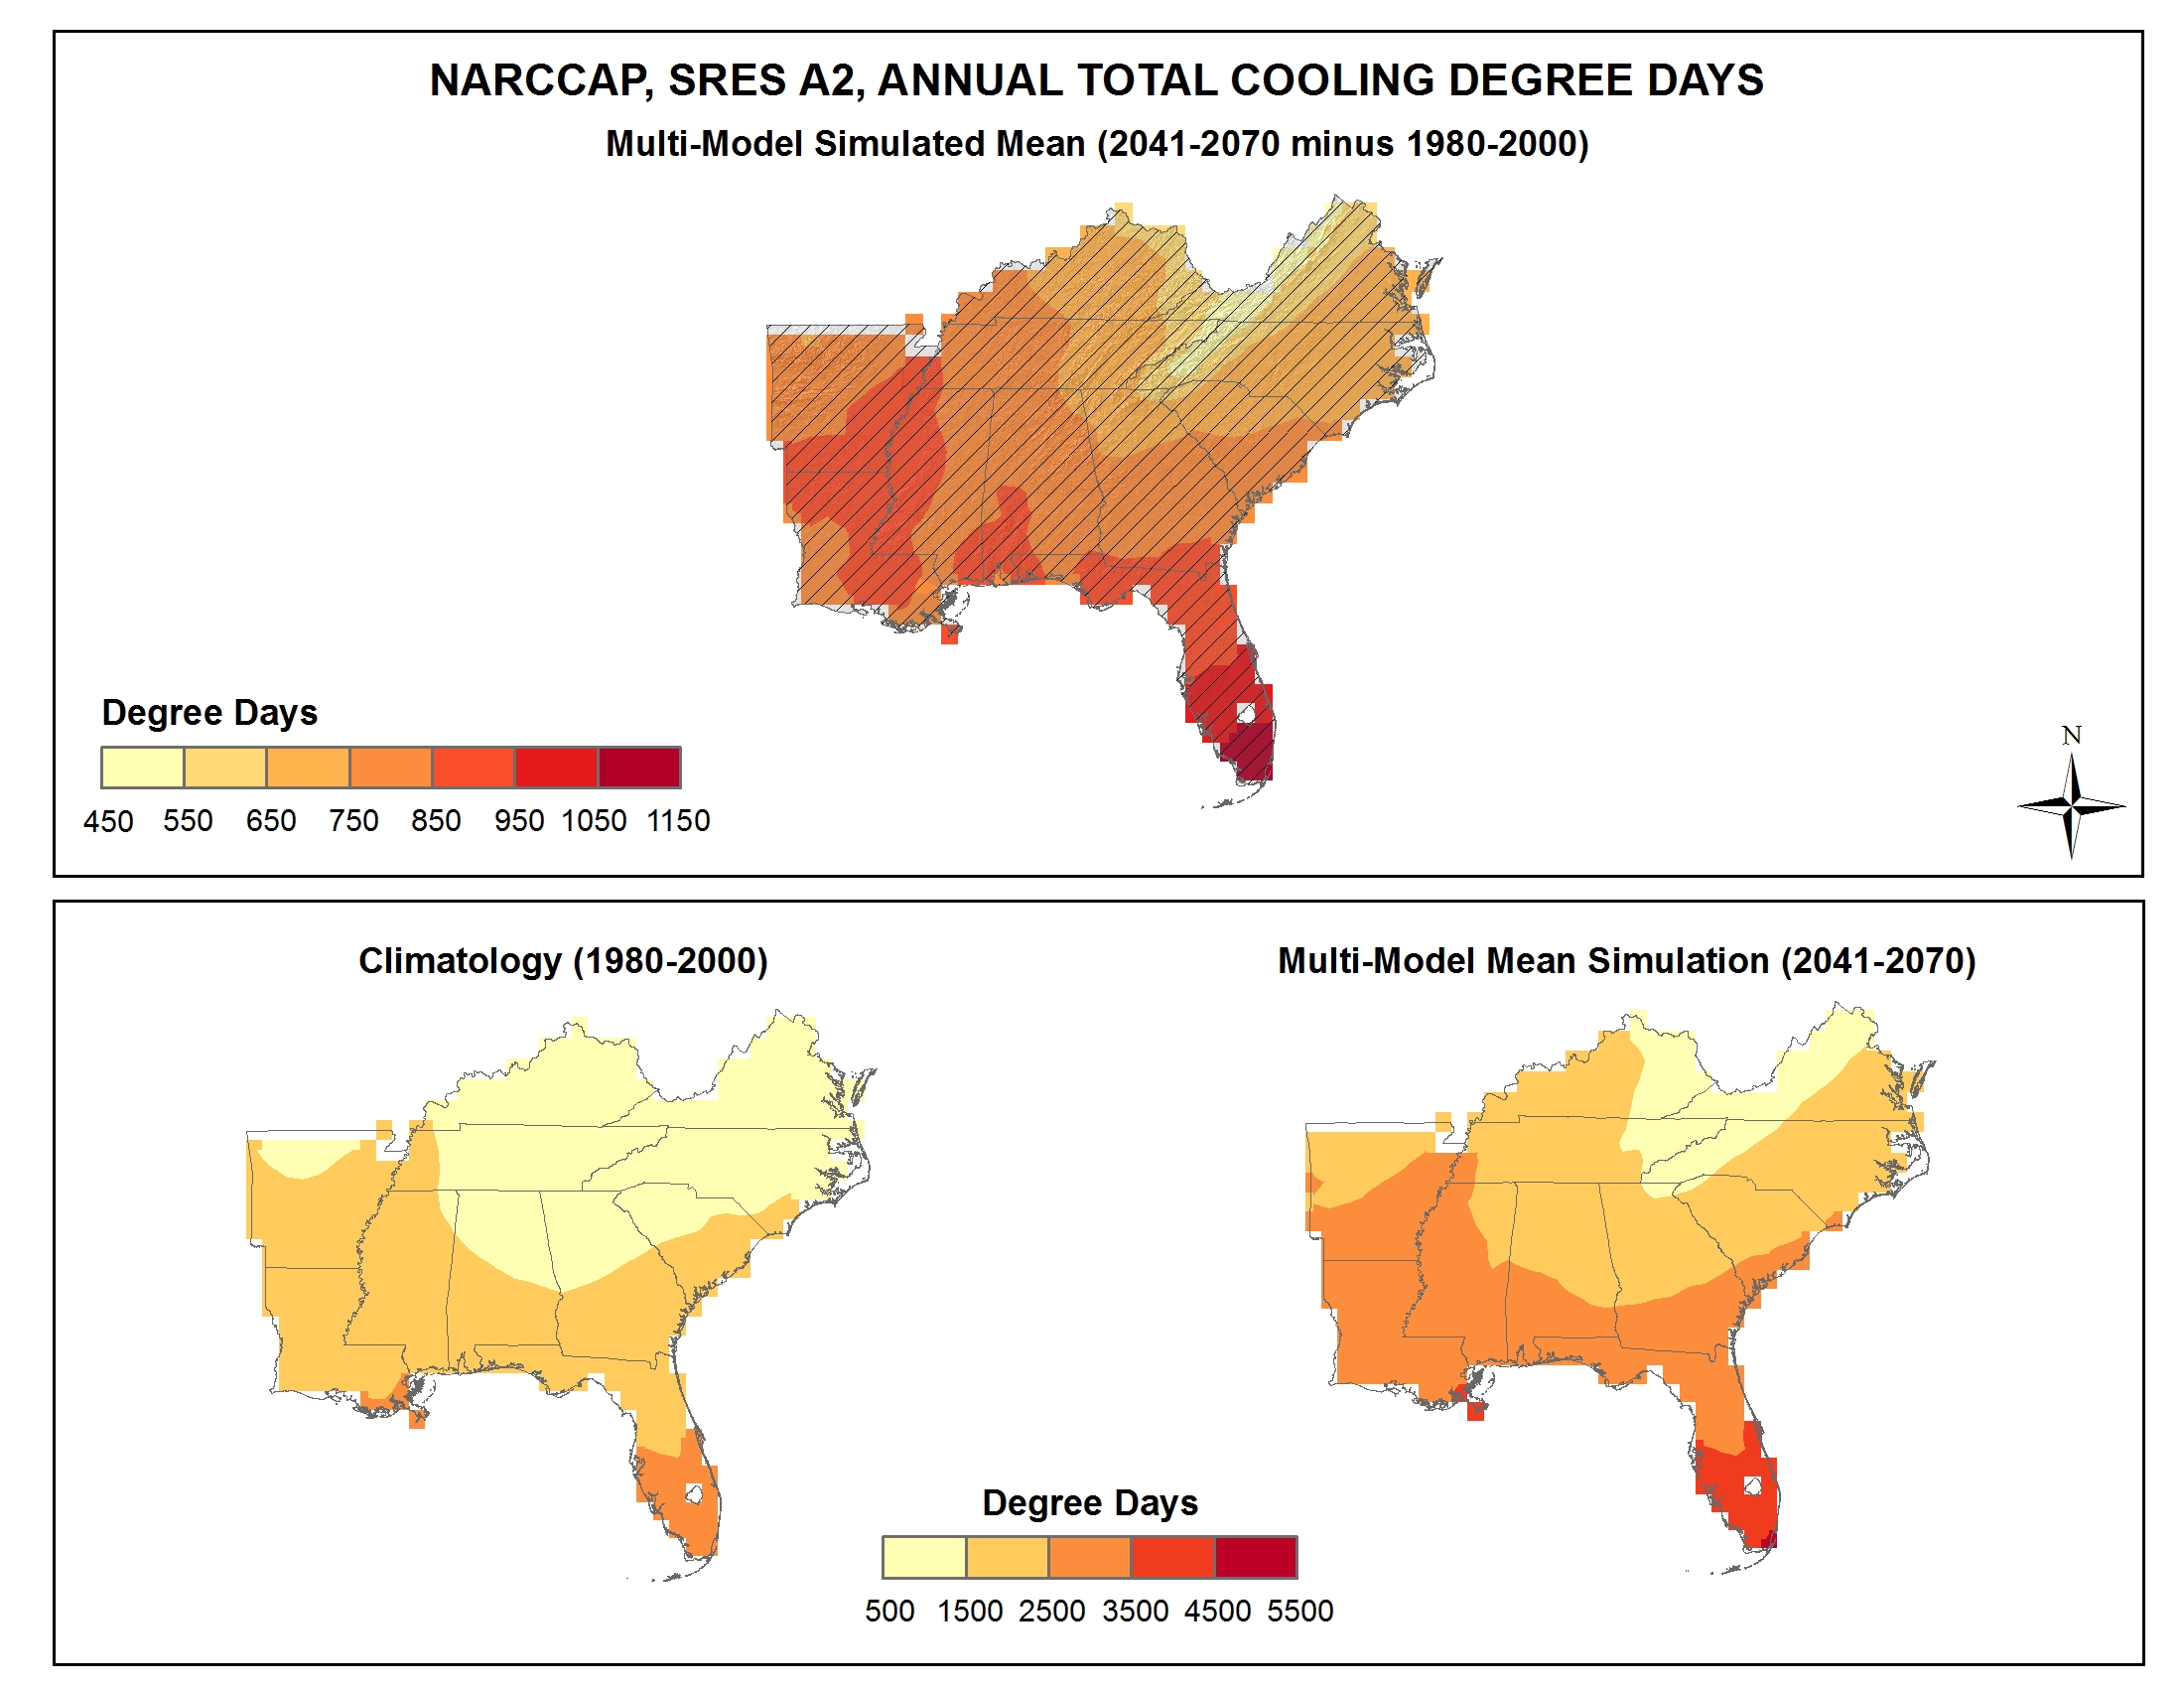
Simulated difference in the mean annual number of cooling degree days |
NCA 3 |
 |
|
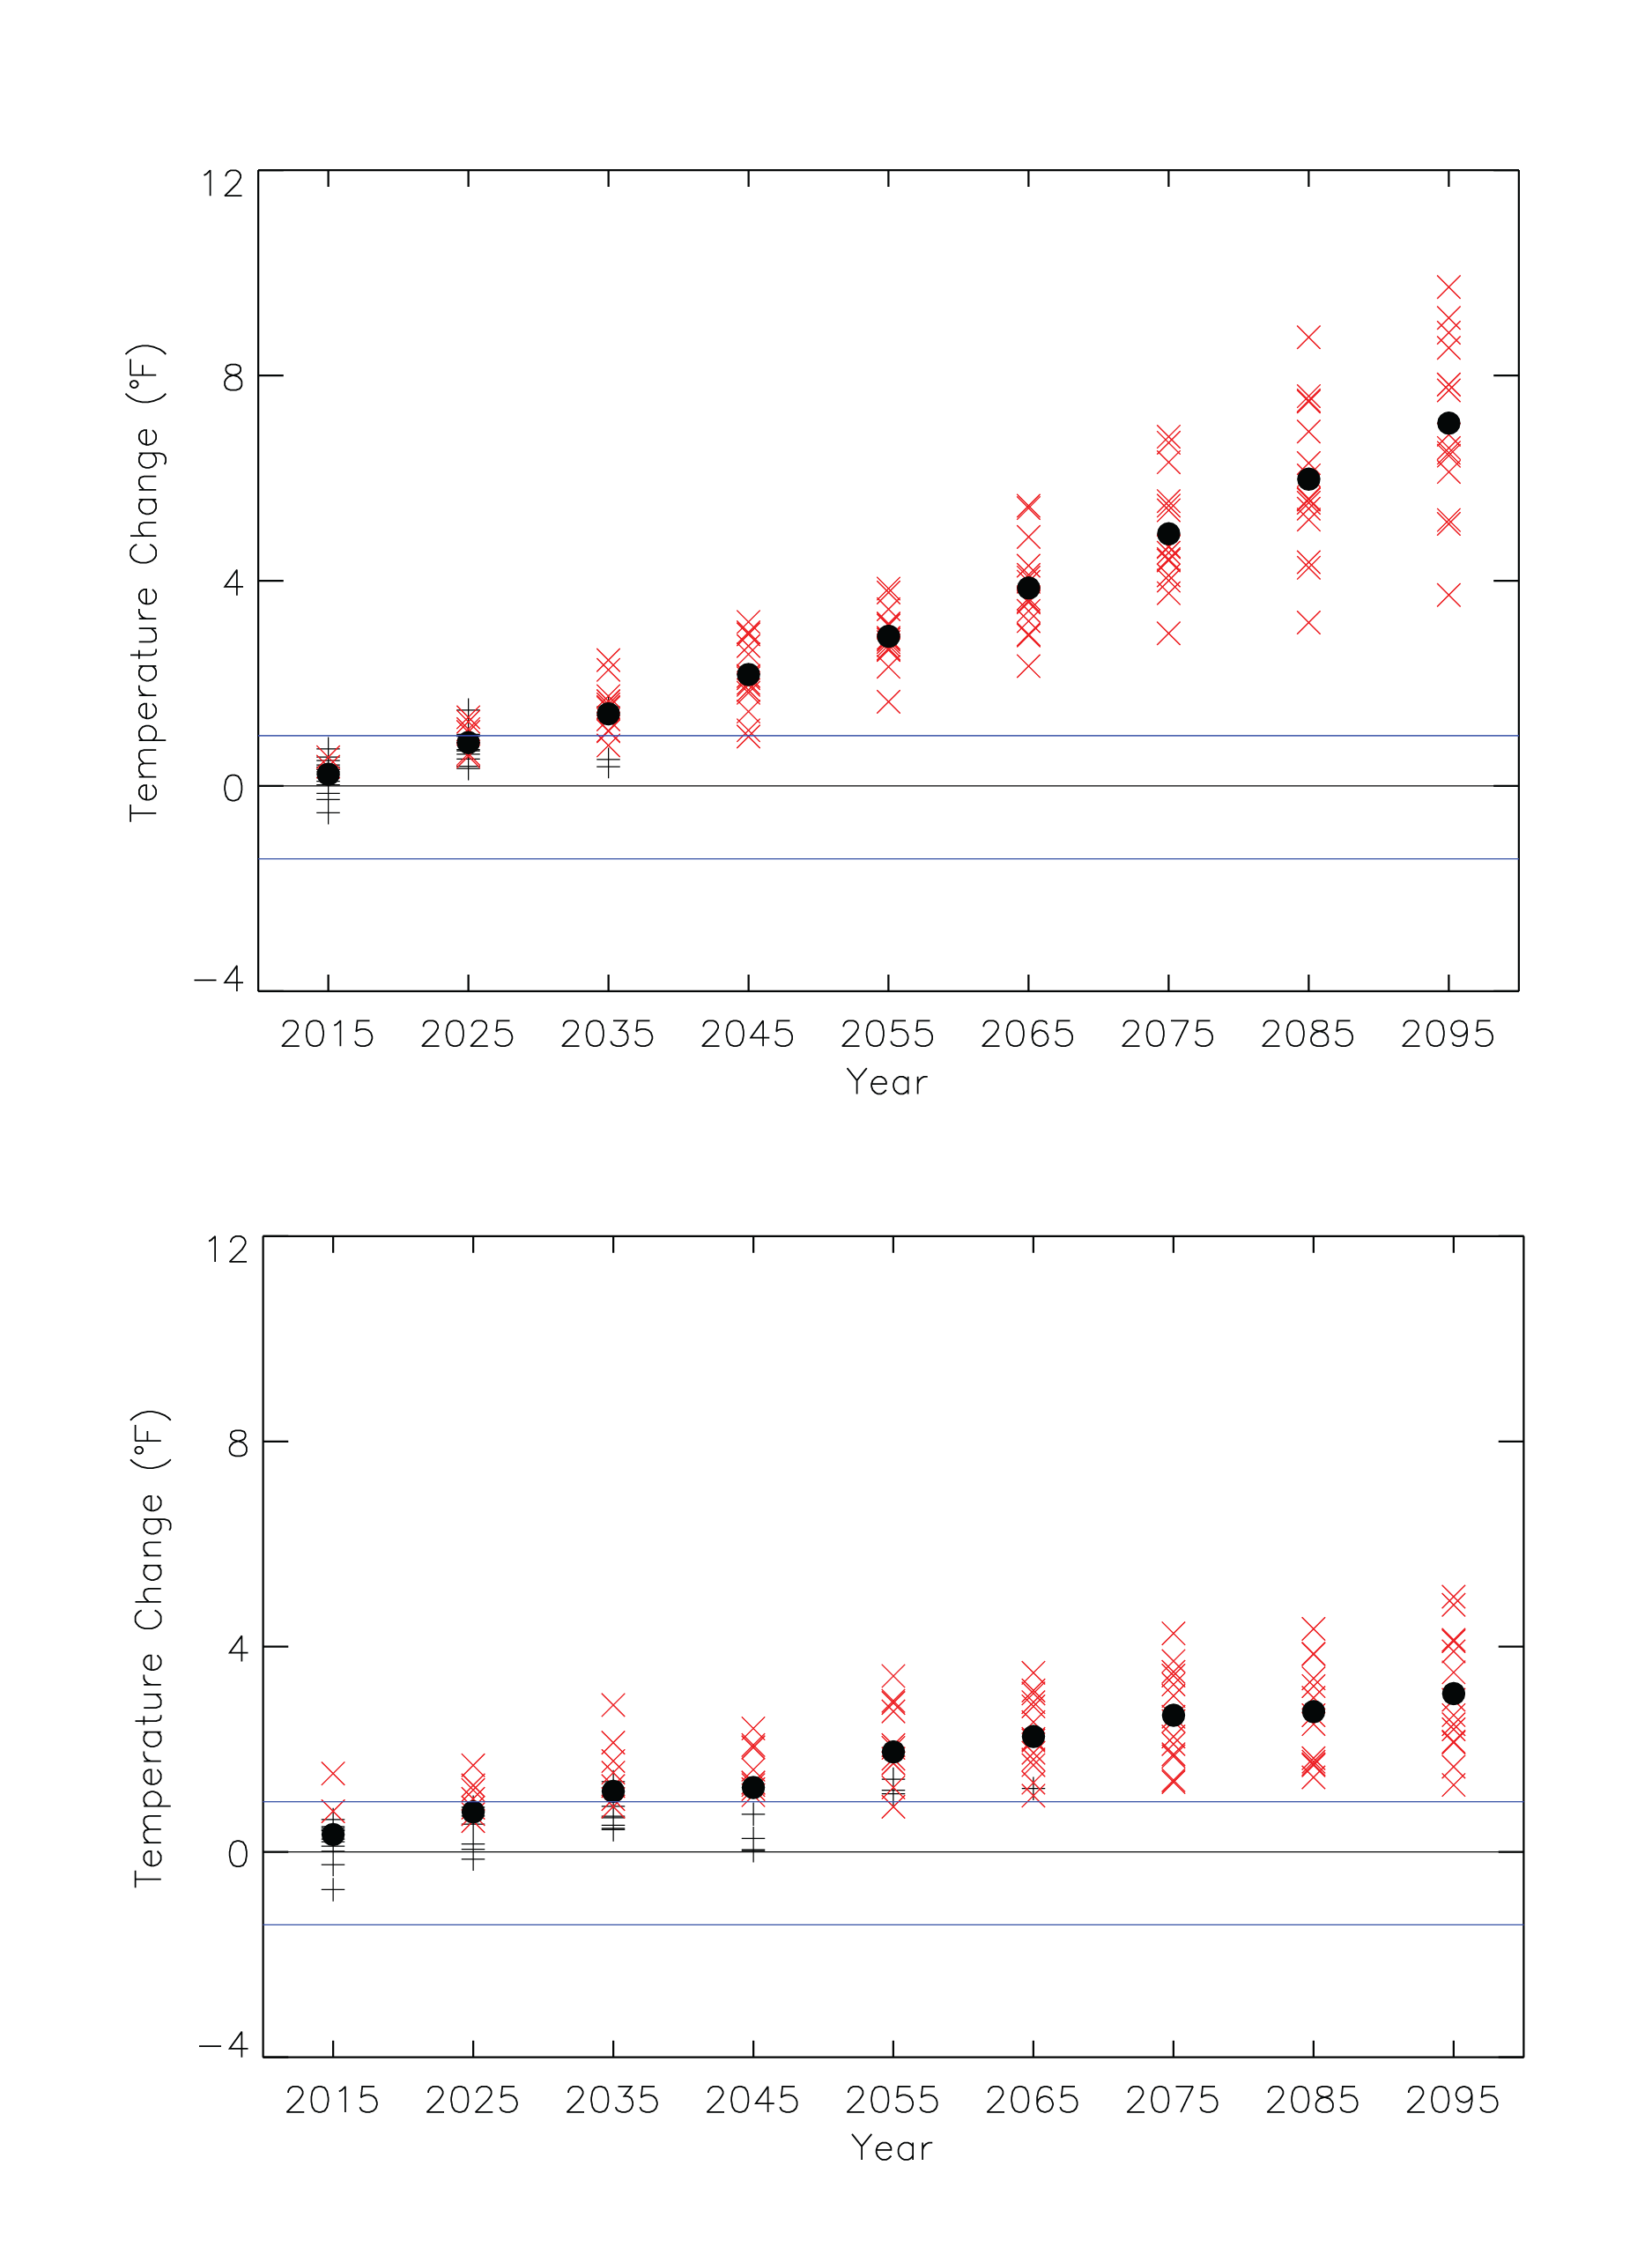
Simulated decadal mean change in annual temperature |
NCA 3 |
 |
|
Number of tornadoes greater than or equal to F2/EF-2 |
NCA 3 |
 |
|
Simulated annual mean temperature change |
NCA 3 |
 |
|
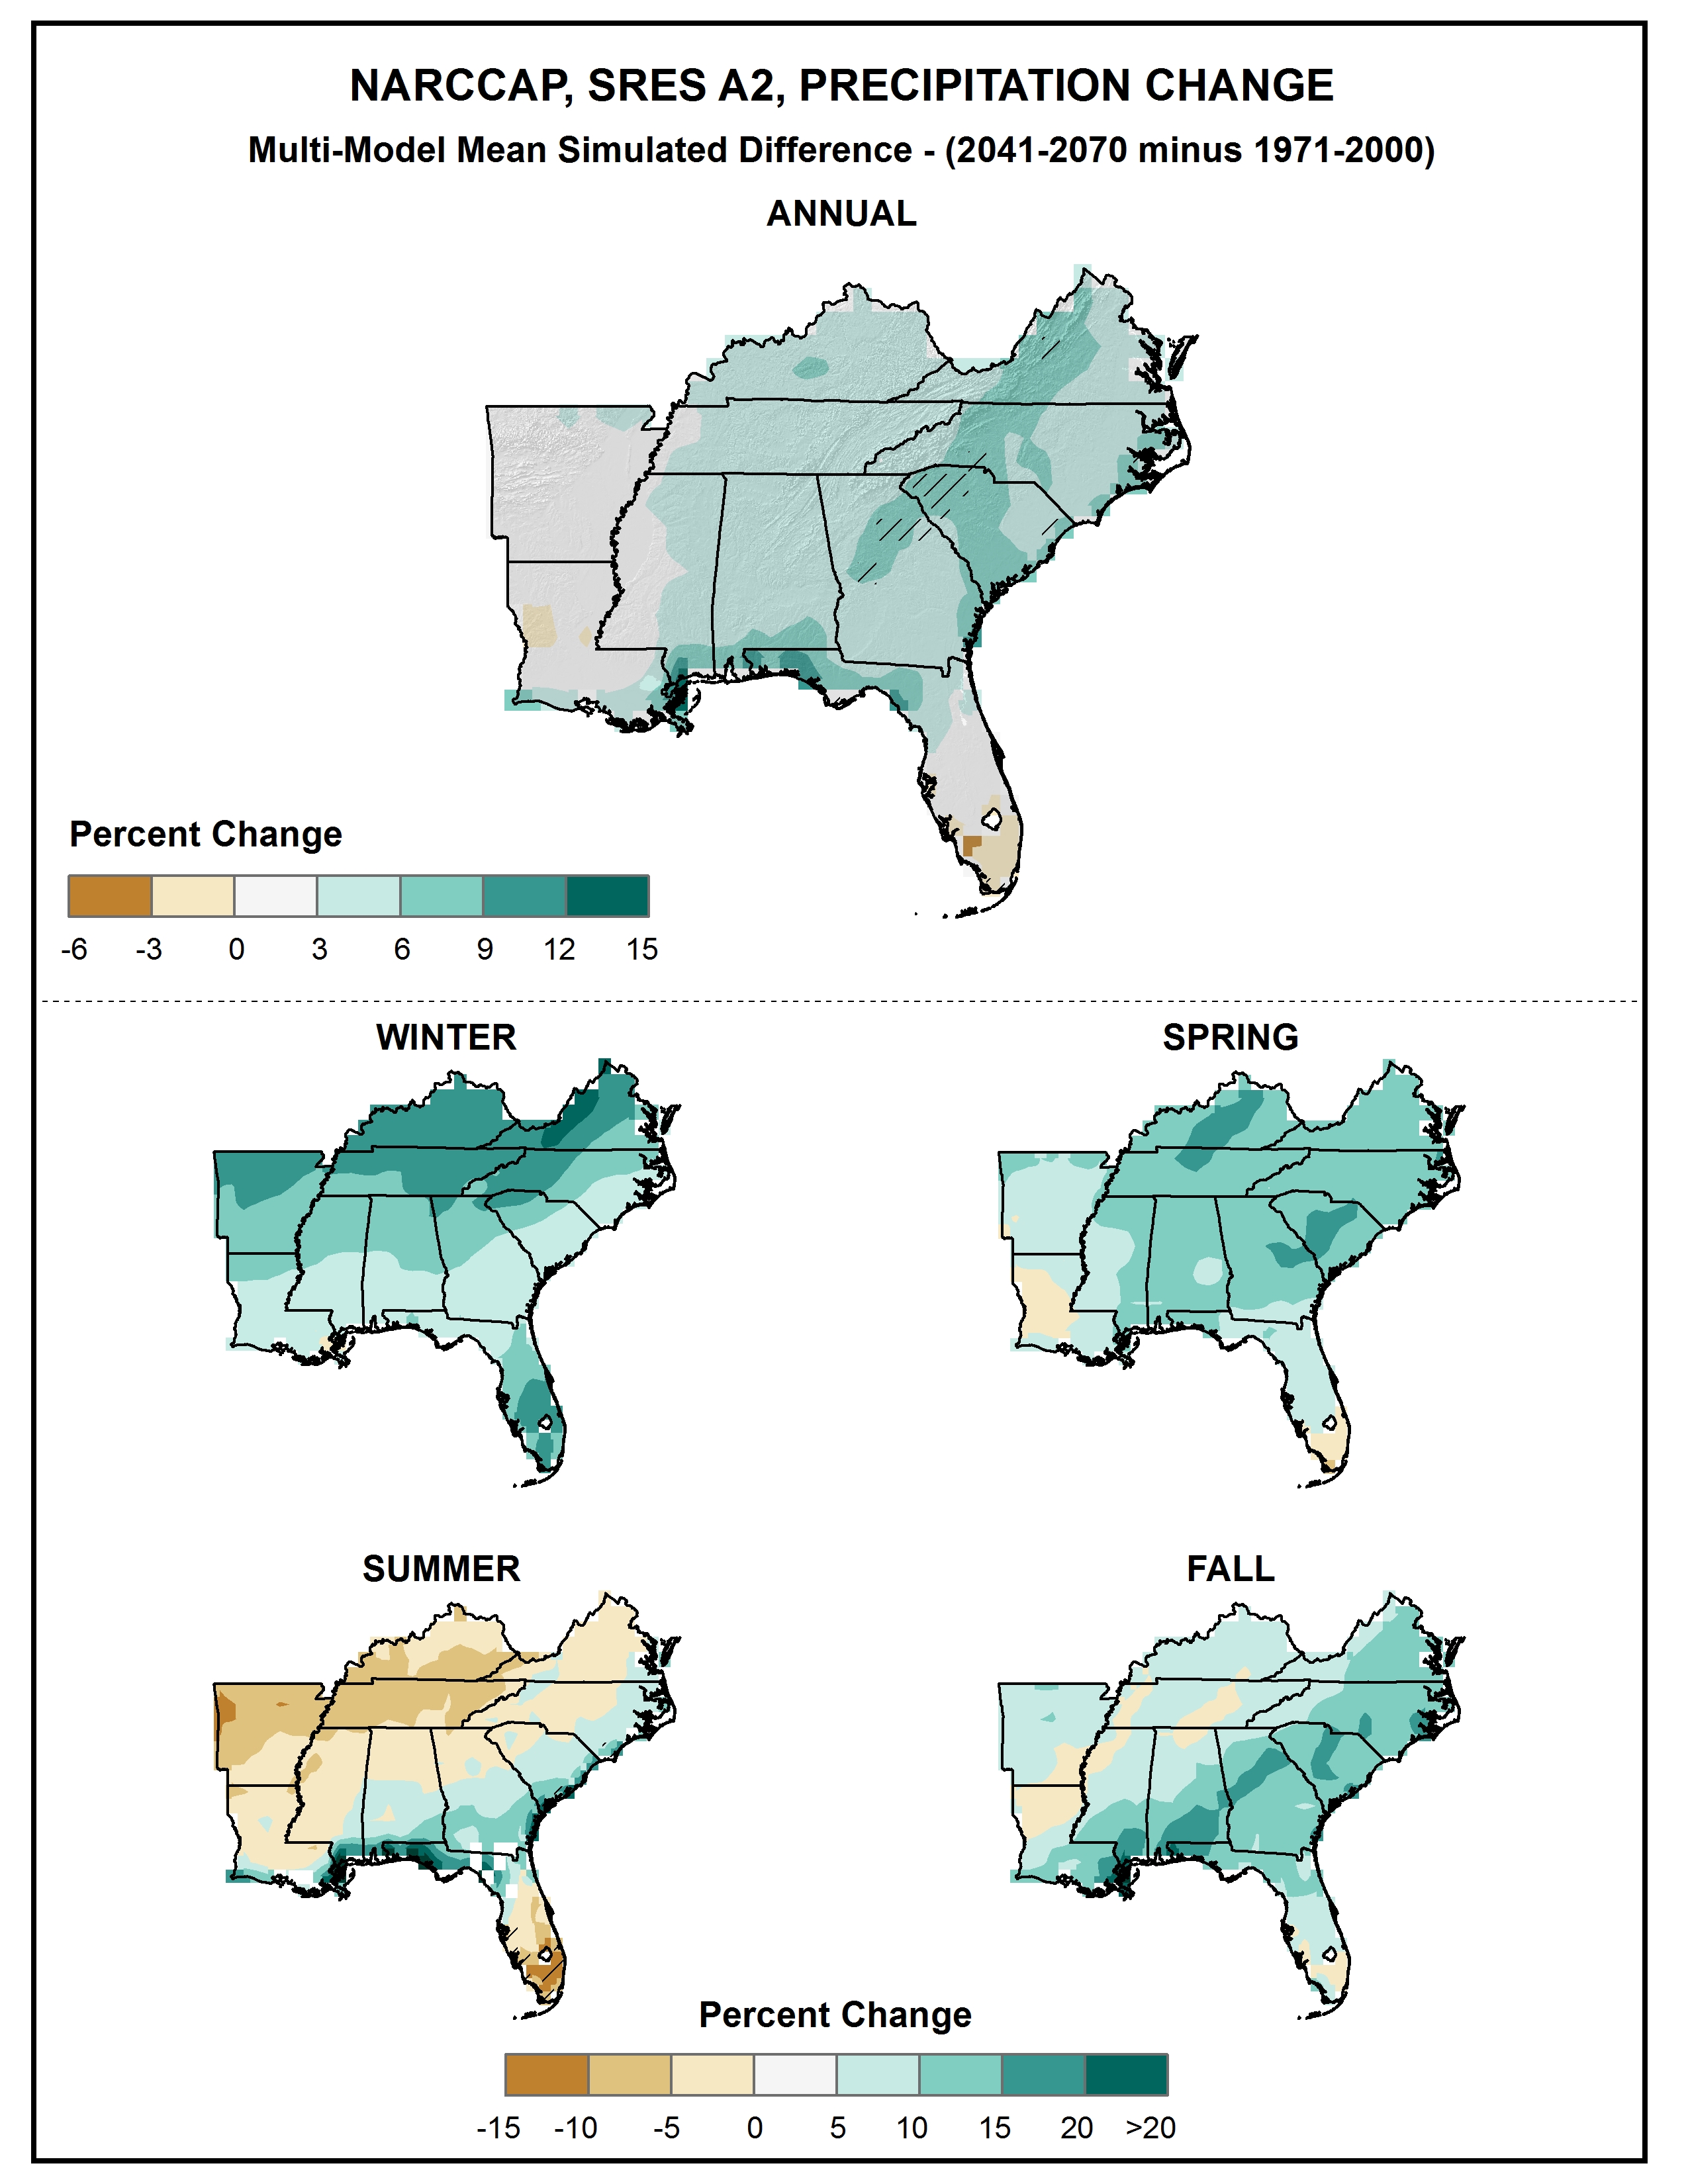
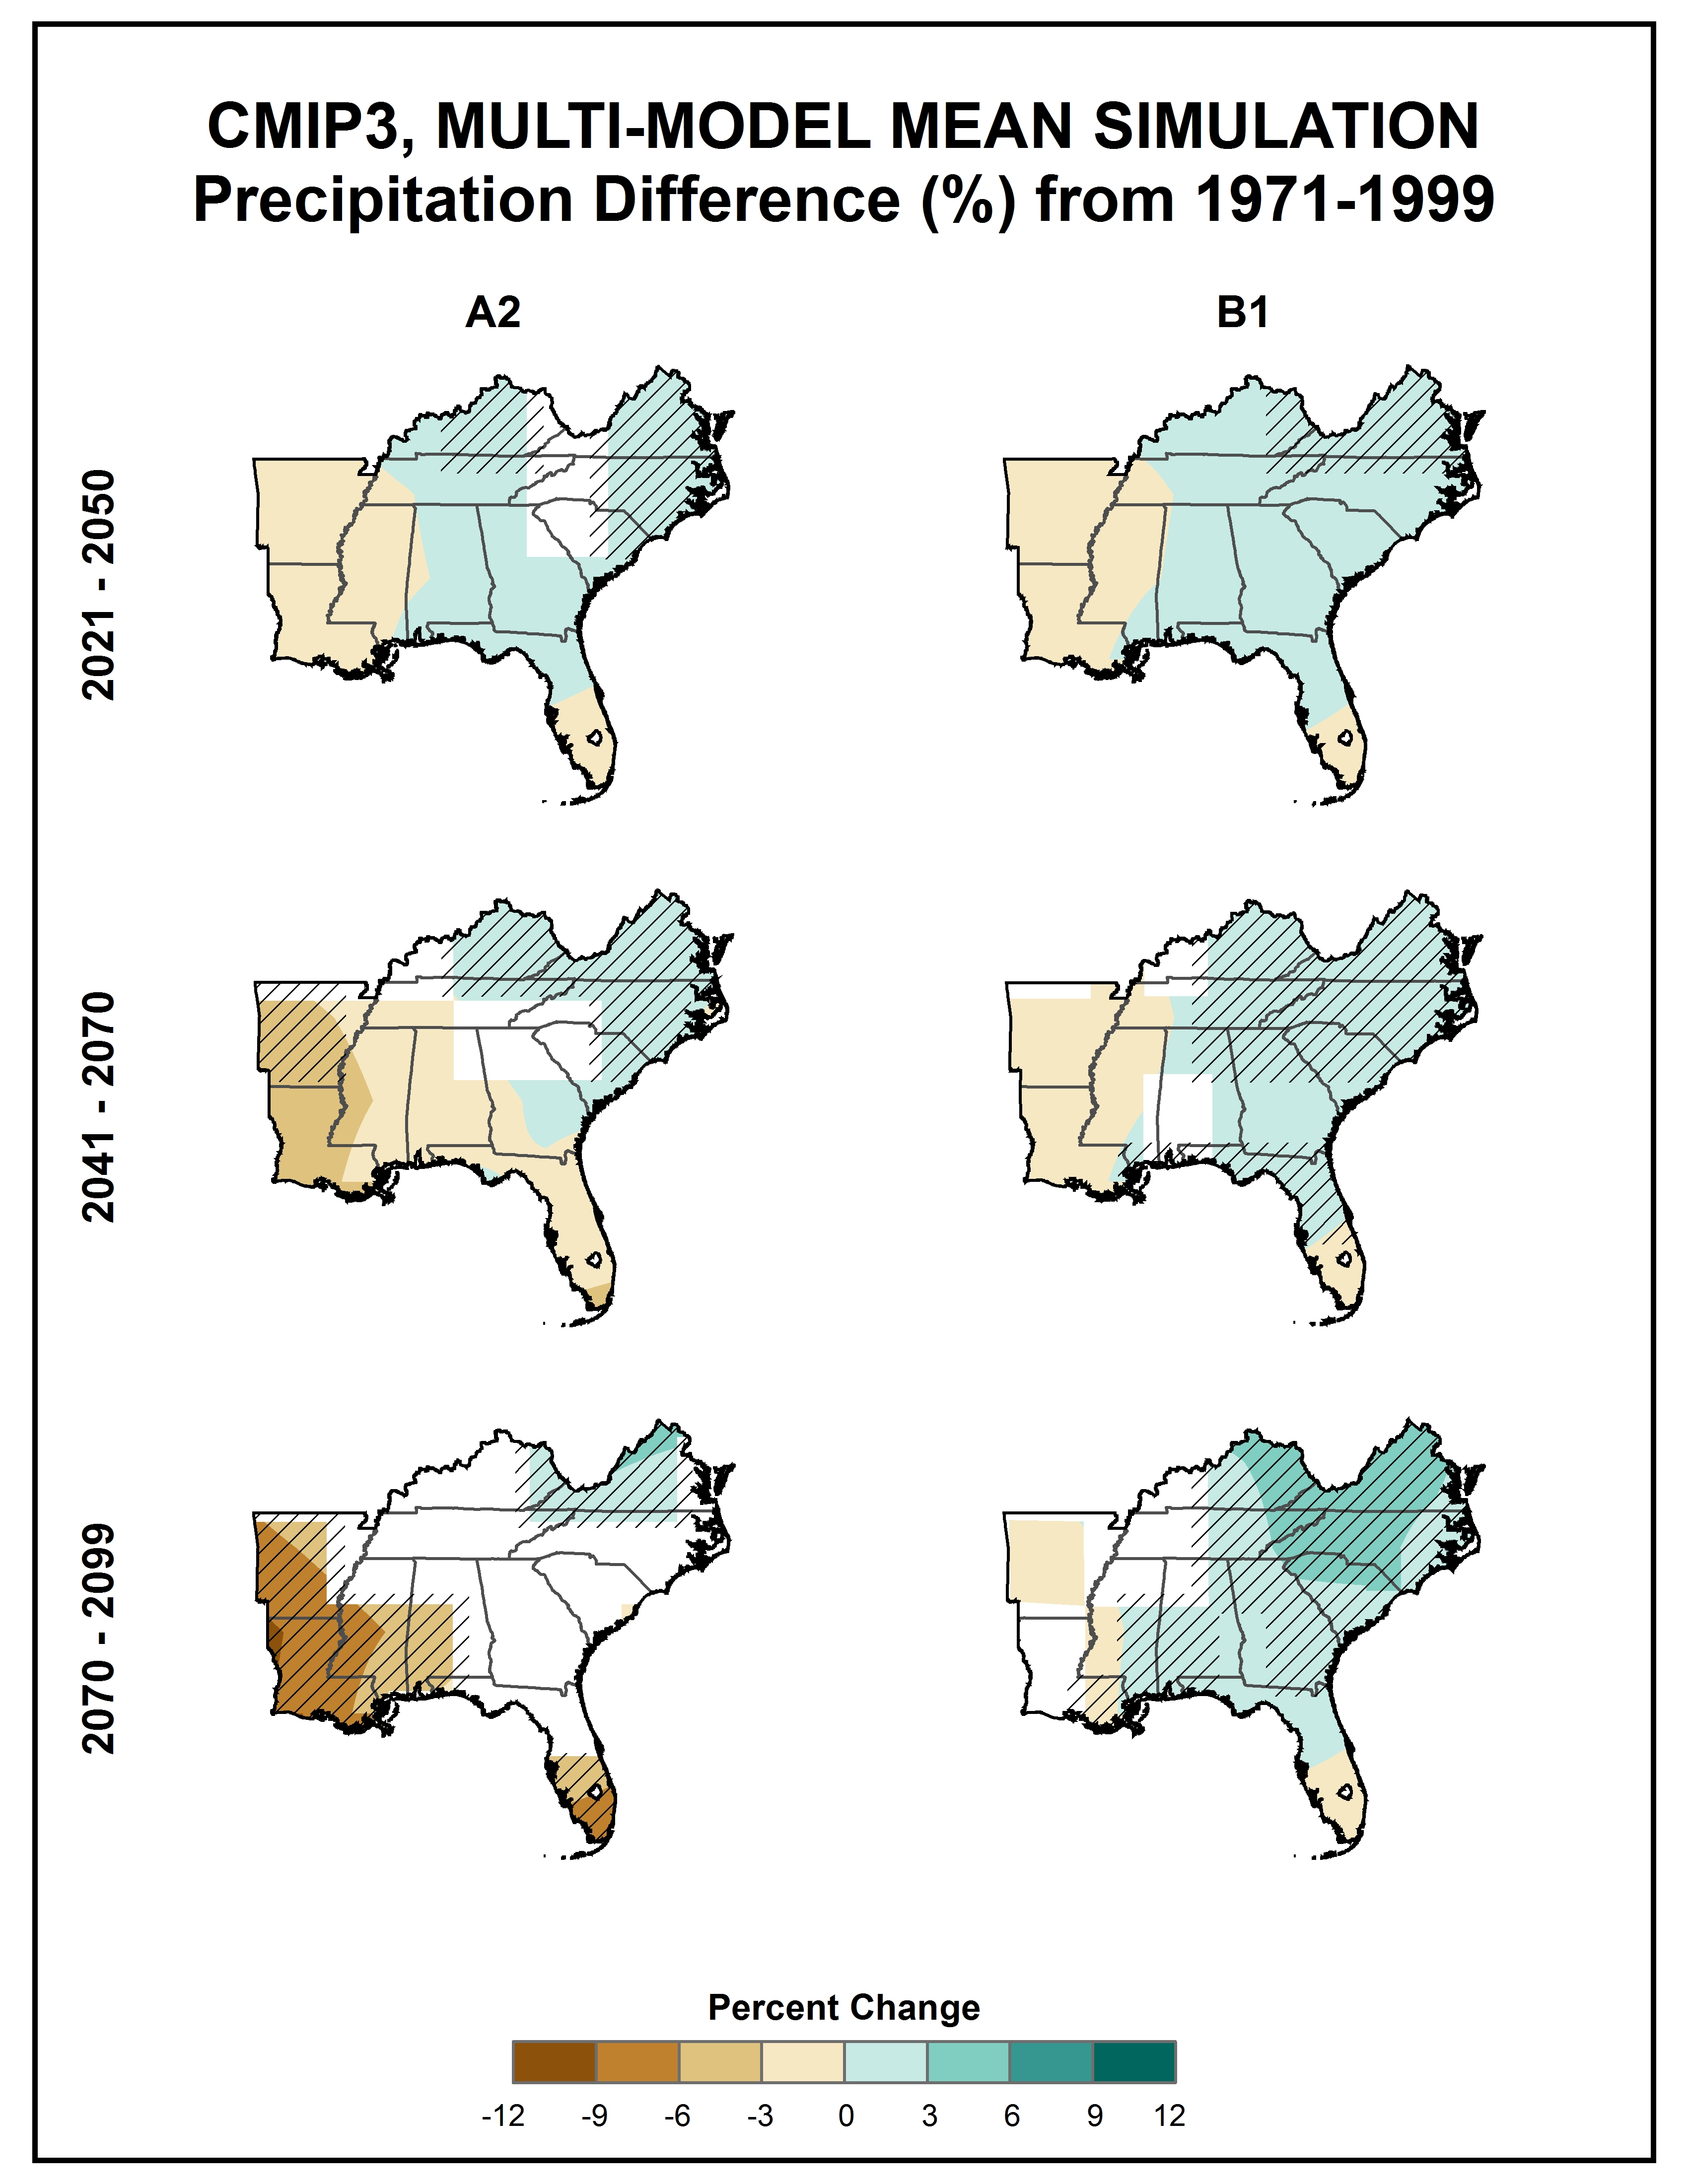
Simulated seasonal mean precipitation change |
NCA 3 |
 |
|
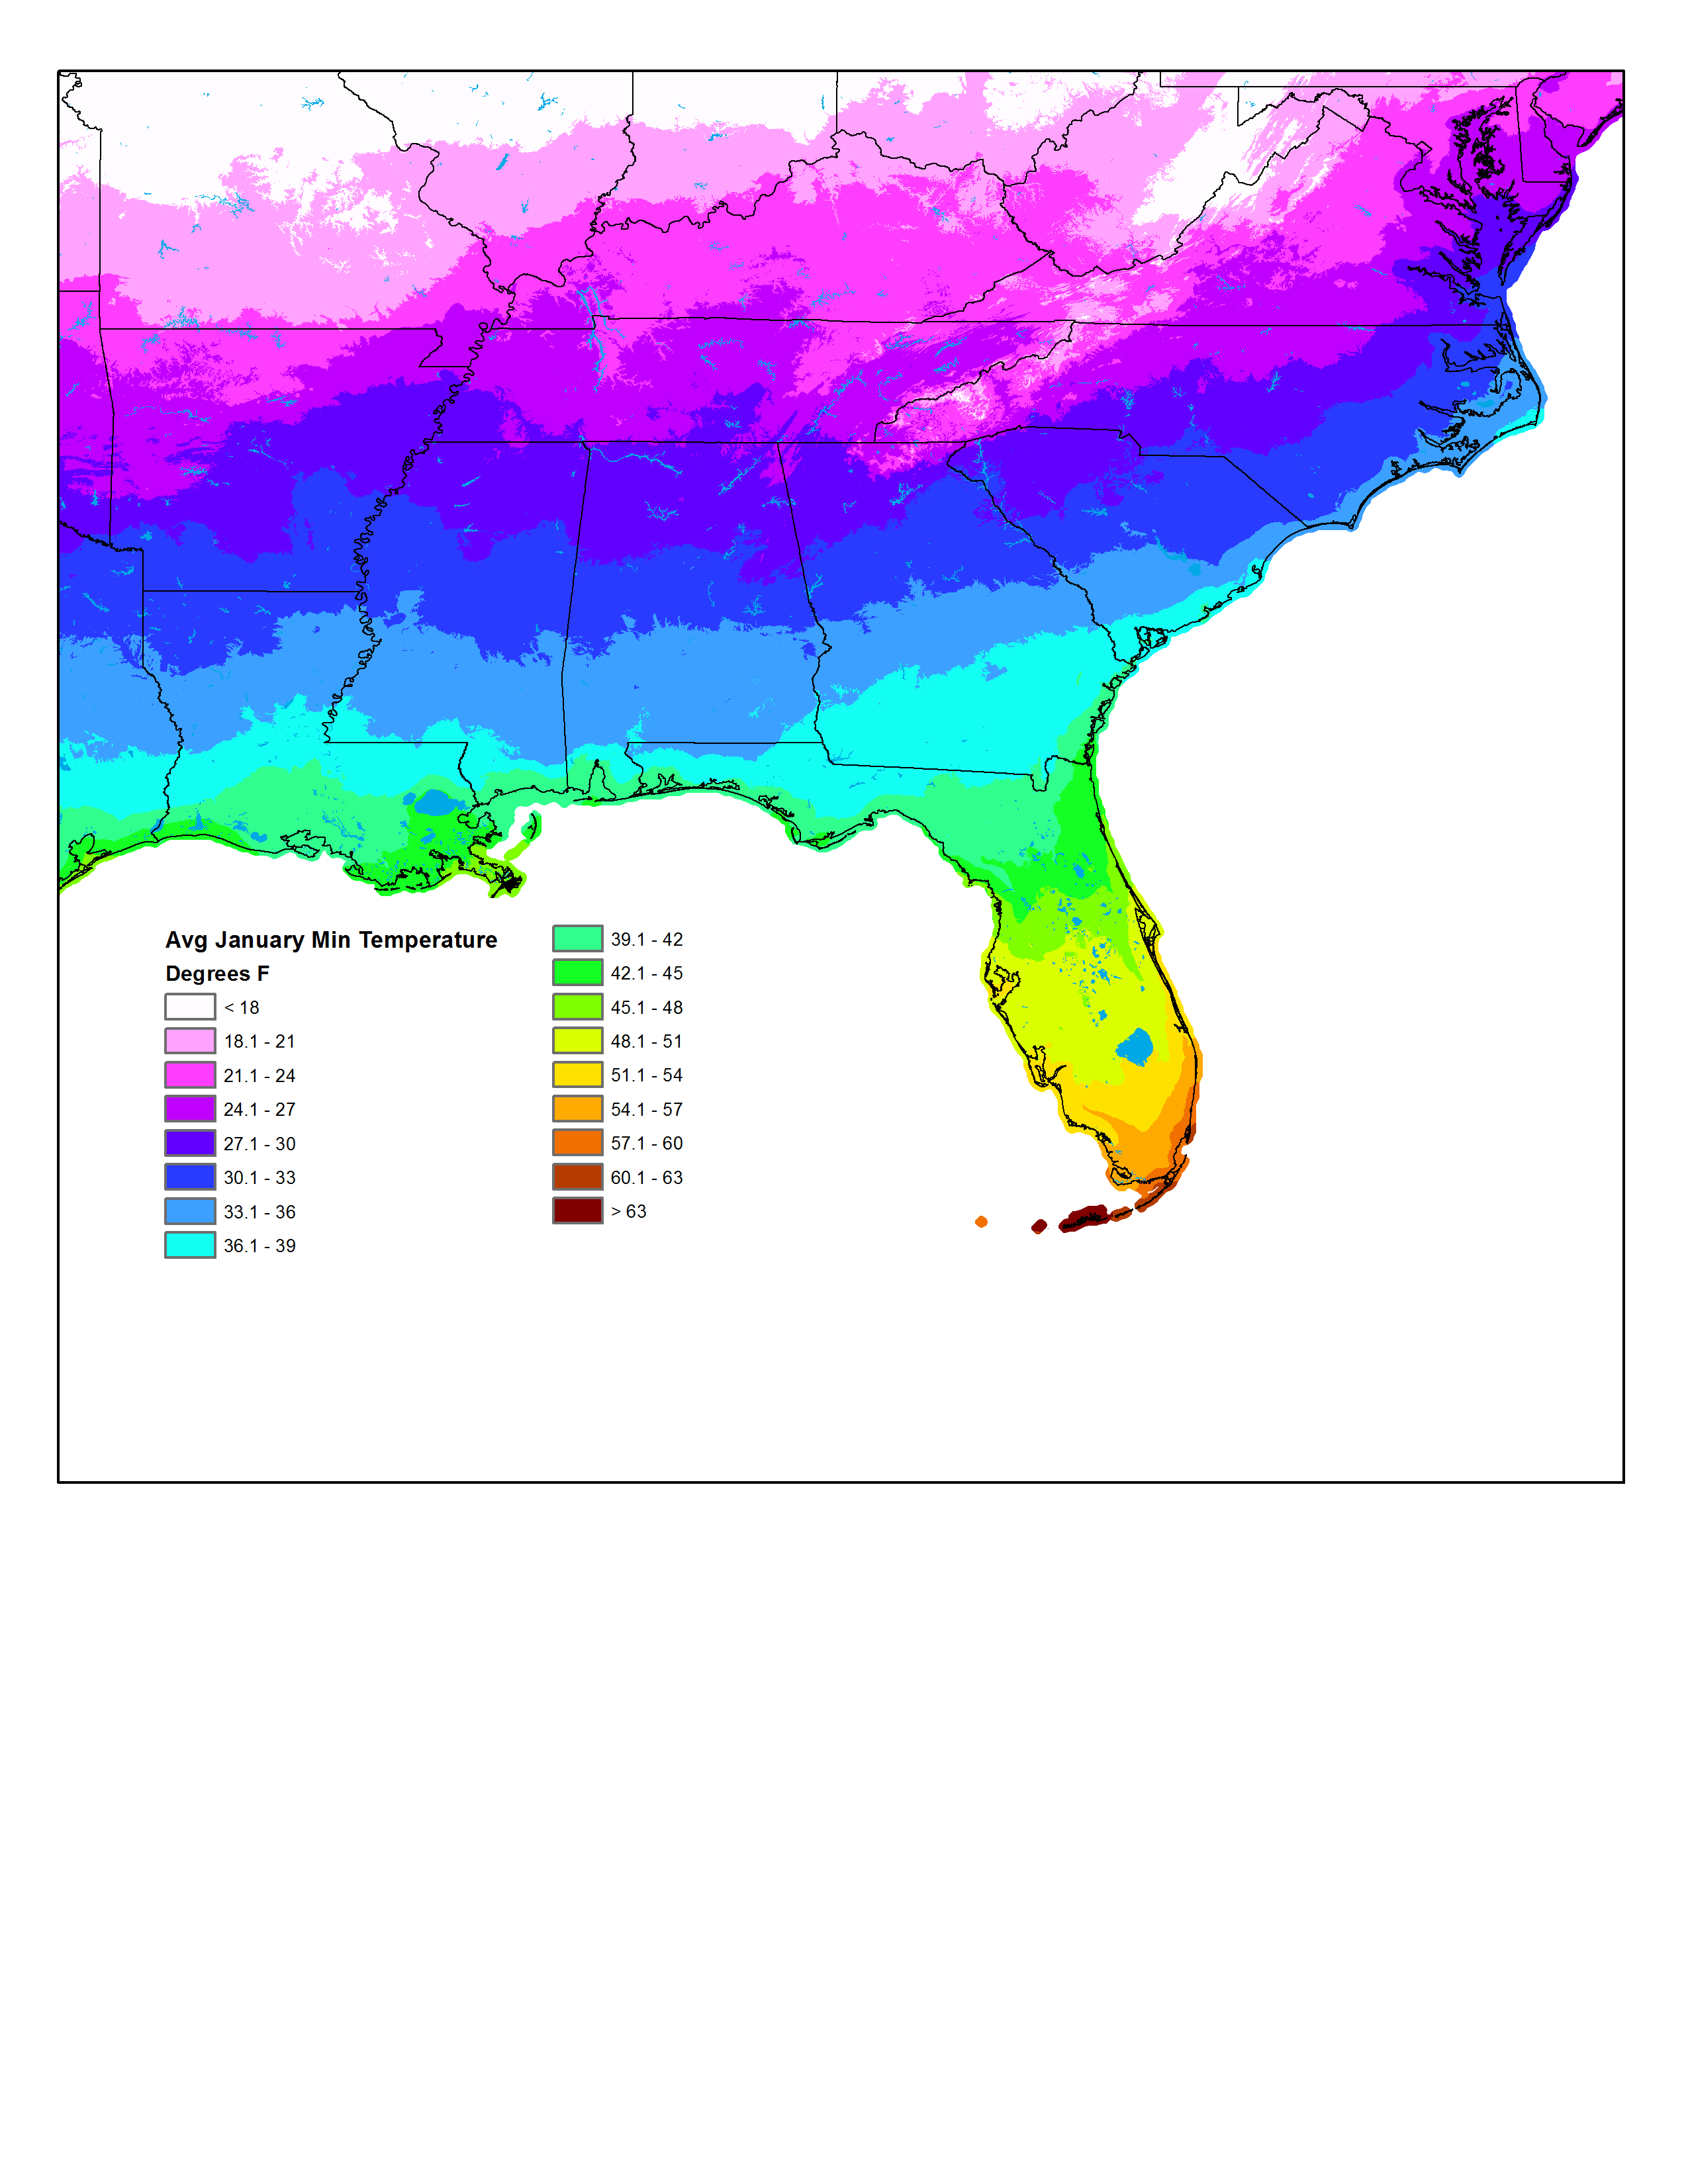
Average daily January minimum temperature |
NCA 3 |
 |
|
Difference in cumulative number of days with a minimum temperature <=10F |
NCA 3 |
 |
|
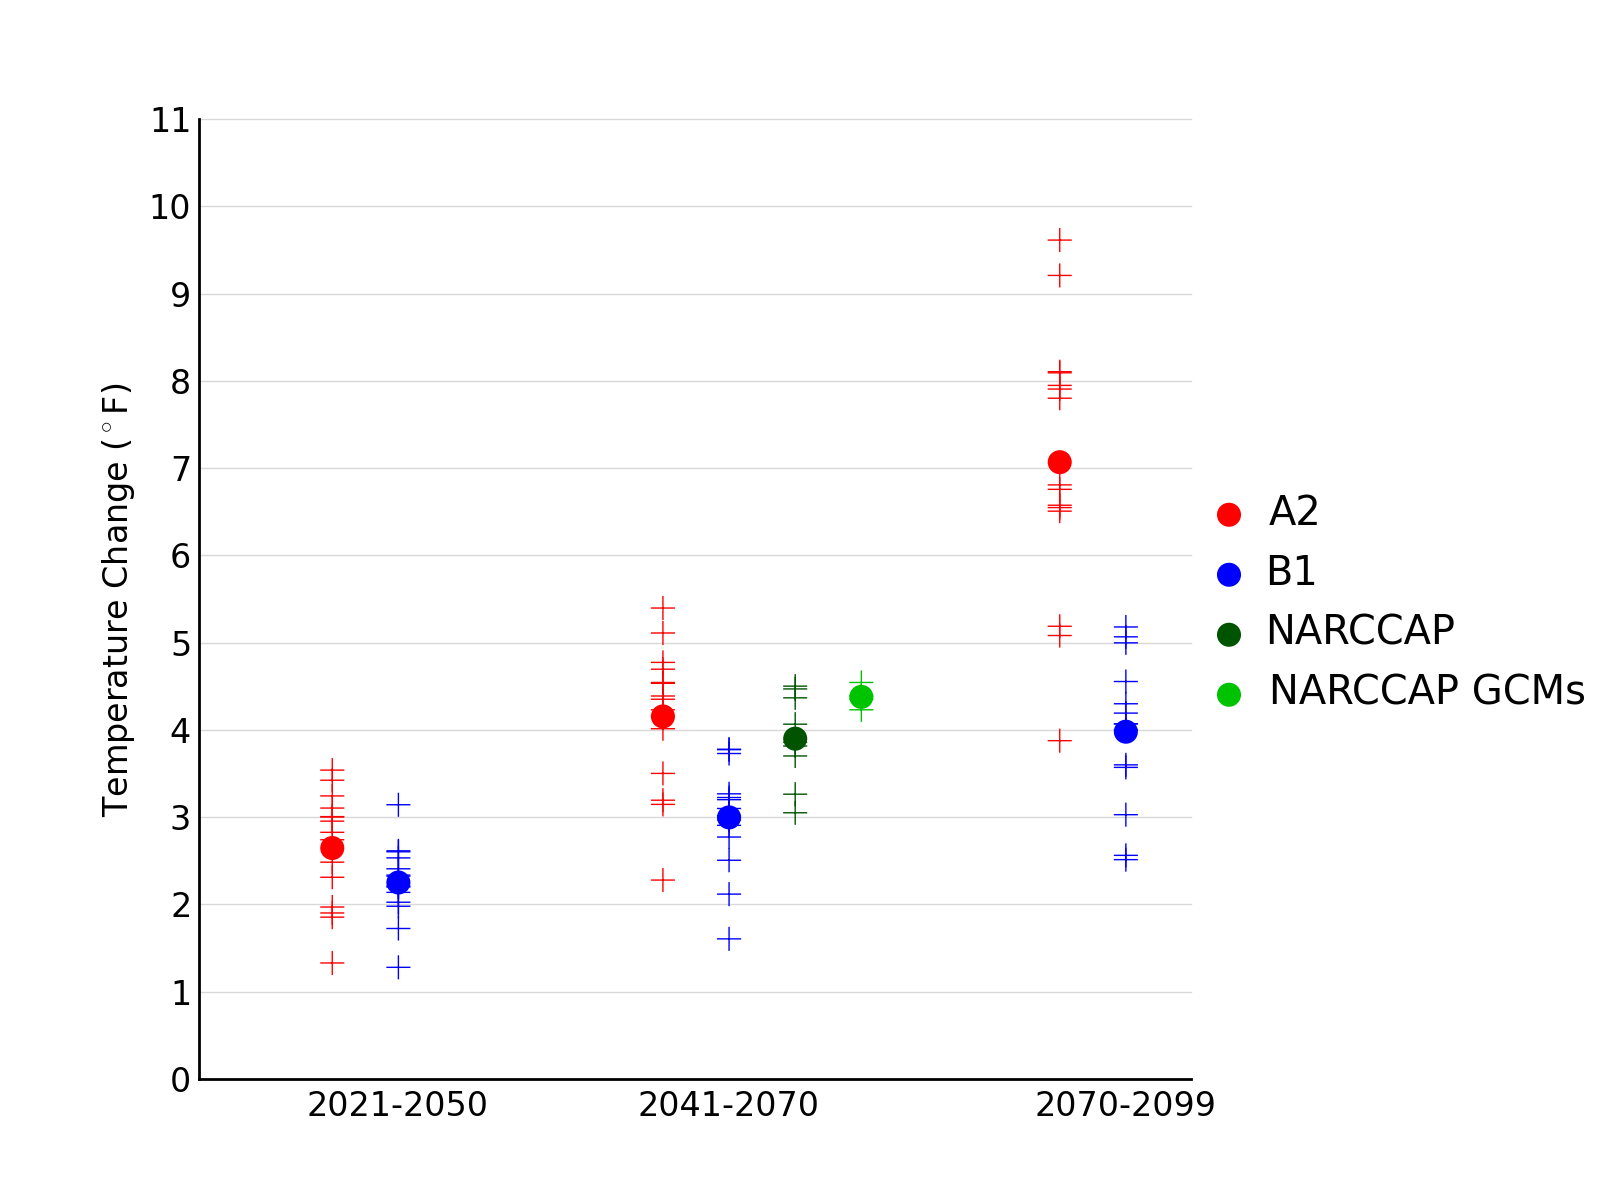
Simulated annual mean change in select temperature variables |
NCA 3 |
 |
|
Observed decadal mean seasonal precipitation change |
NCA 3 |
 |
|
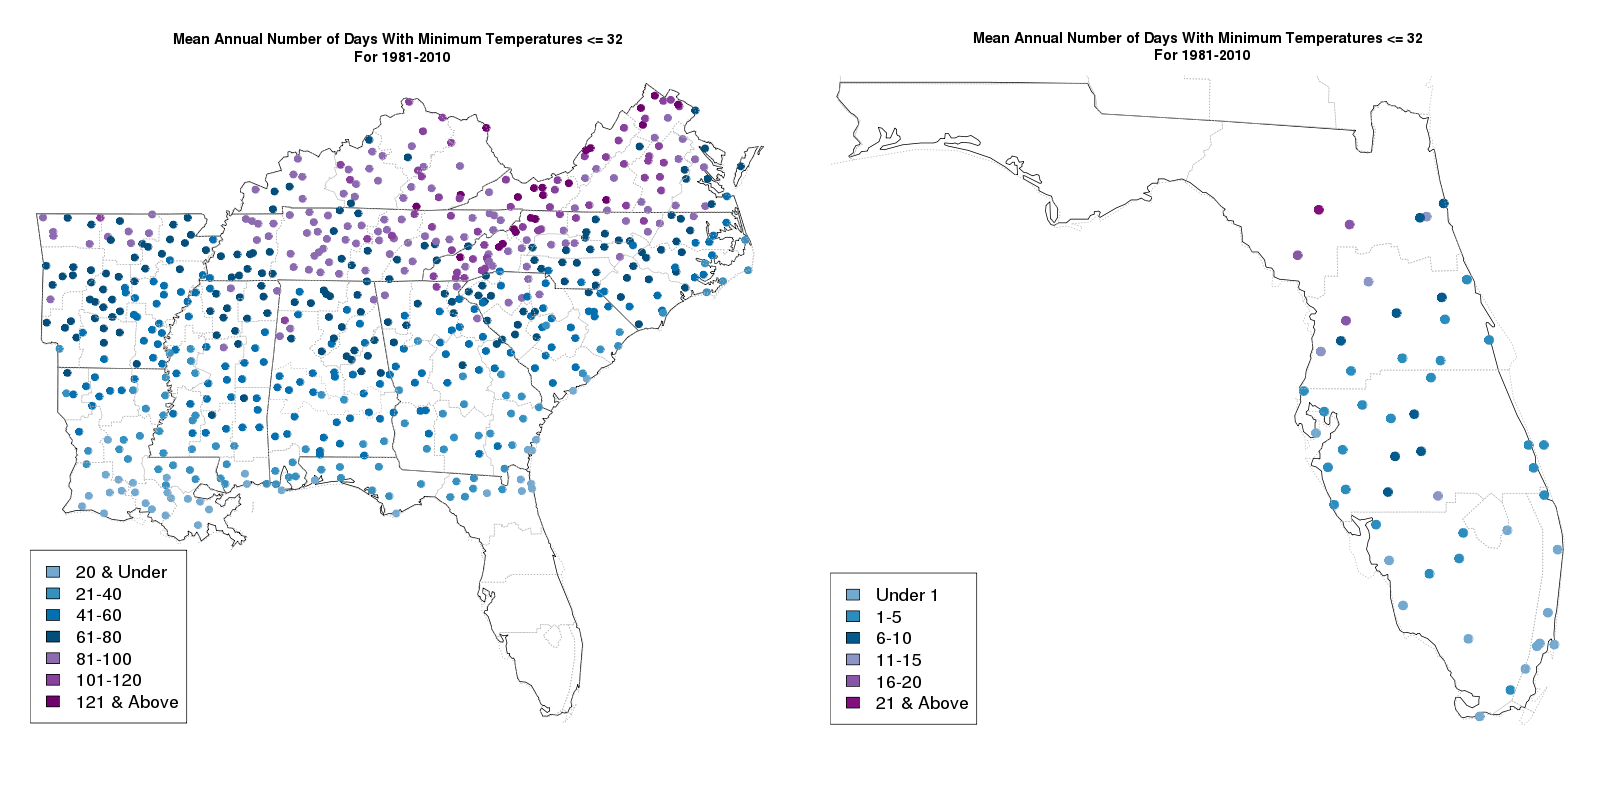
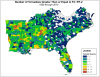
Mean annual number of days with a minimum temperature <= 32F |
NCA 3 |
 |
|
Simulated difference in mean annual temperature |
NCA 3 |
 |
|
Simulated difference in annual and seasonal mean precipitation |
NCA 3 |
 |
|
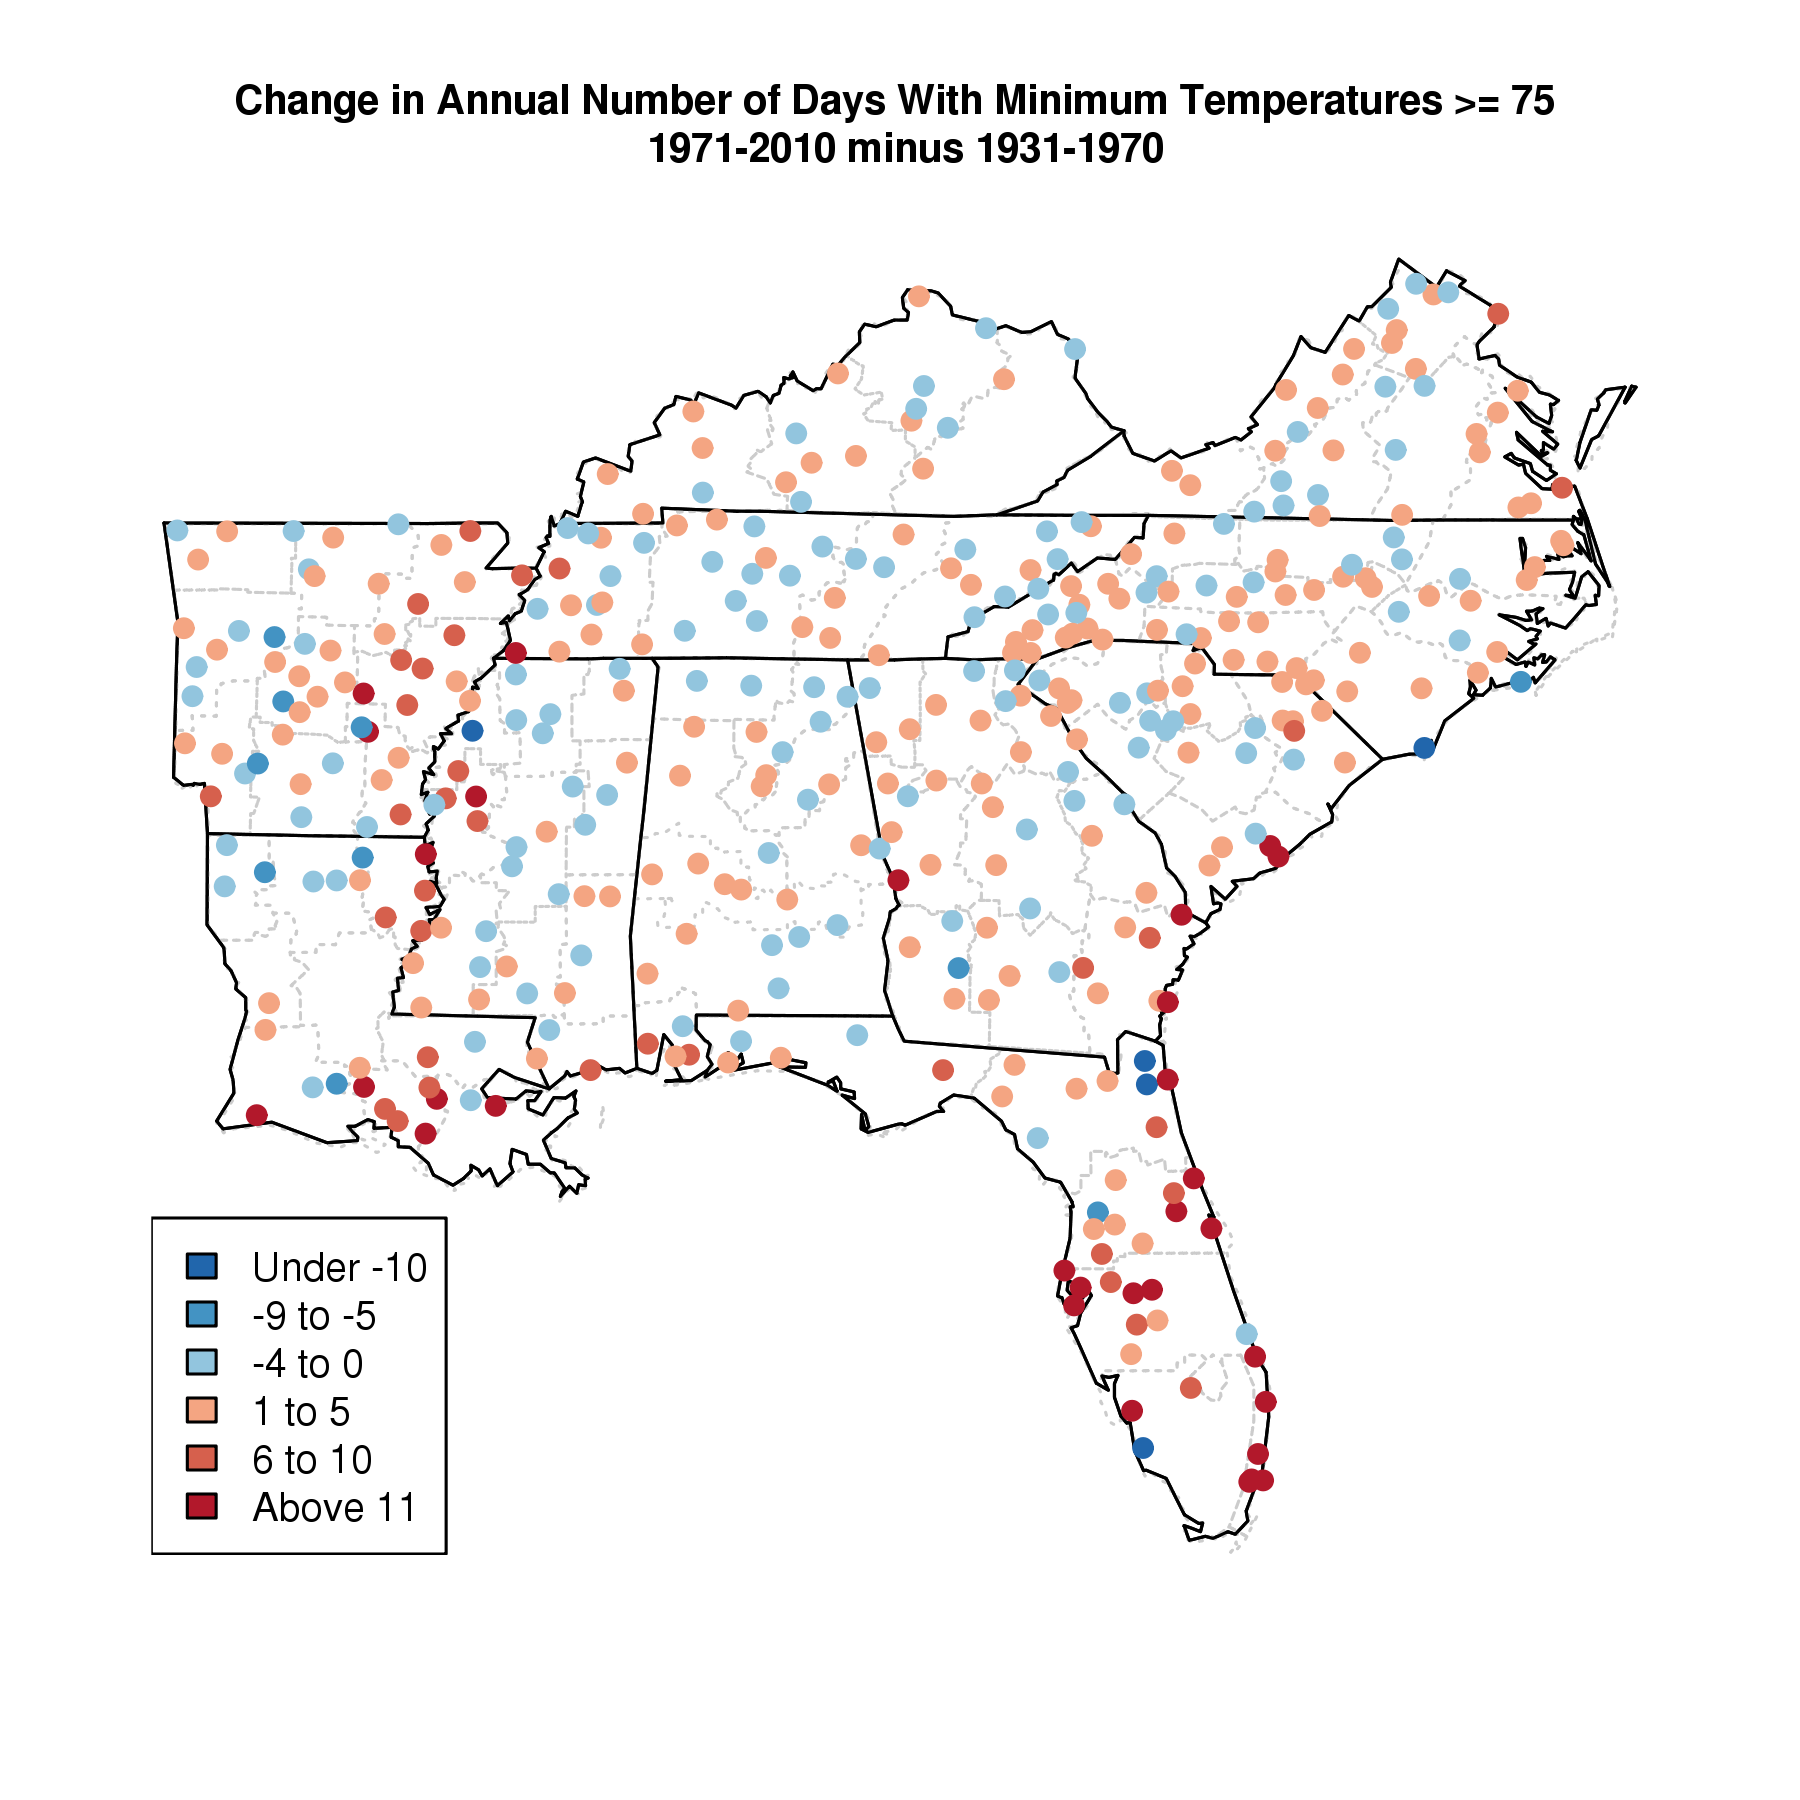
Difference in cumulative number of days with a minimum temperature >=75F |
NCA 3 |
 |
|
Simulated difference in the mean annual number of days with a minimum temperature less than 32F |
NCA 3 |
 |
|
Observed decadal mean seasonal temperature change |
NCA 3 |
 |
|
Time series of freeze-free season anomalies |
NCA 3 |
 |
|
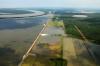
Morganza Floodway opened in Louisiana |
NCA 3 |
 |
|
Difference in cumulative number of days with precipitation >= 4 inches |
NCA 3 |
 |
|
Simulated difference in mean annual precipitation |
NCA 3 |
 |
|
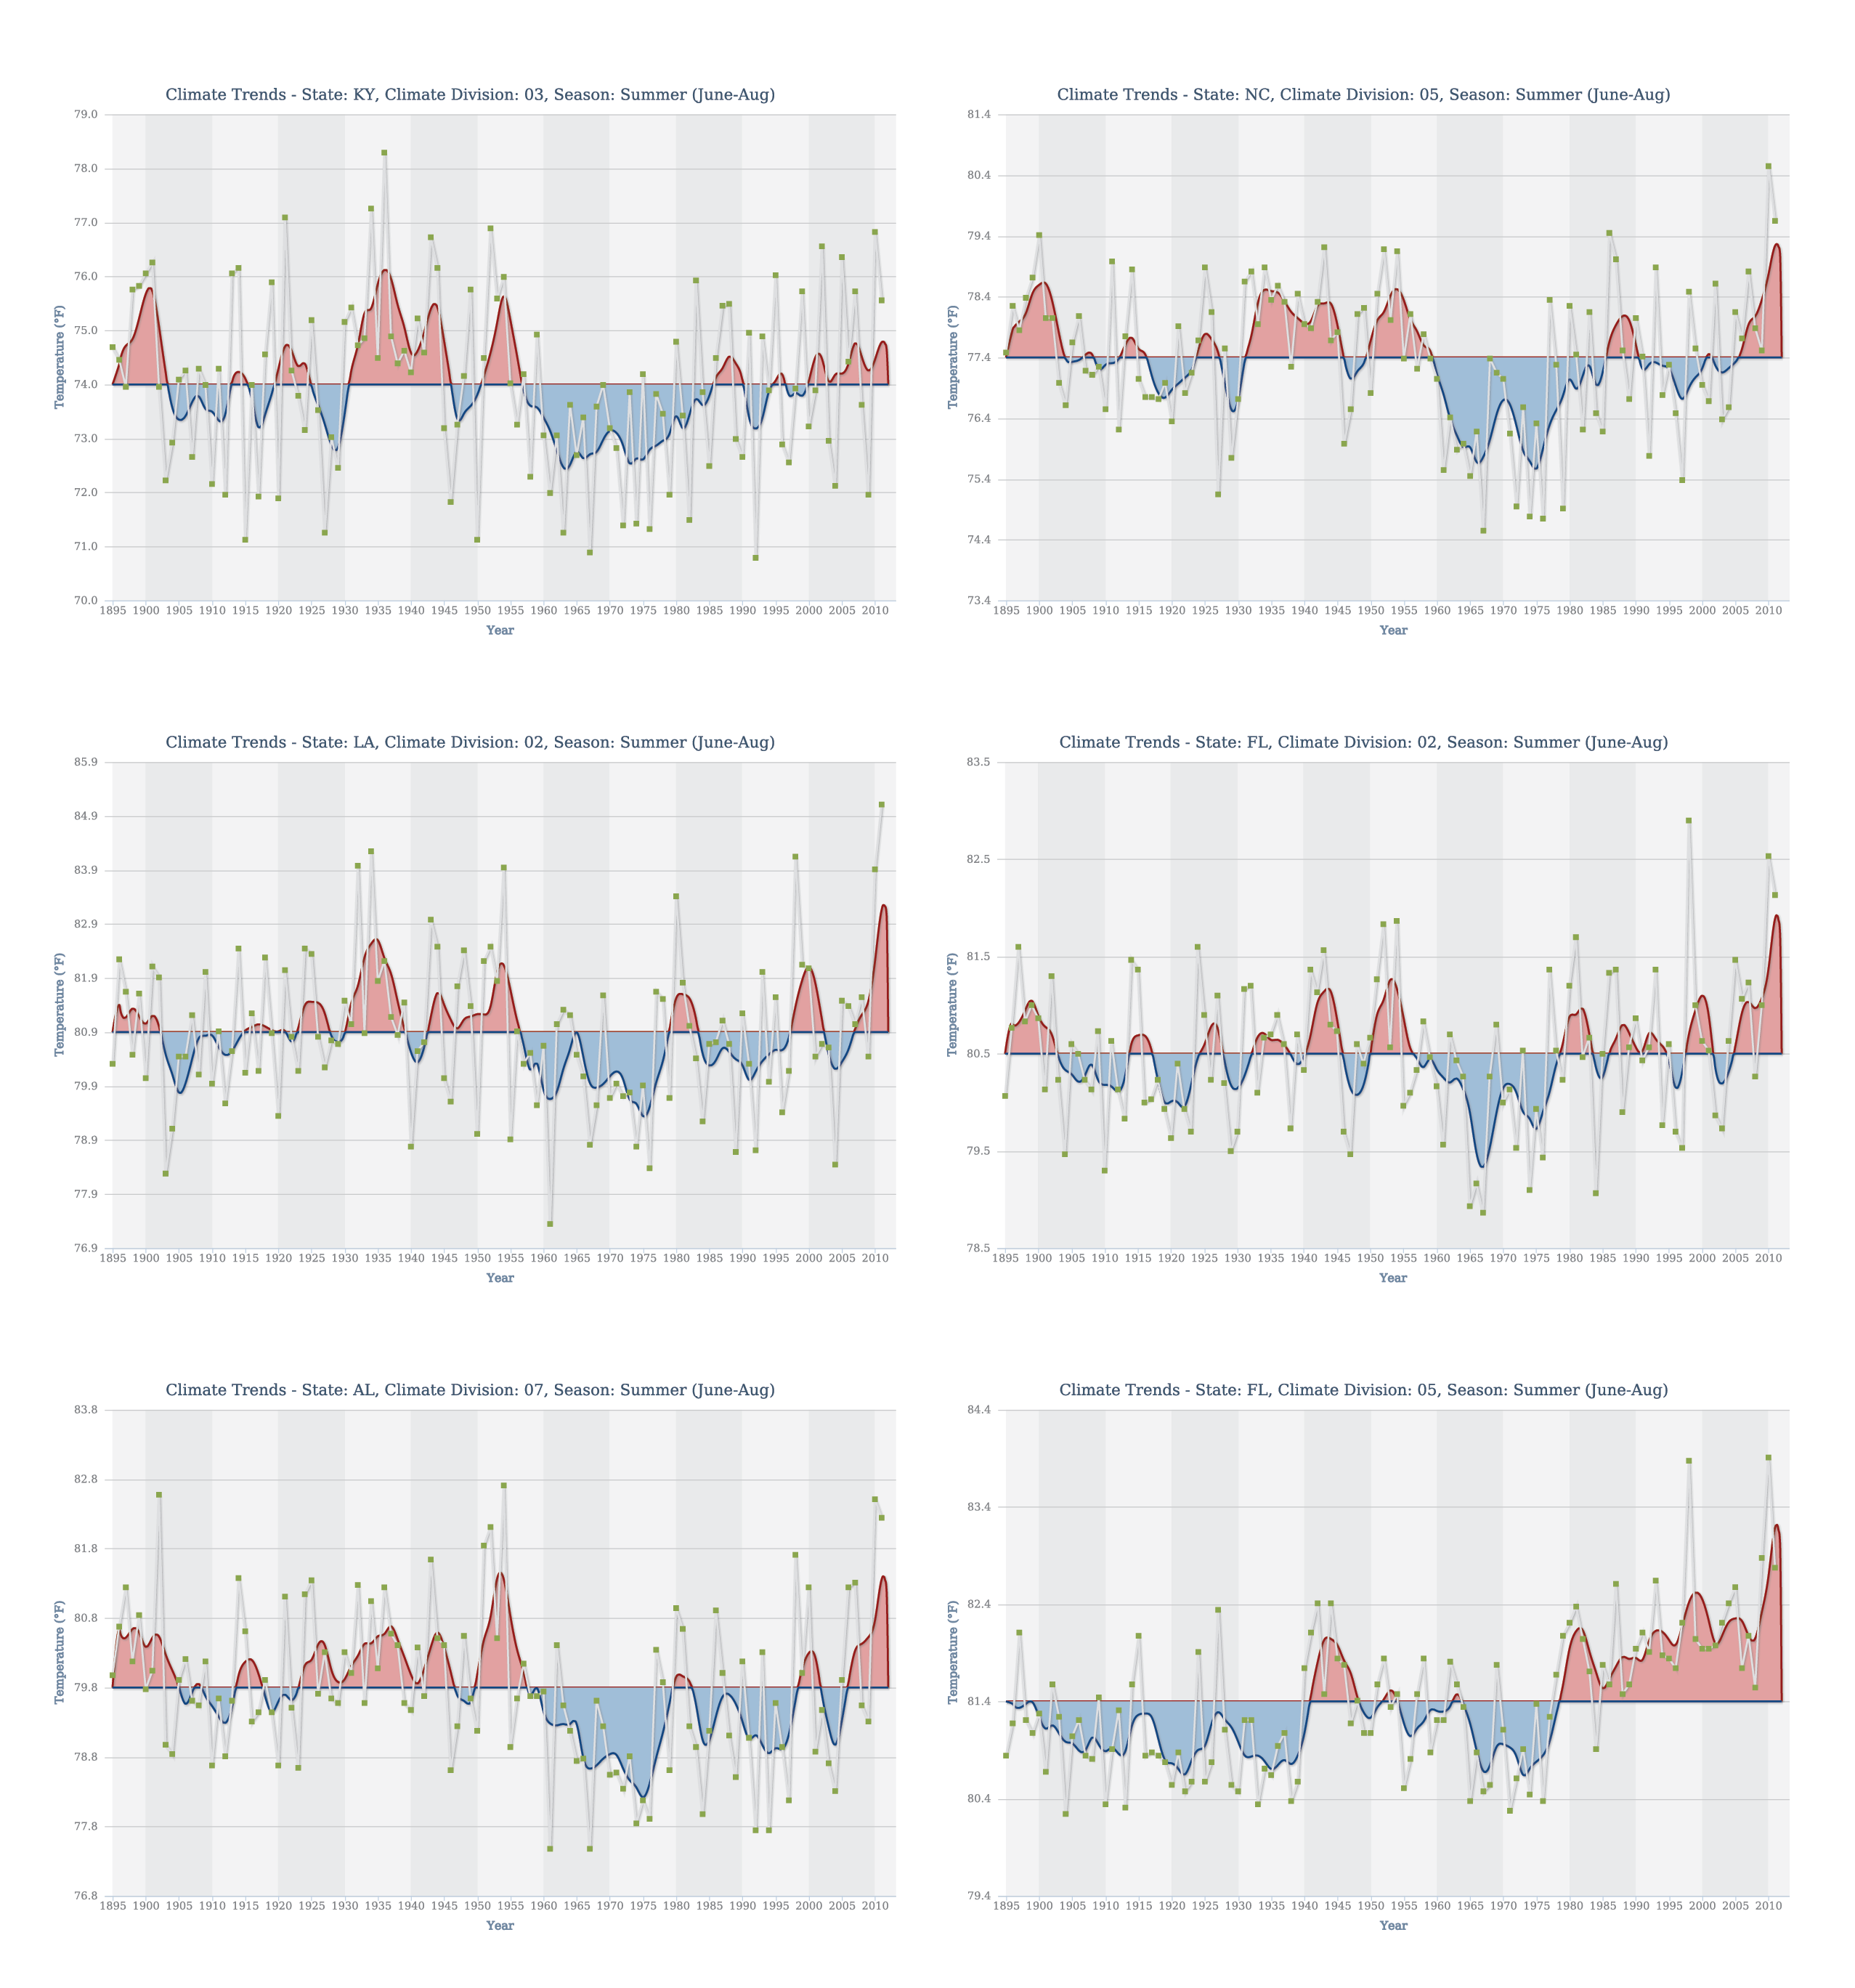
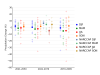
Summer temperature trends at six climate divisions in the Southeast region |
NCA 3 |
 |
|
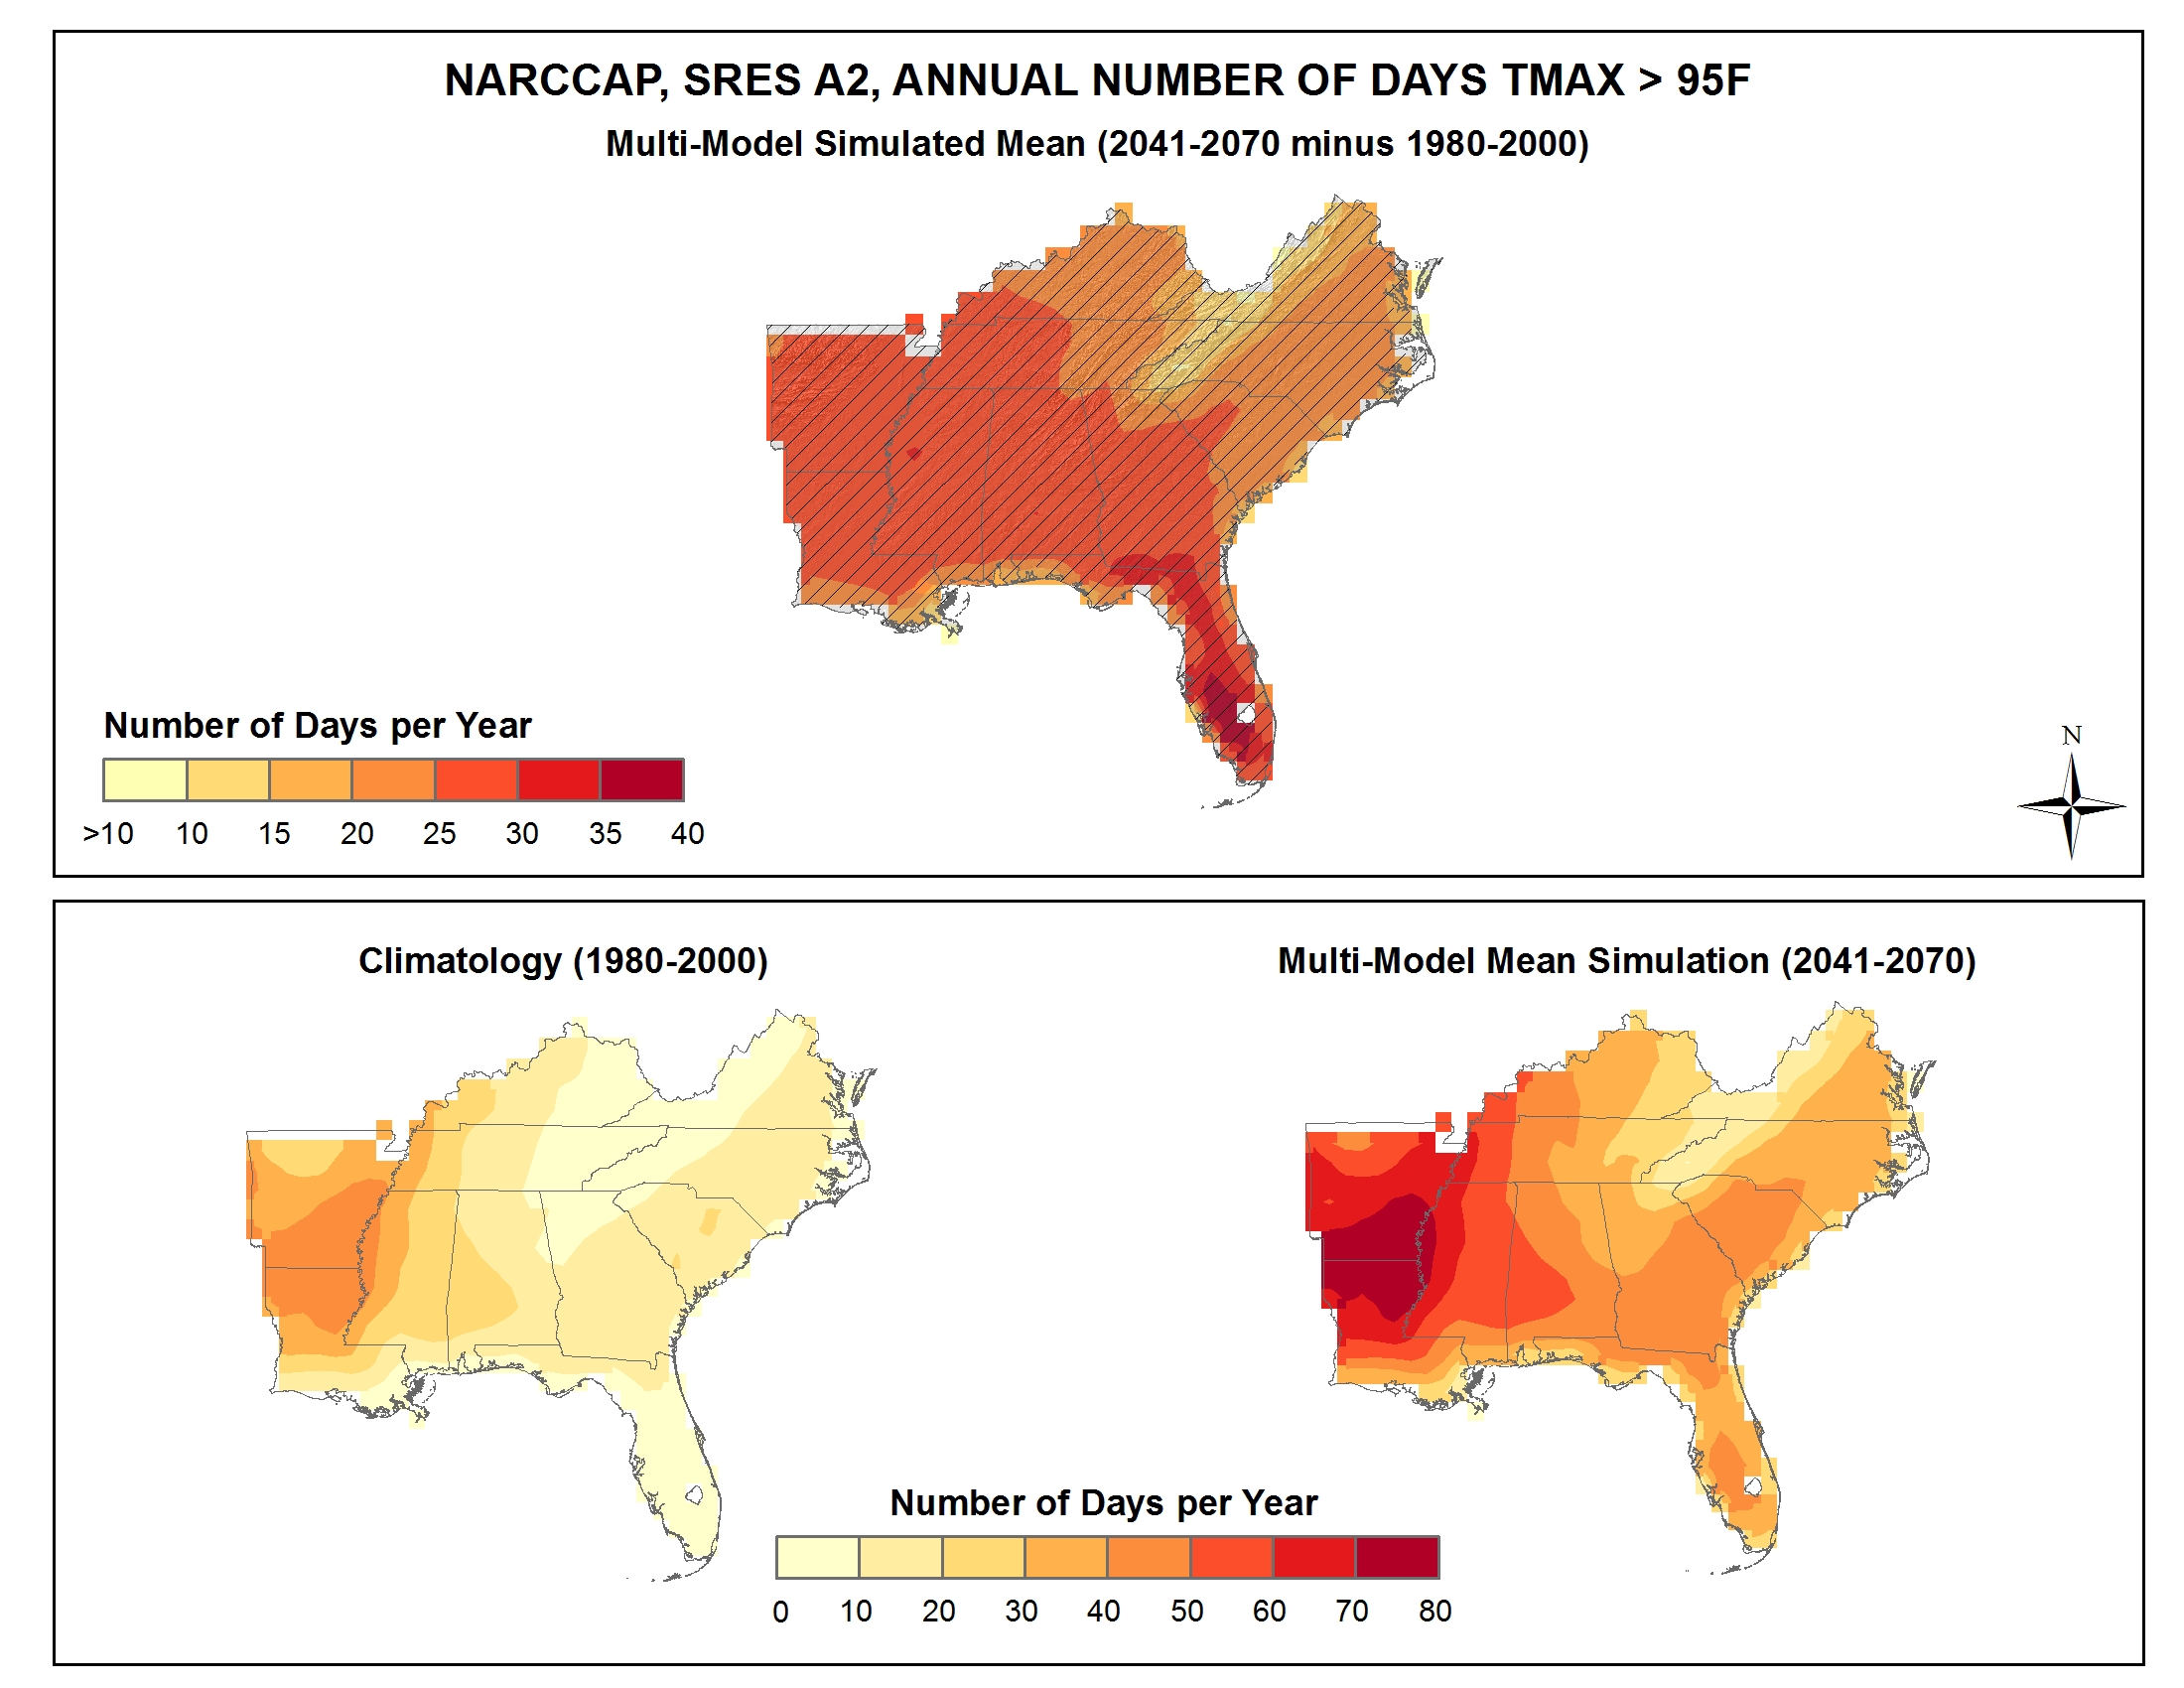
Simulated difference in the mean annual number of days with a maximum temperature greater than 95F |
NCA 3 |
 |
|
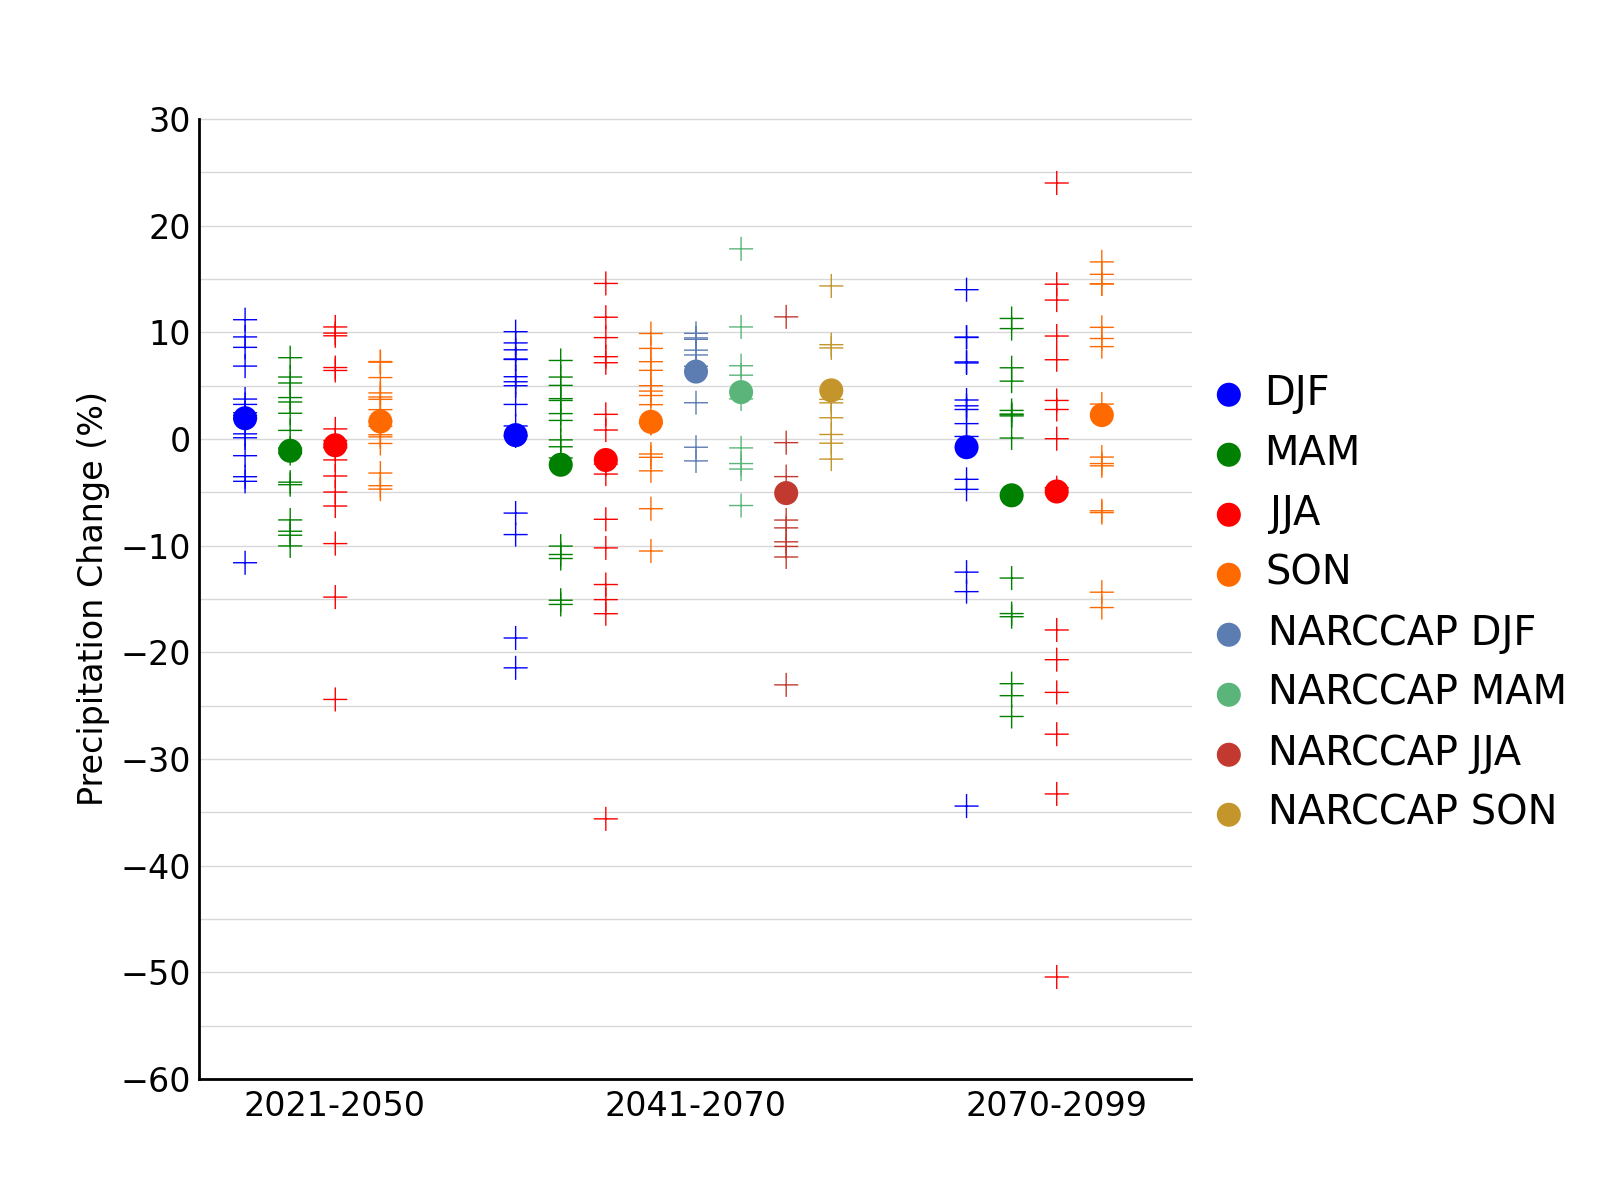
Simulated annual mean change in select precipitation variables |
NCA 3 |
 |
|
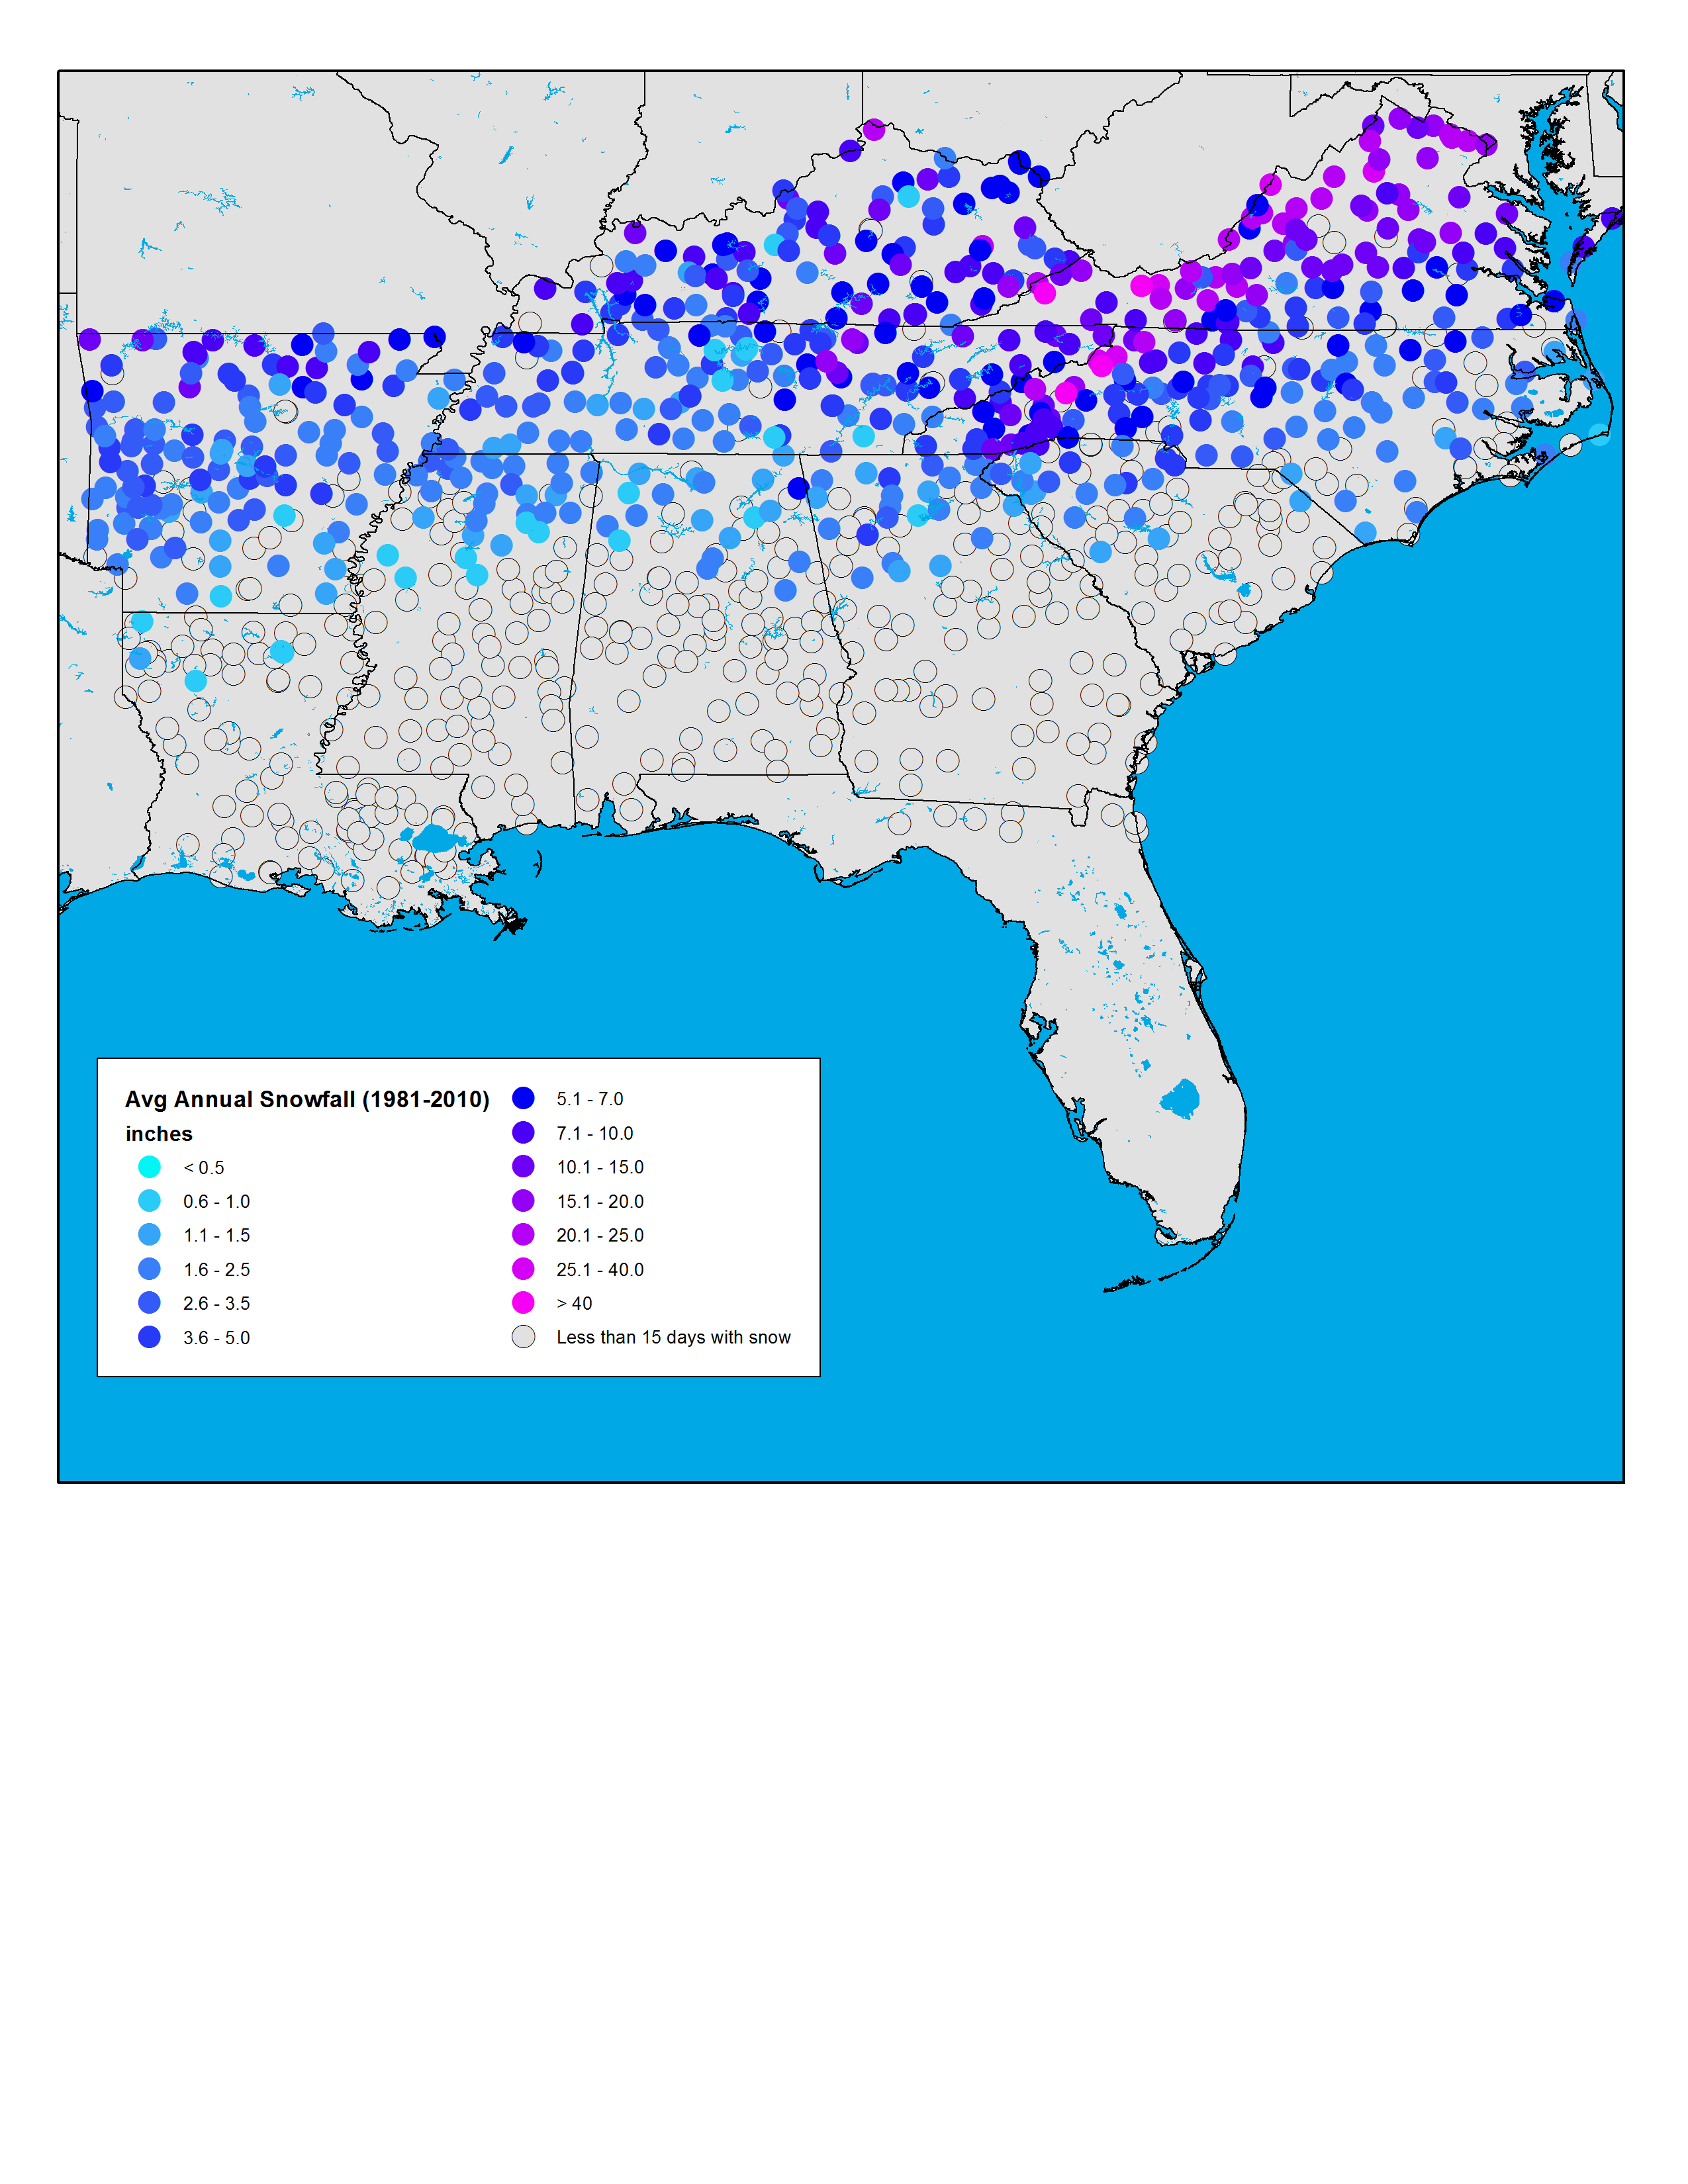
Annual average snowfall |
NCA 3 |
 |
|
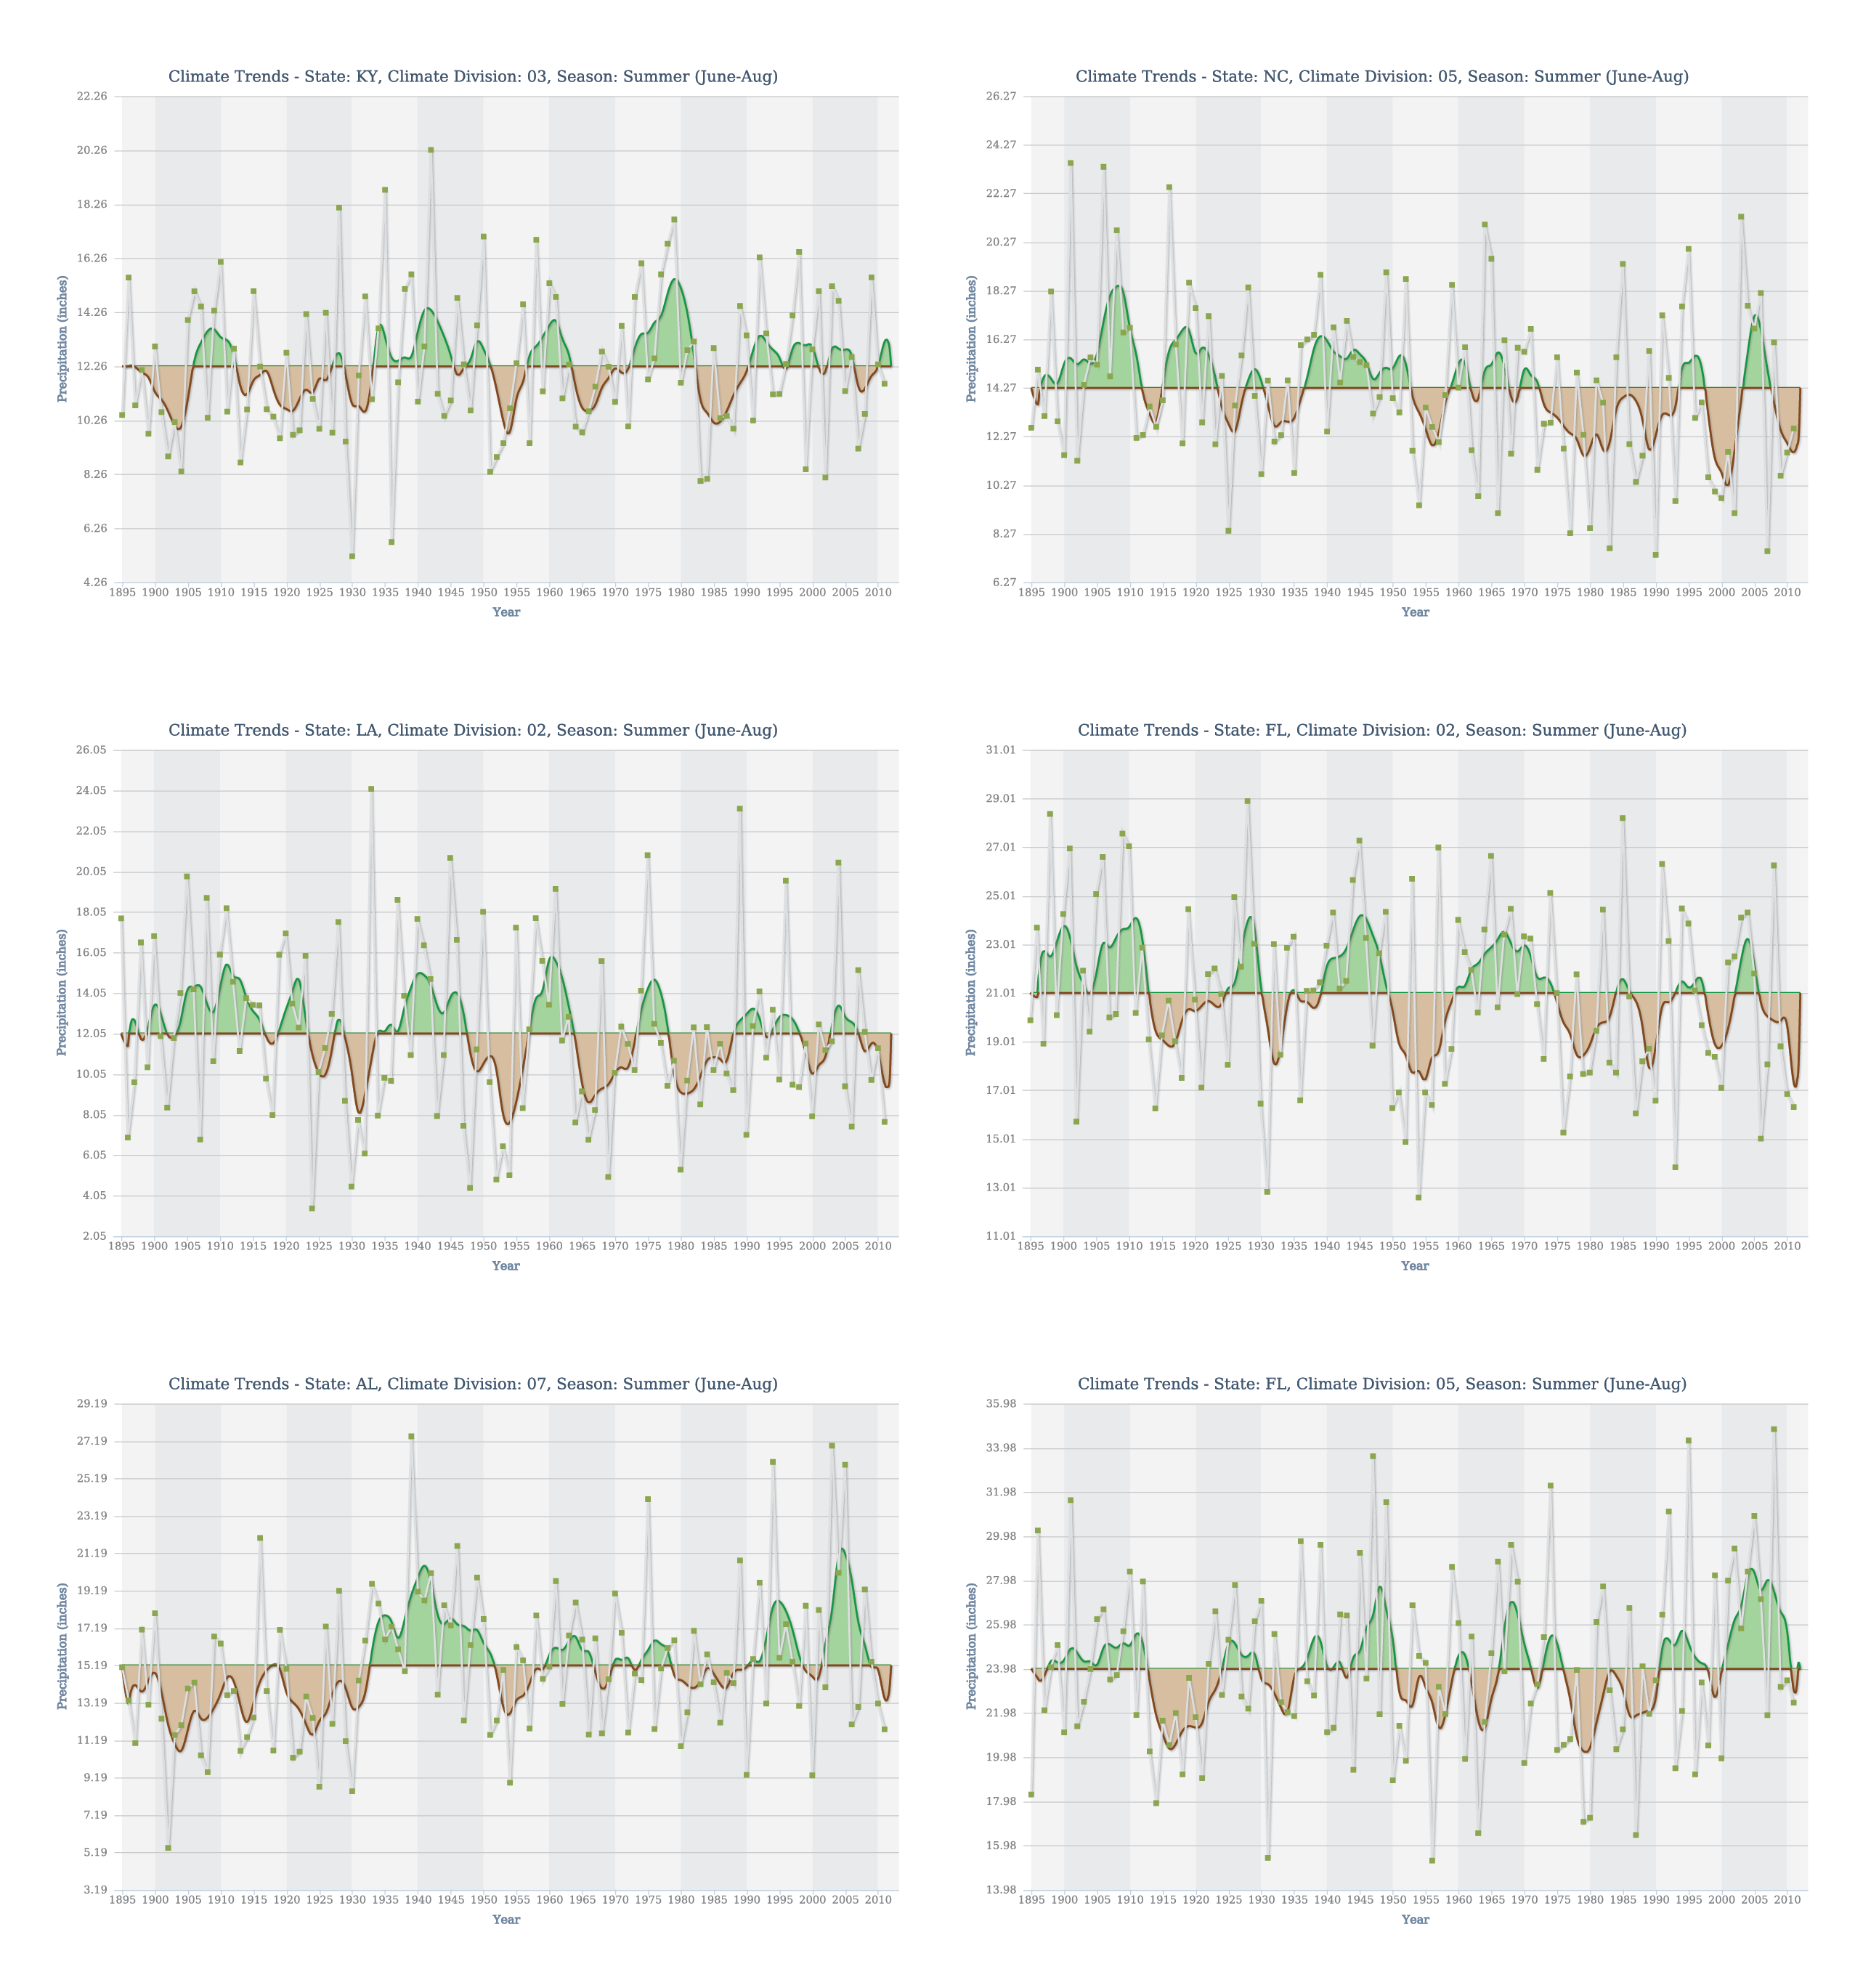
Summer precipitation trends at six climate divisions in the Southeast region. |
NCA 3 |
 |
|
Simulated difference in the mean annual number of heating degree days |
NCA 3 |
 |
|
Simulated decadal mean change in annual precipitation |
NCA 3 |
 |
|
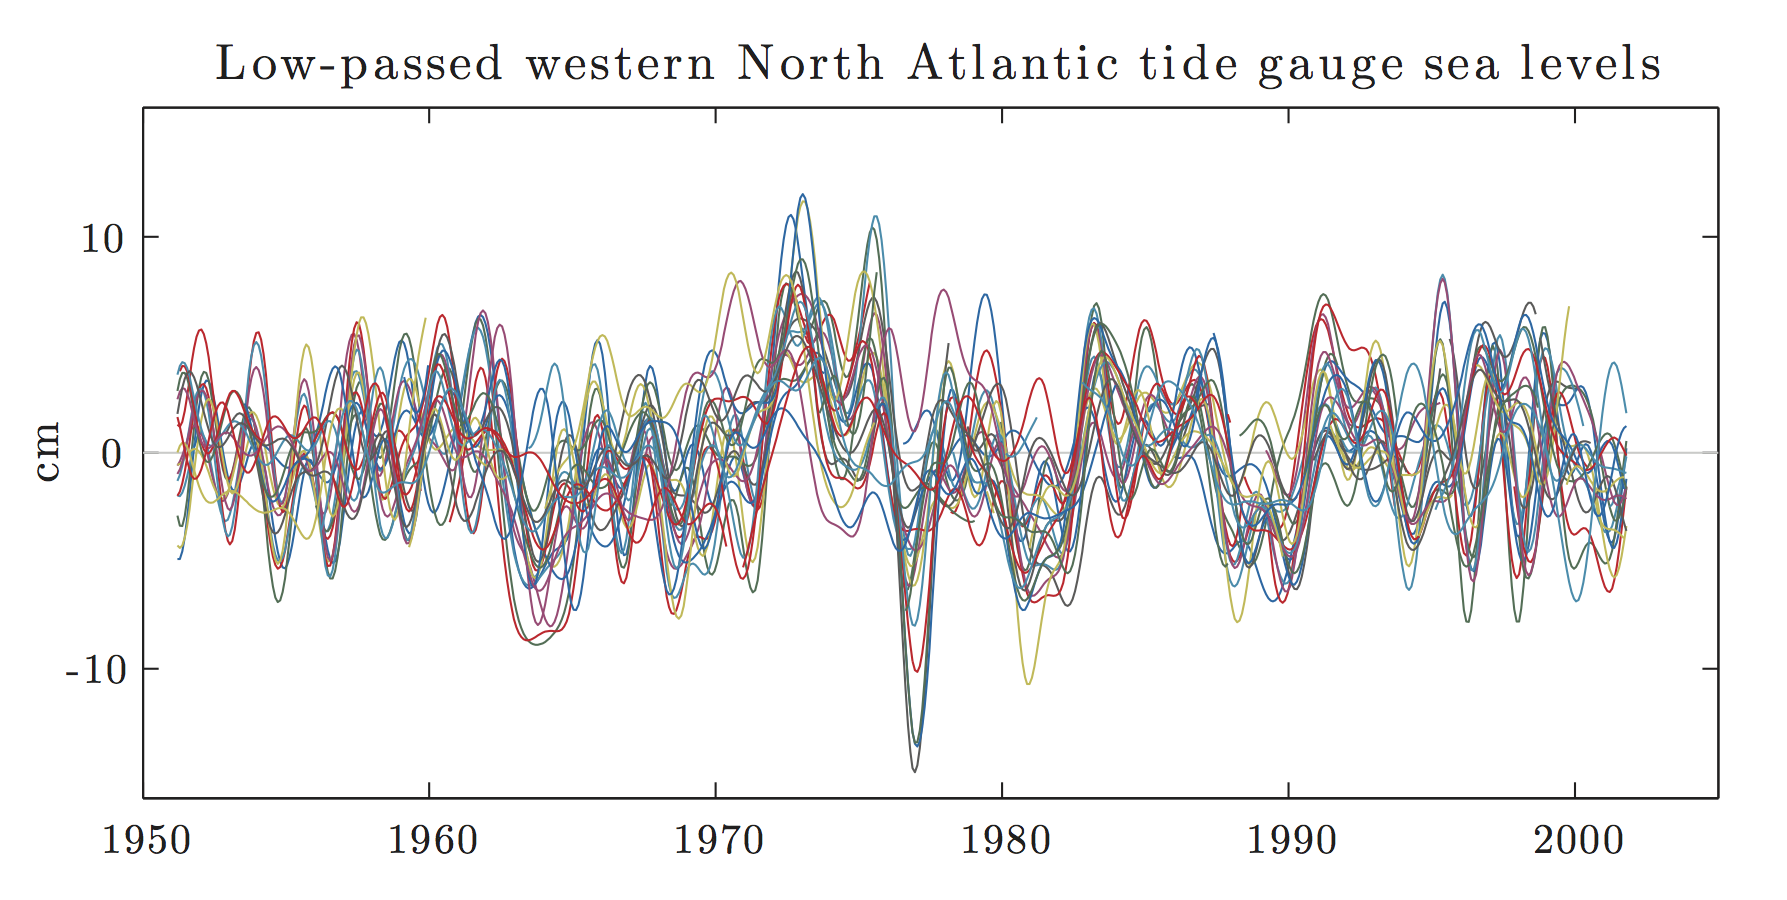
Monthly mean tide gauge sea levels from the Gulf of Mexico (Galveston, TX) to the western North Atlantic (Wilmington, DE) |
NCA 3 |
 |
|
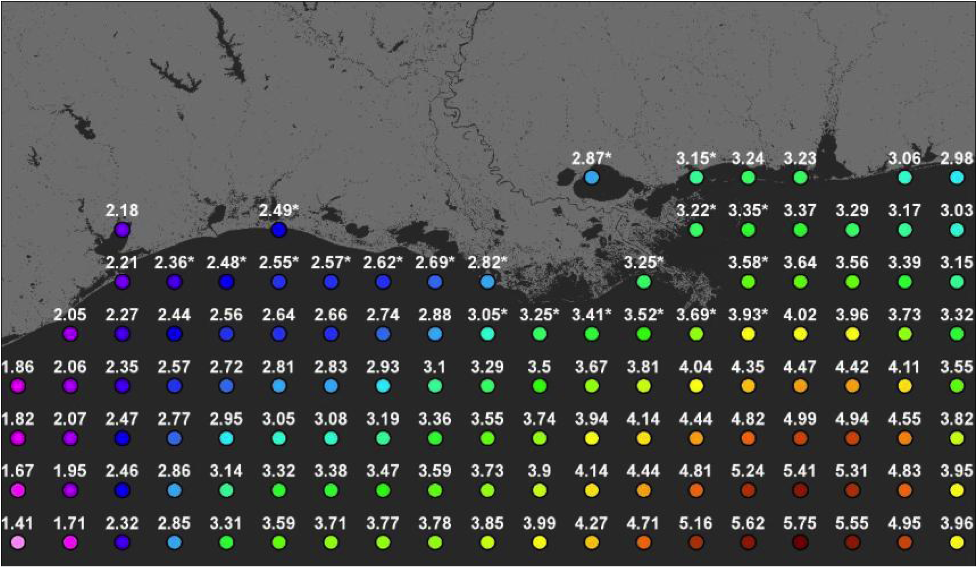
Northcentral Gulf of Mexico satellite altimetry record (1993 to 2011) |
NCA 3 |
 |
|
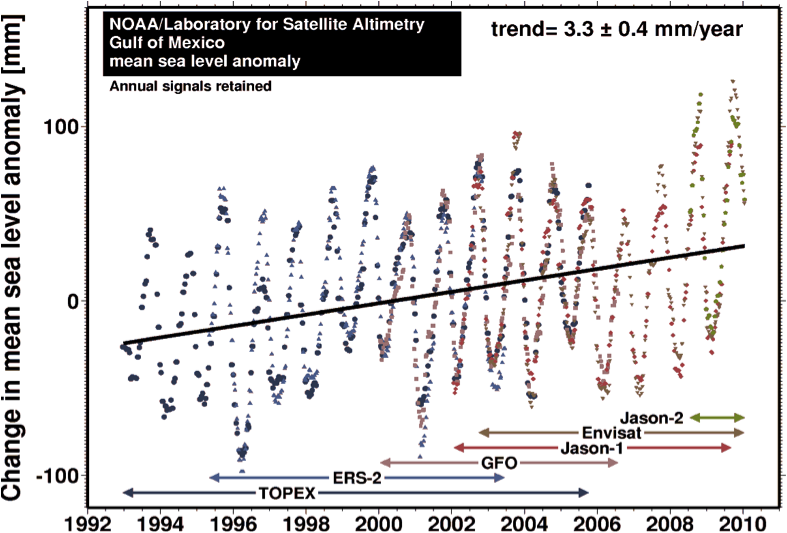
Sea level change in the Gulf of Mexico basin as determined from a combination of six satellite altimetry records (1993 to 2010) |
NCA 3 |
 |