|
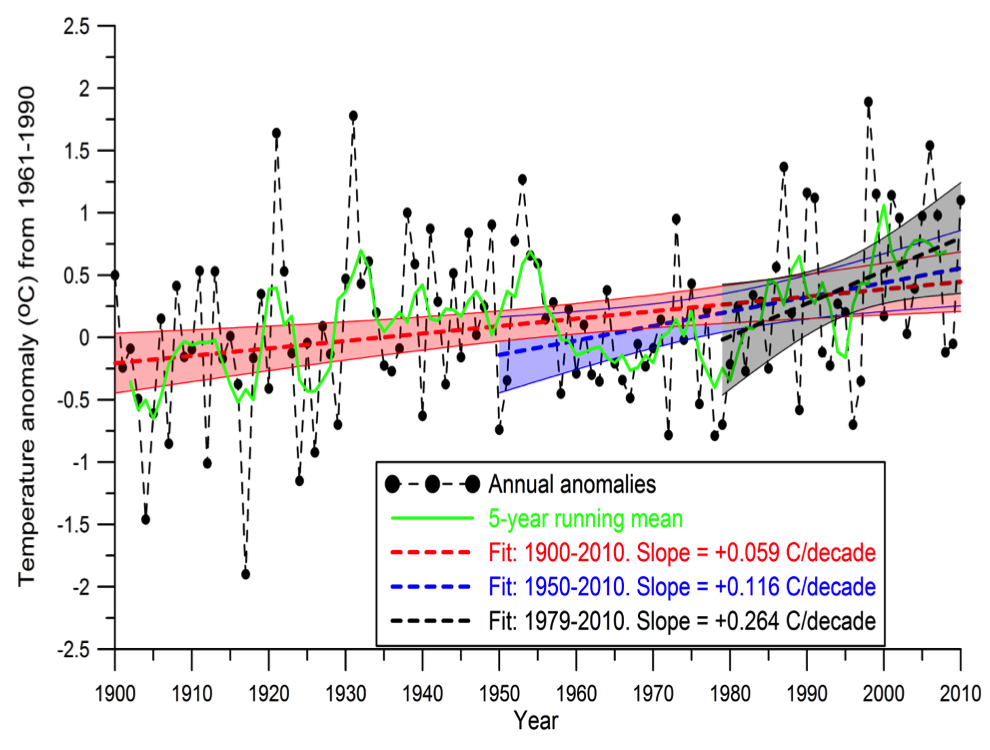
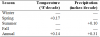
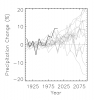
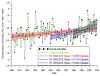
Trends in temperature and precipitation anomaly |
NCA 3 |
 |
|
Simulated difference in annual and seasonal mean temperature |
NCA 3 |
 |
|
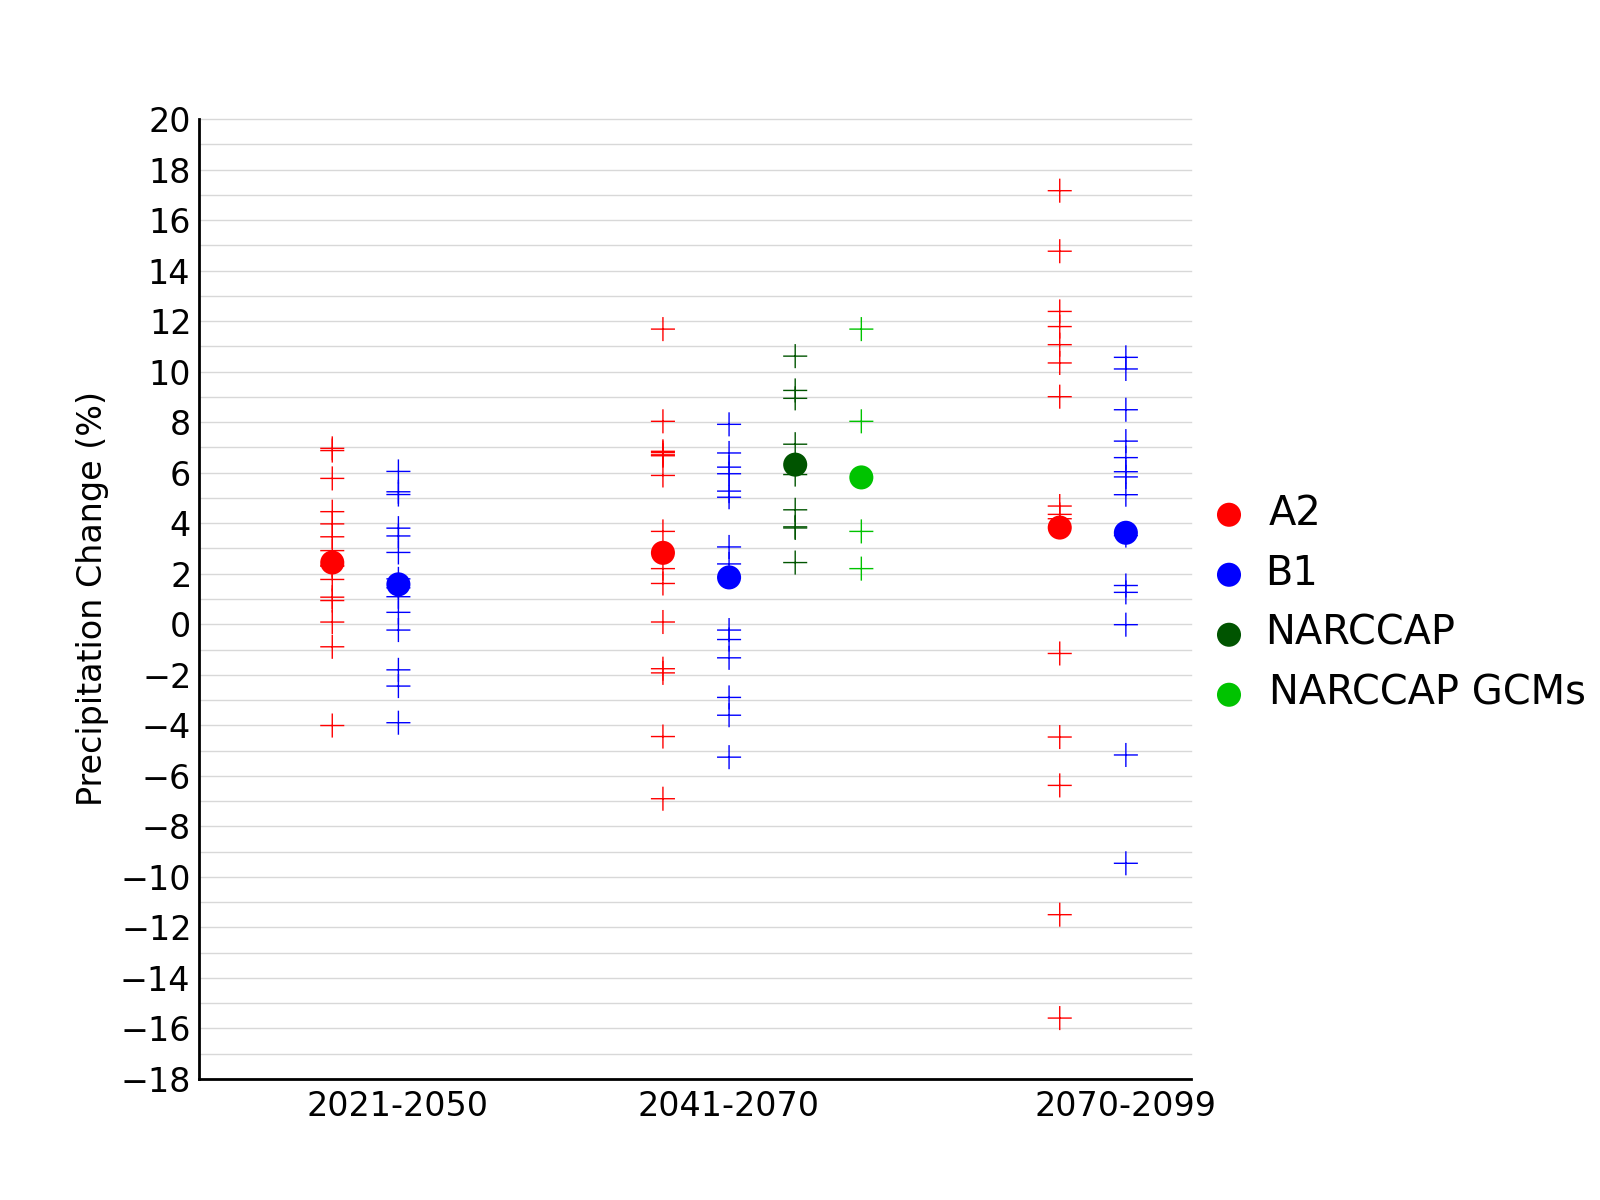
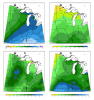
Simulated annual mean precipitation change |
NCA 3 |
 |
|
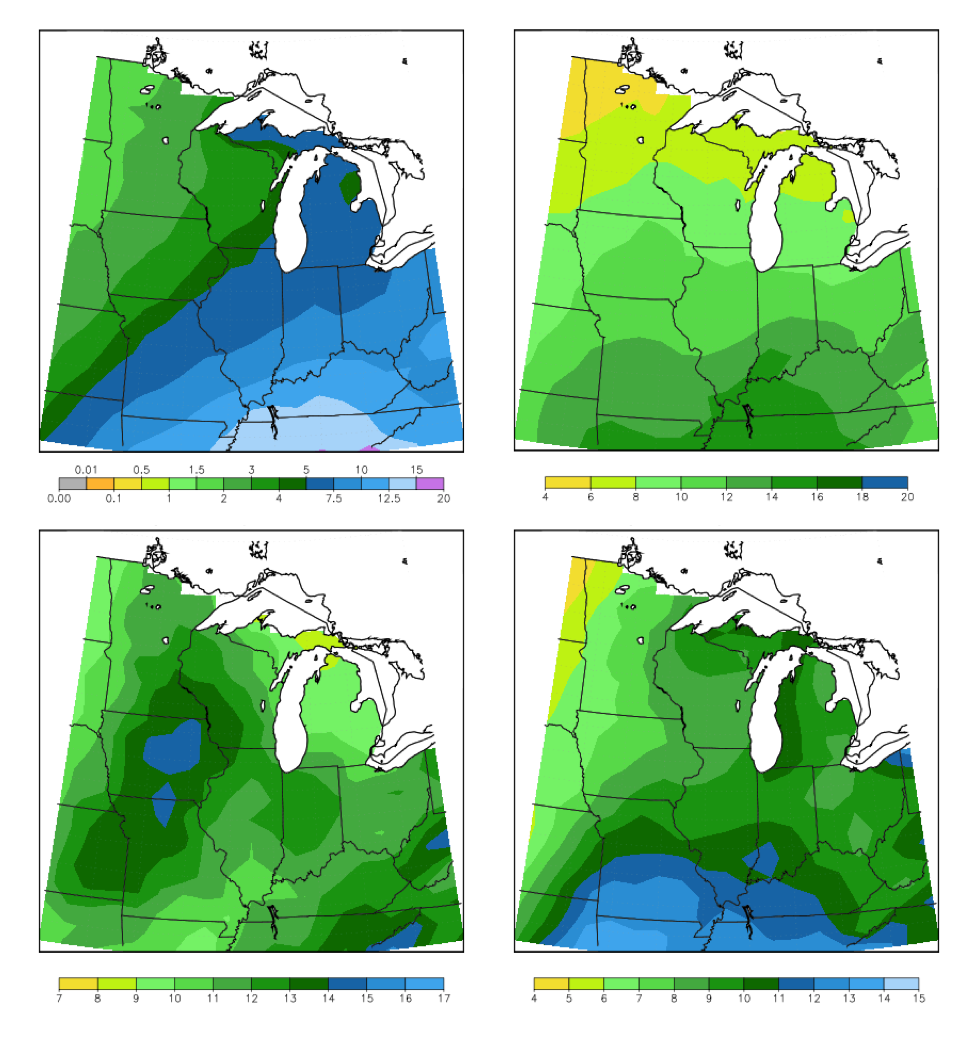
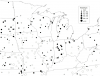
Snowfall trends for the Midwest region |
NCA 3 |
 |
|
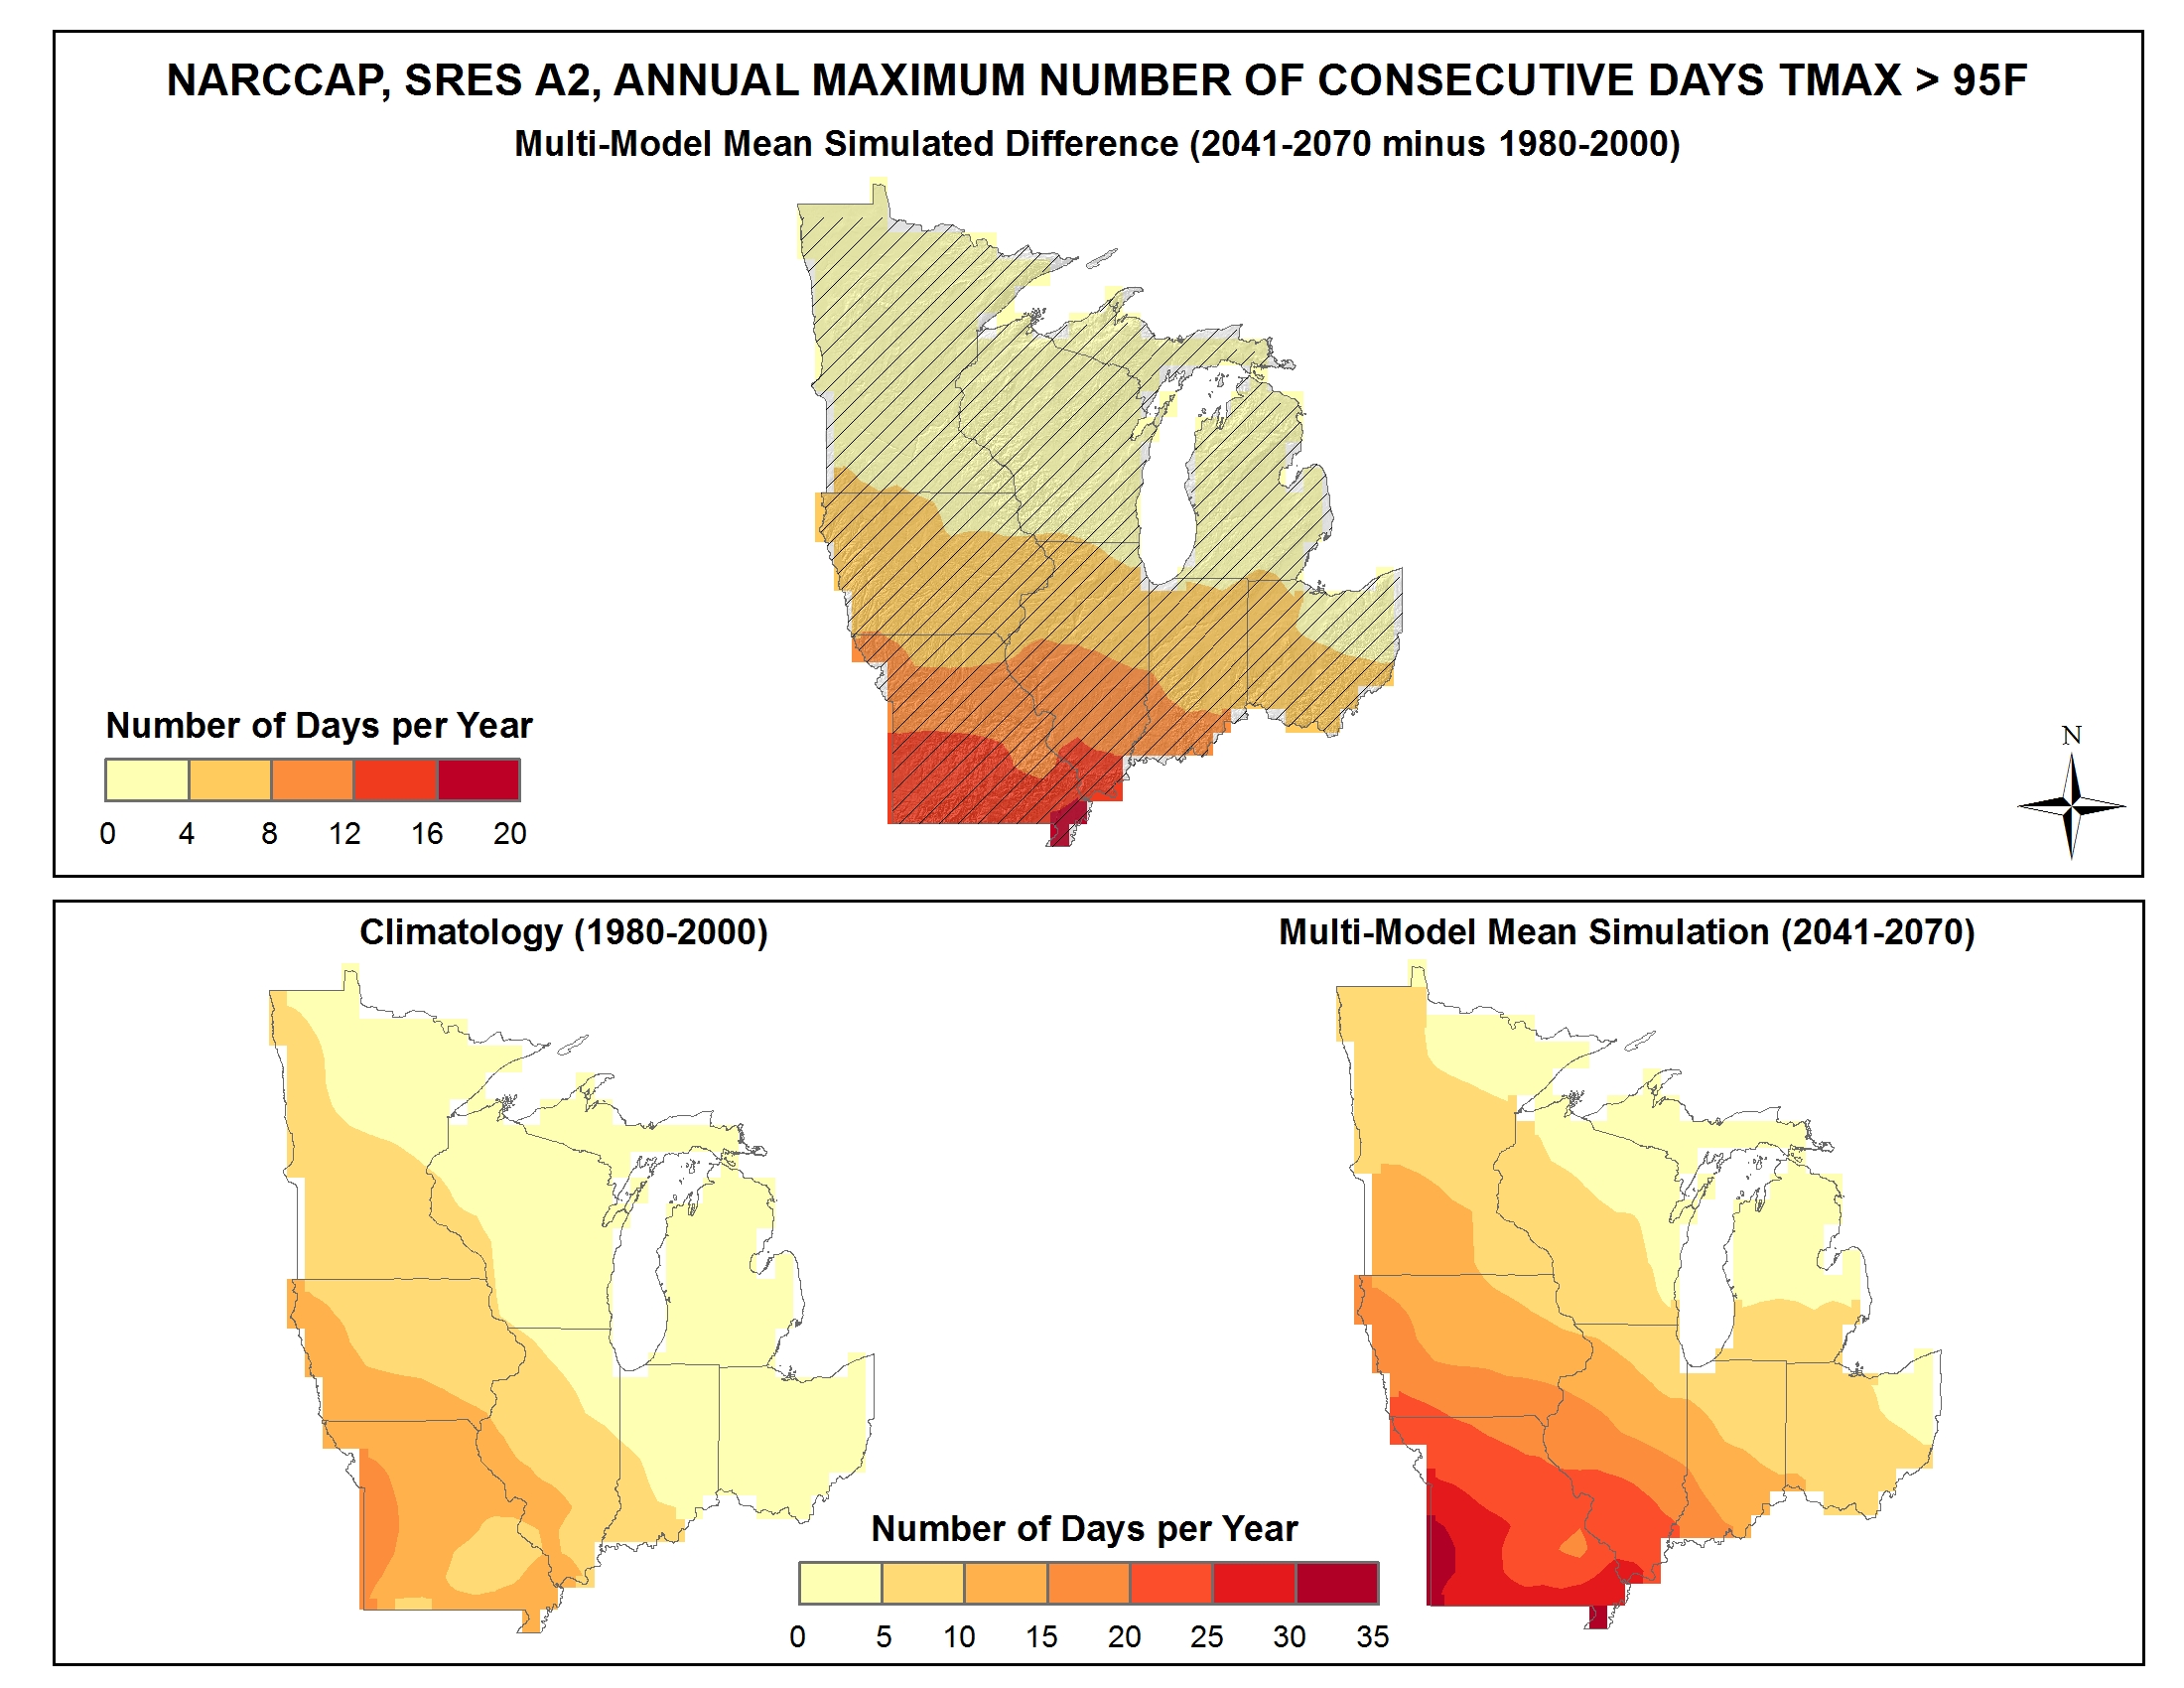
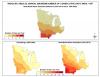
Simulated difference in the mean annual maximum number of consecutive days with a maximum temperature greater than 95F |
NCA 3 |
 |
|
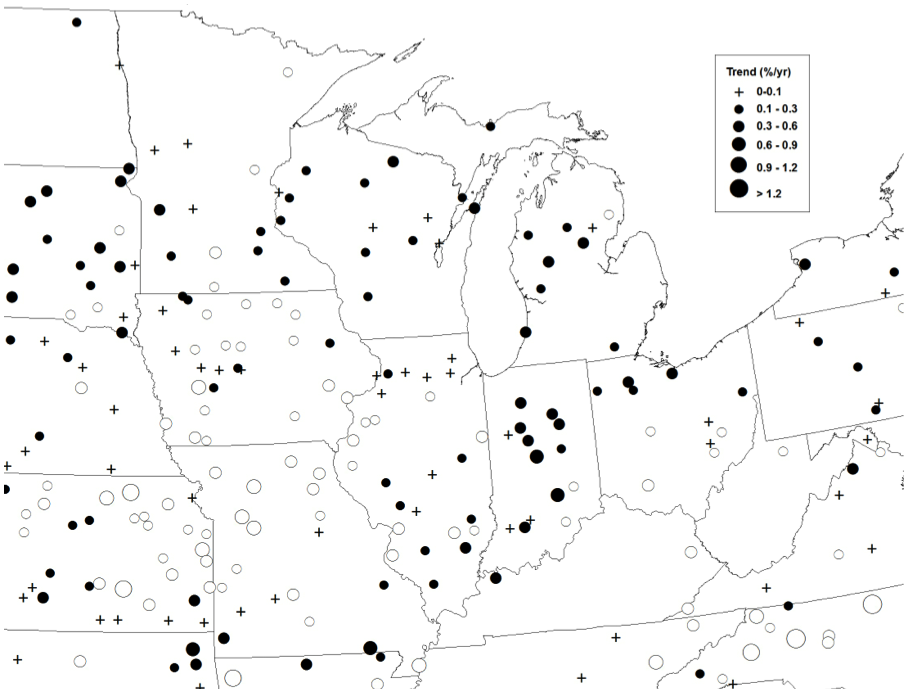
Observed decadal mean annual precipitation change |
NCA 3 |
 |
|
Average seasonal accumulated precipitation for the Midwest region |
NCA 3 |
 |
|
Annual temperature anomalies for the Midwest region |
NCA 3 |
 |
|
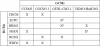
NARCCAP Models Listing |
NCA 3 |
 |
|
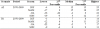
Distribution of the simulated change in seasonal mean precipitation |
NCA 3 |
 |