General Information
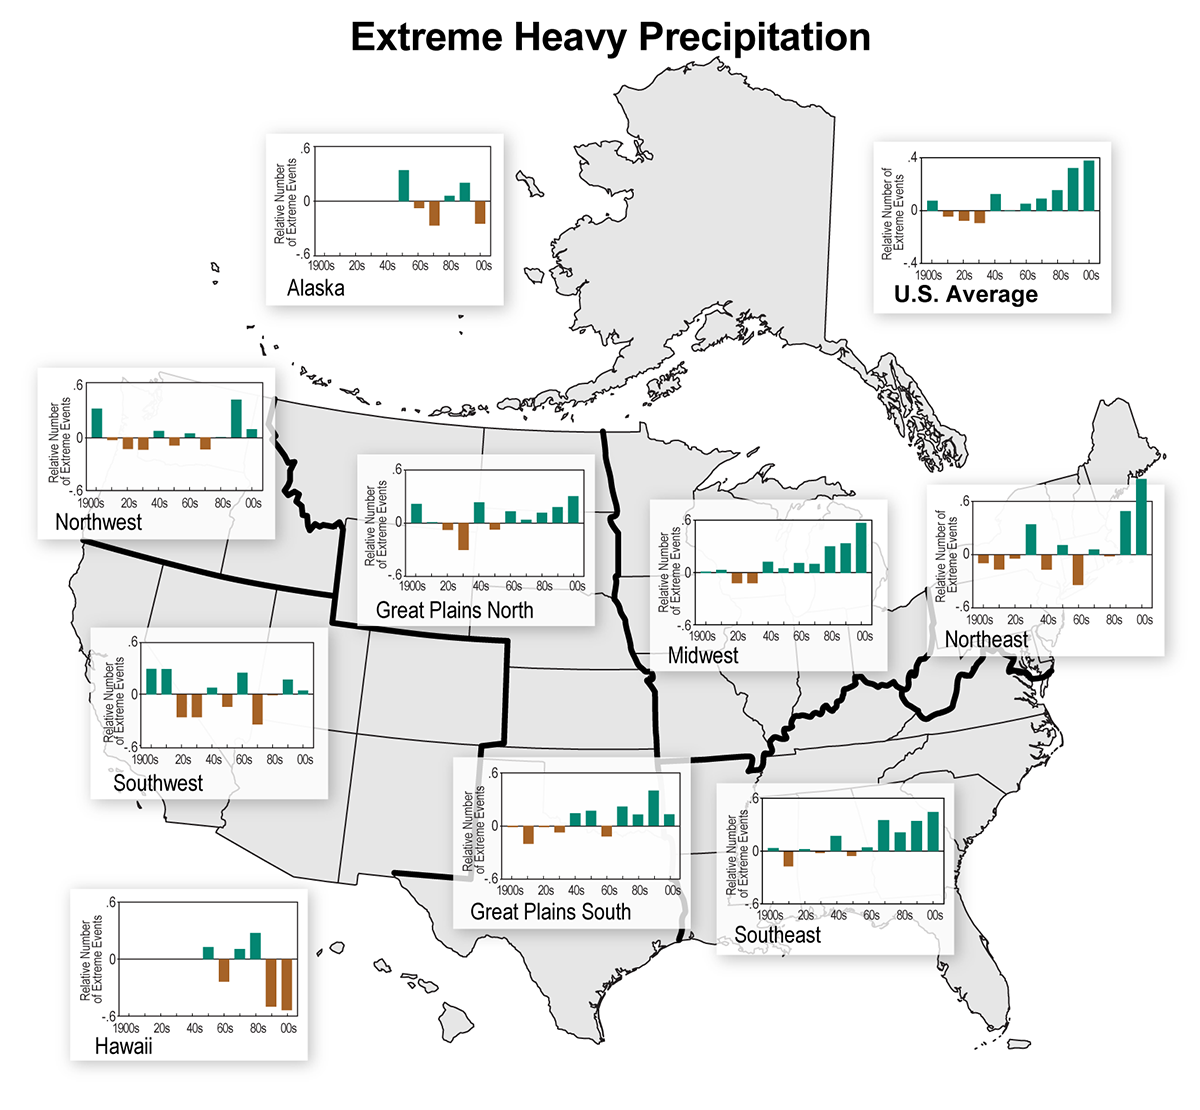
Time series (1901-2011) of decadal values of an index (standardized to 1) of the number of 2-day precipitation totals exceeding a threshold for a 1 in 5-year occurrence for 7 regions and the U.S. as a whole, expressed as the deviation from the long-term average. This was based on daily COOP data from long-term stations in the National Climatic Data Centers Global Historical Climate Network data set. Only stations with less than 10% missing daily temperature data are used in this analysis. Events are first identified for each individual station by ranking all daily precipitation values and choosing the top N/5 events, where N is the number of years of data for that particular station. Then, event numbers for each year are averaged for all stations in each 1x1 grid box. Next, a regional average is determined by averaging the values for the individual grid boxes. Finally, the results were averaged over decadal periods. The far right bar in each graph represents the 11-year period of 2001-2011.
Data Type:
Observed
Variable Type:
Precipitation
Region:
Source Information
Data Source(s):
Image Source:
Ken Kunkel
Metadata
Metadata File(s):
Files