|
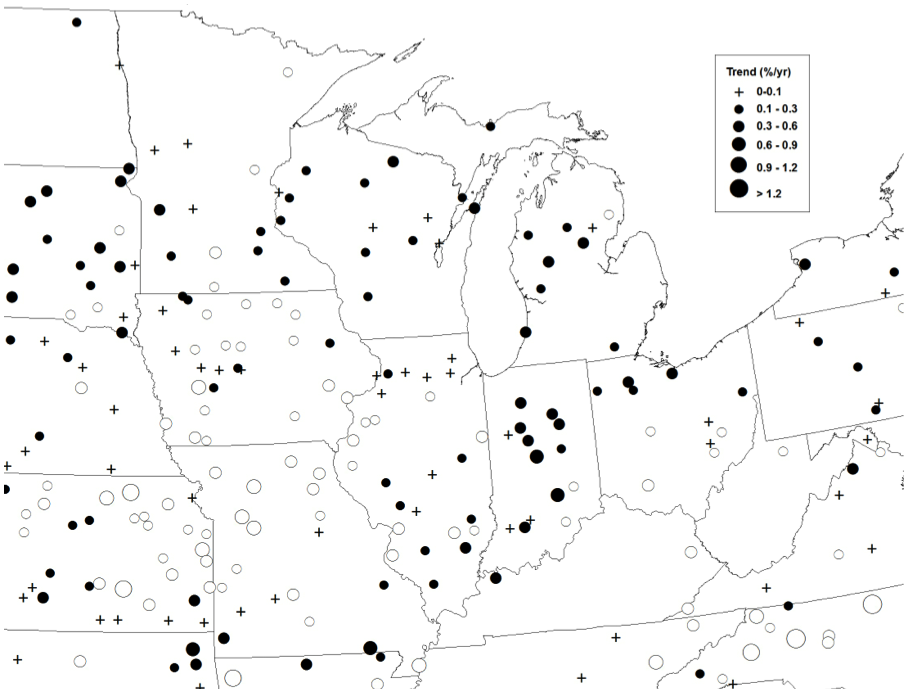
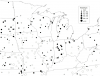
(a) Average annual precipitation during the top 10 wettest days in a year for for the Midwest region (b) Trend in the sum of the top 10 wettest days in a year for for the Midwest region |
NCA 3 |
 |
|
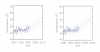
Hydrographs of lake levels for each of the Great Lakes |
NCA 3 |
 |
|
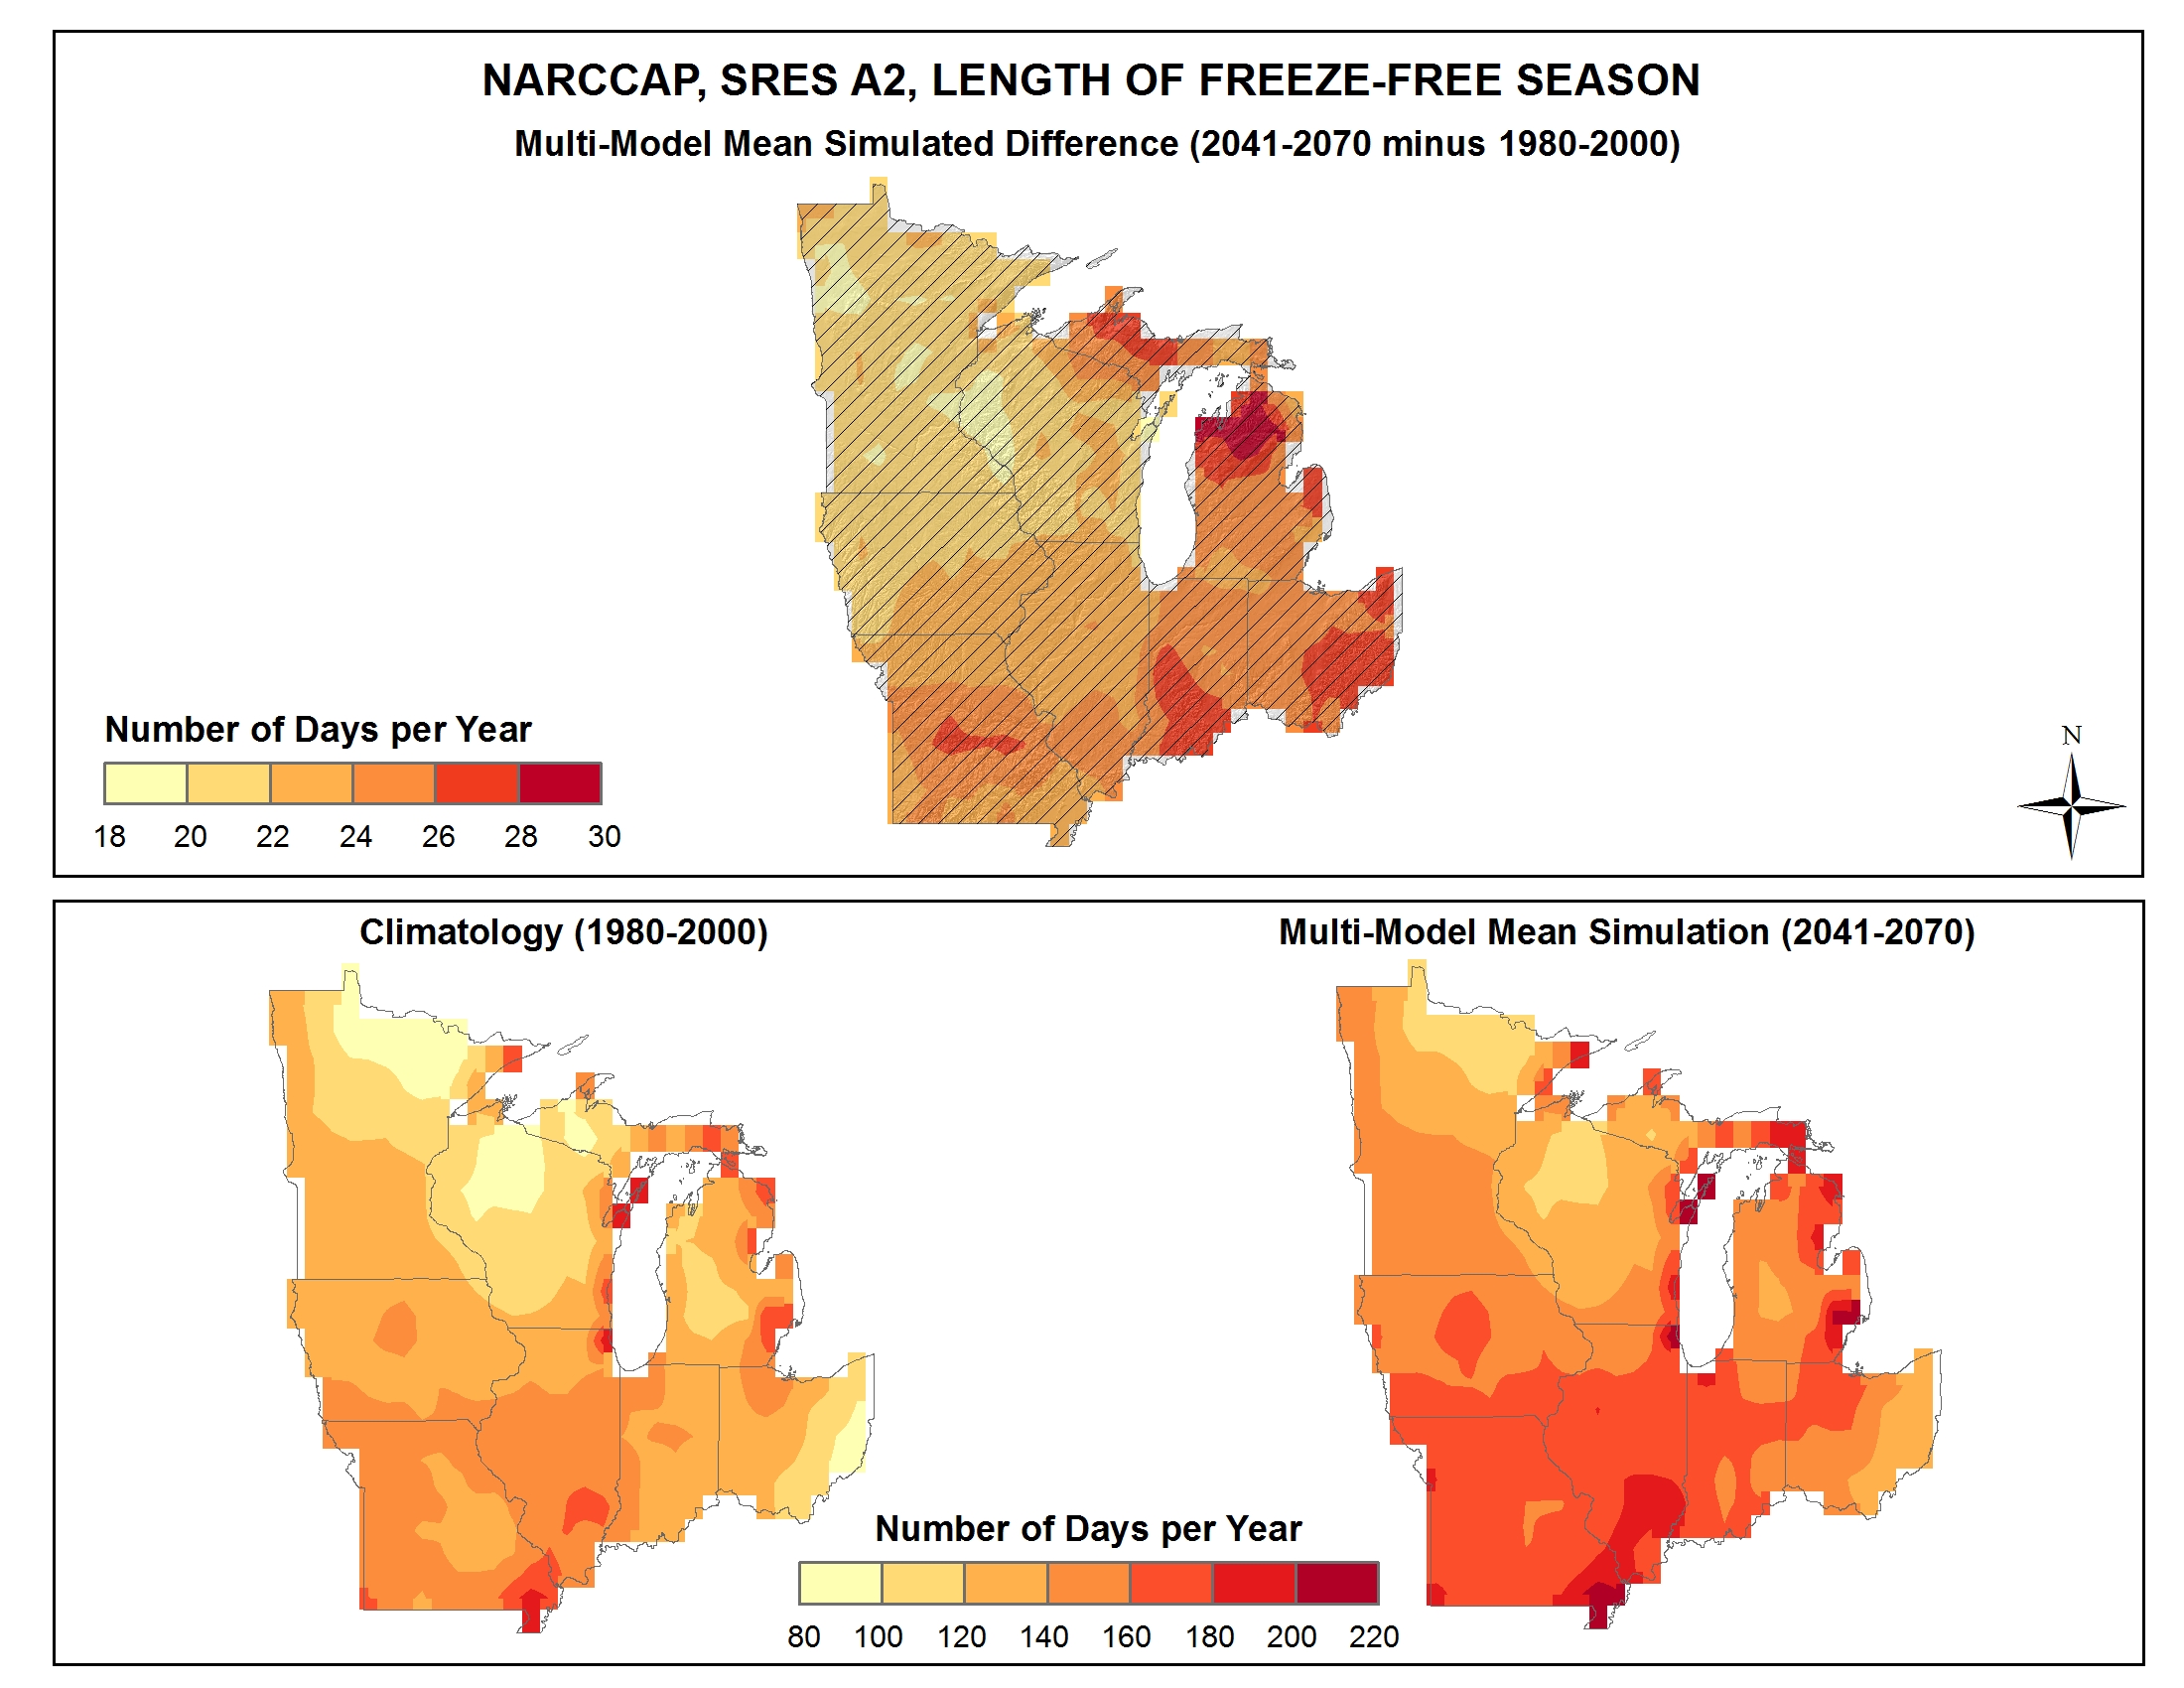
Simulated difference in the mean annual length of the freeze-free season |
NCA 3 |
 |
|
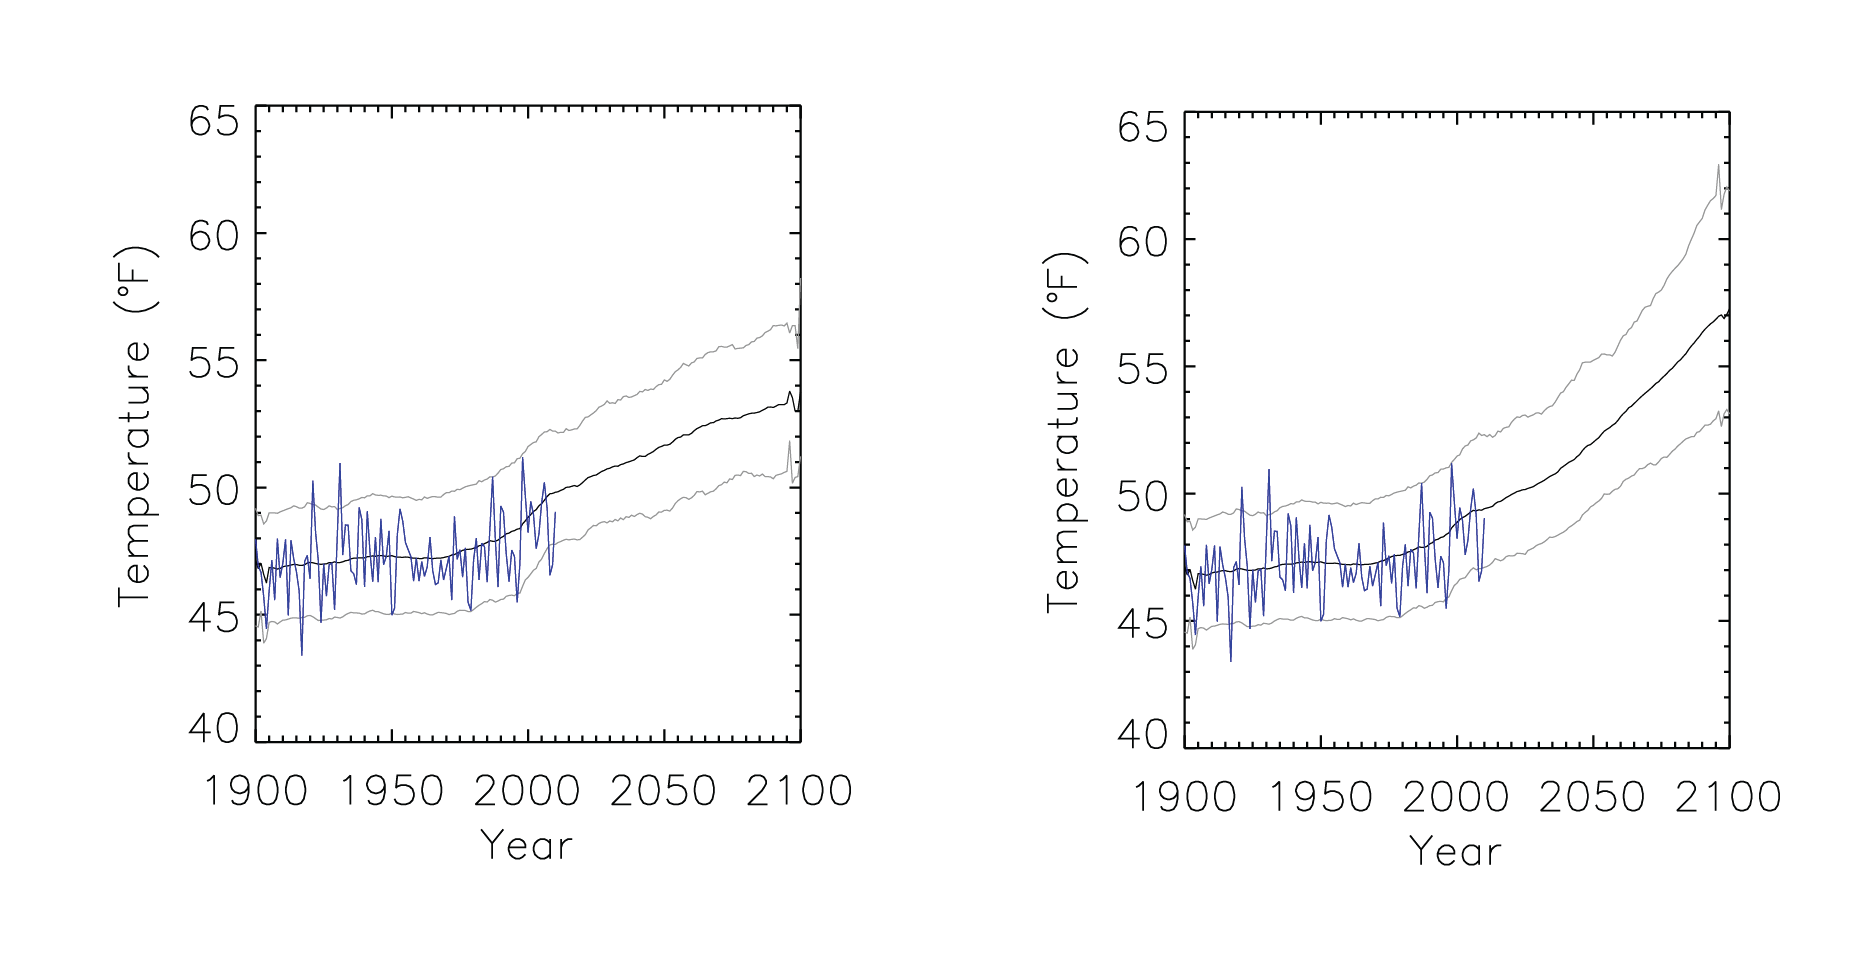
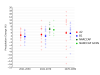
Time series of mean annual temperature |
NCA 3 |
 |
|
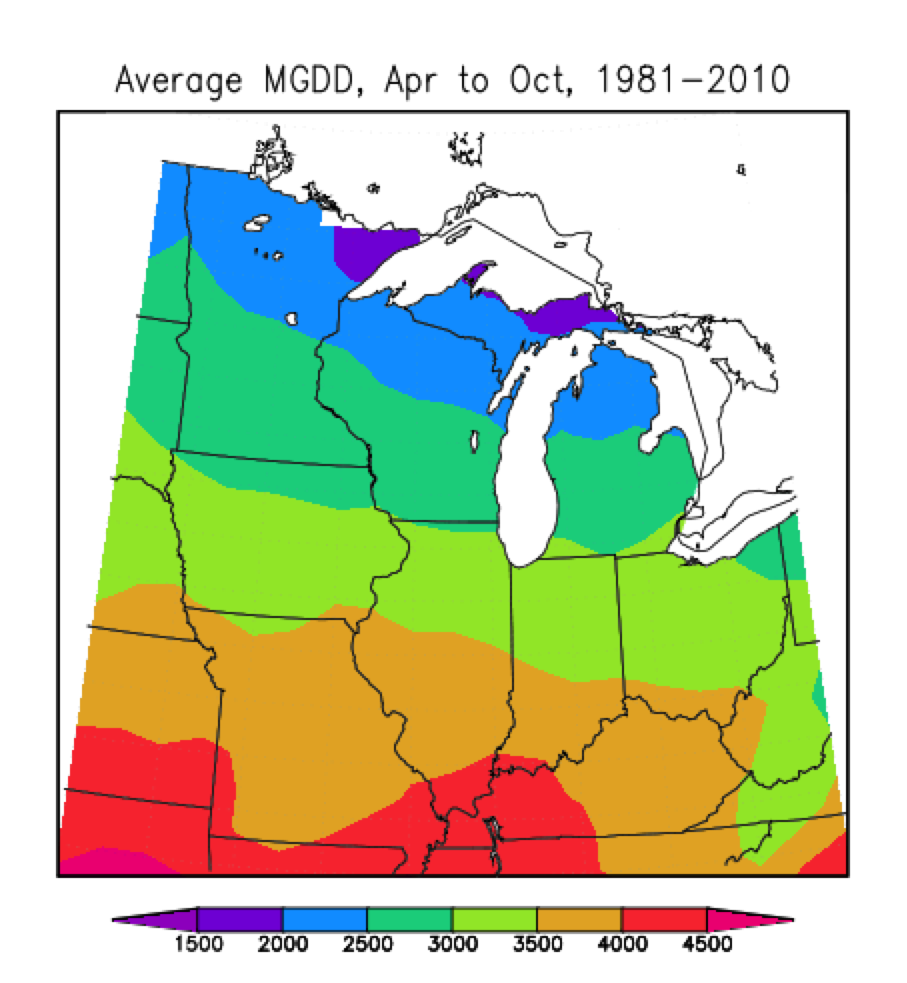
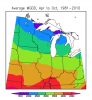
Average number of modified growing degree days for the Midwest region |
NCA 3 |
 |
|
Simulated difference in annual and seasonal mean temperature |
NCA 3 |
 |
|
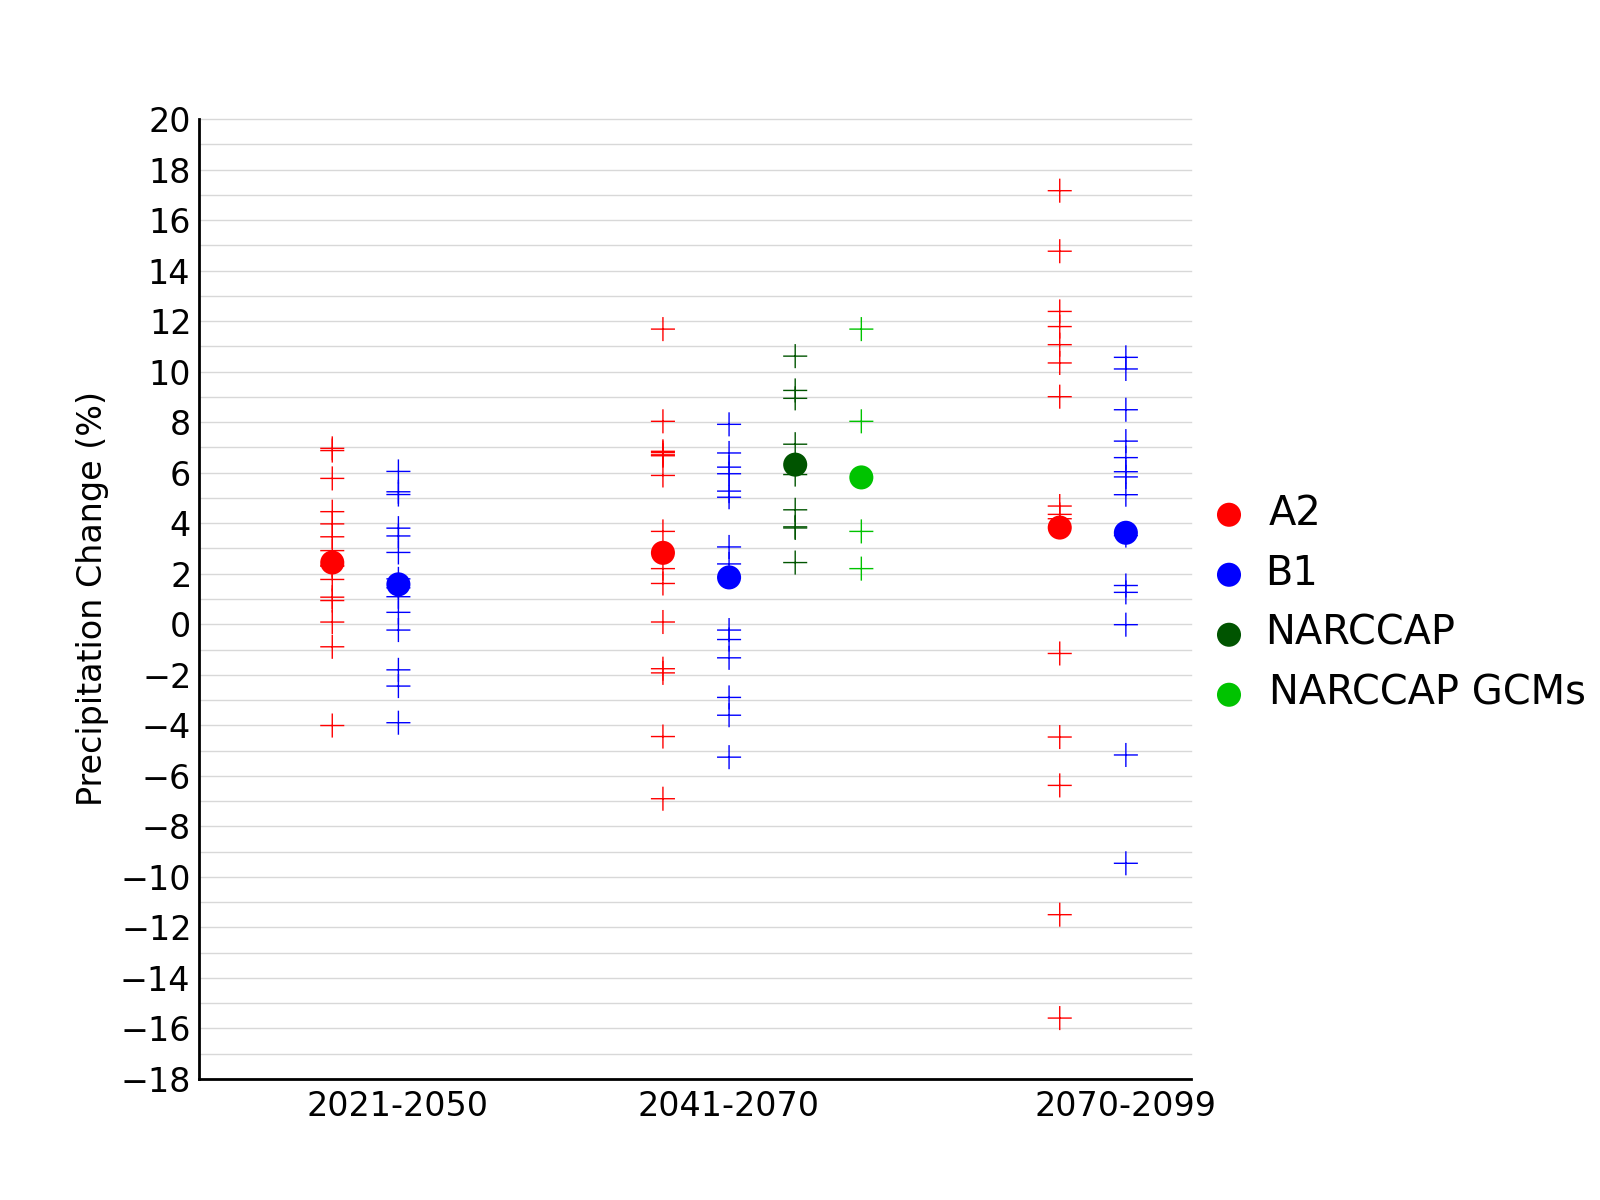
Simulated annual mean precipitation change |
NCA 3 |
 |
|
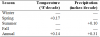
Trends in temperature and precipitation anomaly |
NCA 3 |
 |
|
Snowfall trends for the Midwest region |
NCA 3 |
 |
|
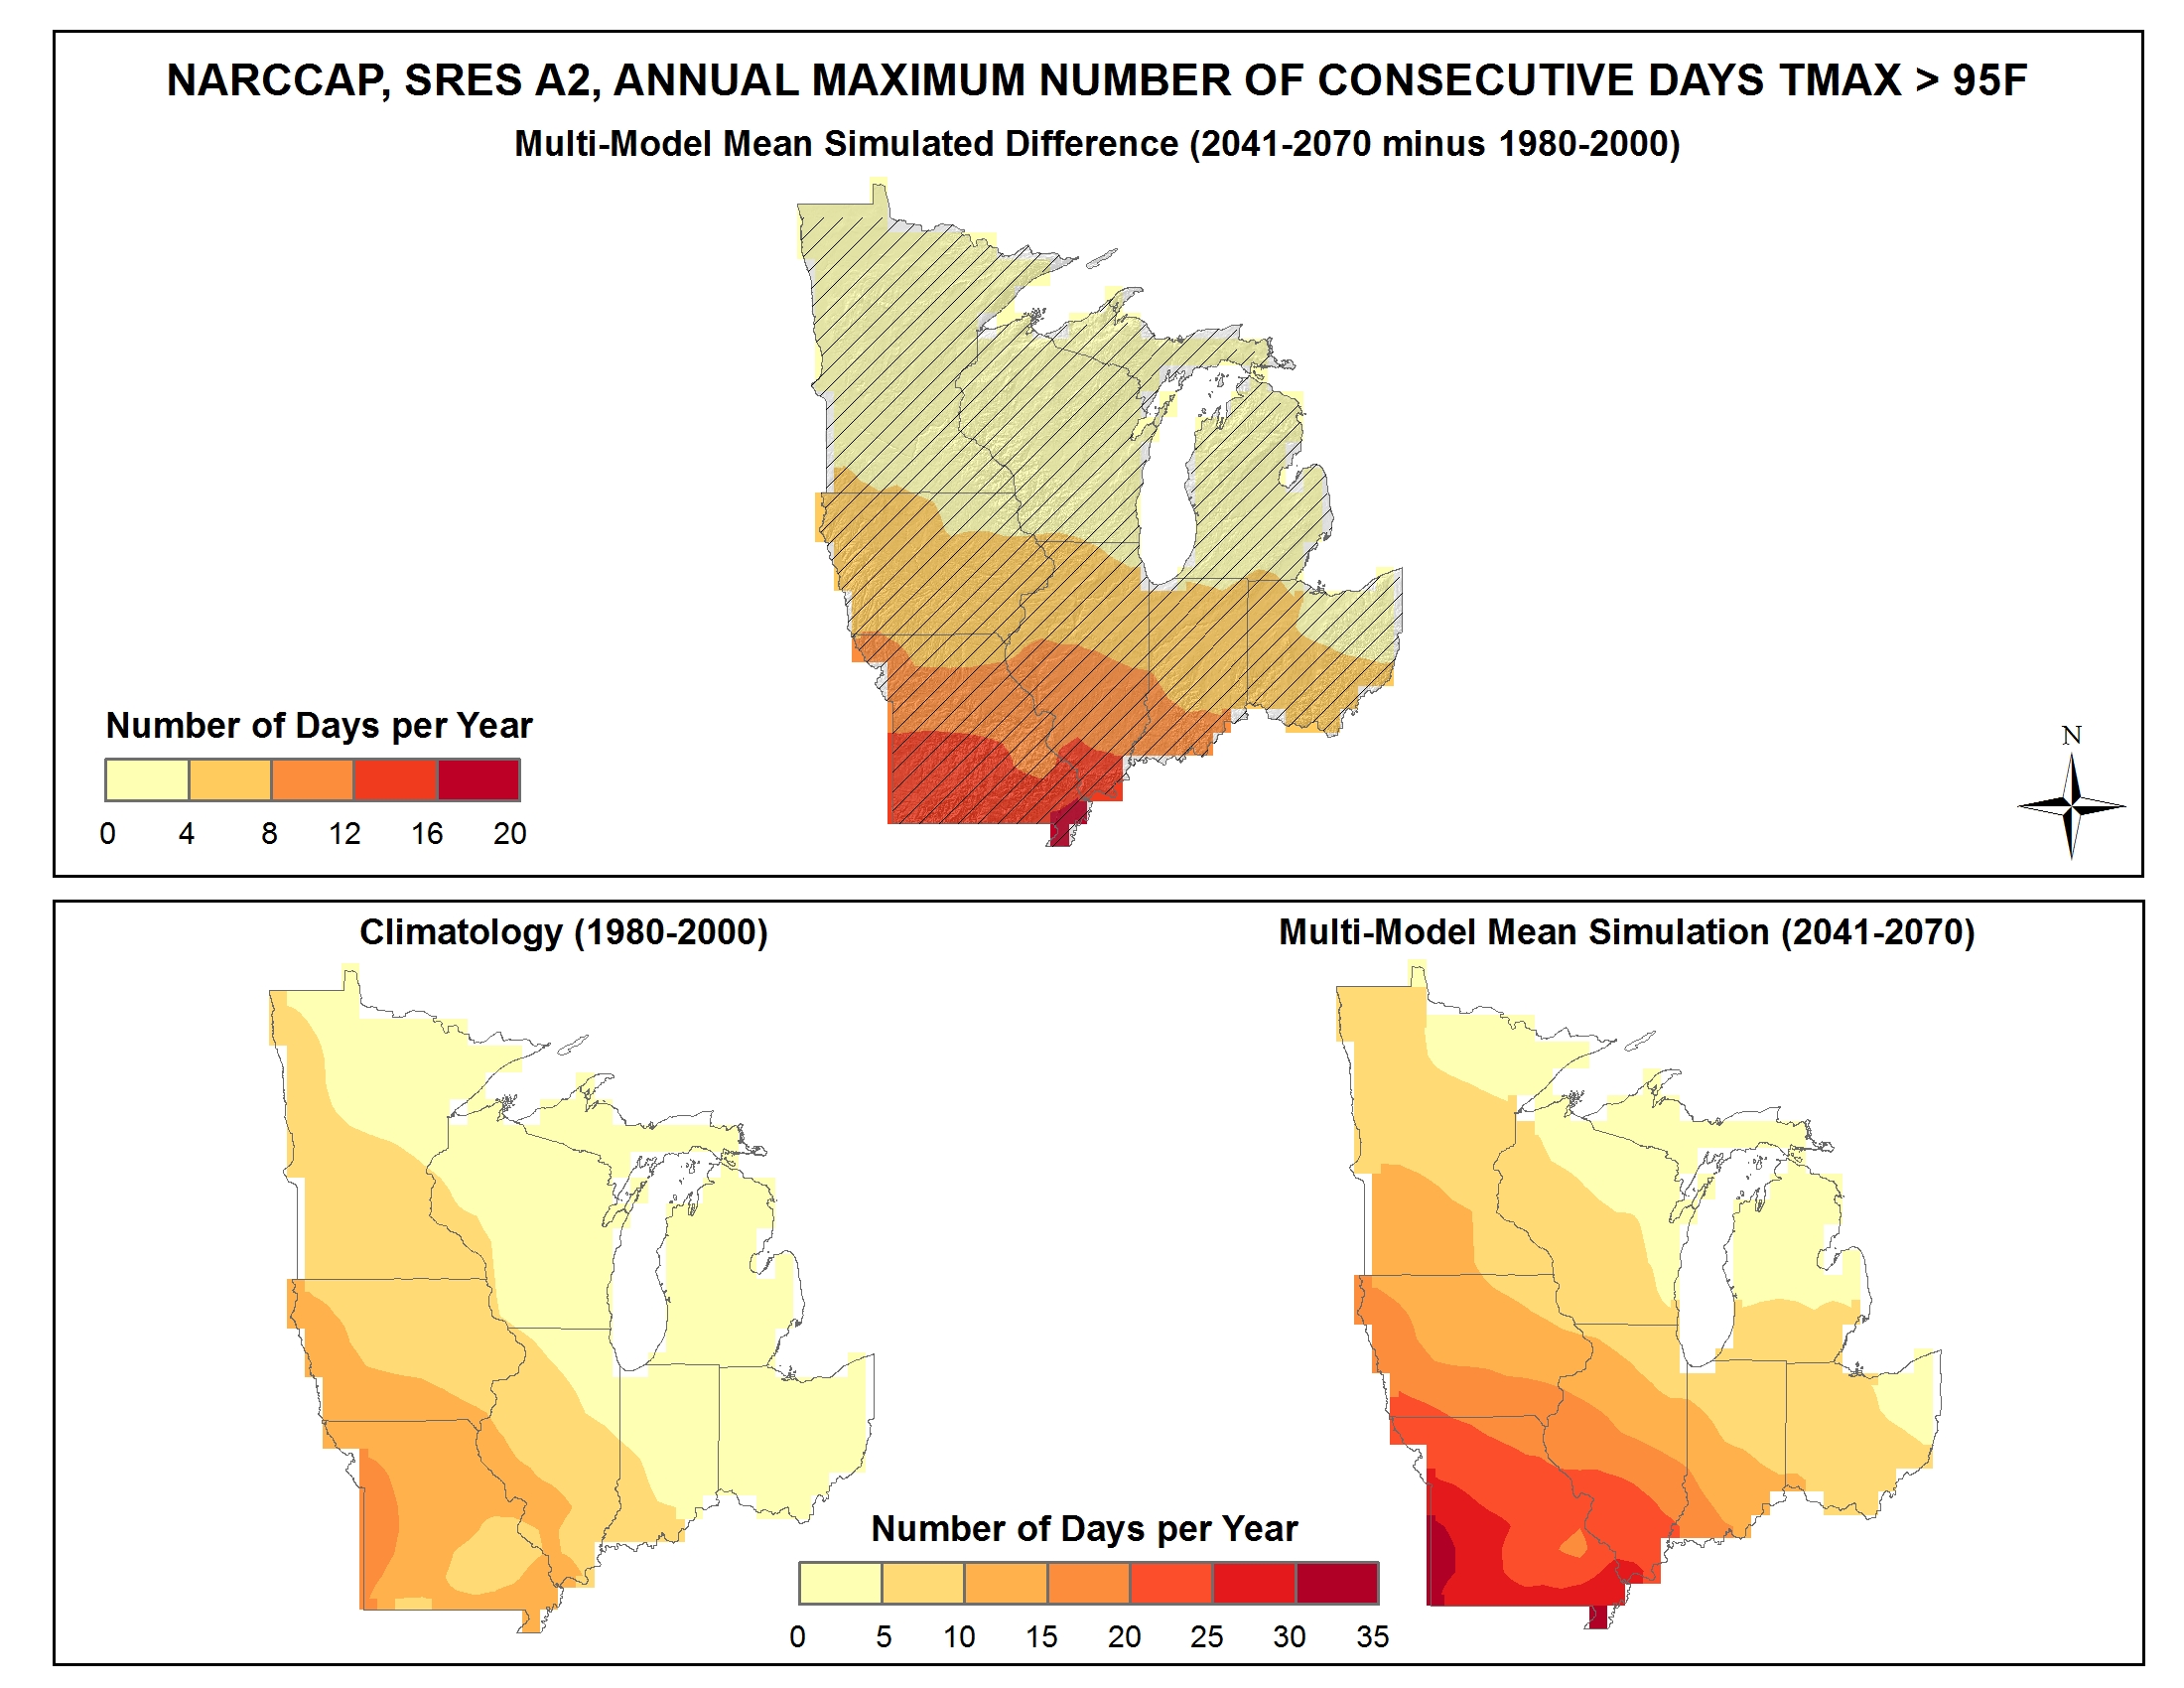
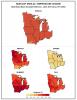
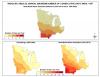
Simulated difference in the mean annual maximum number of consecutive days with a maximum temperature greater than 95F |
NCA 3 |
 |