General Information
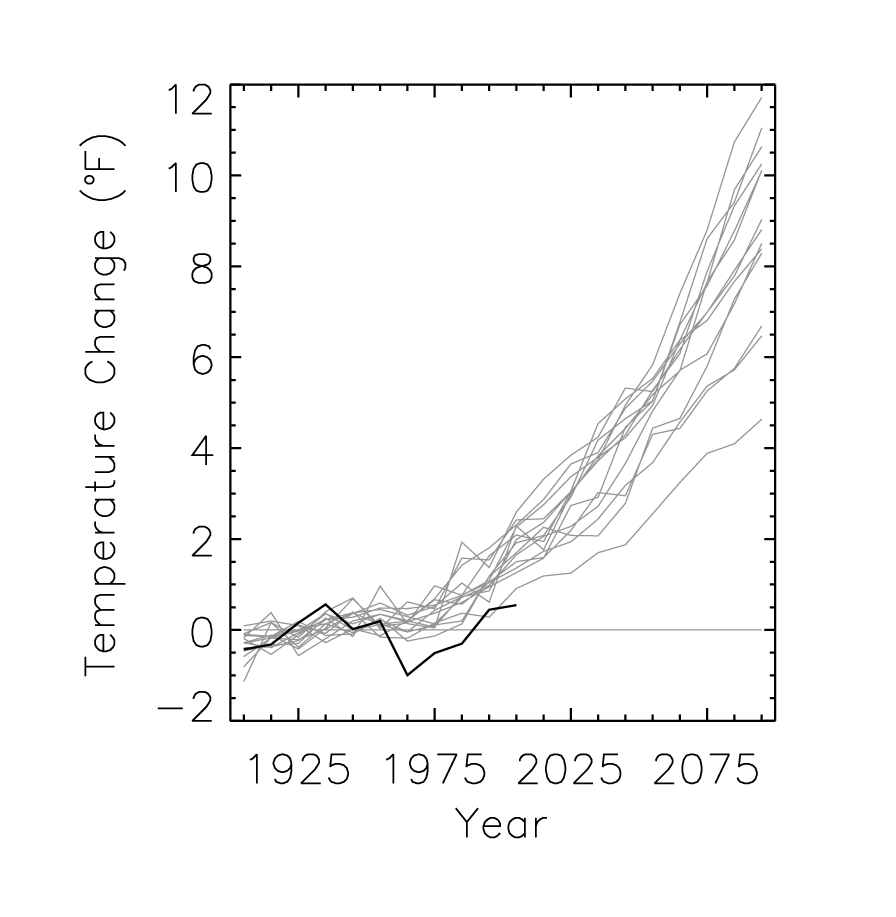
Observed decadal mean annual temperature change (deviations from the 1901-1960 average, F) for the Southeast U.S. (black line). Based on a new gridded version of COOP data from the National Climatic Data Center, the CDDv2 data set (R. Vose, personal communication, July 27, 2012). Gray lines indicate the 20th and 21st century simulations from 15 CMIP3 models, for the high (A2) emissions scenario. The early 20th century rate of warming and the mid-century rate of cooling are not simulated by the models, but the late-century rate of warming is similar to the rate of warming in the models.
Data Type:
Observed
Simulated
Variable Type:
Temperature
Region:
Metadata
Metadata File(s):
Files