|
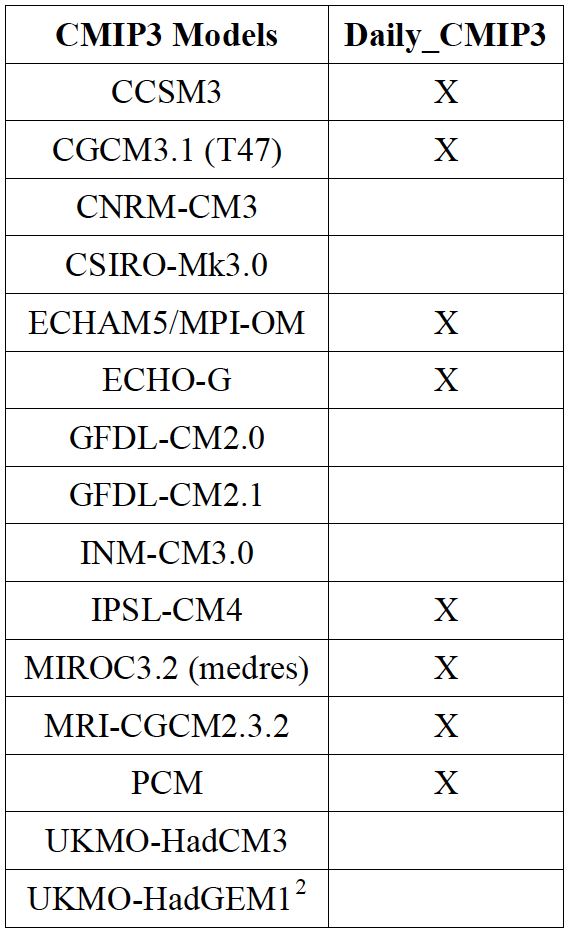
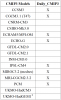
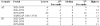
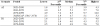
CMIP3 Models Listing |
NCA 3 |
 |
|
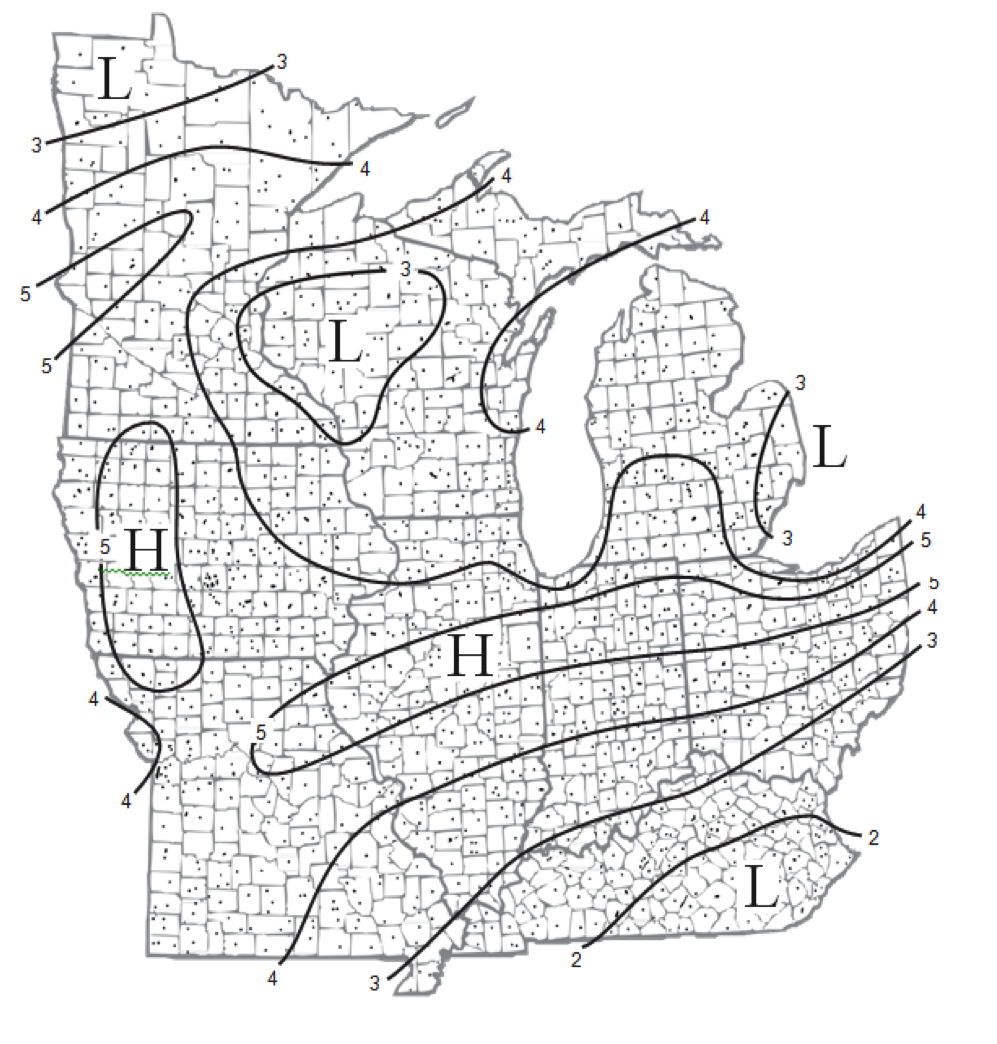
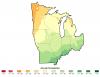
Average annual number of days with freezing rain for the Midwest region |
NCA 3 |
 |
|
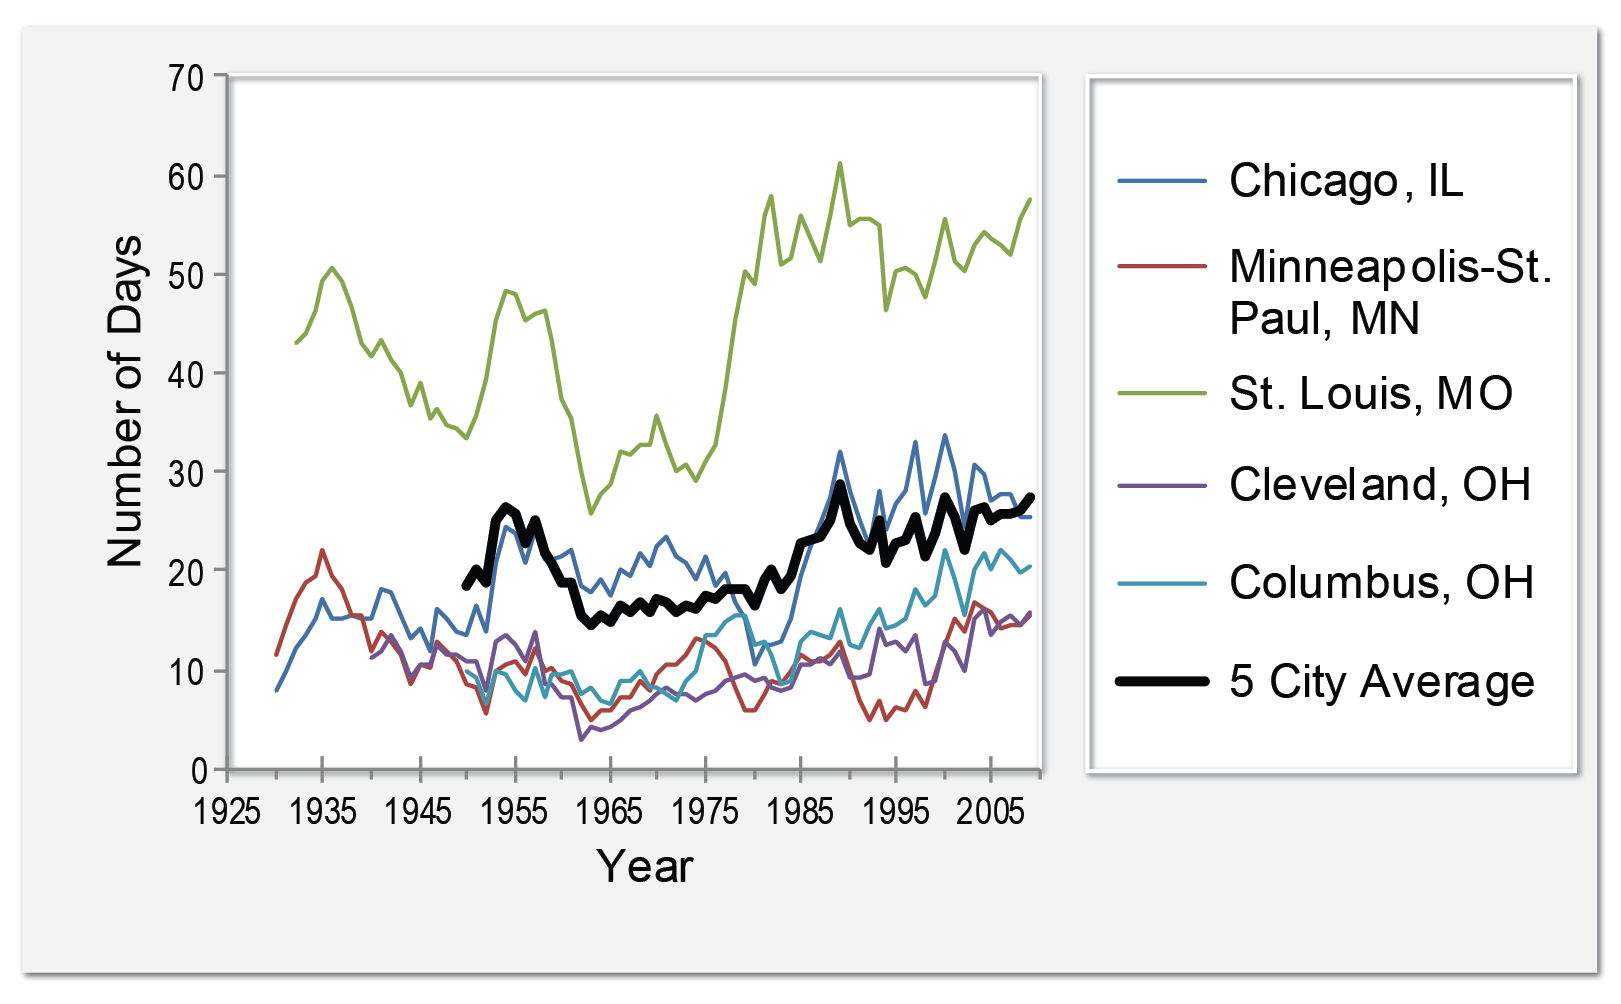
Number of days with minimum temperatures equal to or exceeding 70F at 5 large Midwestern cities |
NCA 3 |
 |
|
Distribution of the simulated change in annual mean precipitation |
NCA 3 |
 |
|
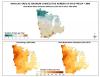
Average annual precipitation |
NCA 3 |
 |
|
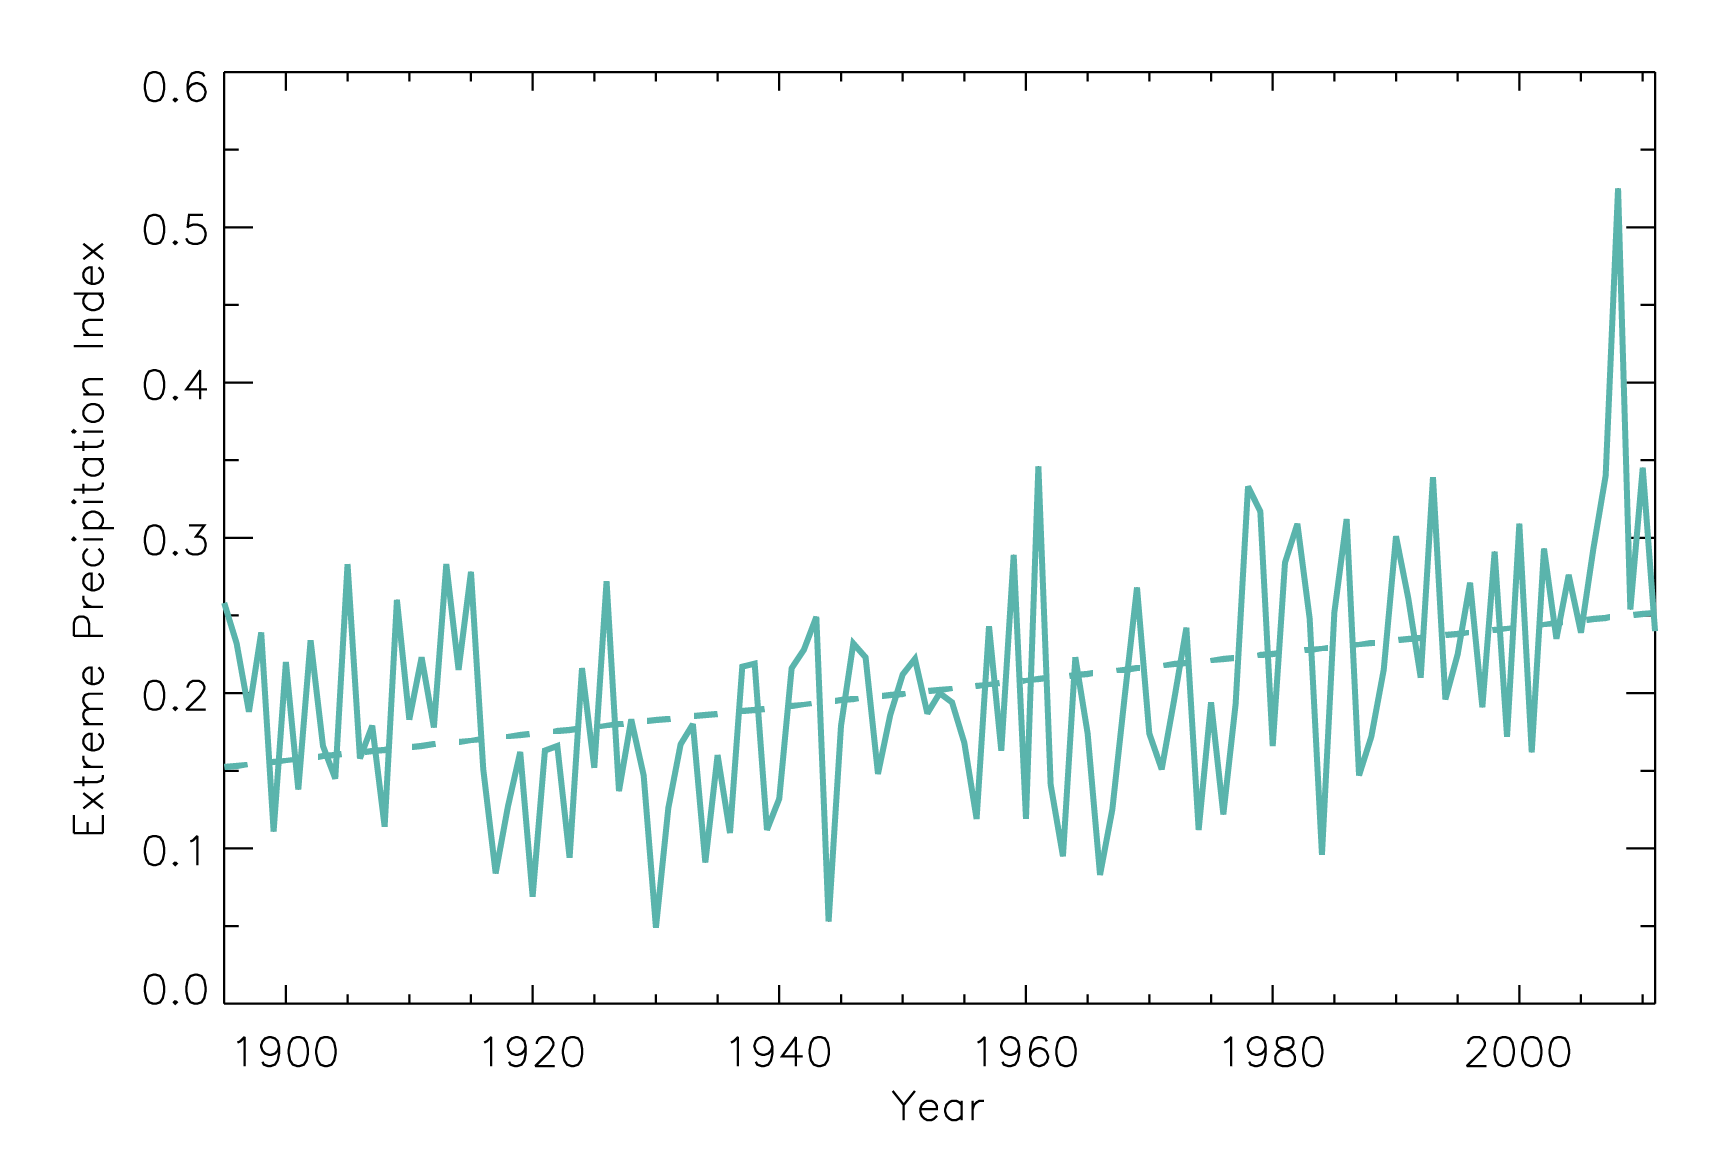
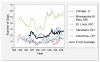
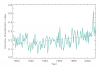
Time series of extreme precipitation index for the occurrence of 1-day, 1 in 5-year extreme precipitation |
NCA 3 |
 |
|
Distribution of the simulated change in annual mean temperature |
NCA 3 |
 |
|
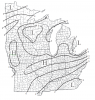
Simulated difference in the mean annual maximum number of consecutive days with precipitation of less than 0.1 inches |
NCA 3 |
 |
|
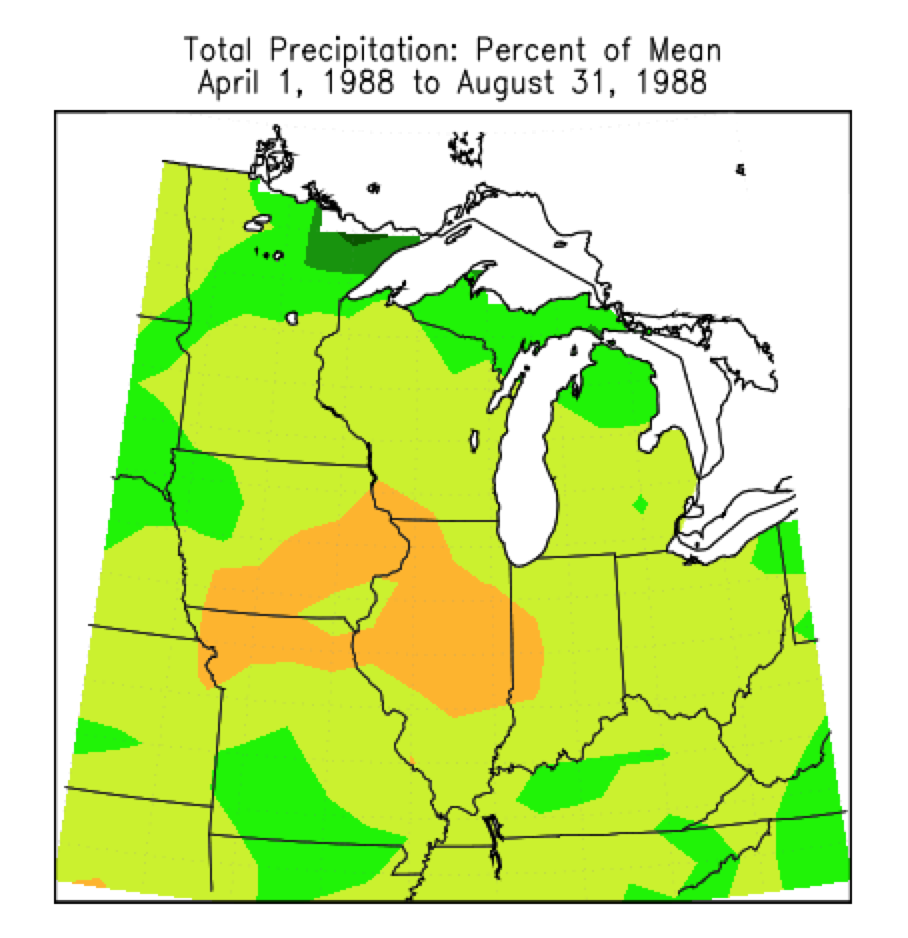
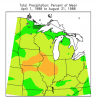
Total precipitation expressed as the percentage of the long-term mean during the summer drought of 1988 for the Midwest region |
NCA 3 |
 |