|
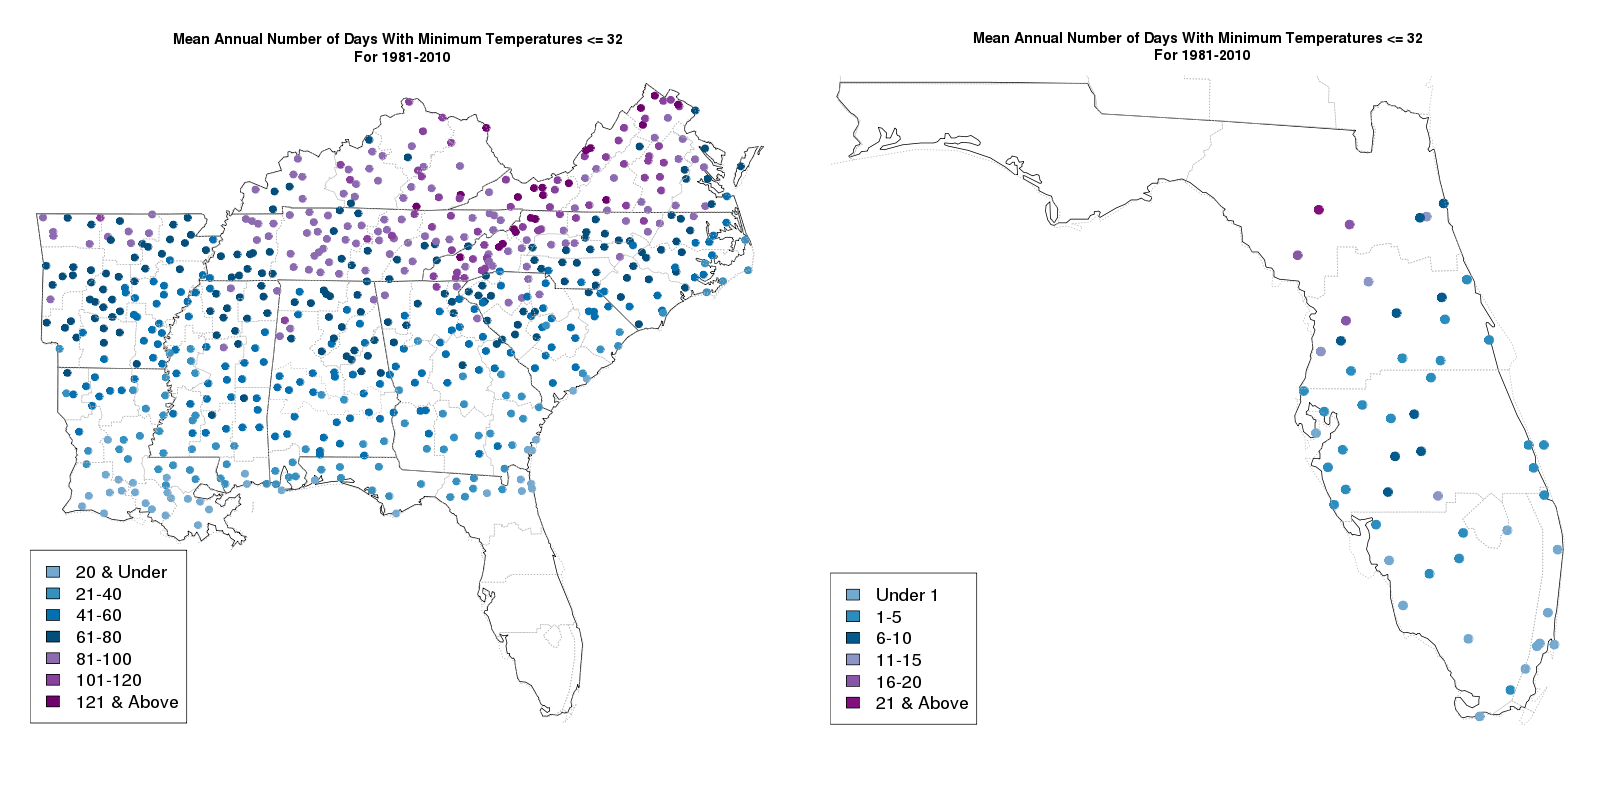
Mean annual number of days with a minimum temperature <= 32F |
NCA 3 |
 |
|
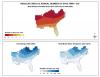
Simulated difference in the mean annual number of days with a minimum temperature less than 32F |
NCA 3 |
 |
|
Observed decadal mean seasonal temperature change |
NCA 3 |
 |
|
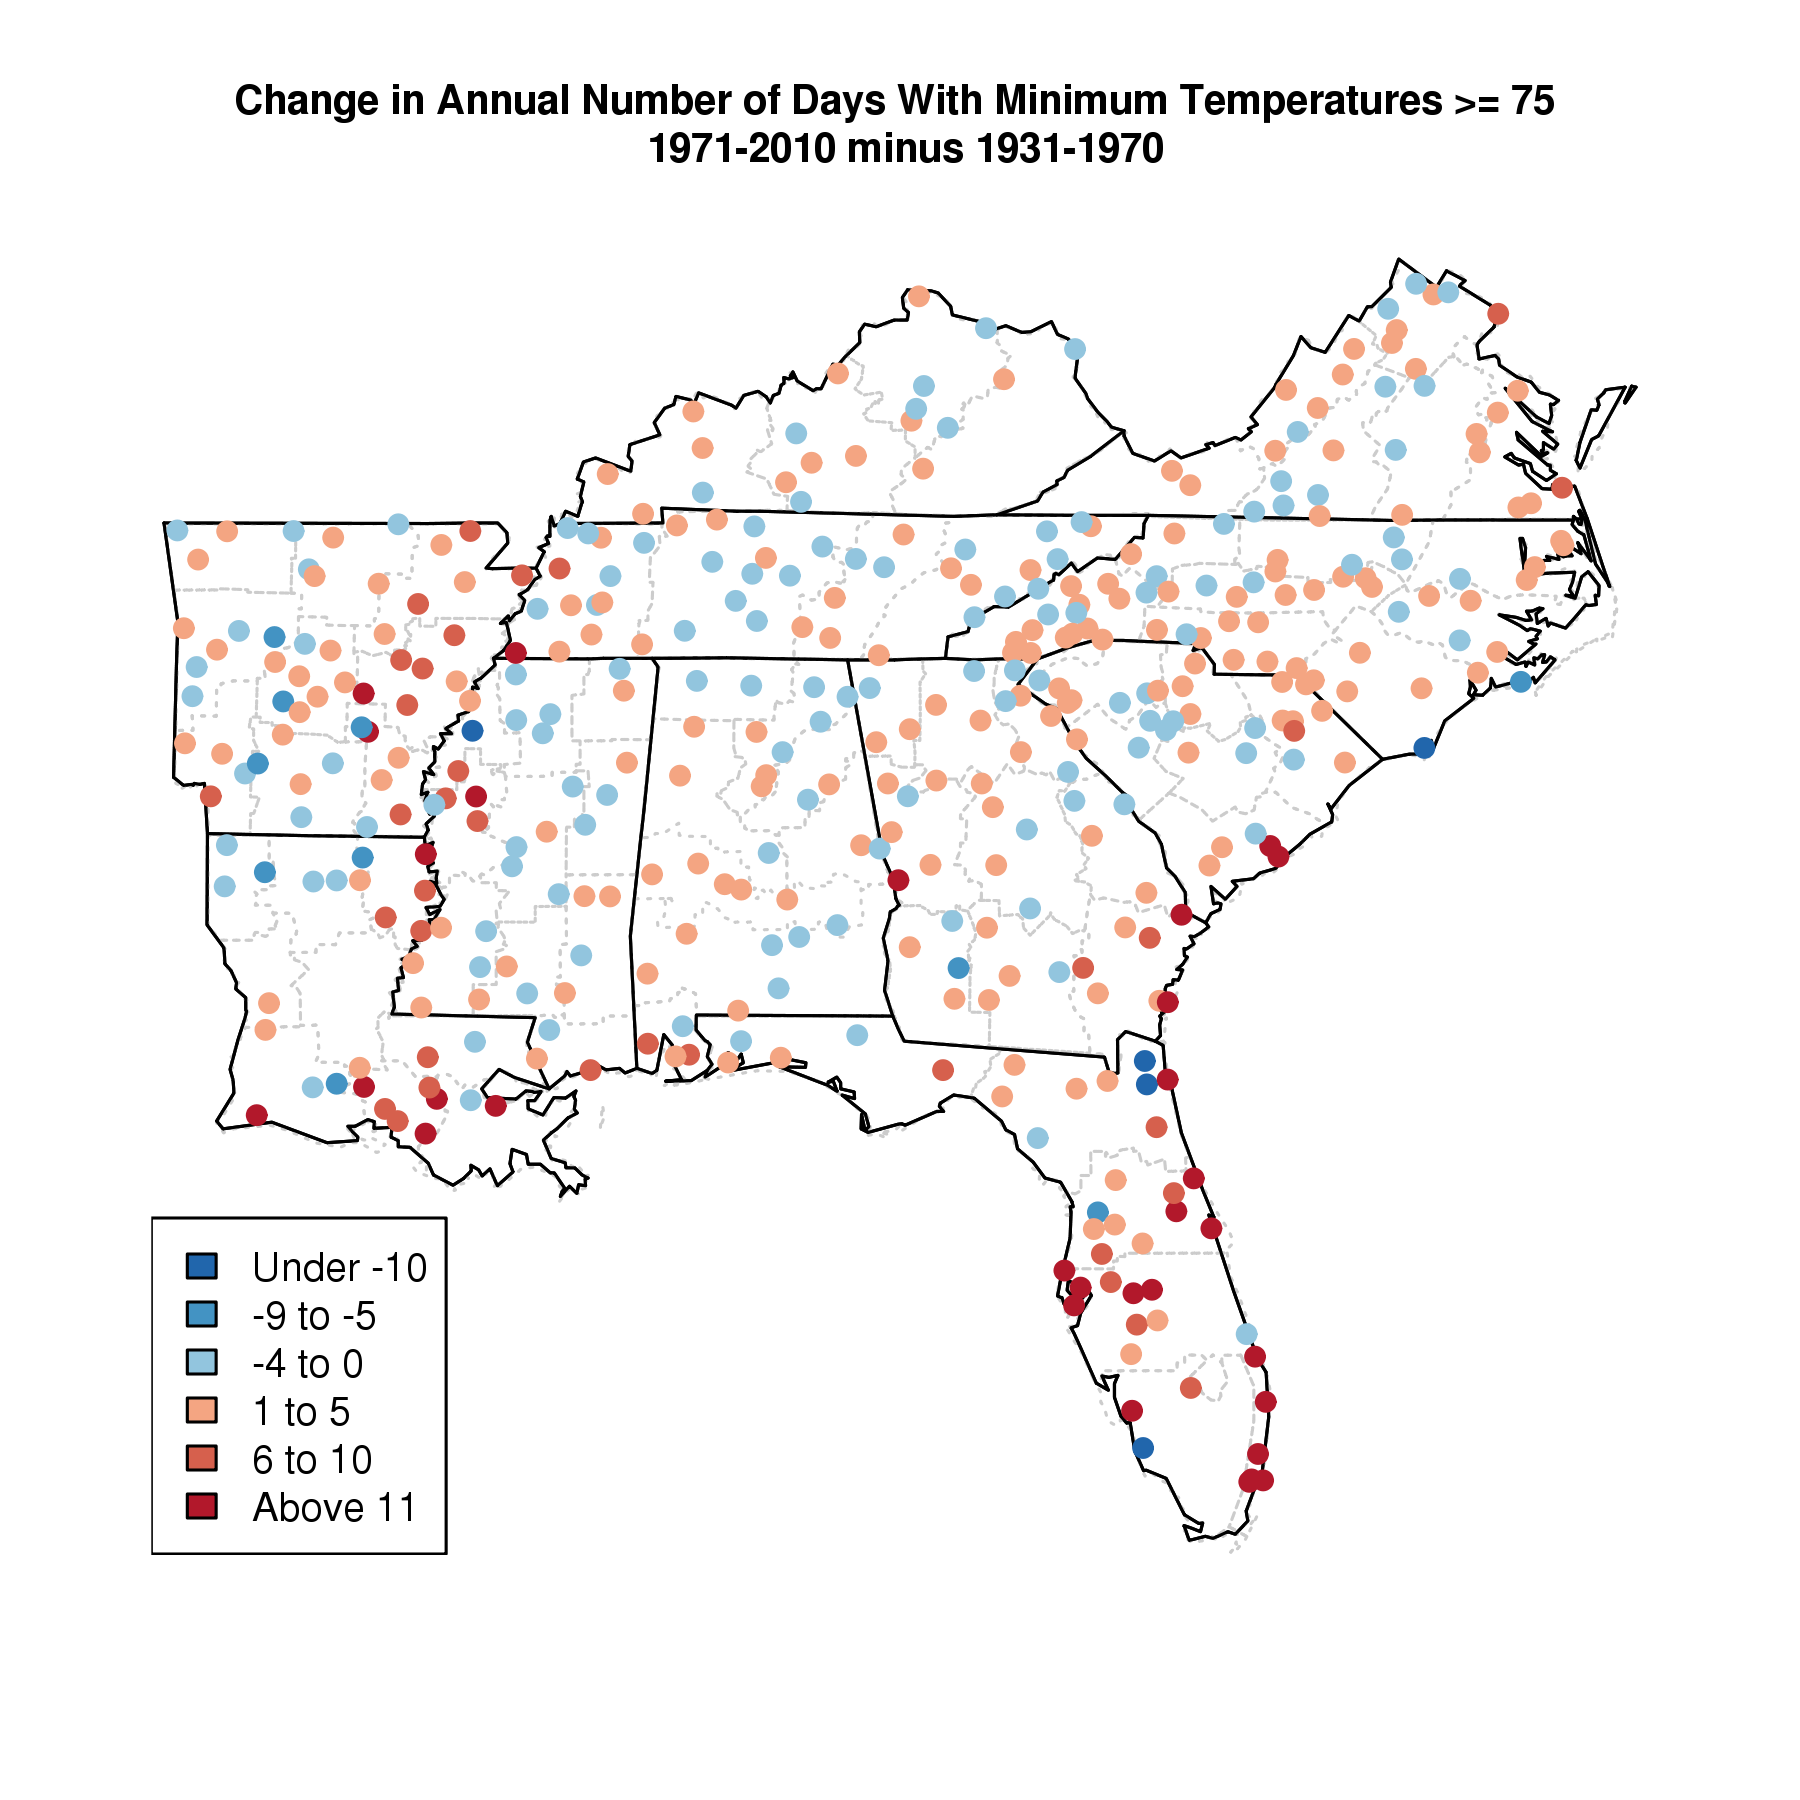
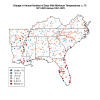
Difference in cumulative number of days with a minimum temperature >=75F |
NCA 3 |
 |
|
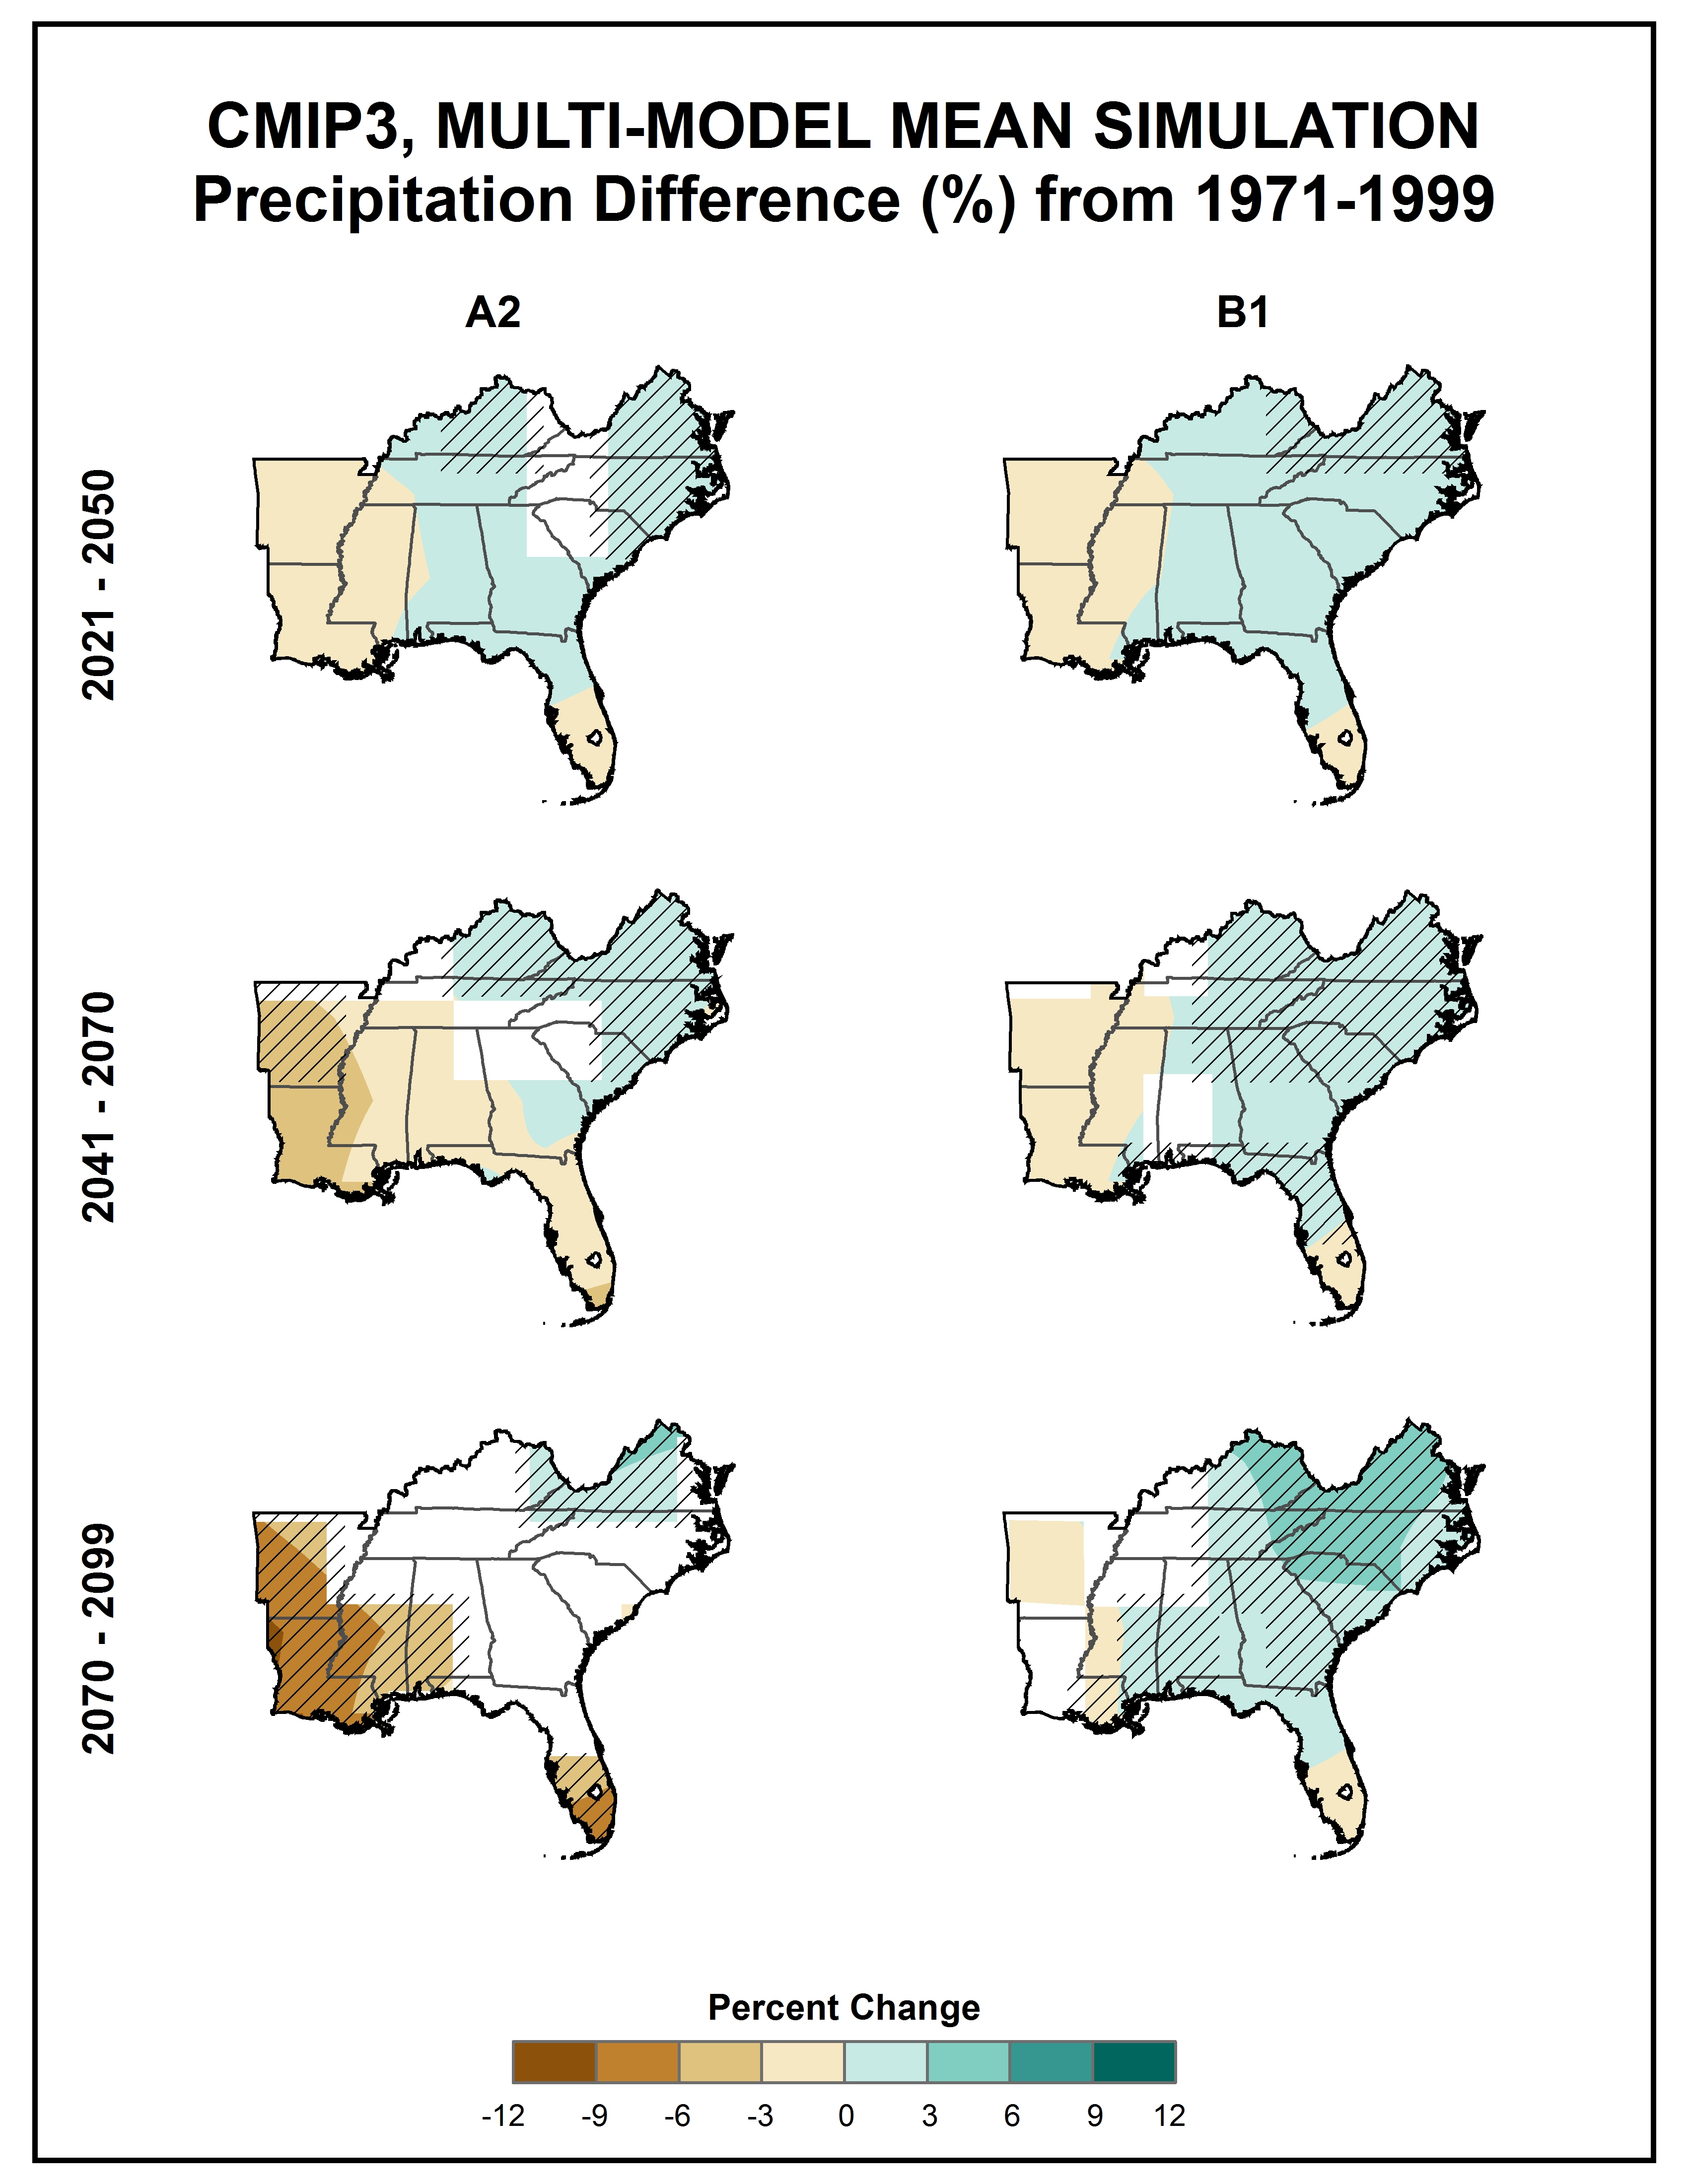
Simulated difference in mean annual precipitation |
NCA 3 |
 |
|
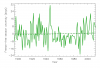
Time series of freeze-free season anomalies |
NCA 3 |
 |
|
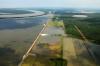
Morganza Floodway opened in Louisiana |
NCA 3 |
 |
|
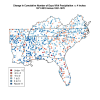
Difference in cumulative number of days with precipitation >= 4 inches |
NCA 3 |
 |
|
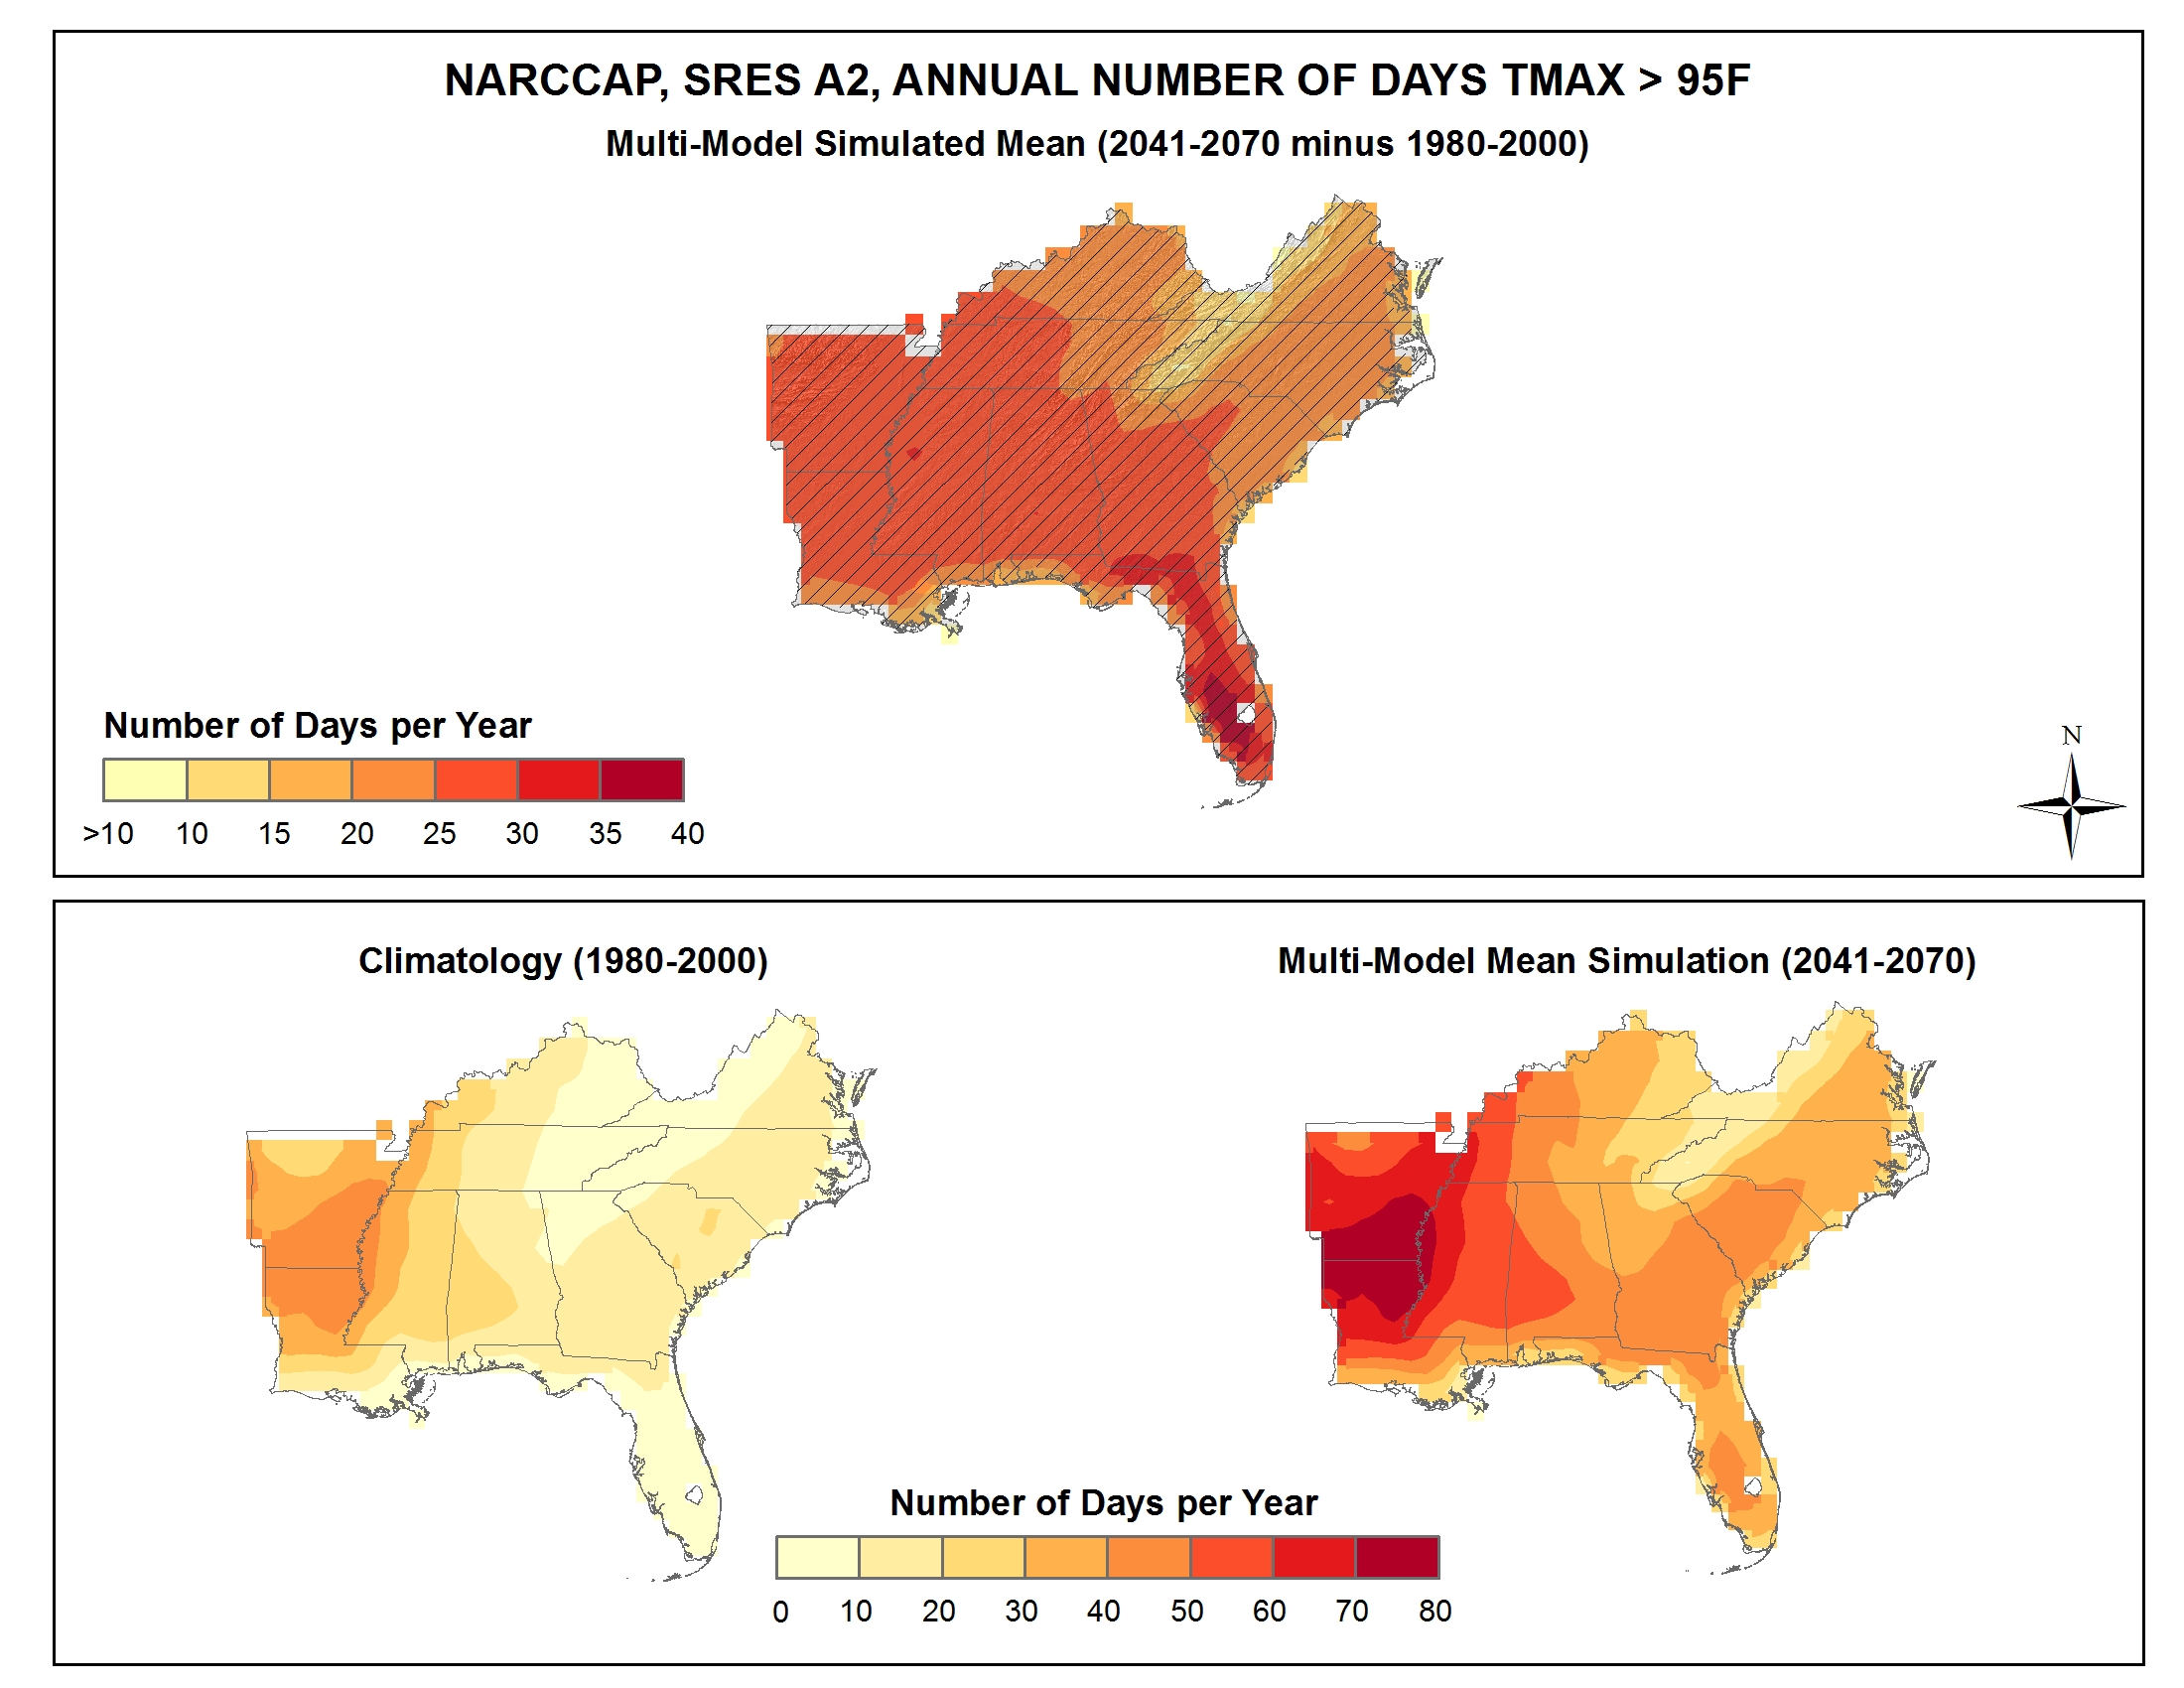
Simulated difference in the mean annual number of days with a maximum temperature greater than 95F |
NCA 3 |
 |