NCA Version:
NCA 3
| Title |
NCA Version |
|---|---|
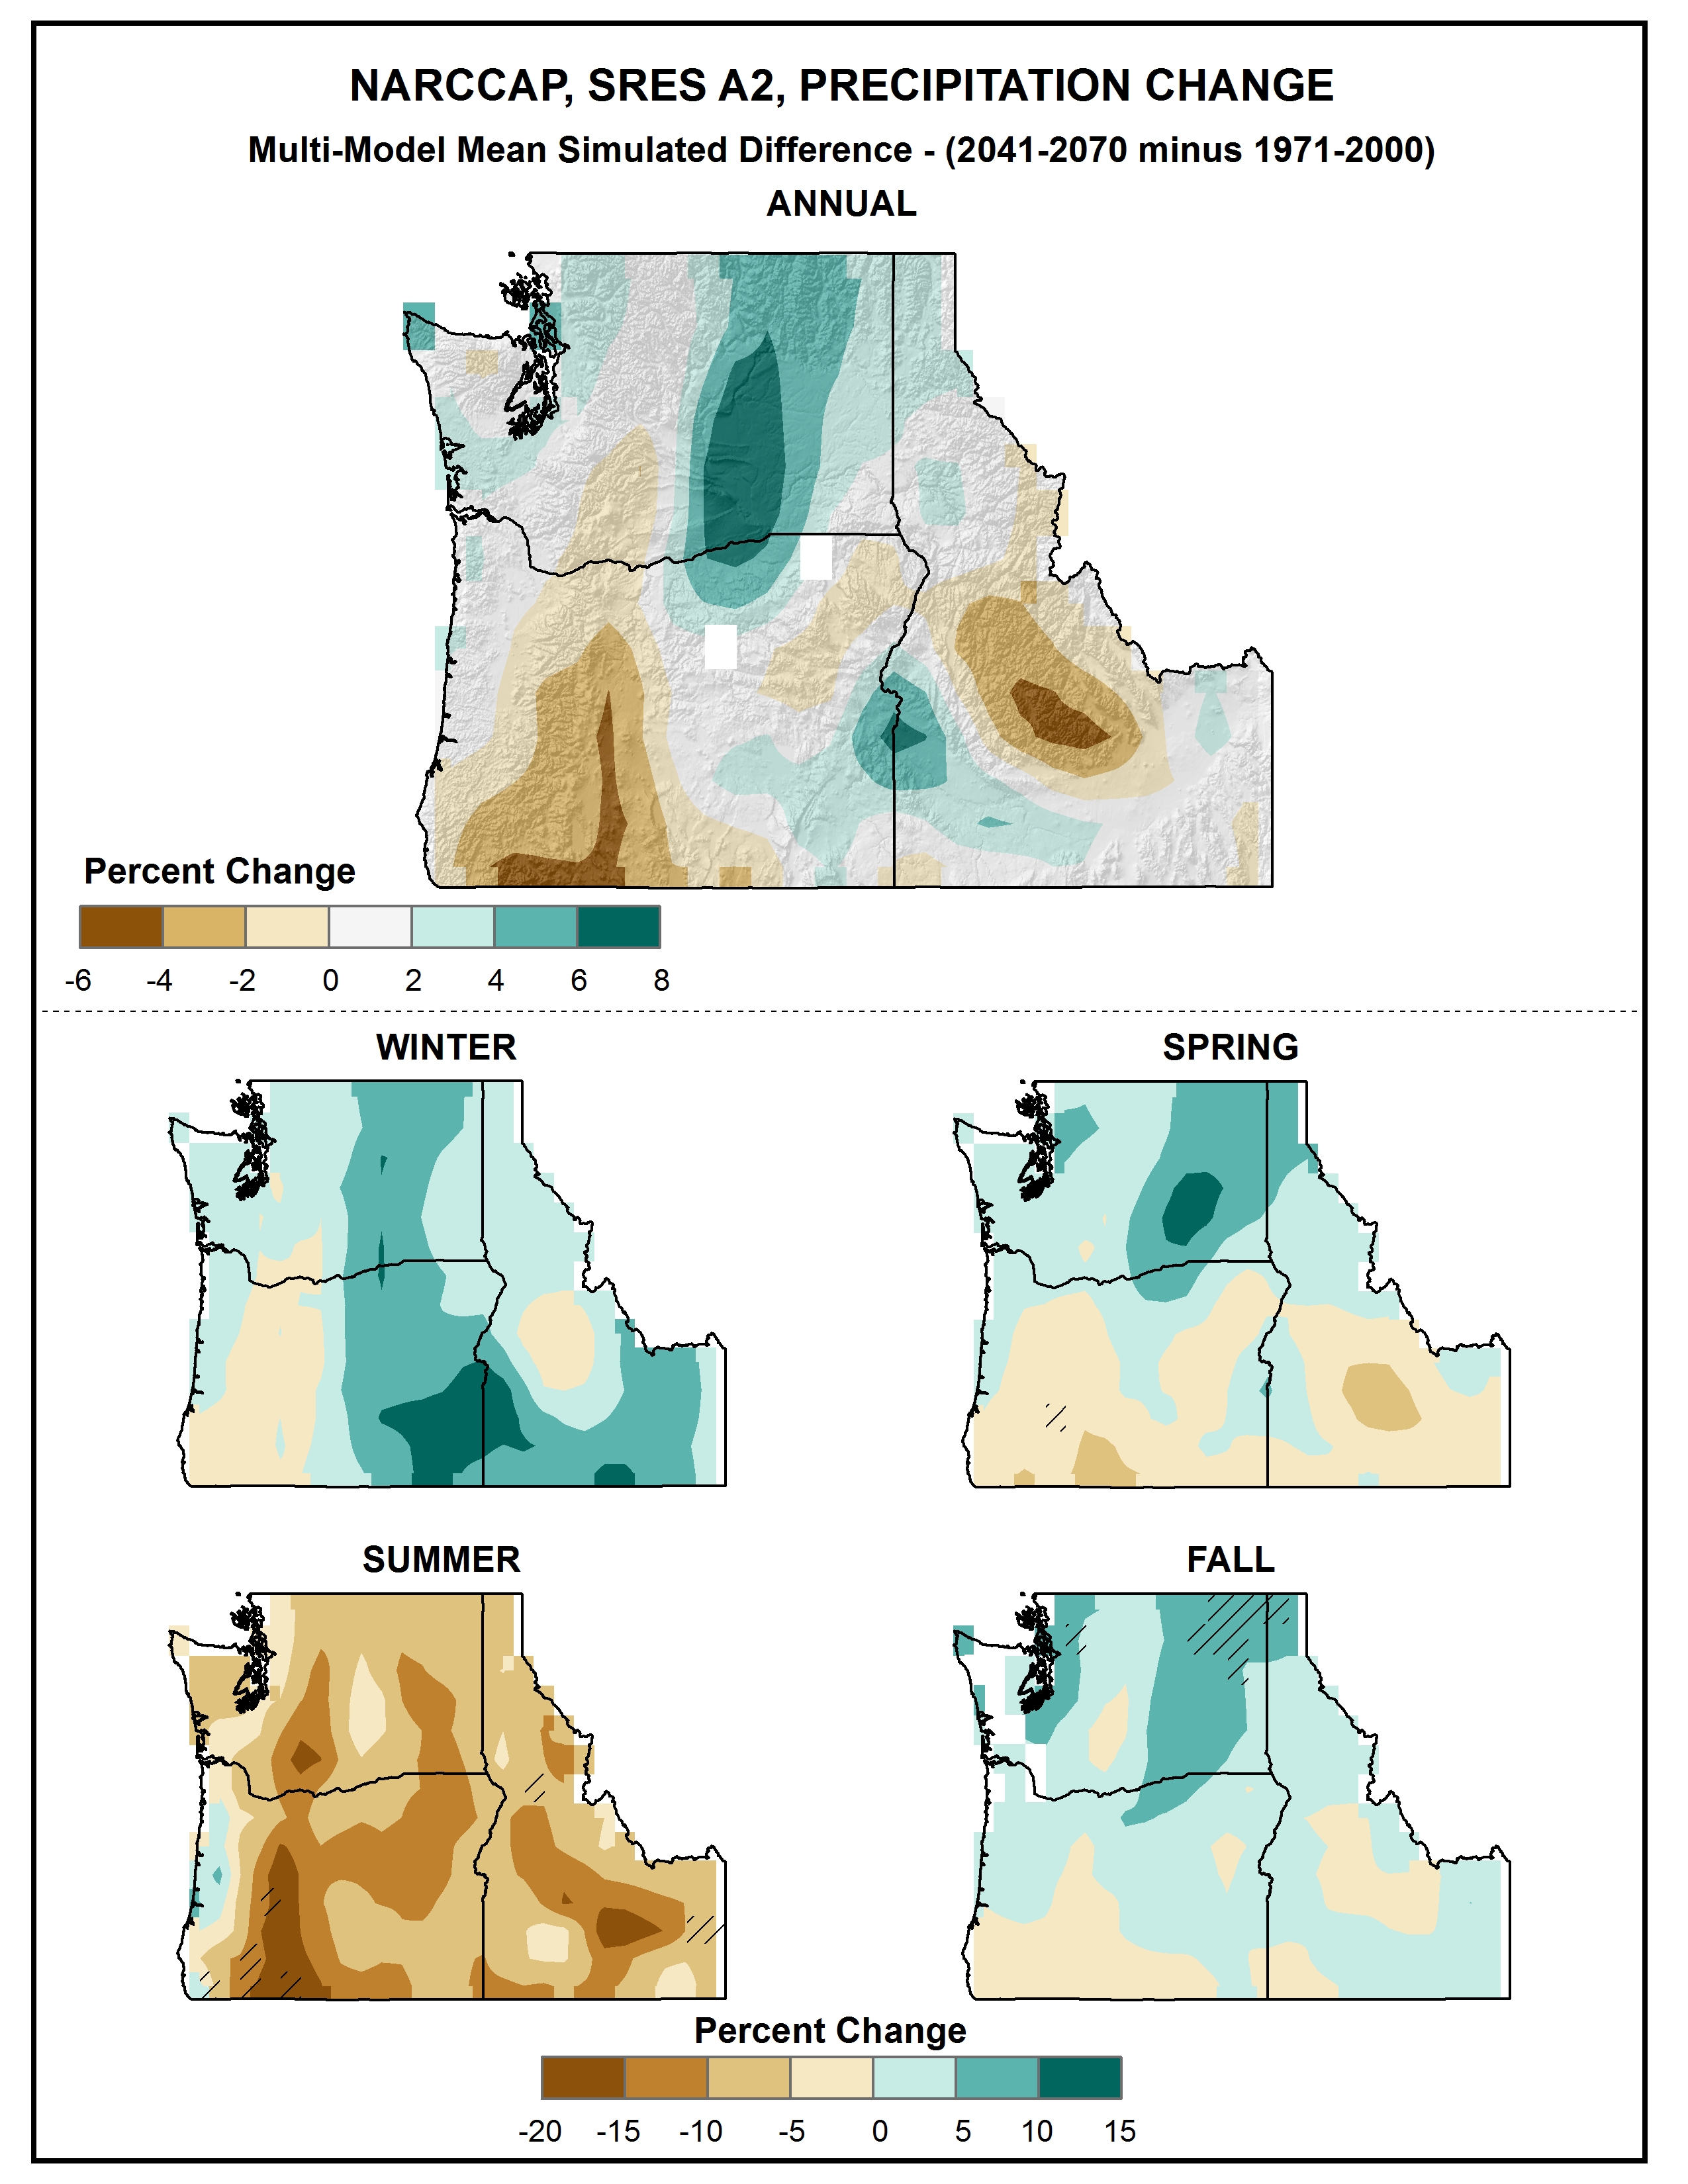
| Summary for Part 6: Climate of the Northwest U.S. | NCA 3 |
| Title |
NCA Version |
|
|---|---|---|
| Regional Climate Trends and Scenarios for the U.S. National Climate Assessment. Part 6. Climate of the Northwest U.S. | NCA 3 |