General Information
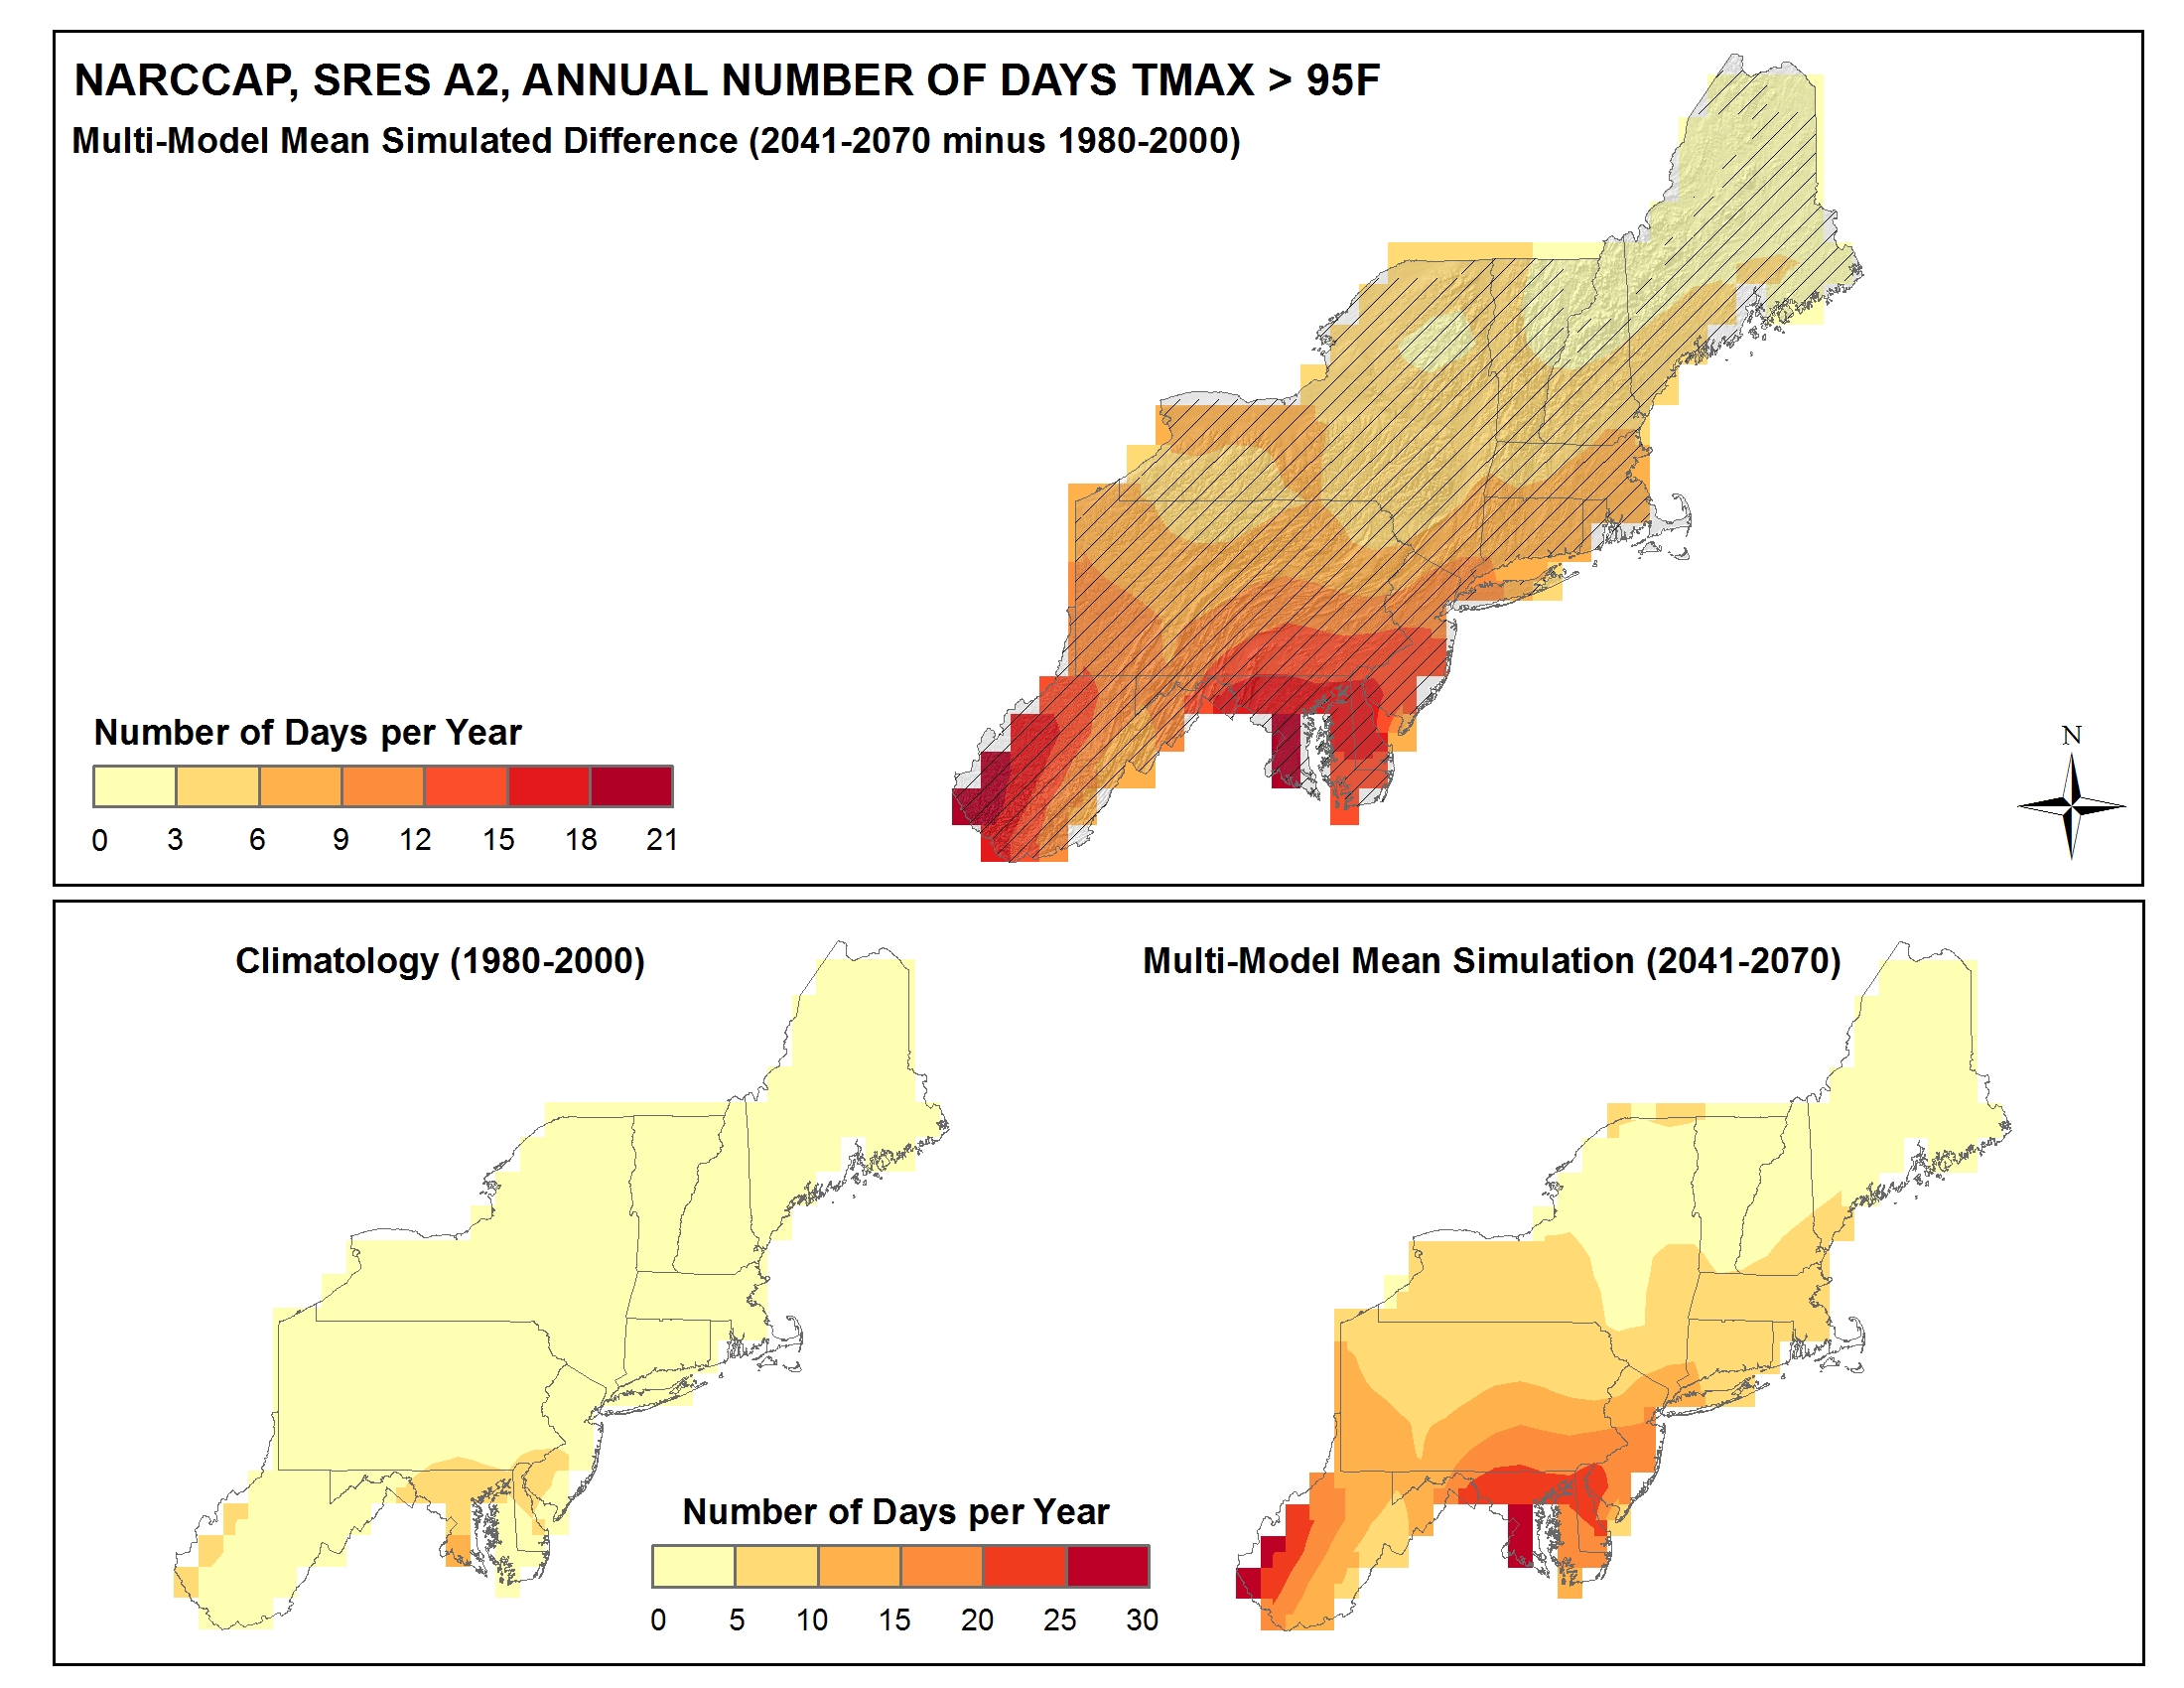
Simulated difference in the mean annual number of days with a maximum temperature greater than 95F (Tmax > 95F) for the Northeast region, for the 2041-2070 time period with respect to the reference period of 1980-2000 (top). Color only (category 1) indicates that less than 50% of the models show a statistically significant change in the number of days. Color with hatching (category 3) indicates that more than 50% of the models show a statistically significant change in the number of days, and more than 67% agree on the sign of the change (see text). Mean annual number of days with Tmax > 95F for the 1980-2000 reference period (bottom left). Simulated mean annual number of days with Tmax > 95F for the 2041-2070 future time period (bottom right). These are multi-model means from 8 NARCCAP regional climate simulations for the high (A2) emissions scenario. Note that top and bottom color scales are different. The changes are upward everywhere. Increases are smallest in the far north, and largest in the south of the region.?
Data Type:
Simulated
Variable Type:
Temperature
Region:
Source Information
Data Source(s):
Image Source:
Greg Dobson
Metadata
Metadata File(s):
Files