General Information
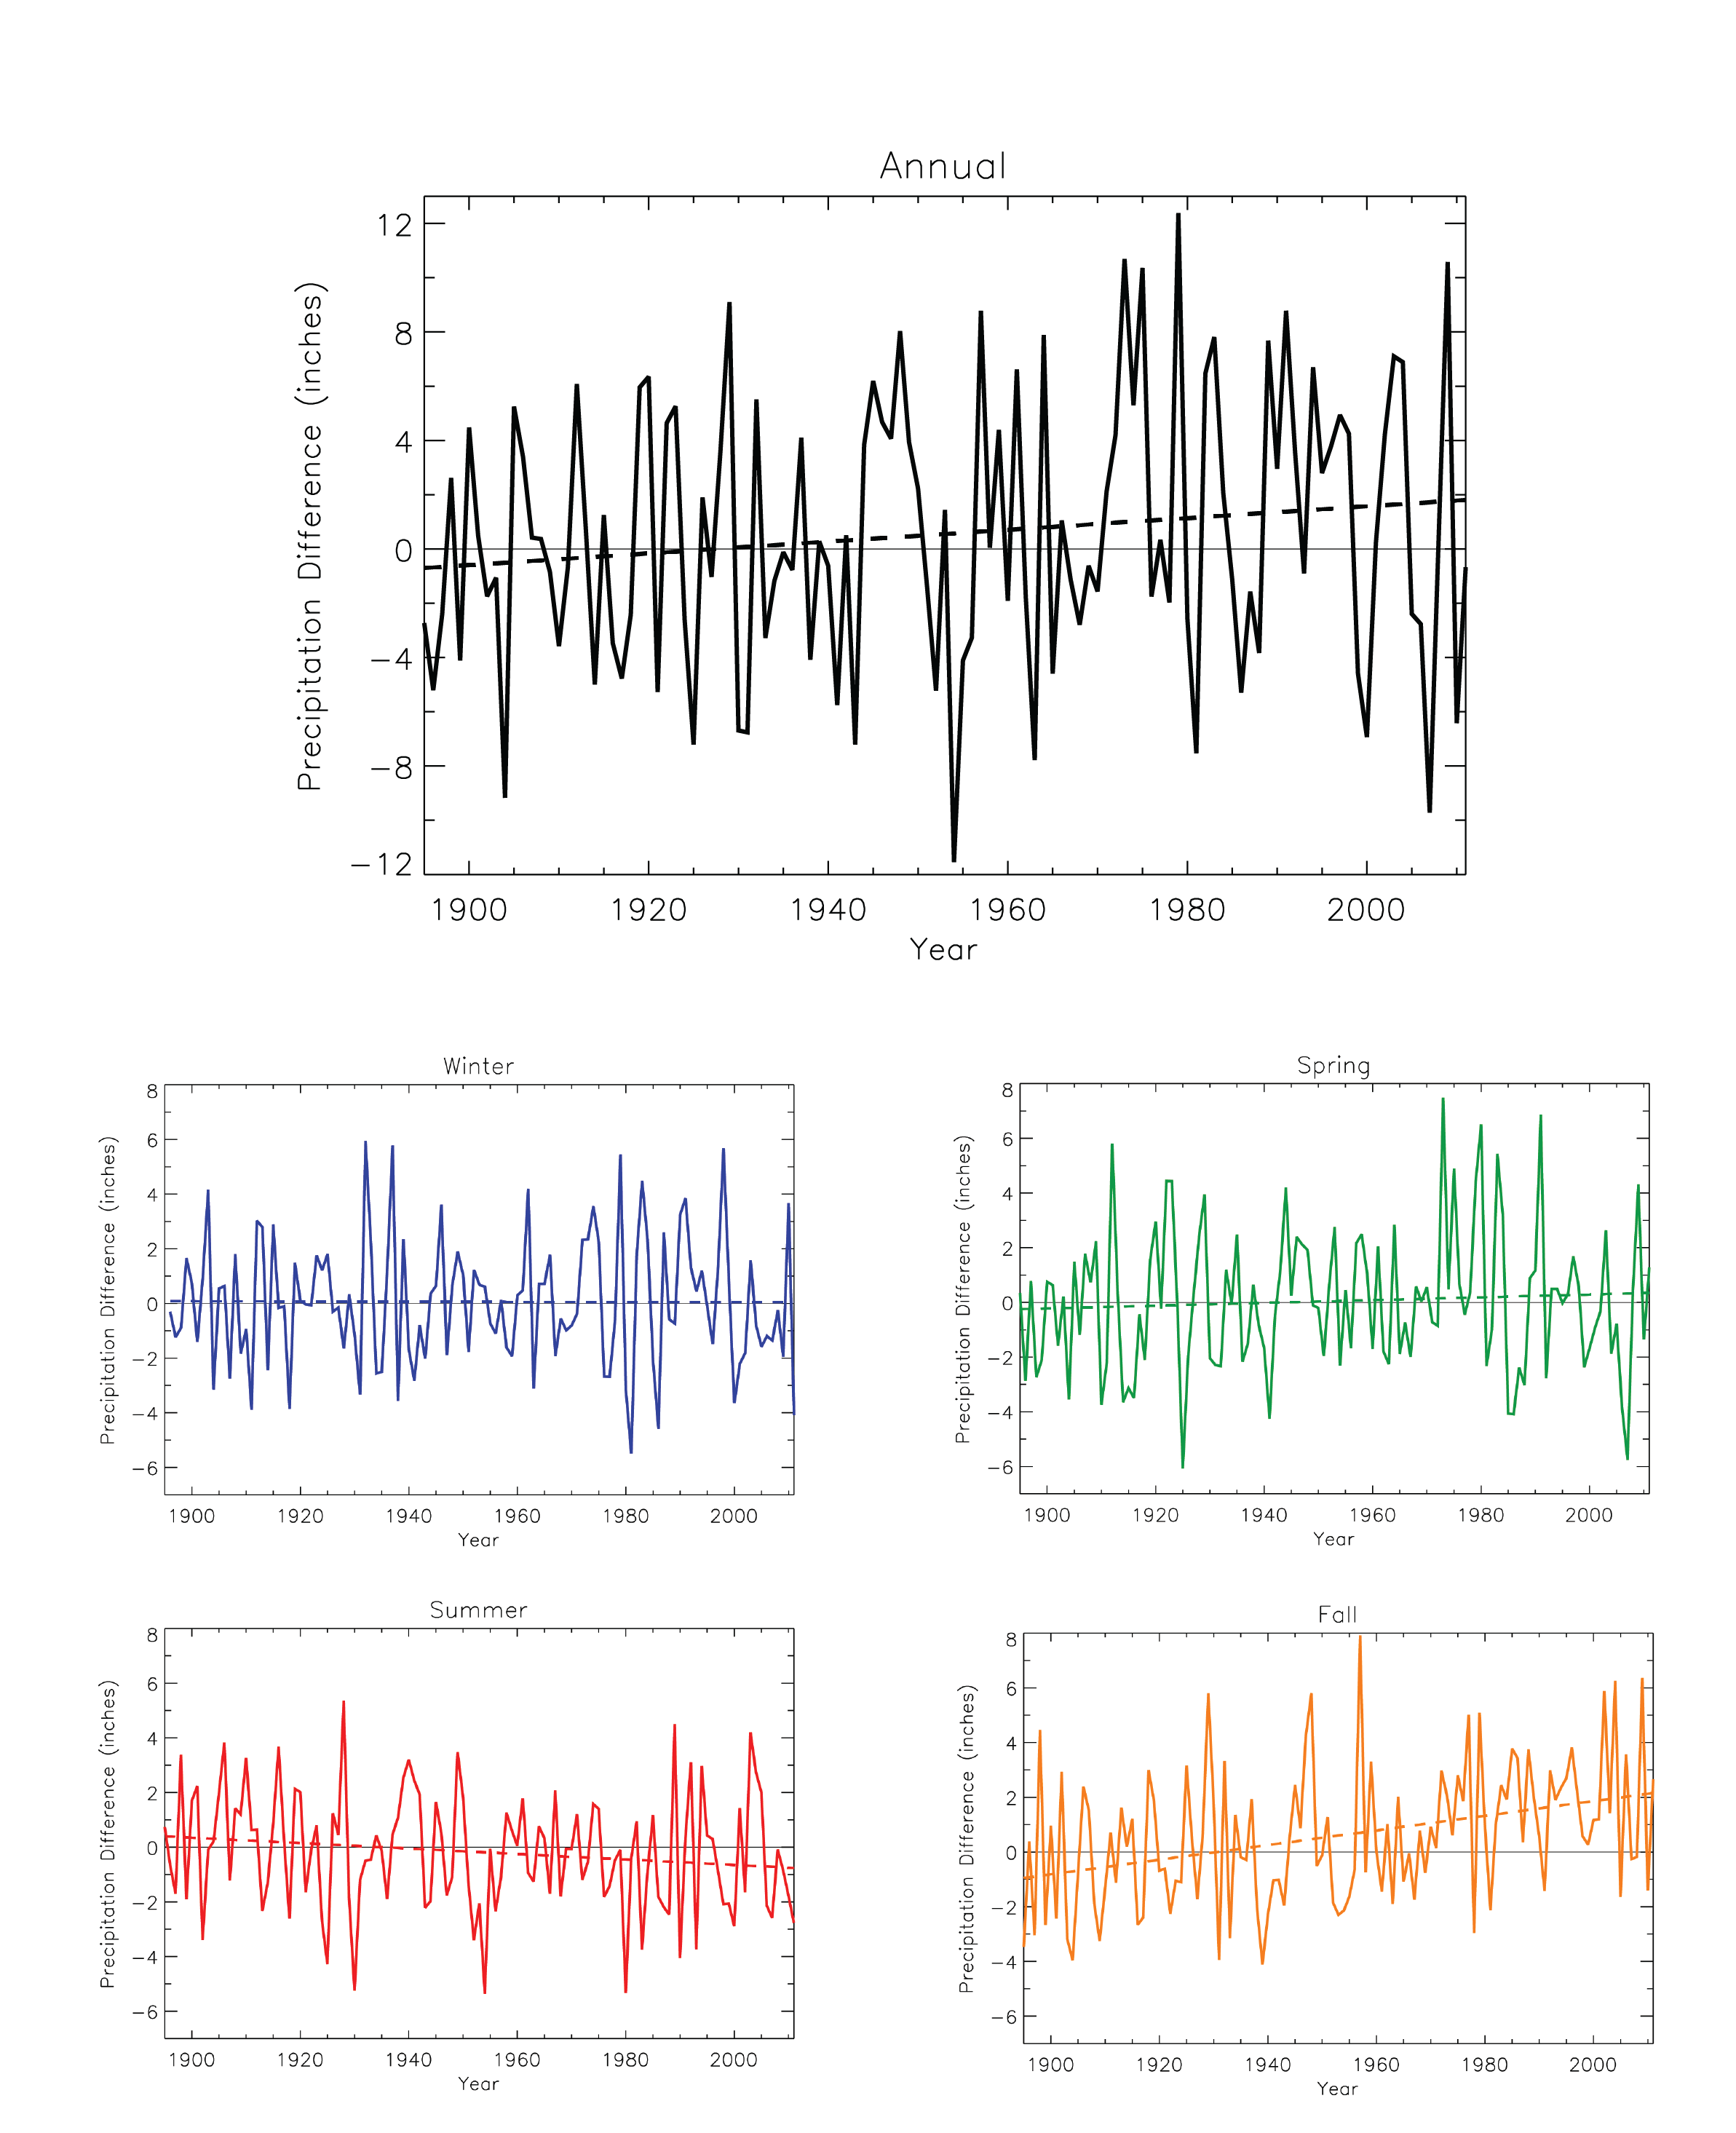
Precipitation anomaly (deviations from the 1901-1960 average, inches) for annual (black), winter (blue), spring (green), summer (red), and fall (orange), for the Southeast U.S. Dashed lines indicate the best fit by minimizing the chi-square error statistic. Based on a new gridded version of COOP data from the National Climatic Data Center, the CDDv2 data set (R. Vose, personal communication, July 27, 2012). Note that the annual time series is on a unique scale. Trends are statistically significant for the summer and fall seasons.
Data Type:
Observed
Variable Type:
Precipitation
Region:
Source Information
Data Source(s):
Image Source:
Laura Stevens
Metadata
Metadata File(s):