General Information
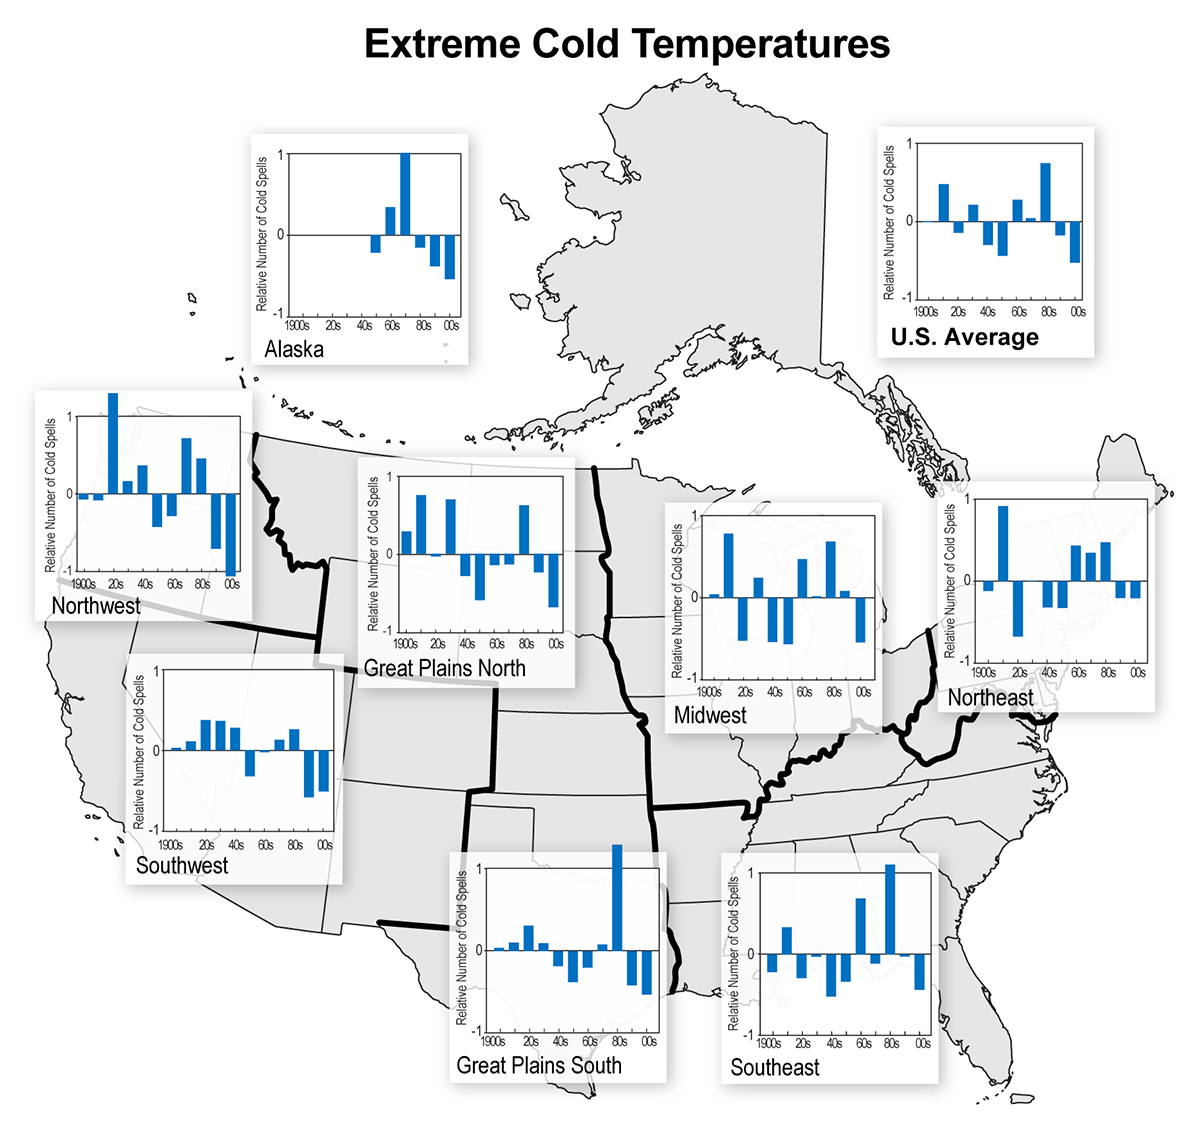
Time series (1901-2011) of decadal average values of cold wave indices for spells of 4-day duration exceeding the threshold for a 1-in-5 year recurrence, based on daily COOP data from long-term stations in the National Climatic Data Centers Global Historical Climate Network data set. Only stations with less than 10% missing daily temperature data are used in this analysis. Individual station events are first identified by sorting 4-day running average mean temperature values and selecting the top Y/R events, where Y is the number of years with data and R is the recurrence interval. Then, annual grid box values are calculated as the #events/#stations with data. Finally, regional values are calculated as the average values of the grid boxes within the region. The index values are normalized to a long-term average value of 1.0. Index values that are above (below) average are upward (downward). The horizontal labels indicate the decade. The far right bar in each graph represents the 11-year period of 2001-2011.
Data Type:
Observed
Variable Type:
Temperature
Region:
Source Information
Data Source(s):
Image Source:
Ken Kunkel
Metadata
Metadata File(s):
Files