General Information
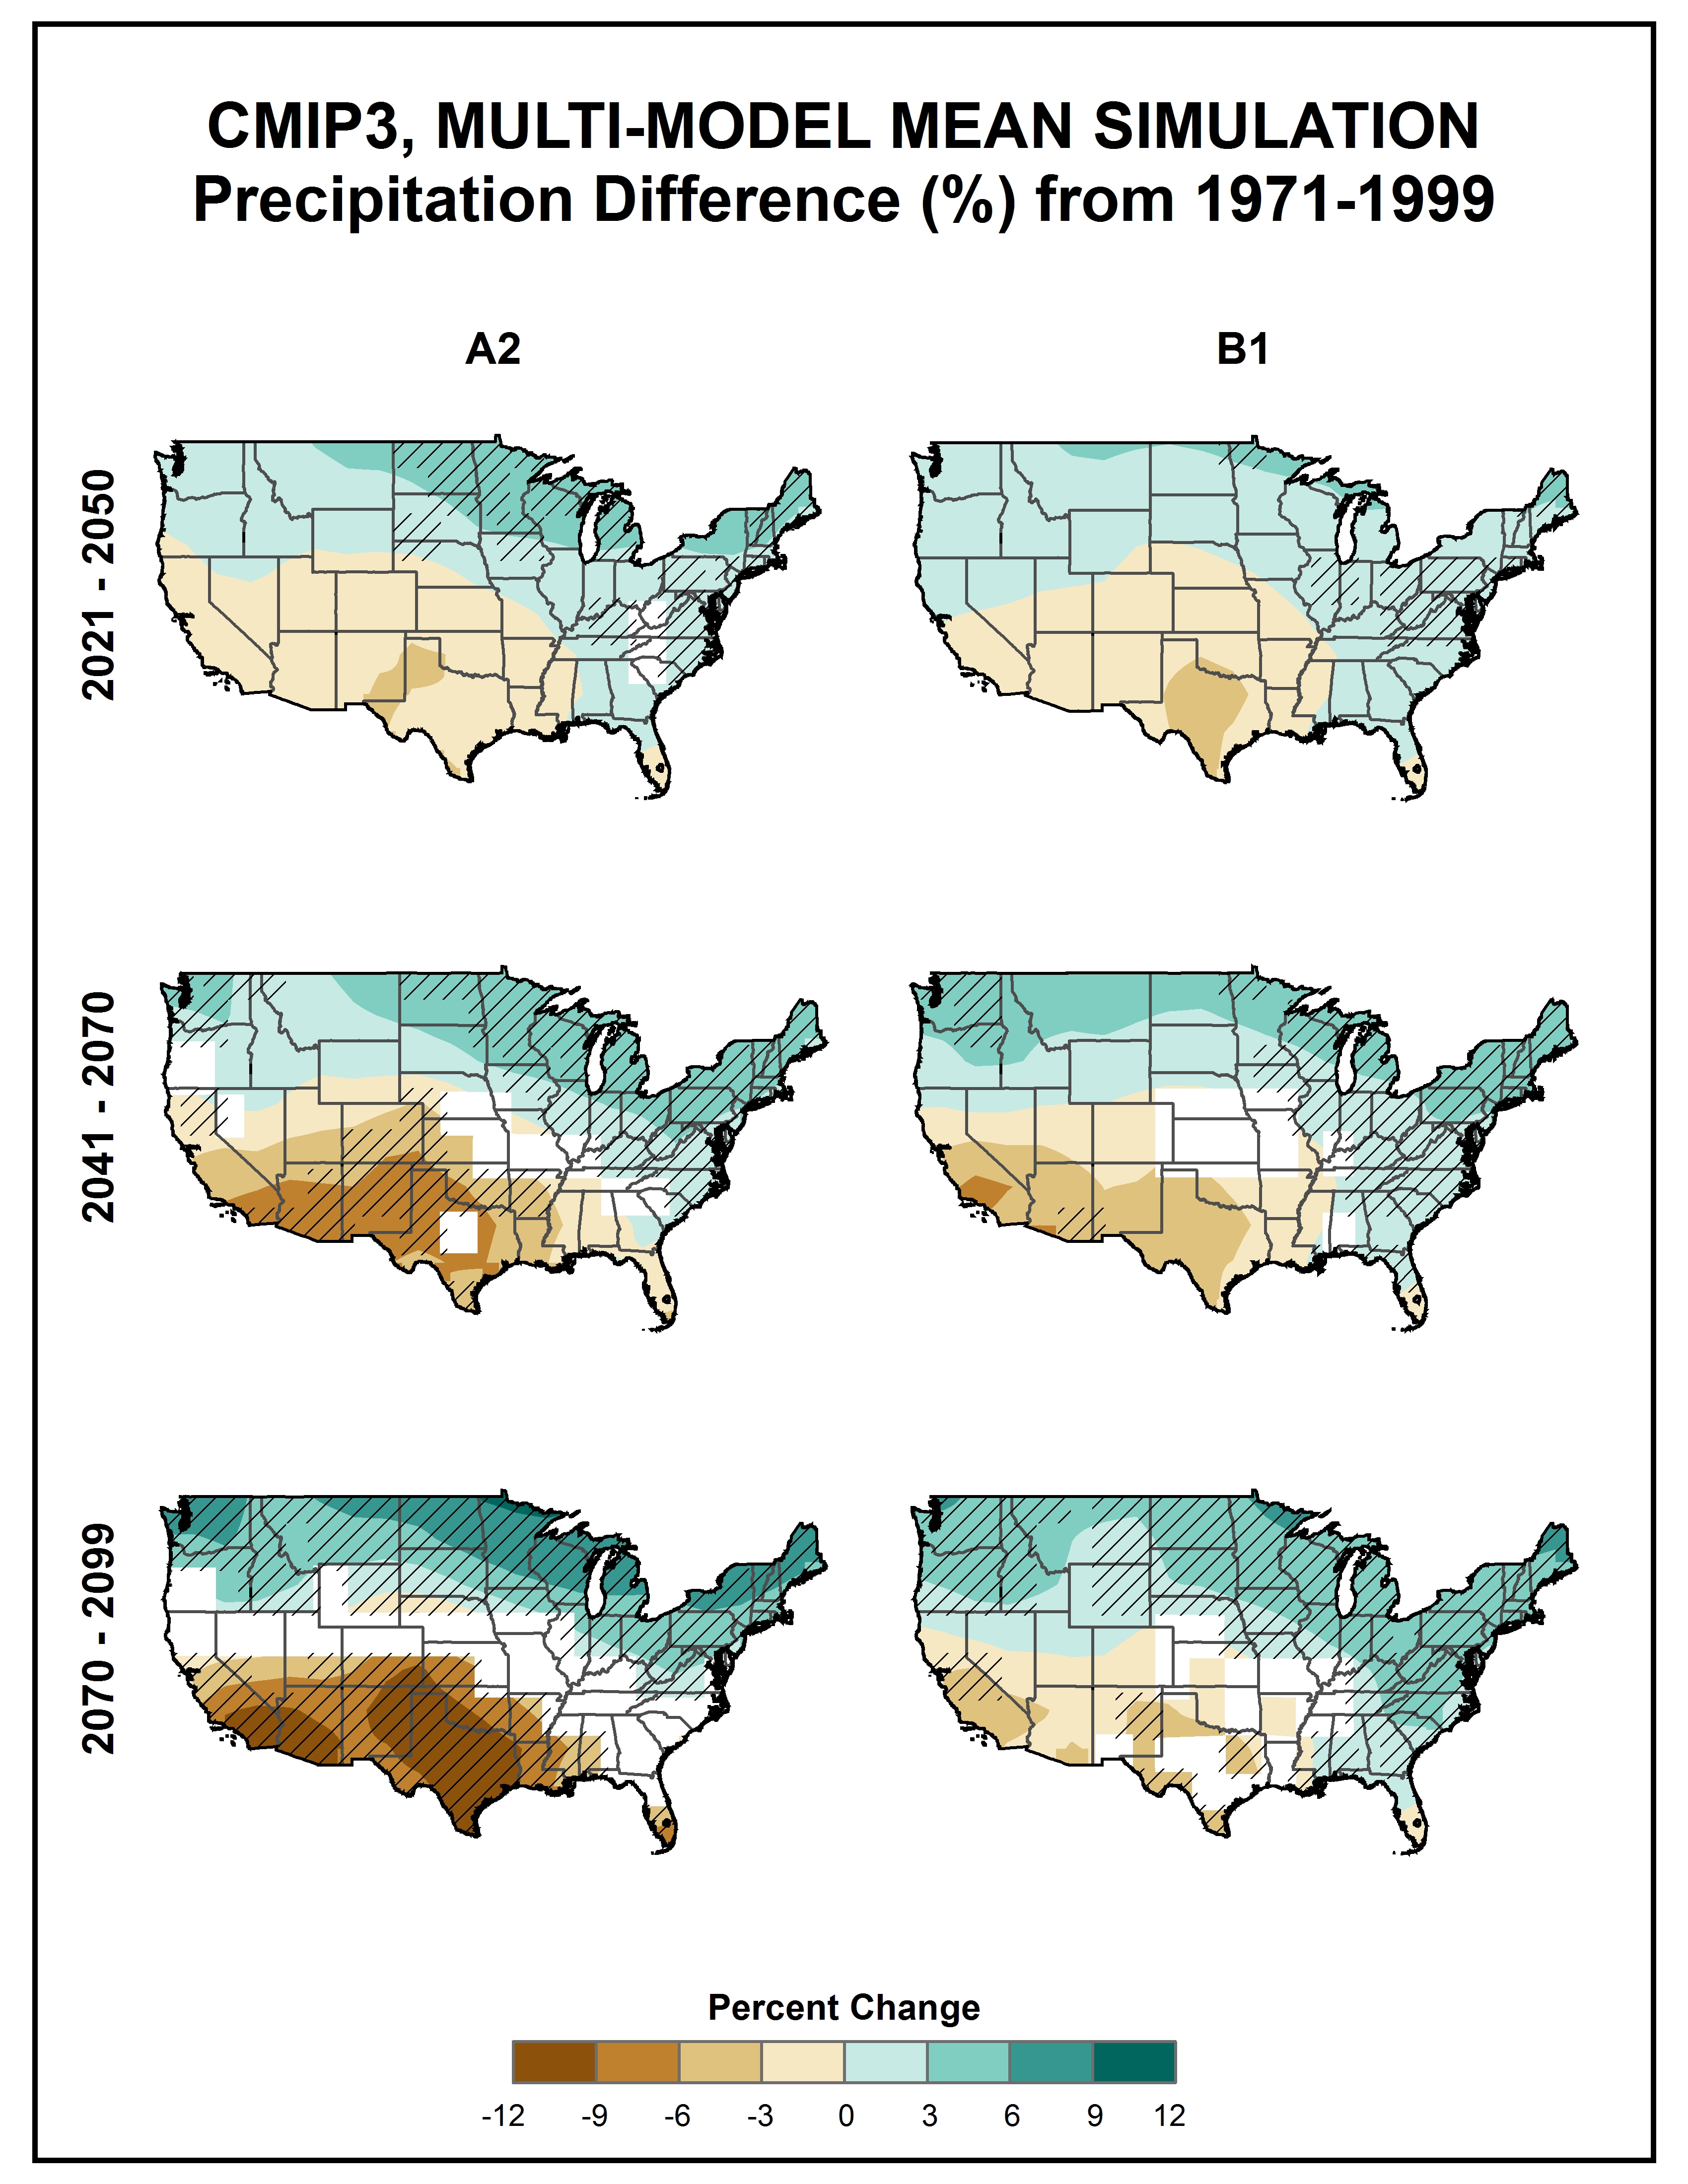
Simulated difference in annual mean precipitation (%) for the contiguous United States, for each future time period (2021-2050, 2041-2070, and 2070-2099) with respect to the reference period of 1971-1999. These are multi-model means for the high (A2) and low (B1) emissions scenarios from the 14 (B1) or 15 (A2) CMIP3 global climate simulations. Color only (category 1) indicates that less than 50% of the models show a statistically significant change in precipitation. Color with hatching (category 3) indicates that more than 50% of the models show a statistically significant change in precipitation, and more than 67% agree on the sign of the change. Whited out areas (category 2) indicate that more than 50% of the models show a statistically significant change in precipitation, but less than 67% agree of the sign of the change (see text). Generally, the models simulate increases in the north and decreases in the south of the U.S.
Data Type:
Simulated
Variable Type:
Precipitation
Region:
Source Information
Data Source(s):
Image Source:
Greg Dobson
Metadata
Metadata File(s):
Files