General Information
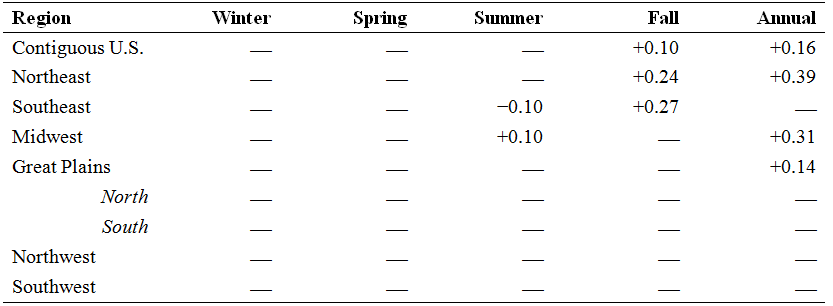
1895-2011 trends in precipitation anomaly (inches/decade) based on a new gridded version of COOP data from the National Climatic Data Center, the CDDv2 data set (R. Vose, personal communication, July 27, 2012) for the six NCA regions of the continental U.S. (including the northern and southern Great Plains), for each season as well as the year as a whole. Only values statistically significant at the 95% confidence level are displayed. Statistical significance of trends was assessed using Kendalls tau coefficient. The test using tau is a non-parametric hypothesis test.
Data Type:
Observed
Variable Type:
Precipitation
Region:
Source Information
Data Source(s):
Image Source:
Laura Stevens
Metadata
Metadata File(s):
Files