General Information
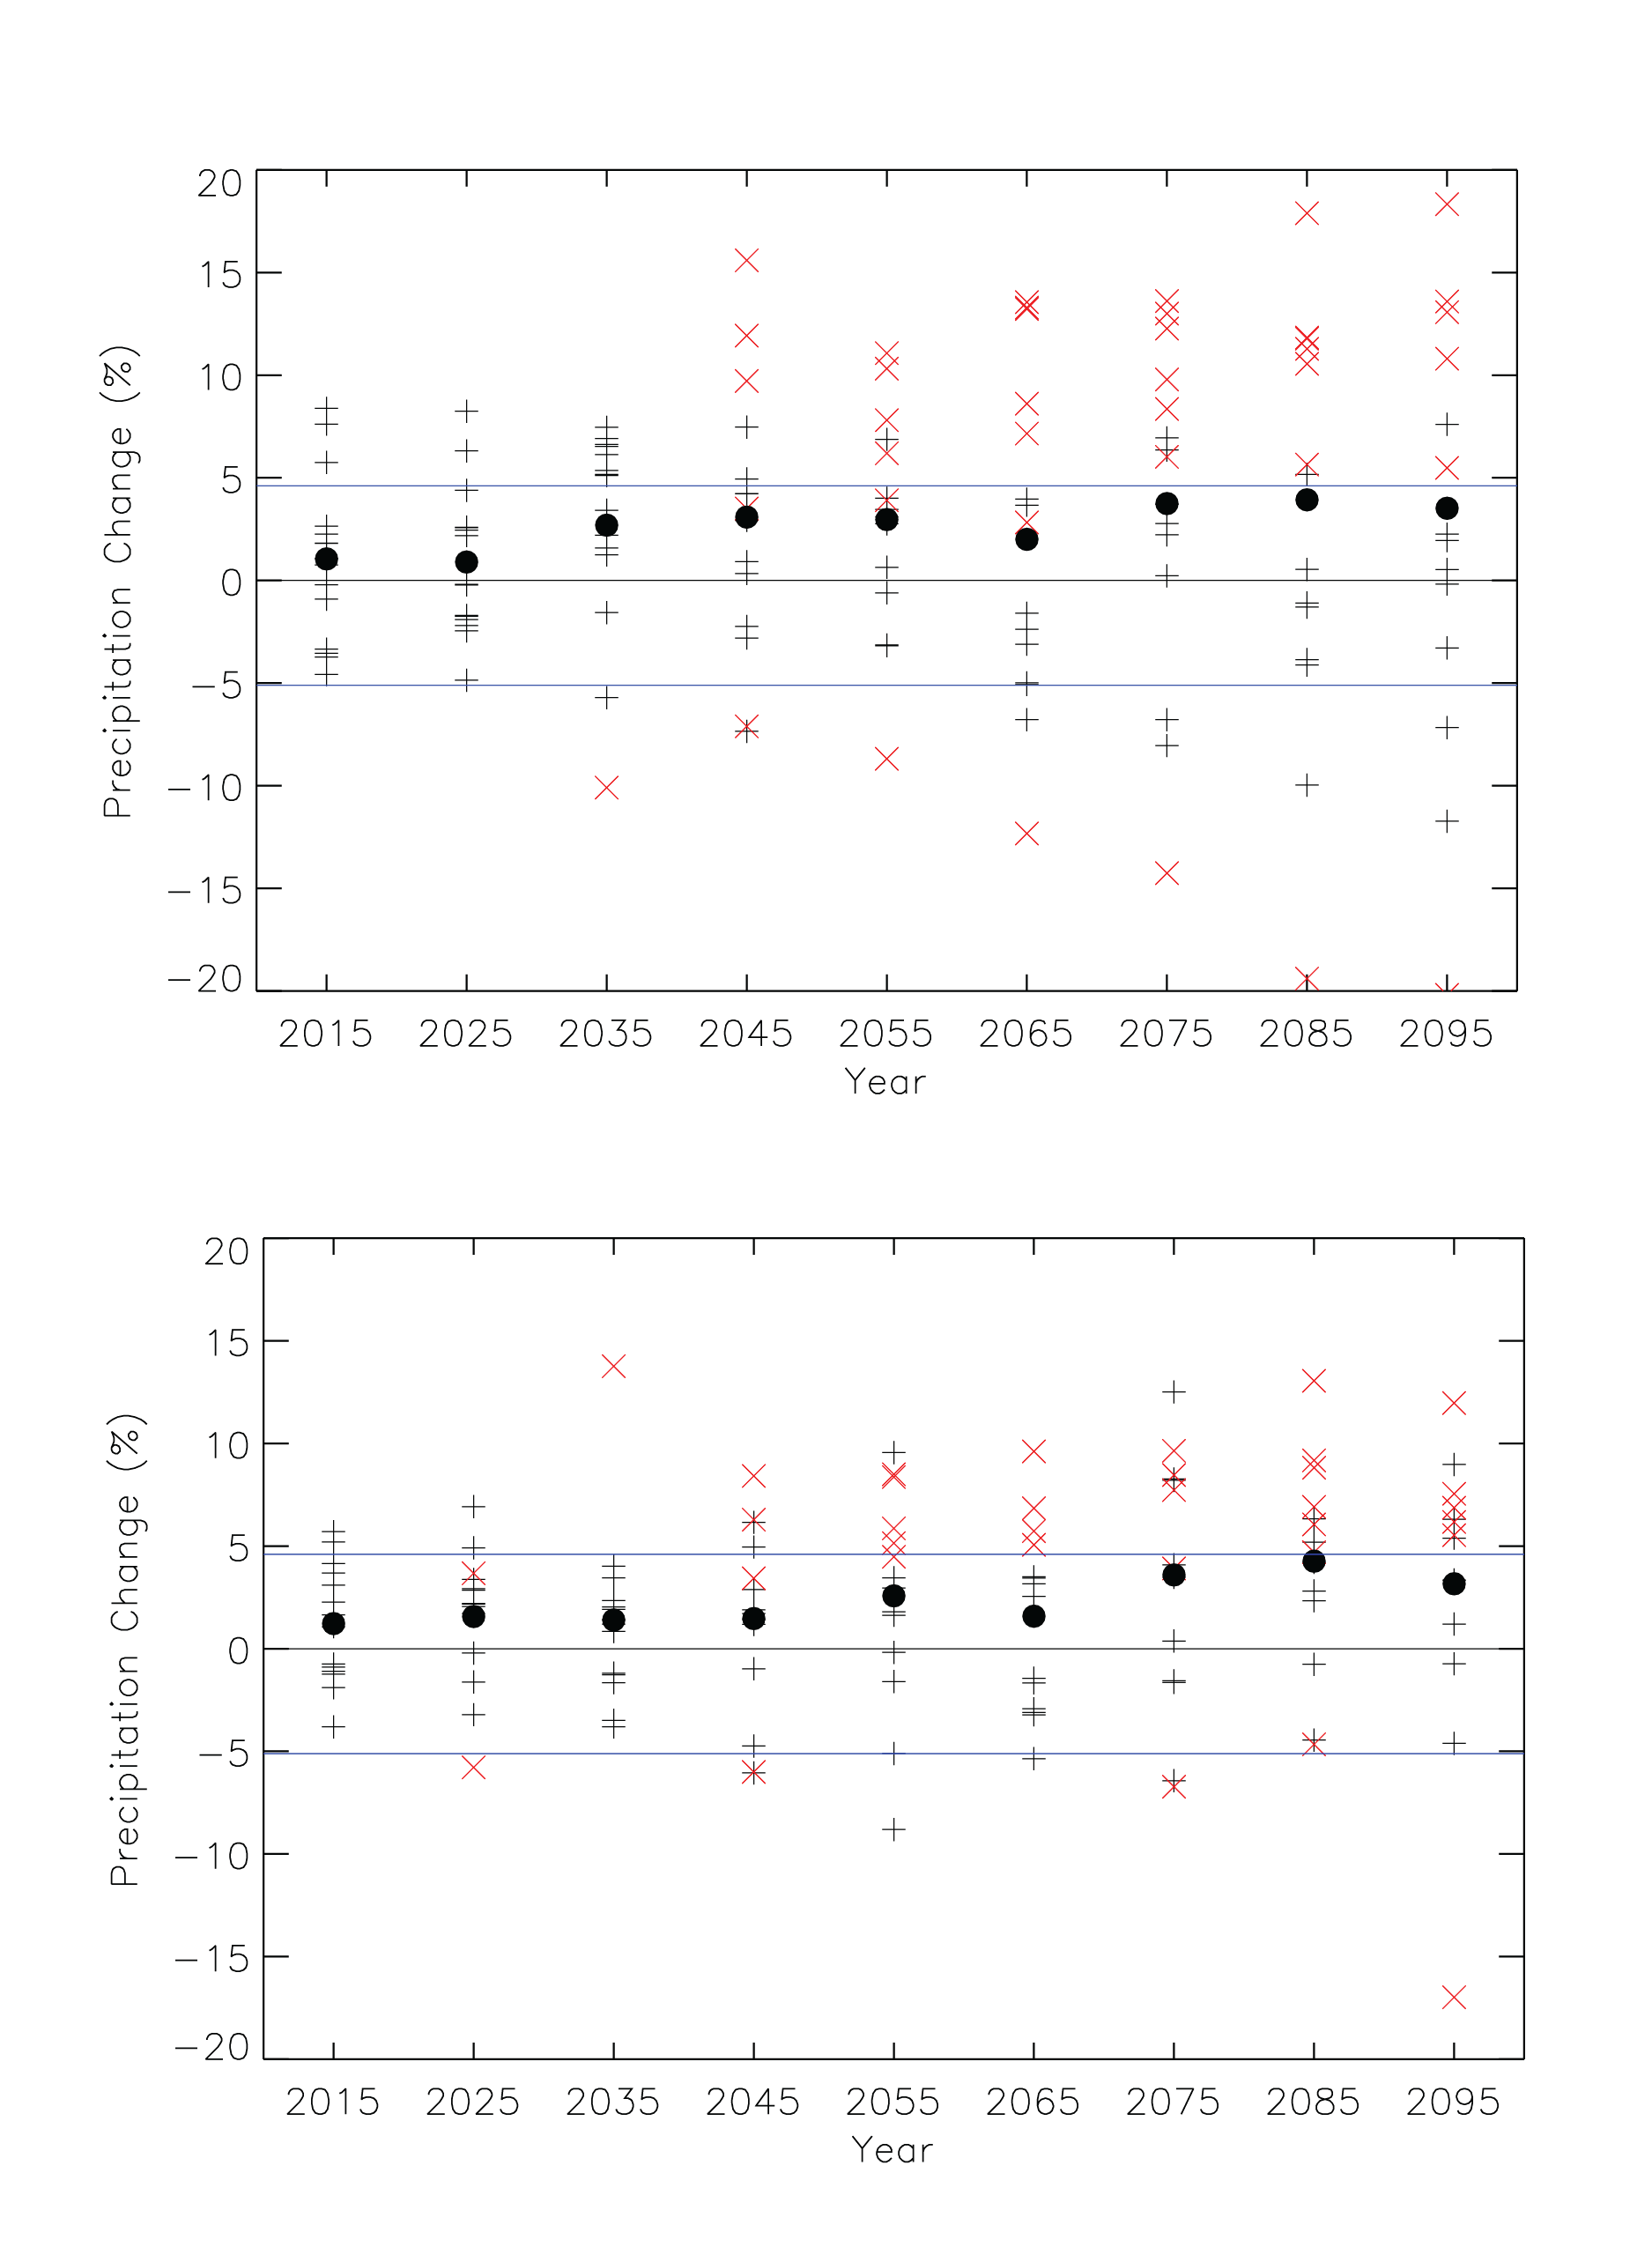
Simulated decadal mean change in annual precipitation (%) for the Midwest U.S. for each future decadal time period (represented by their approximate midpoints, e.g., 2015 = 2011-2020), with respect to the reference period of 2001-2010. Values are given for the high (A2, top) and low (B1, bottom) emissions scenarios for the 14 (B1) or 15 (A2) CMIP3 models. Large circles depict the multi-model means. Each individual model is represented by a black plus sign (+), or a red x if the value is statistically significant at the 95% confidence level. Blue lines indicate the 10th and 90th percentiles of the 30 annual anomaly values from 1981-2010. Many models simulate precipitation changes that are not statistically significant out to the end of the 21st century.
Data Type:
Simulated
Variable Type:
Precipitation
Region:
Source Information
Data Source(s):
Image Source:
Laura Stevens
Metadata
Metadata File(s):
Files