General Information
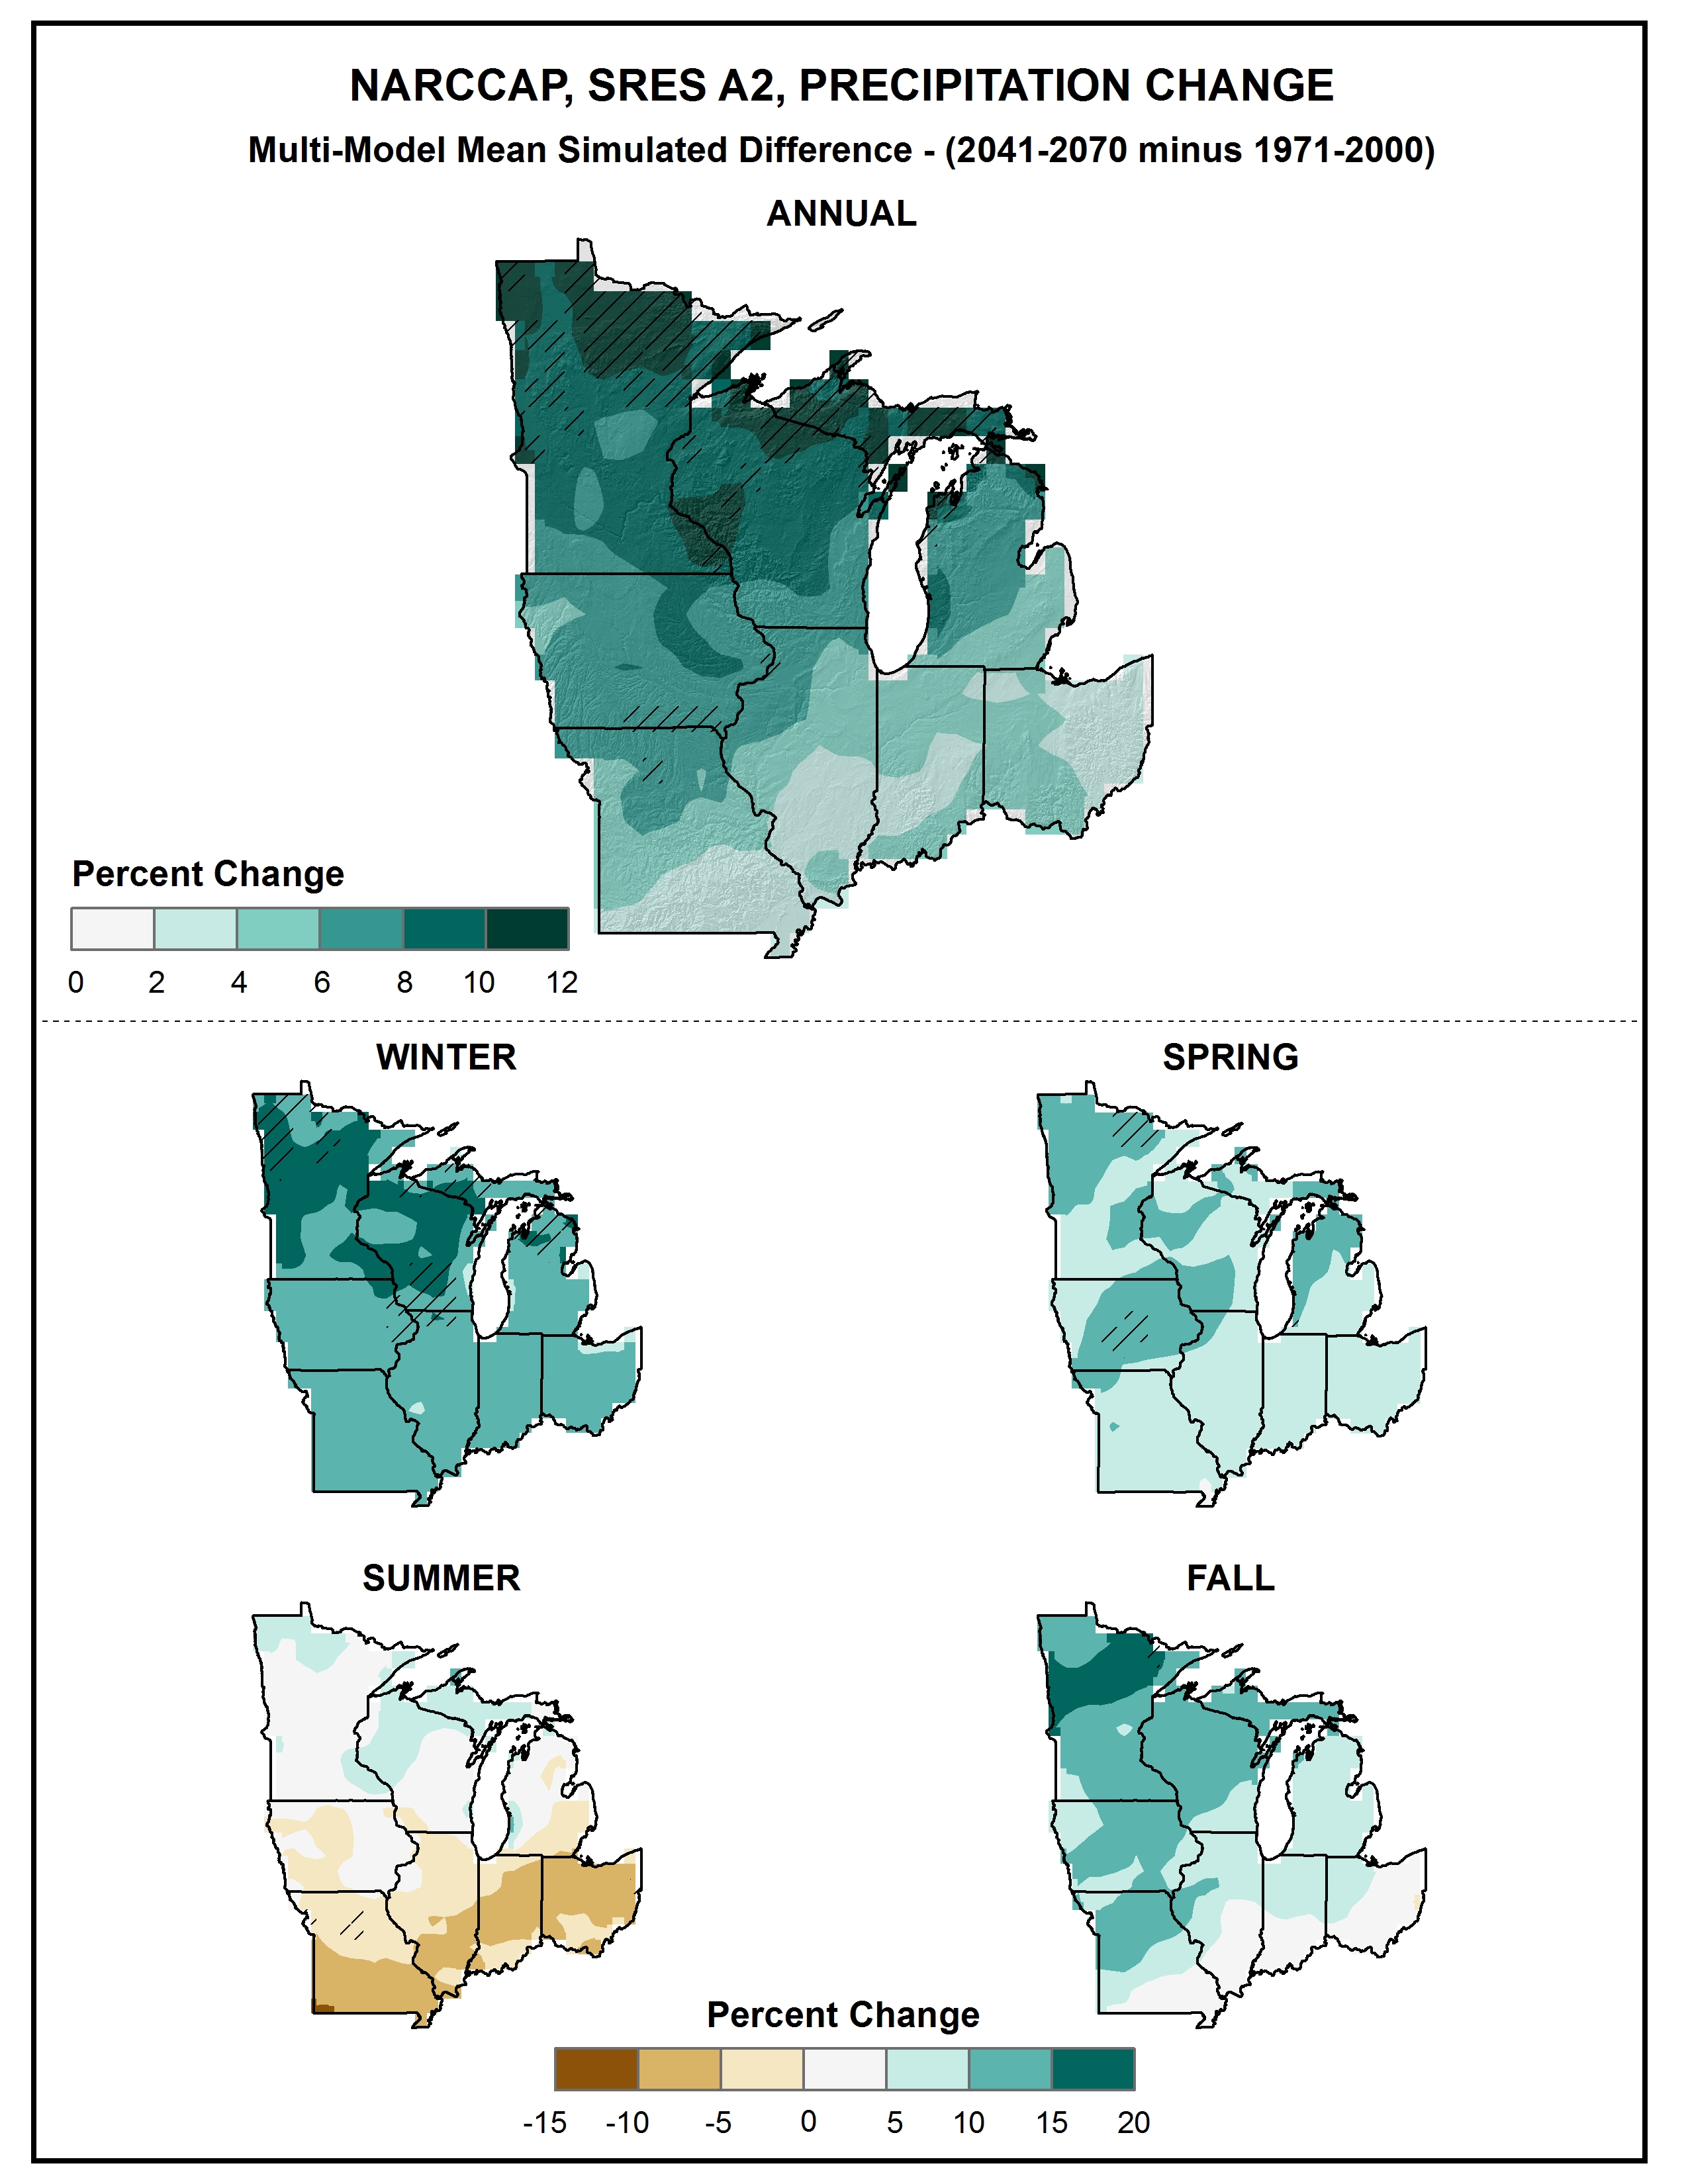
Simulated difference in mean annual and seasonal precipitation (%) for the Midwest region, for 2041-2070 with respect to the reference period of 1971-2000. These are multi-model means from 11 NARCCAP regional climate simulations for the high (A2) emissions scenario. Color only (category 1) indicates that less than 50% of the models show a statistically significant change in precipitation. Color with hatching (category 3) indicates that more than 50% of the models show a statistically significant change in precipitation, and more than 67% agree on the sign of the change (see text). Note that the top and bottom color scales are unique, and different from that of Fig. 40. Grid boxes whose centers are over the Great Lakes or outside the 8-state region are masked out. The annual change is near zero in the south and an increase of 5-10% in much of the north. Changes are mostly upward in the winter, spring, and fall, and downward in summer in the south, but are not statistically significant for most models.
Data Type:
Simulated
Variable Type:
Precipitation
Region:
Source Information
Data Source(s):
Image Source:
Greg Dobson
Metadata
Metadata File(s):
Files