General Information
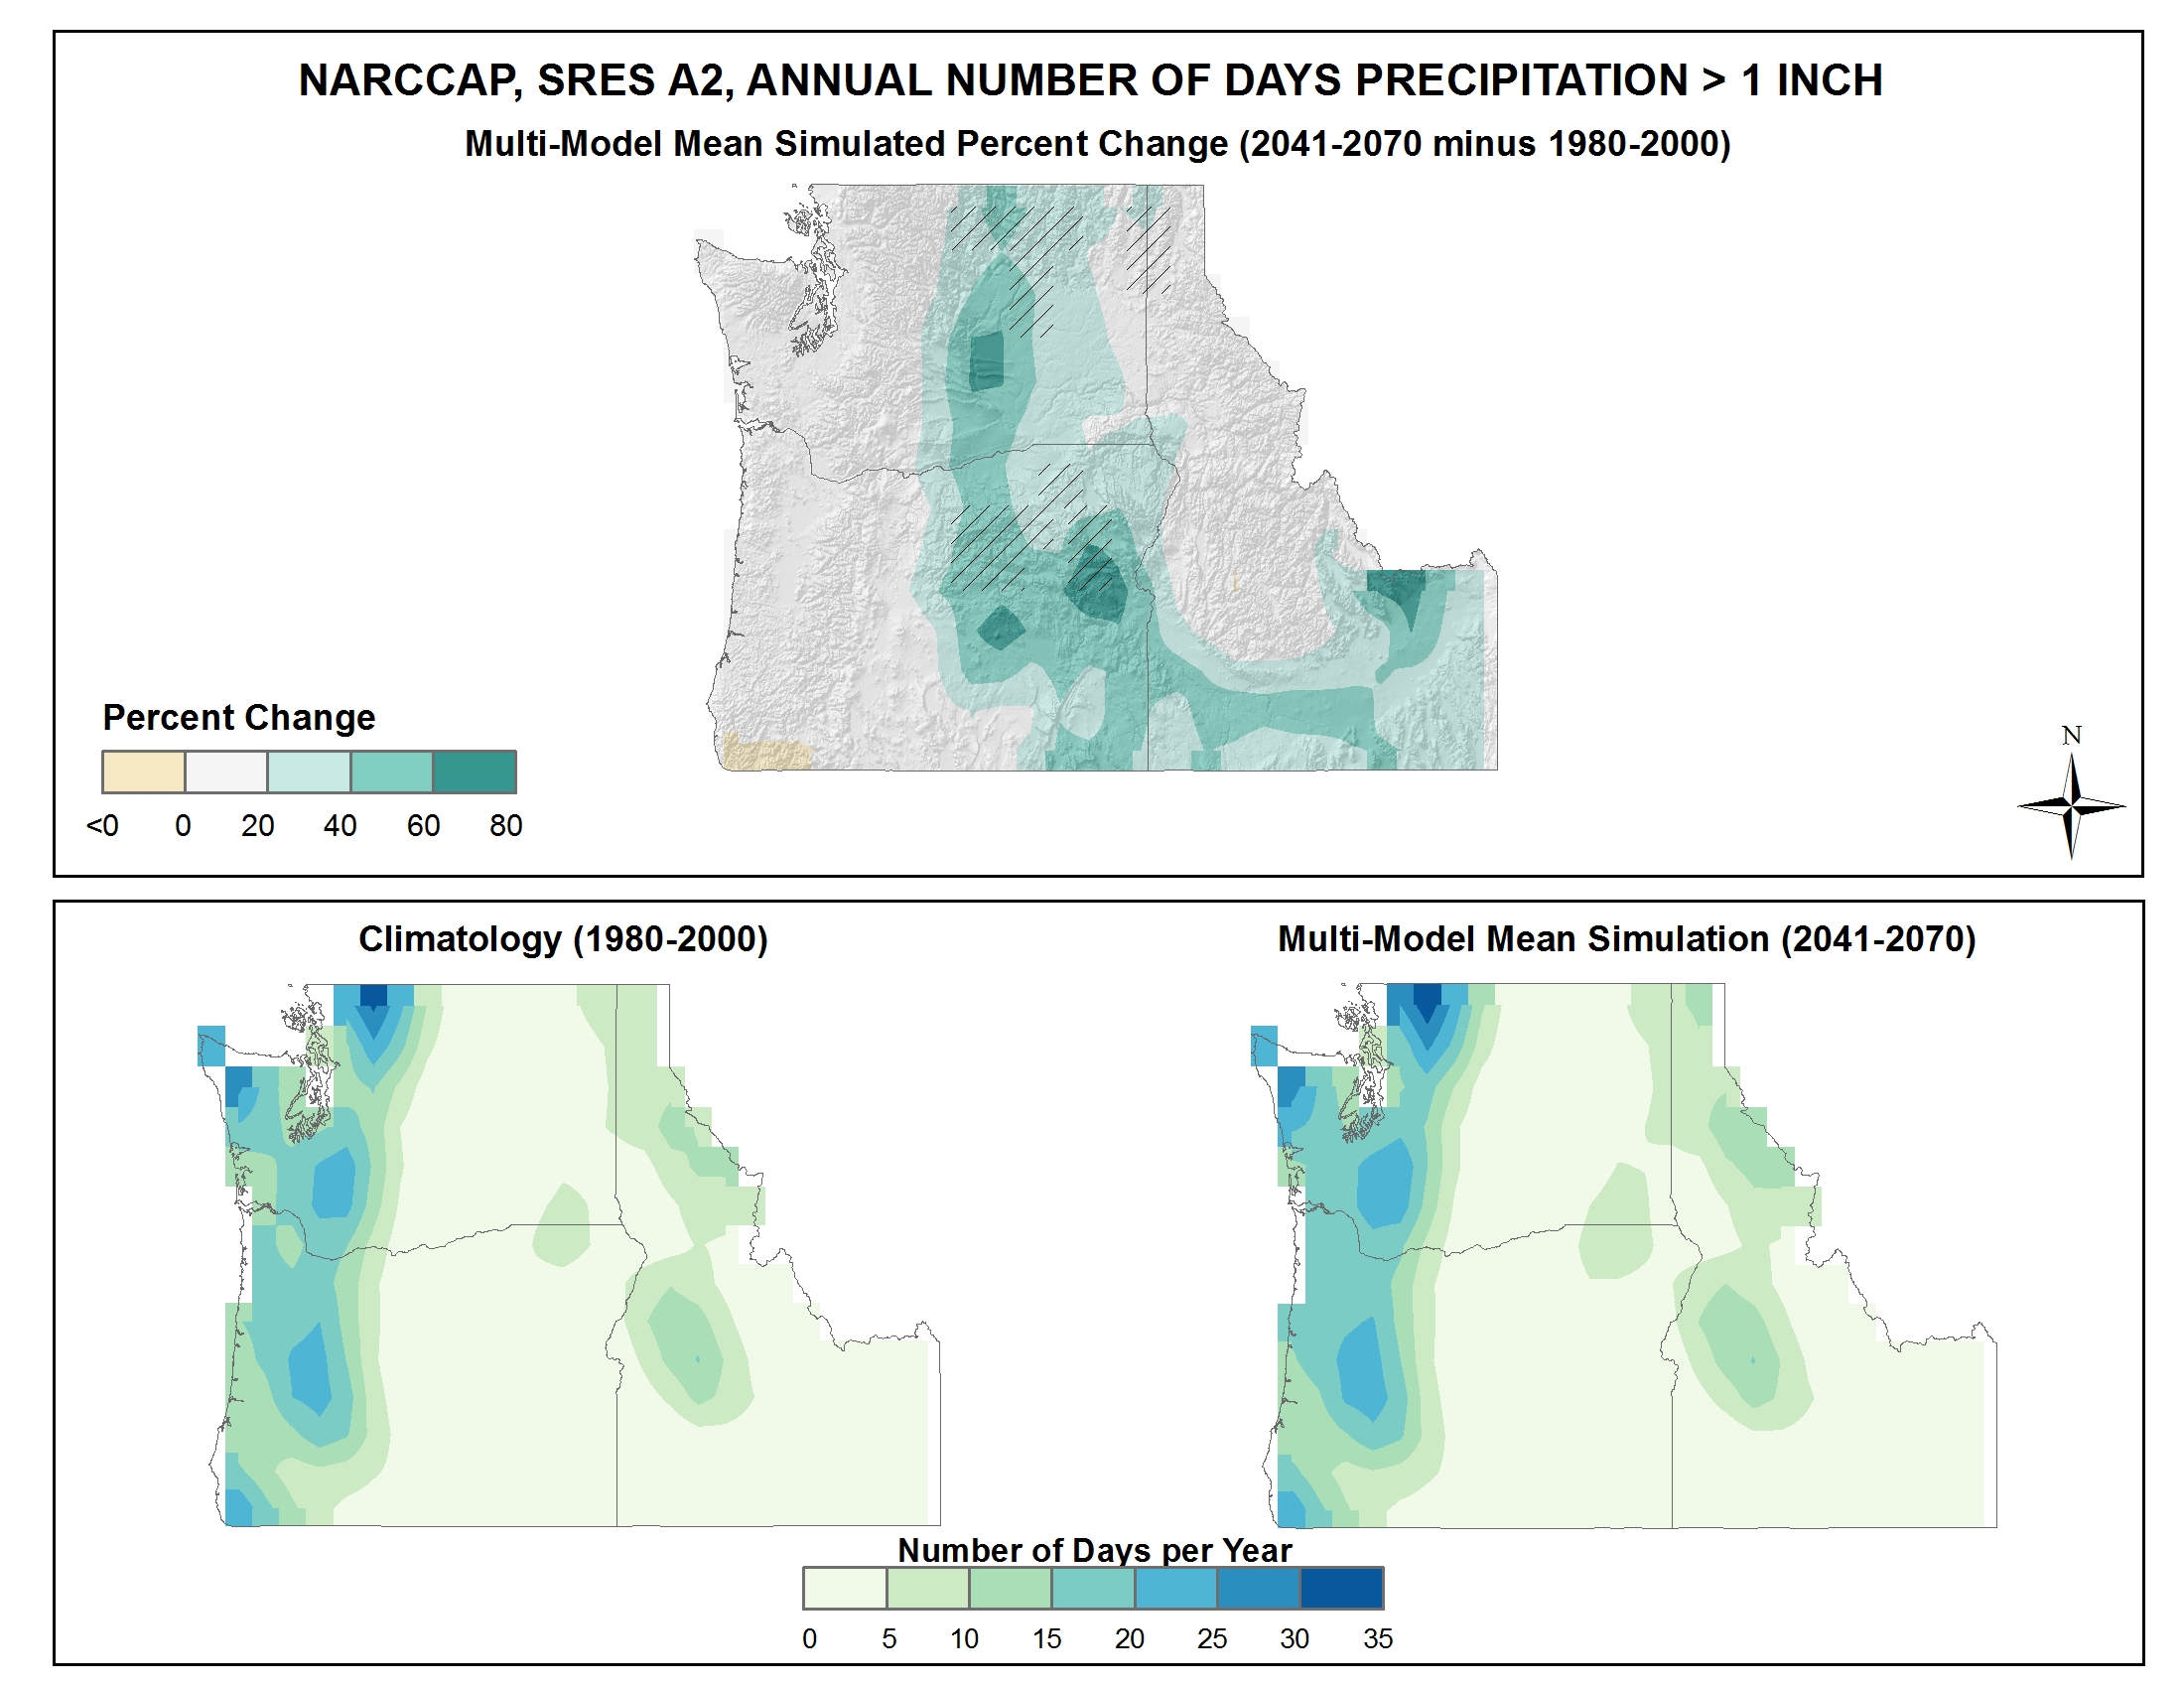
Simulated percentage difference in the mean annual number of days with precipitation of greater than one inch for the Northwest region, for the 2041-2070 time period with respect to the reference period of 1980-2000 (top). Color only (category 1) indicates that less than 50% of the models show a statistically significant change in the number of days. Color with hatching (category 3) indicates that more than 50% of the models show a statistically significant change in the number of days, and more than 67% agree on the sign of the change (see text). Mean annual number of days with precipitation of greater than one inch for the 1980-2000 reference period (bottom left). Simulated mean annual number of days with precipitation of greater than one inch for the 2041-2070 future time period (bottom right). These are multi-model means from 8 NARCCAP regional climate simulations for the high (A2) emissions scenario. The models simulate increases over most of the region.
Data Type:
Simulated
Variable Type:
Precipitation
Region:
Source Information
Data Source(s):
Image Source:
Greg Dobson
Metadata
Metadata File(s):
Files