General Information
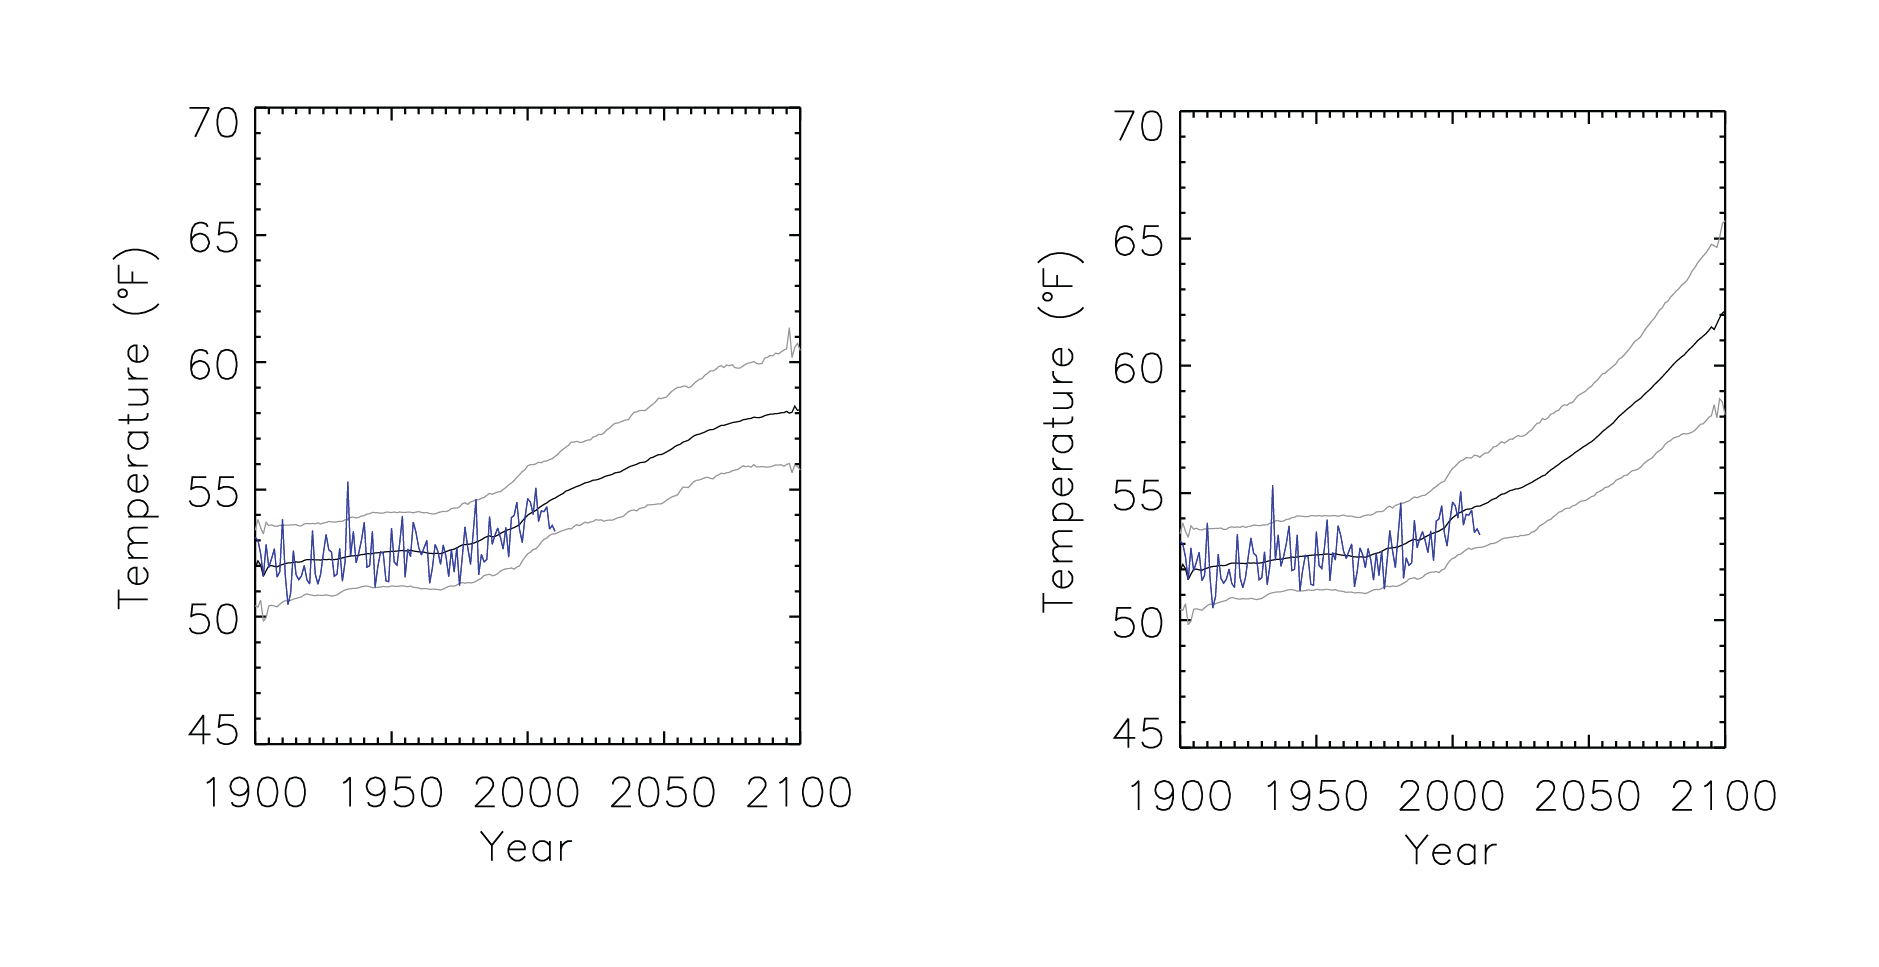
Time series of mean annual temperature for the Southwest region from observations (blue) and from all available CMIP3 global climate model simulations (black and grey). Black represents the mean and grey indicates the 5 and 95% limits of the model simulations. Model mean and percentile limits were calculated for each year separately and then smoothed. Results are shown for the low (B1) emissions scenario (left) and the high (A2) emissions scenario (right). A total of 74 simulations of the 20th century were used. For the 21st century, there were 40 simulations for the high emissions scenario and 32 for the low emissions scenario. For each model simulation, the annual temperature values were first transformed into anomalies by subtracting the simulations 1901-1960 average from each annual value. Then, the mean bias between model and observations was removed by adding the observed 1901-1960 average to each annual anomaly value from the simulation. For each year, all available model simulations were used to calculate the multi-model mean and the 5th and 95th percentile bounds for that year. Then, the mean and 5th and 95th percentile values were smoothed with a 10-year moving boxcar average.
Data Type:
Observed
Simulated
Variable Type:
Temperature
Region:
Metadata
Metadata File(s):
Files