General Information
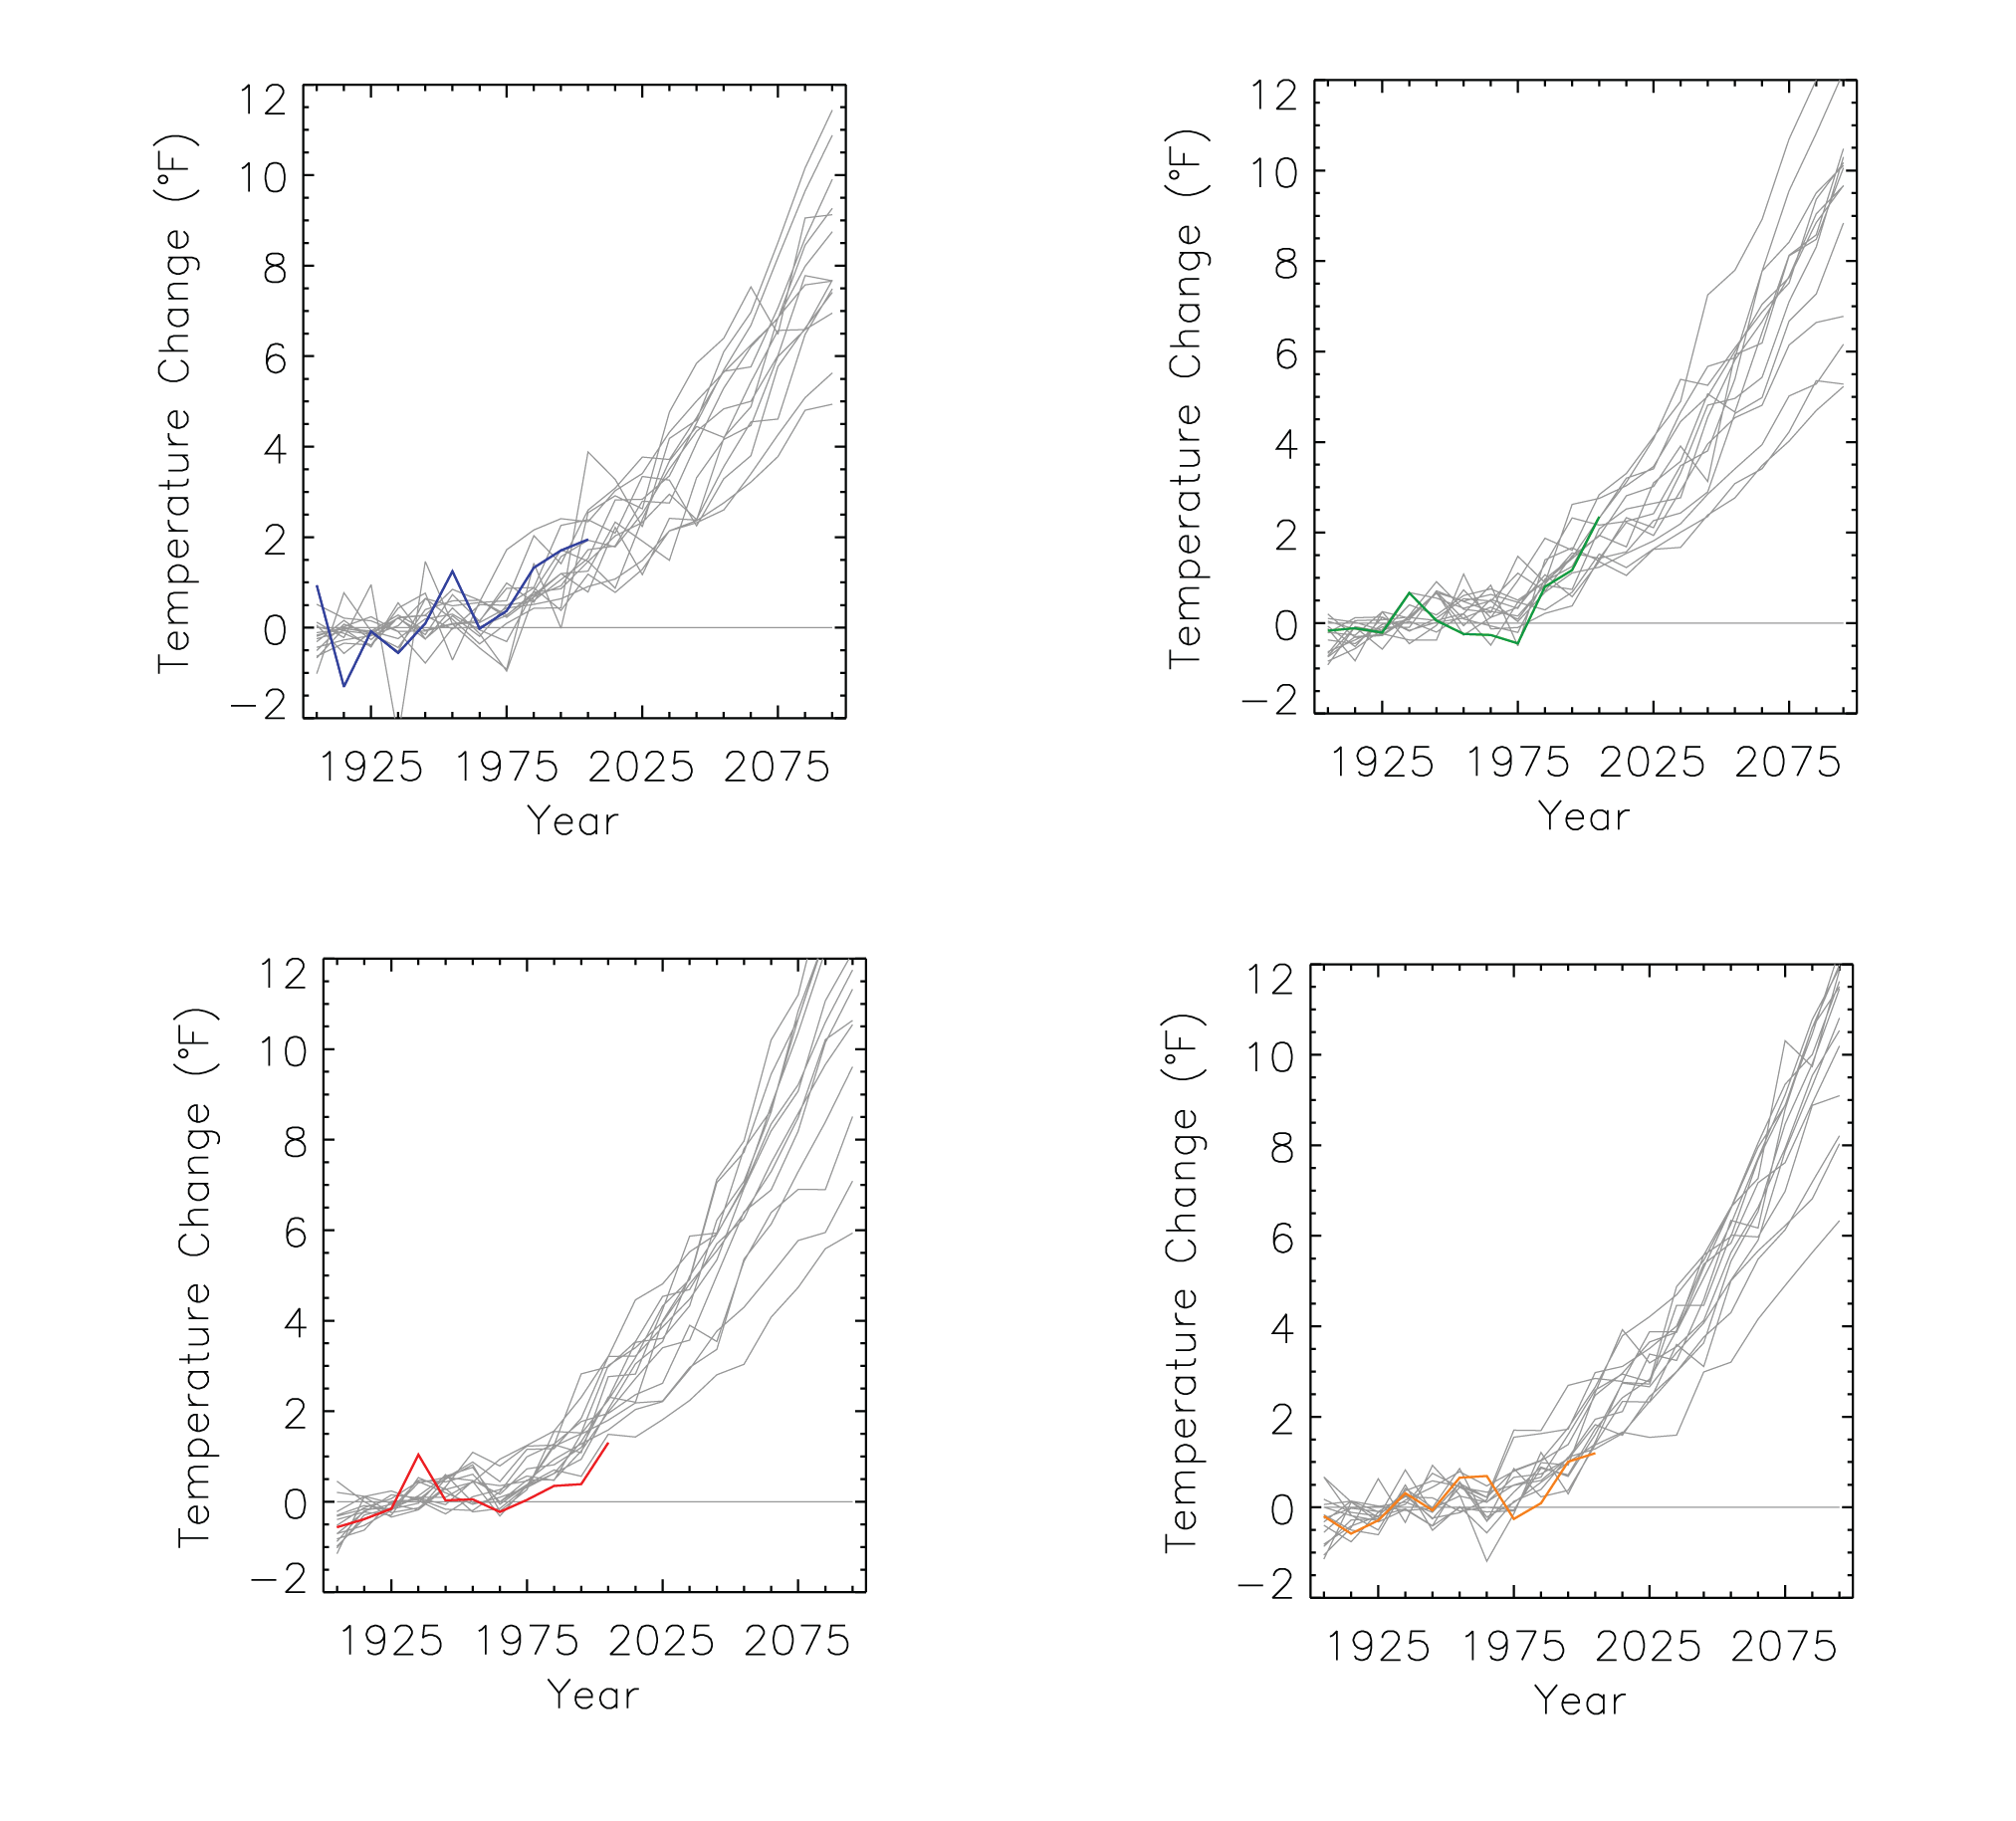
Observed decadal mean temperature change (deviations from the 1901-1960 average, F) for the Southwest U.S. for winter (top left, blue line), spring (top right, green line), summer (bottom left red line), and fall (bottom right, orange line). Based on a new gridded version of COOP data from the National Climatic Data Center, the CDDv2 data set (R. Vose, personal communication, July 27, 2012). Gray lines indicate 20th and 21st century simulations from 15 CMIP3 models, for the high (A2) emissions scenario. The observed amount of 20th century warming is generally within the envelope of model simulations.
Data Type:
Observed
Simulated
Variable Type:
Temperature
Region:
Metadata
Metadata File(s):
Files