General Information
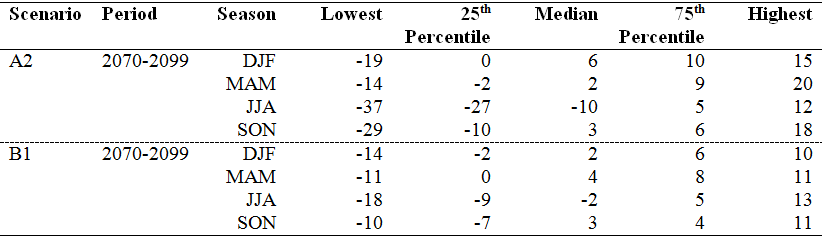
Distribution of the simulated change in seasonal mean precipitation (%) from the 14 (B1) or 15 (A2) CMIP3 models for the Great Plains region. The lowest, 25th percentile, median, 75th percentile and highest values are given for the high (A2) and low (B1) emissions scenarios, and for the 2070-2099 time period with respect to the reference period of 1971-1999.
Data Type:
Simulated
Variable Type:
Precipitation
Region:
Source Information
Data Source(s):
Image Source:
Laura Stevens
Metadata
Metadata File(s):
Files