General Information
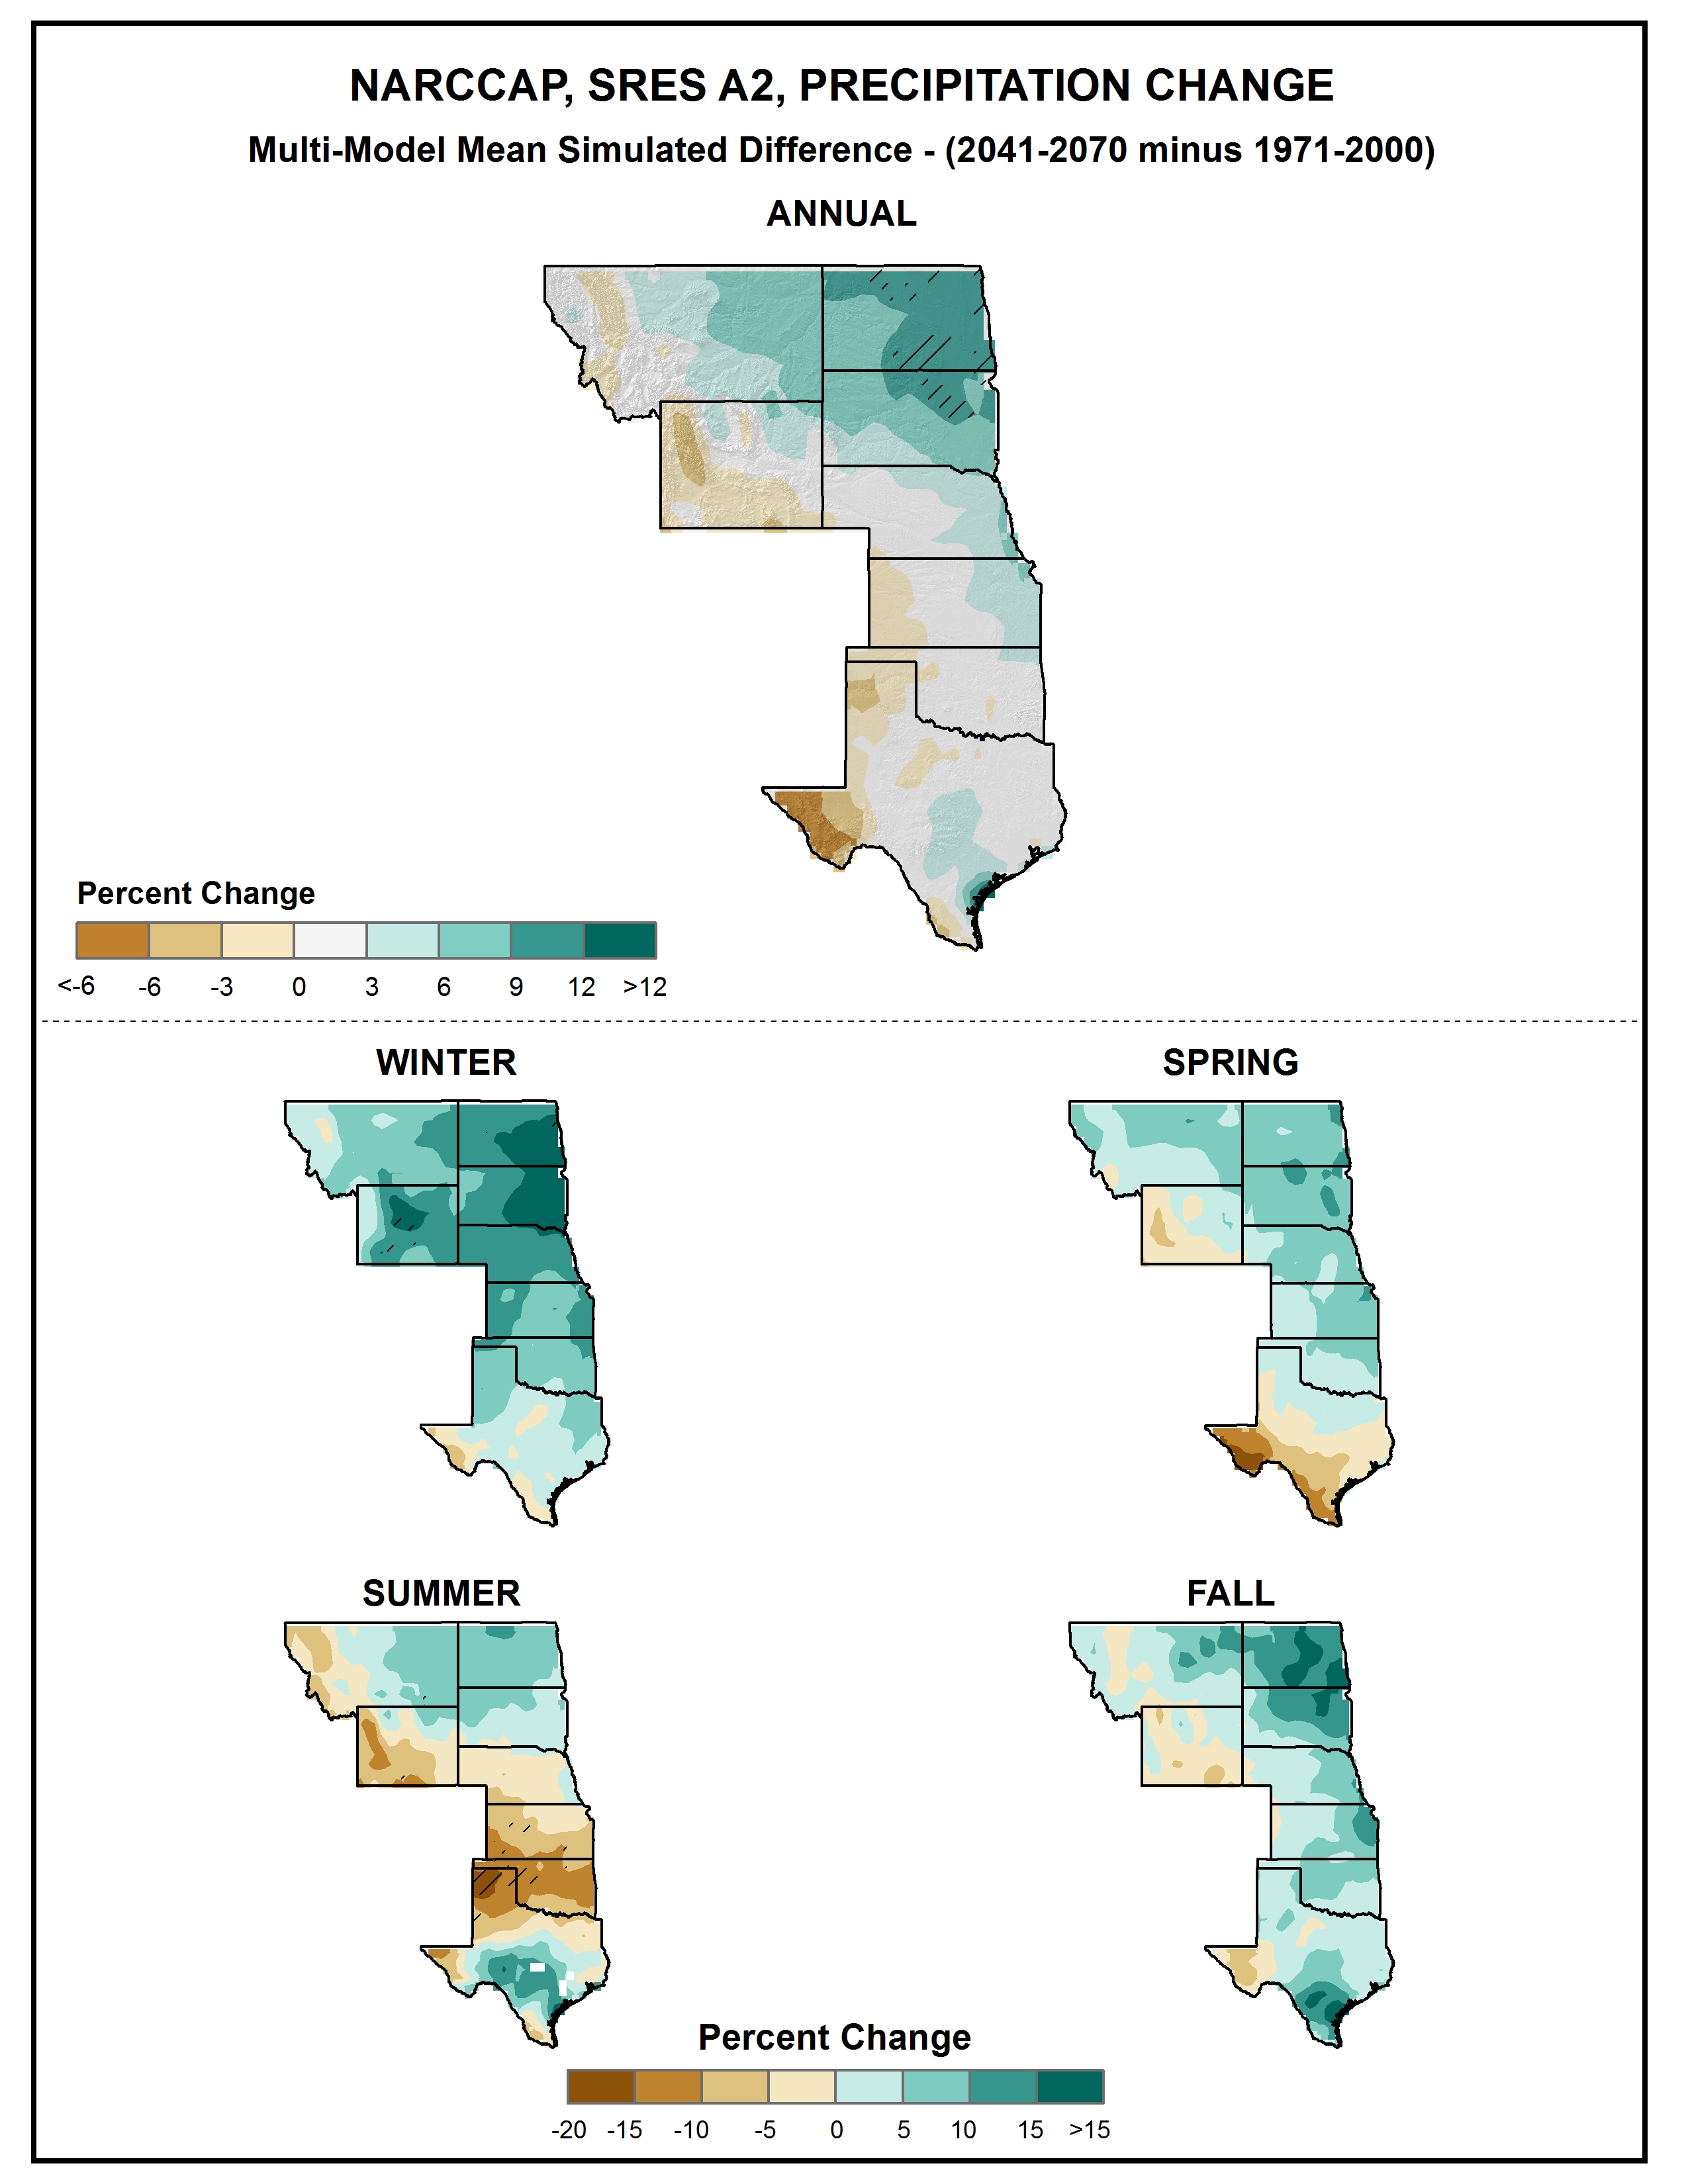
Simulated difference in annual and seasonal mean precipitation (%) for the Great Plains region, for 2041-2070 with respect to the reference period of 1971-2000. These are multi-model means from 11 NARCCAP regional climate simulations for the high (A2) emissions scenario. Color only (category 1) indicates that less than 50% of the models show a statistically significant change in precipitation. Color with hatching (category 3) indicates that more than 50% of the models show a statistically significant change in the number of days, and more than 67% agree on the sign of the change. Whited out areas (category 2) indicate that more than 50% of the models show a statistically significant change in precipitation, but less than 67% agree of the sign of the change (see text). Note that top and bottom color scales are unique, and different from that of Fig. 24. The annual change is upward in the northeast of the region and downward in the southwest, with large areas of little to no across the central Great Plains. Changes are mostly upward in the winter, spring, and fall, and downward in summer.
Data Type:
Simulated
Variable Type:
Precipitation
Region:
Source Information
Data Source(s):
Image Source:
Greg Dobson
Metadata
Metadata File(s):
Files