General Information
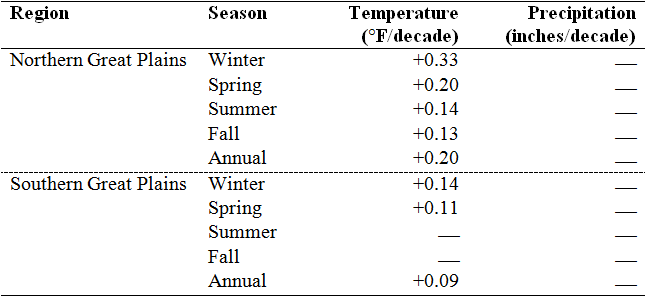
1895-2011 trends in temperature anomaly (F/decade) and precipitation anomaly (inches/decade) for the northern Great Plains (top) and southern Great Plains (bottom), for each season as well as the year as a whole. Based on a new gridded version of COOP data from the National Climatic Data Center, the CDDv2 data set (R. Vose, personal communication, July 27, 2012). Only values statistically significant at the 95% confidence level are displayed. Statistical significance of trends was assessed using Kendalls tau coefficient. The test using tau is a non-parametric hypothesis test.
Data Type:
Observed
Variable Type:
Temperature
Region:
Source Information
Data Source(s):
Image Source:
Laura Stevens
Metadata
Metadata File(s):
Files