General Information
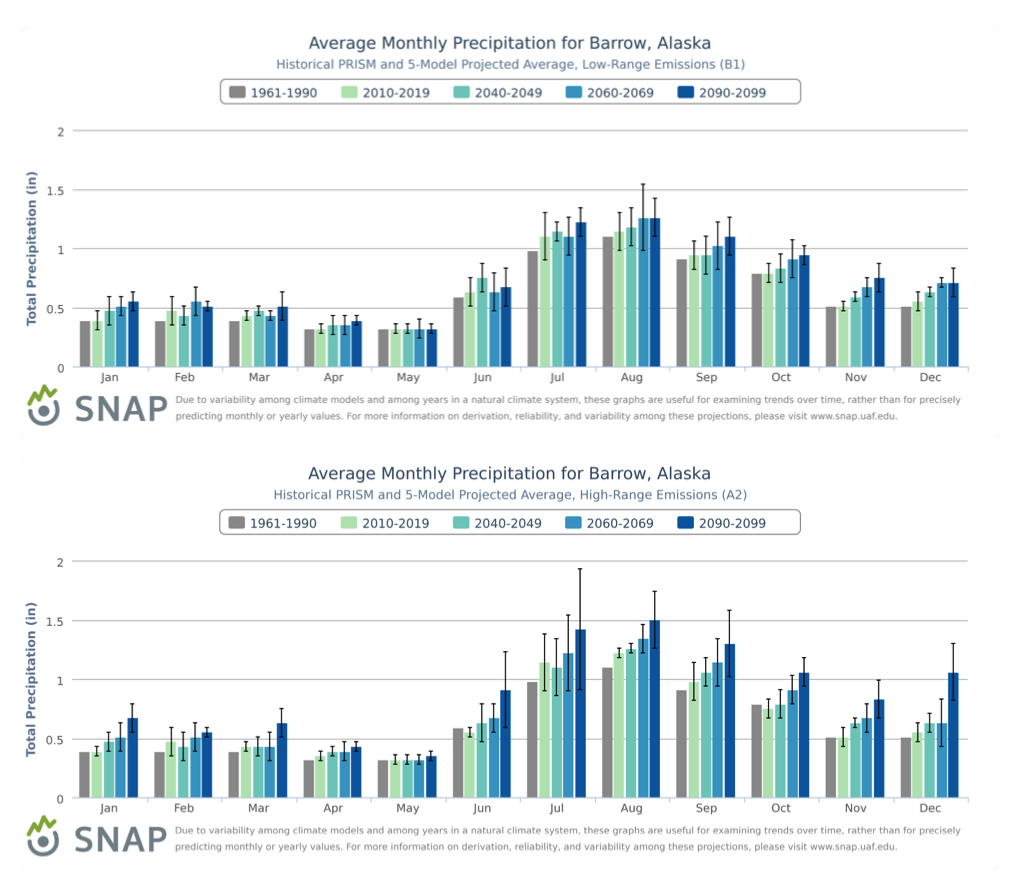
Simulations of decadal mean precipitation (inches) by calendar month for Barrow for the B1 (top) and A2 (bottom) scenarios. Color coding for decades is given above bar graphs; deeper blues indicate increasing range of simulations. Across-model spread is indicated by thin black lines at tops of bars. These are downscaled multi-model means from 5 CMIP3 global climate simulations.
Data Type:
Simulated
Variable Type:
Precipitation
Region:
Source Information
Data Source(s):
Metadata
Metadata File(s):
Files