General Information
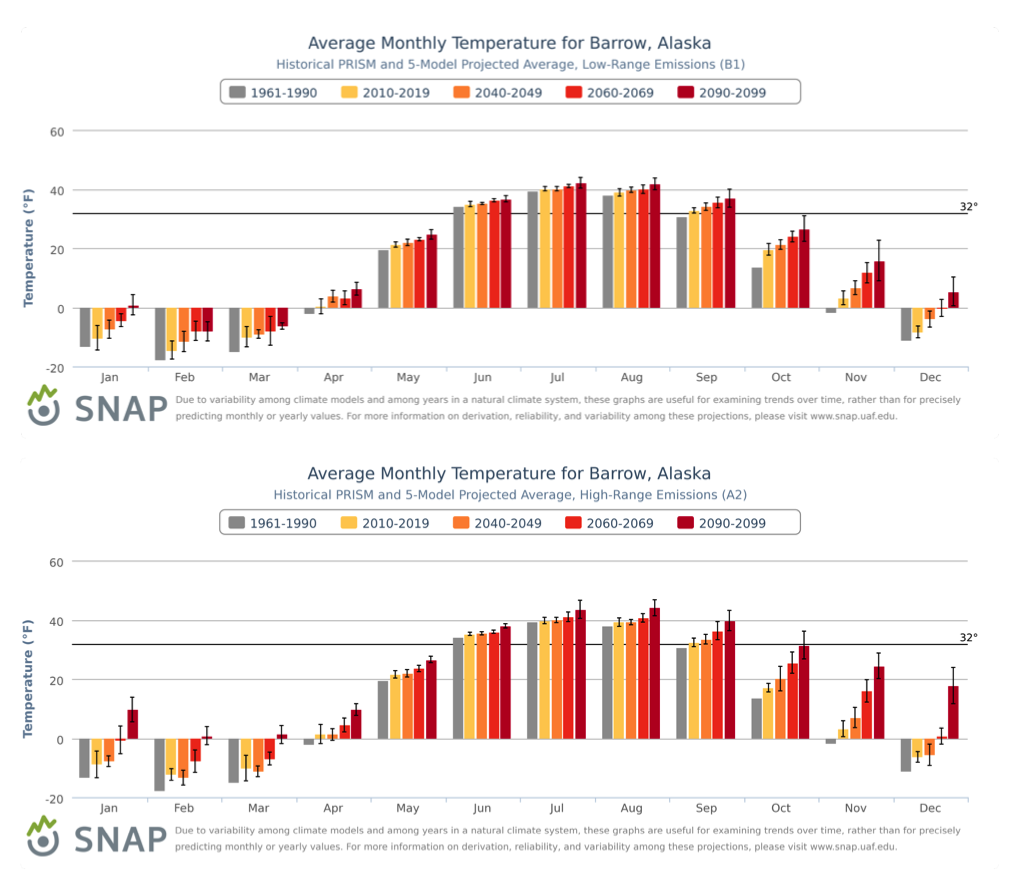
Simulations of decadal mean temperature (F) by calendar month for Barrow for the B1 (top) and A2 (bottom) scenarios. Color coding for decades is given above bar graphs. Across-model spread is indicated by thin black lines at tops of bars. These are downscaled multi-model means from 5 CMIP3 global climate simulations.
Data Type:
Simulated
Variable Type:
Temperature
Region:
Source Information
Data Source(s):
Metadata
Metadata File(s):
Files