|
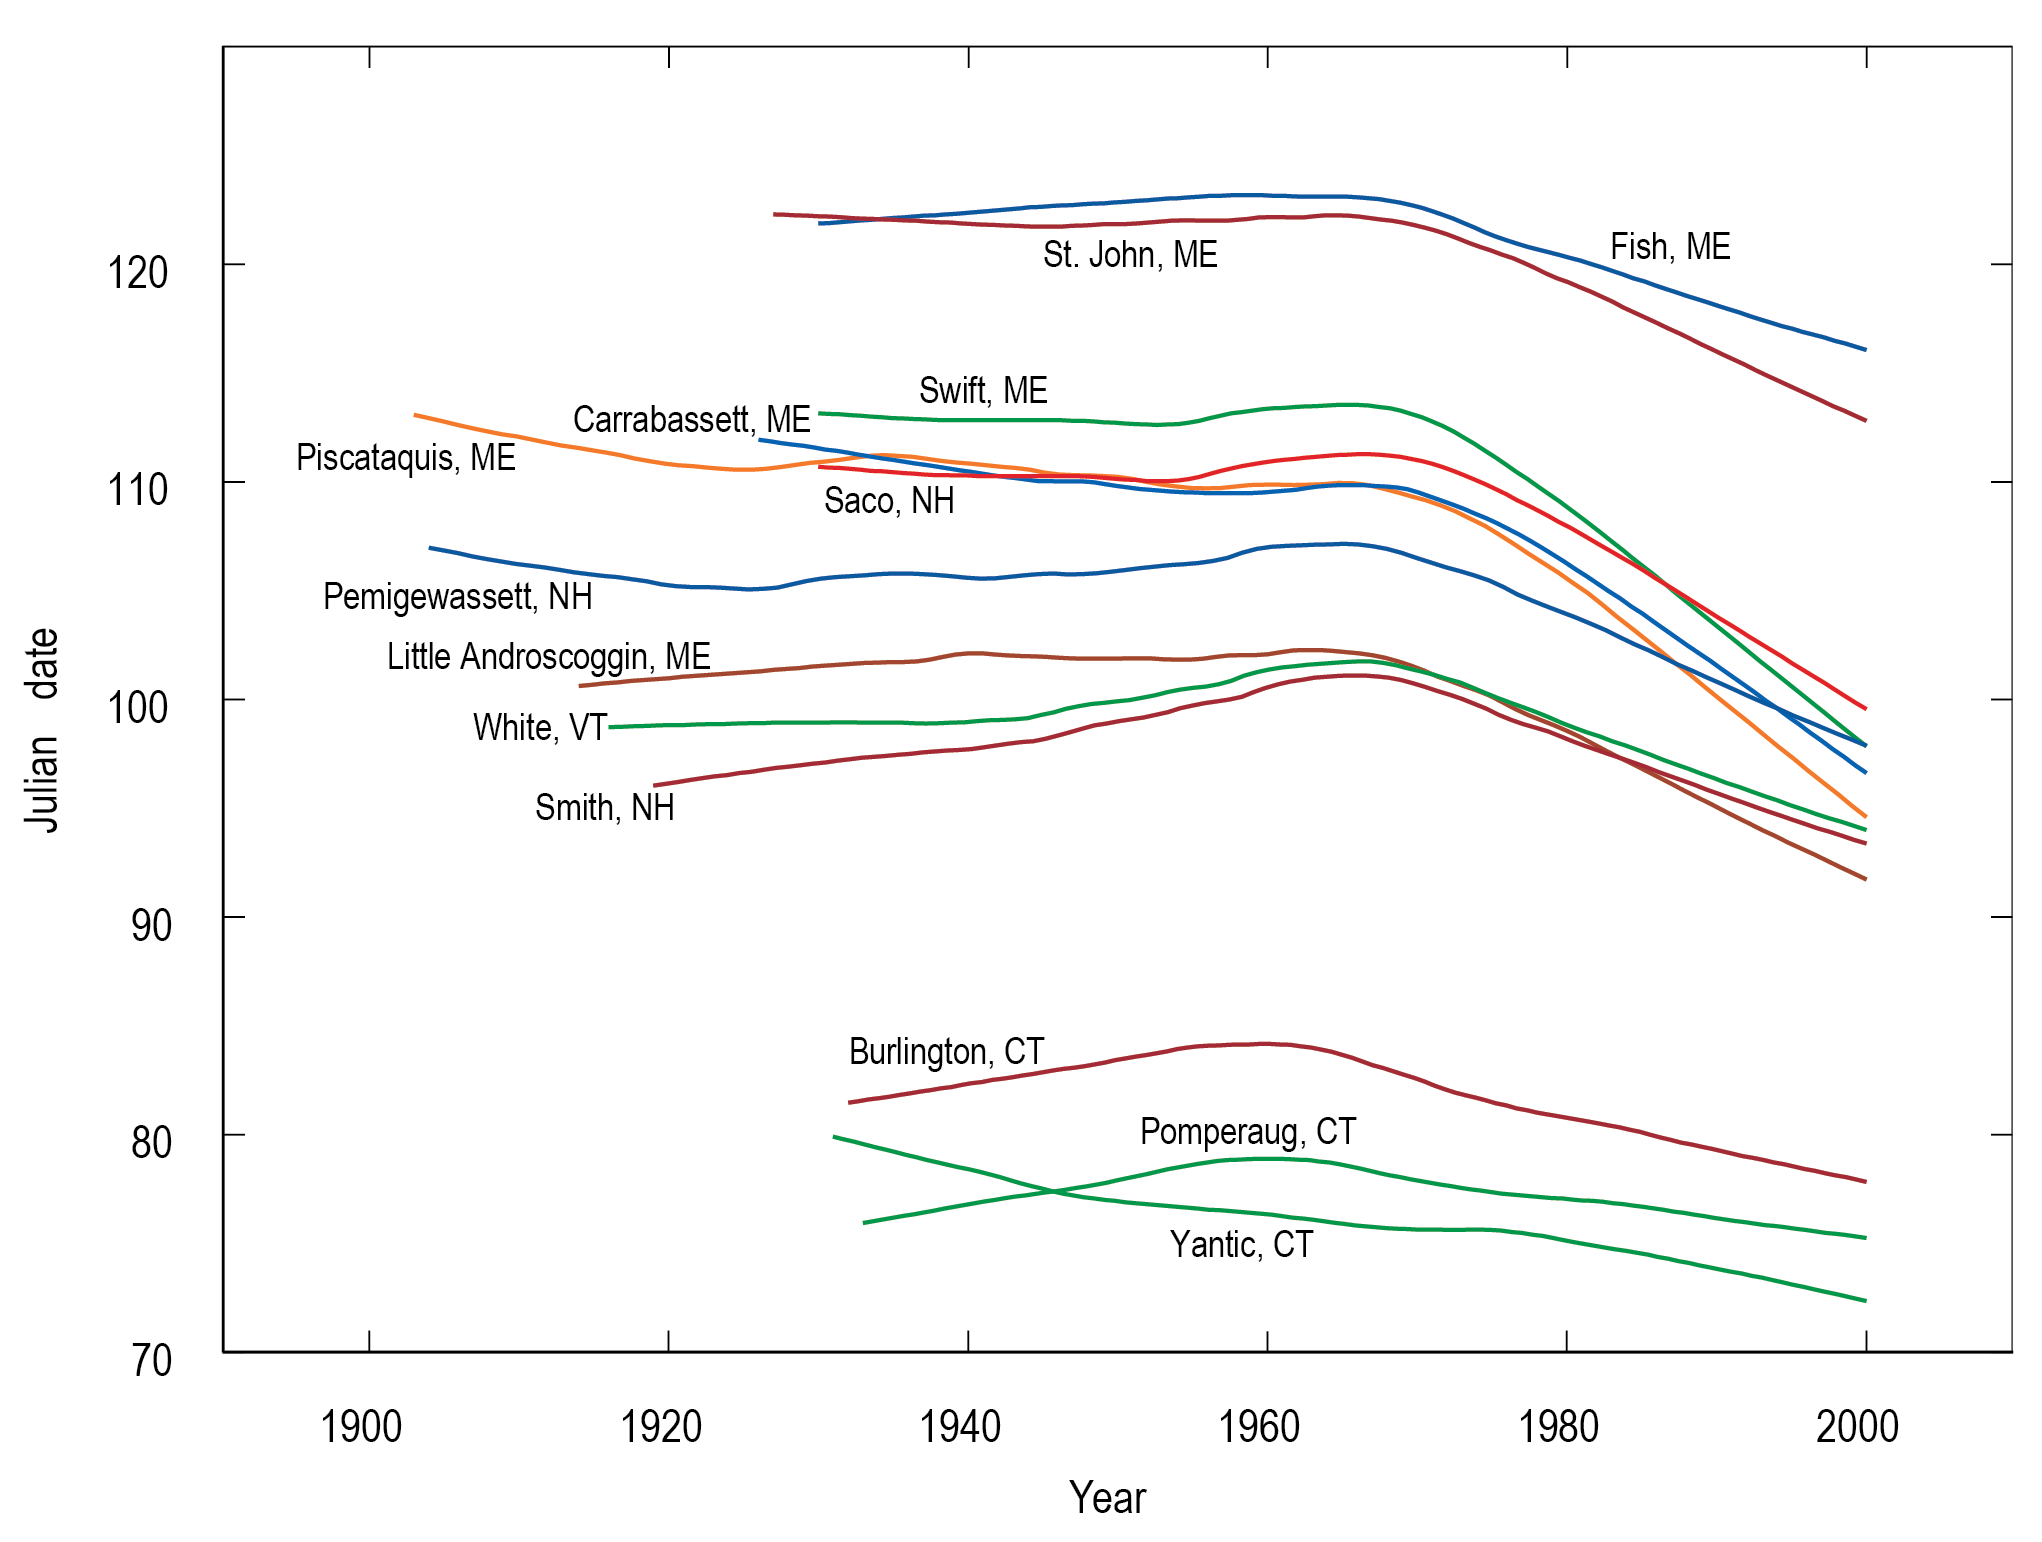
Winter/spring center of volume dates for the 13 longest-record rural, unregulated rivers in New England |
Observed |
Rivers |
Northeast |
Regional Climate Trends and Scenarios for the U.S. National Climate Assessment. Part 1. Climate of the Northeast U.S. |
NCA 3 |
 |
|
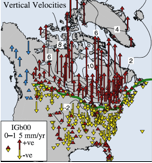
Vertical GPS site motions with respect to IGb00 |
Simulated |
Sea |
National |
Global Sea Level Rise Scenarios for the United States National Climate Assessment |
NCA 3 |
 |
|
Trends in temperature anomaly |
Observed |
Temperature |
National |
Regional Climate Trends and Scenarios for the U.S. National Climate Assessment. Part 9. Climate of the Contiguous United States |
NCA 3 |
 |
|
Trends in temperature and precipitation anomaly |
Observed |
Temperature |
Southeast and Caribbean |
Regional Climate Trends and Scenarios for the U.S. National Climate Assessment. Part 2. Climate of the Southeast U.S. |
NCA 3 |
 |
|
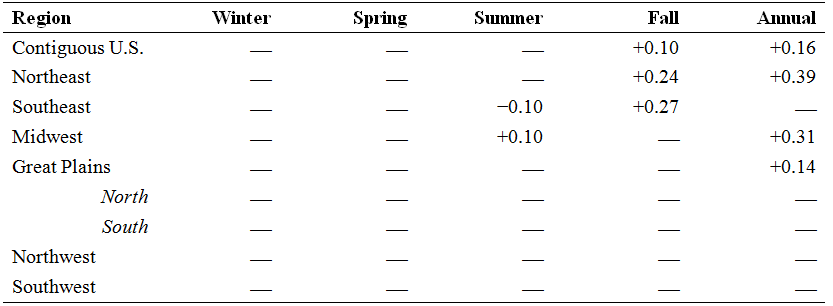
Trends in temperature and precipitation anomaly |
Observed |
Temperature |
Great Plains |
Regional Climate Trends and Scenarios for the U.S. National Climate Assessment. Part 4. Climate of the U.S. Great Plains |
NCA 3 |
 |
|
Trends in temperature and precipitation anomaly |
Observed |
Temperature |
Northeast |
Regional Climate Trends and Scenarios for the U.S. National Climate Assessment. Part 1. Climate of the Northeast U.S. |
NCA 3 |
 |
|
Trends in temperature and precipitation anomaly |
Observed |
Temperature |
Southwest |
Regional Climate Trends and Scenarios for the U.S. National Climate Assessment. Part 5. Climate of the Southwest U.S. |
NCA 3 |
 |
|
Trends in temperature and precipitation anomaly |
Observed |
Temperature |
Northwest |
Regional Climate Trends and Scenarios for the U.S. National Climate Assessment. Part 6. Climate of the Northwest U.S. |
NCA 3 |
 |
|
Trends in temperature and precipitation anomaly |
Observed |
Temperature |
Midwest |
Regional Climate Trends and Scenarios for the U.S. National Climate Assessment. Part 3. Climate of the Midwest U.S. |
NCA 3 |
 |
|
Trends in precipitation anomaly |
Observed |
Precipitation |
National |
Regional Climate Trends and Scenarios for the U.S. National Climate Assessment. Part 9. Climate of the Contiguous United States |
NCA 3 |
 |
|
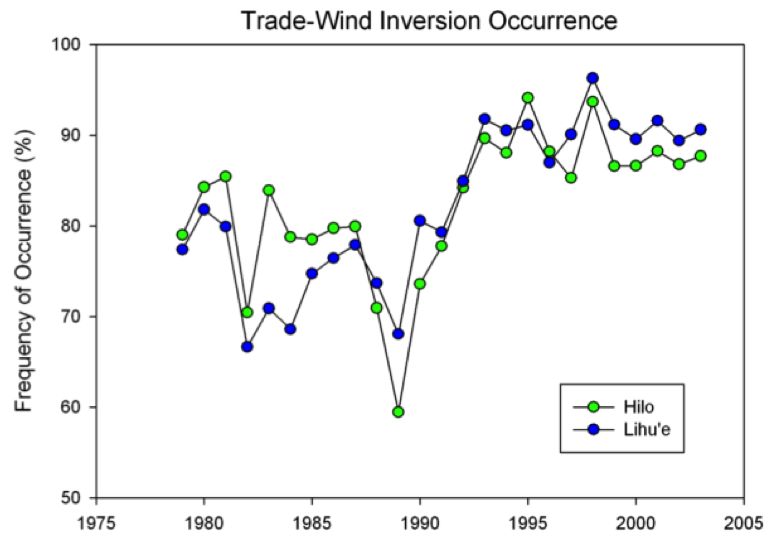
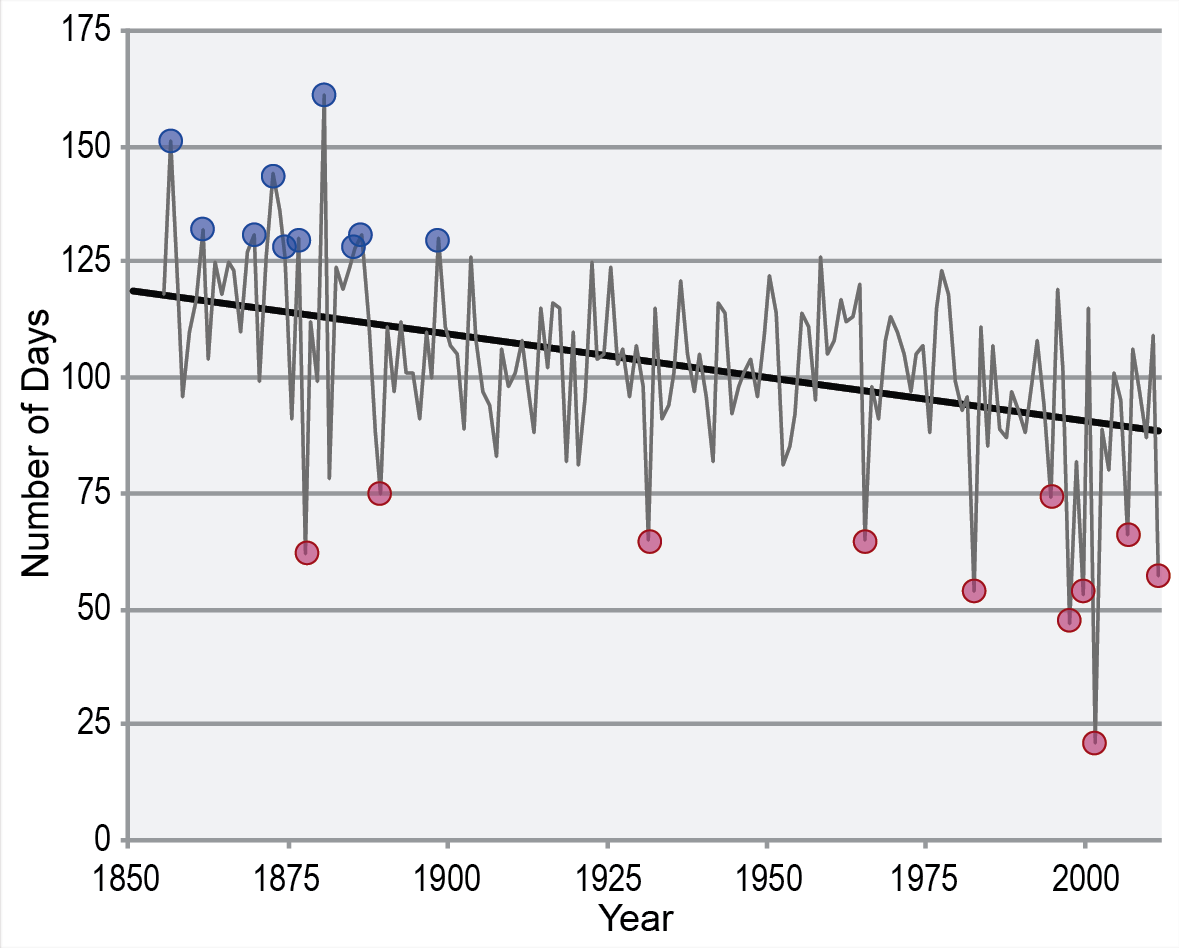
Trade-wind inversion occurrence in Hawaii |
Observed |
Wind |
Hawaii and Pacific Islands |
Regional Climate Trends and Scenarios for the U.S. National Climate Assessment. Part 8. Climate of the Pacific Islands |
NCA 3 |
 |
|
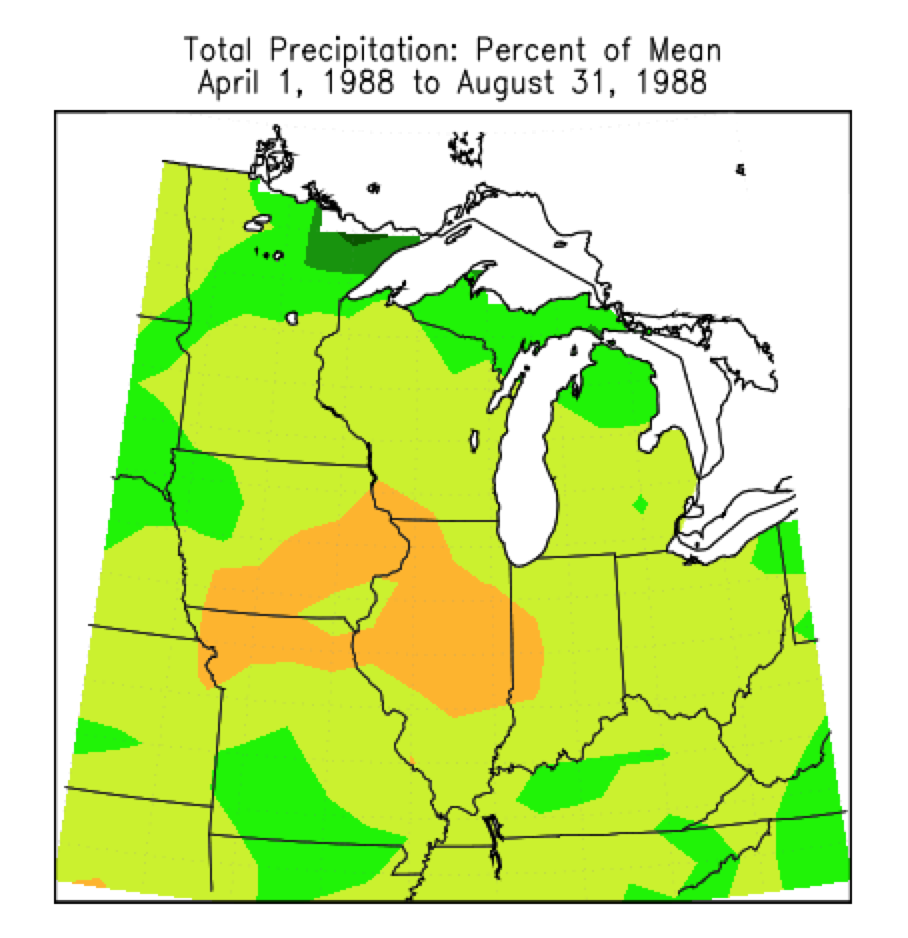
Total precipitation expressed as the percentage of the long-term mean during the summer drought of 1988 for the Midwest region |
Observed |
Precipitation |
Midwest |
Regional Climate Trends and Scenarios for the U.S. National Climate Assessment. Part 3. Climate of the Midwest U.S. |
NCA 3 |
 |
|
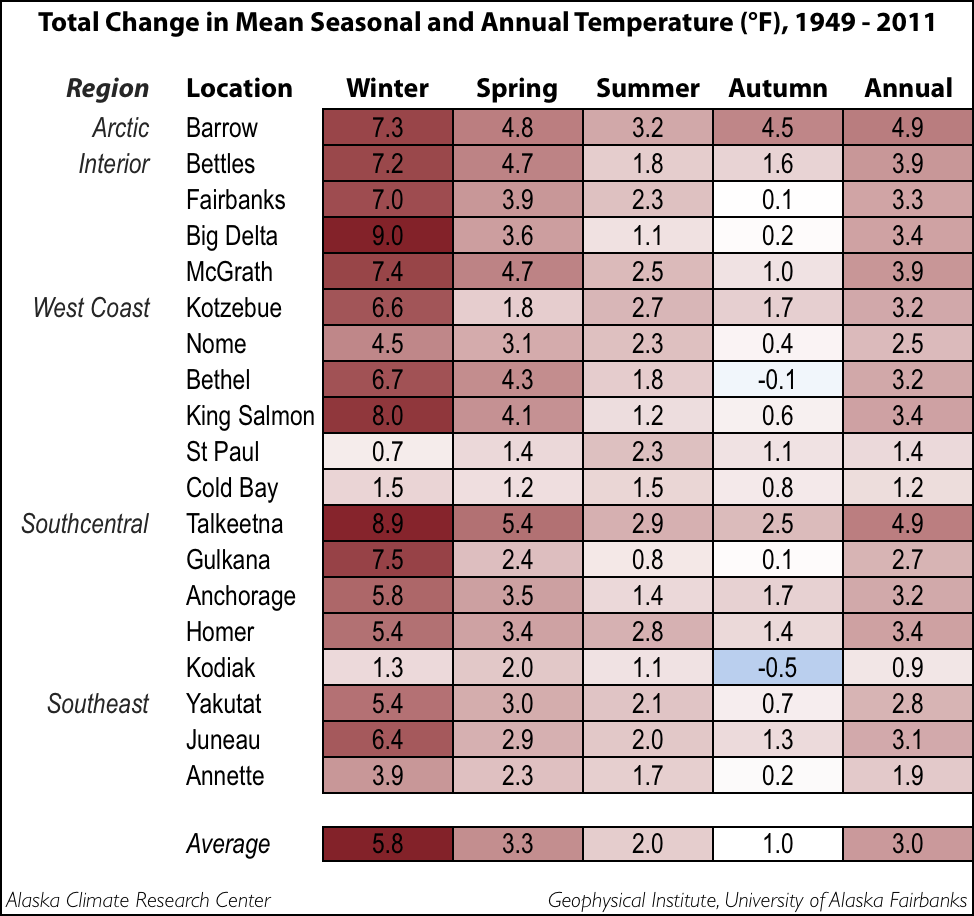
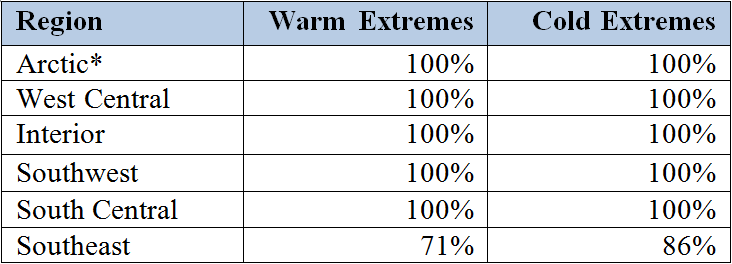
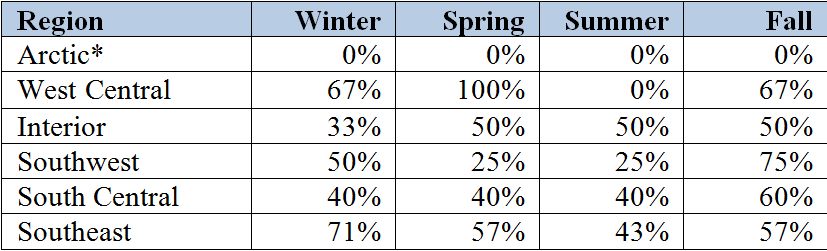
Total change in mean seasonal and annual temperature |
Observed |
Temperature |
Alaska and Arctic |
Regional Climate Trends and Scenarios for the U.S. National Climate Assessment. Part 7. Climate of Alaska |
NCA 3 |
 |
|
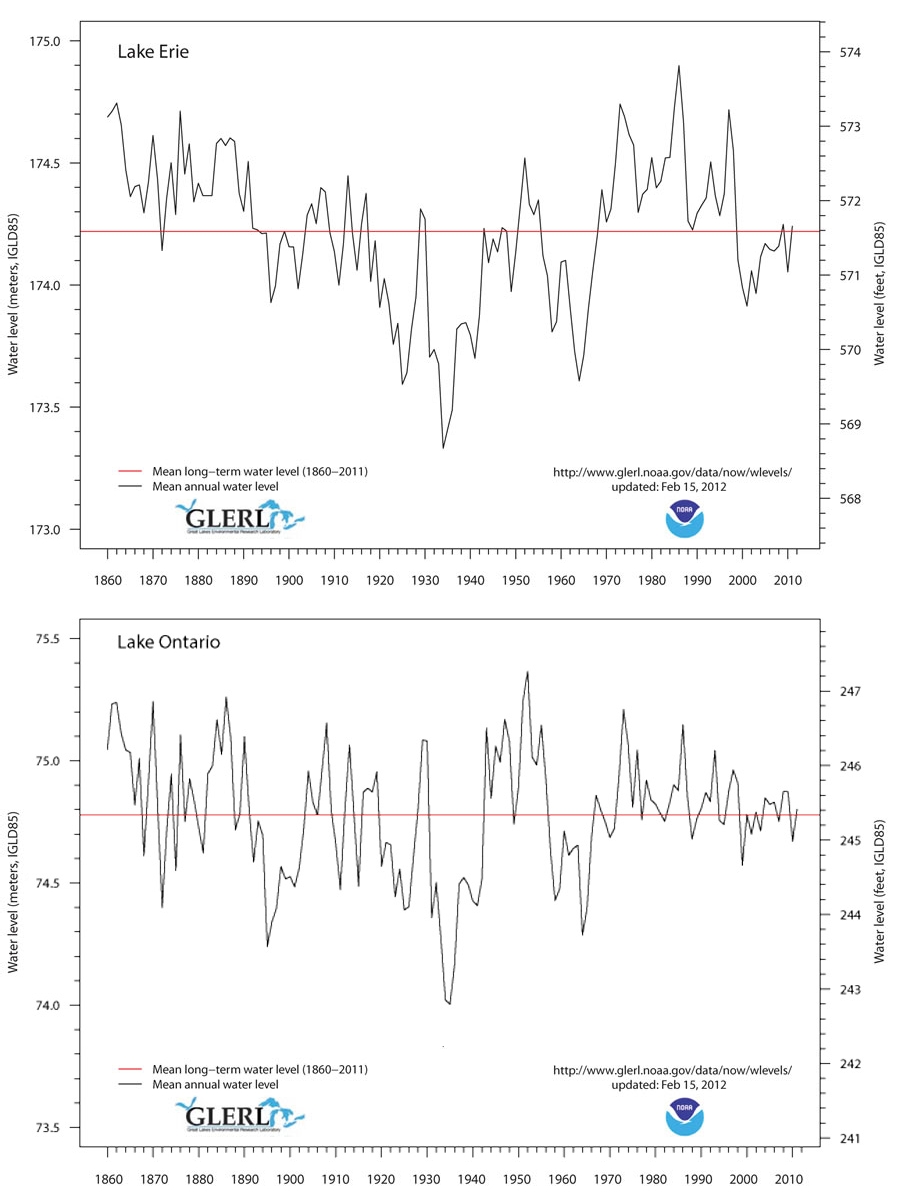
Time series of water levels in Lake Erie and Lake Ontario |
Observed |
Water Level |
Northeast |
Regional Climate Trends and Scenarios for the U.S. National Climate Assessment. Part 1. Climate of the Northeast U.S. |
NCA 3 |
 |
|
Time series of tropical cyclones in the Central North Pacific basin |
Observed |
Tropical Cyclones |
Hawaii and Pacific Islands |
Regional Climate Trends and Scenarios for the U.S. National Climate Assessment. Part 8. Climate of the Pacific Islands |
NCA 3 |
 |
|
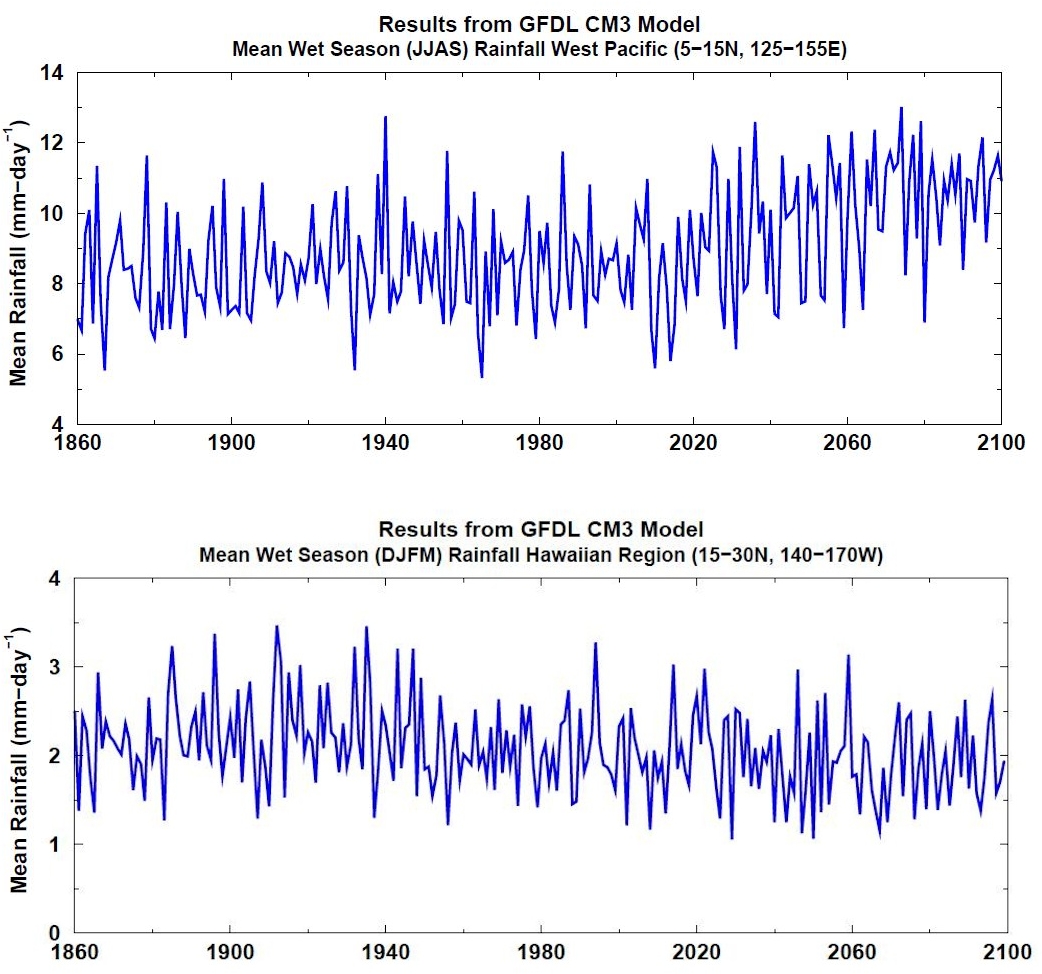
Time series of mean rainfall in the wet season each year averaged over a tropical Western Pacific region, and over a region around Hawaii |
Simulated |
Precipitation |
Hawaii and Pacific Islands |
Regional Climate Trends and Scenarios for the U.S. National Climate Assessment. Part 8. Climate of the Pacific Islands |
NCA 3 |
 |
|
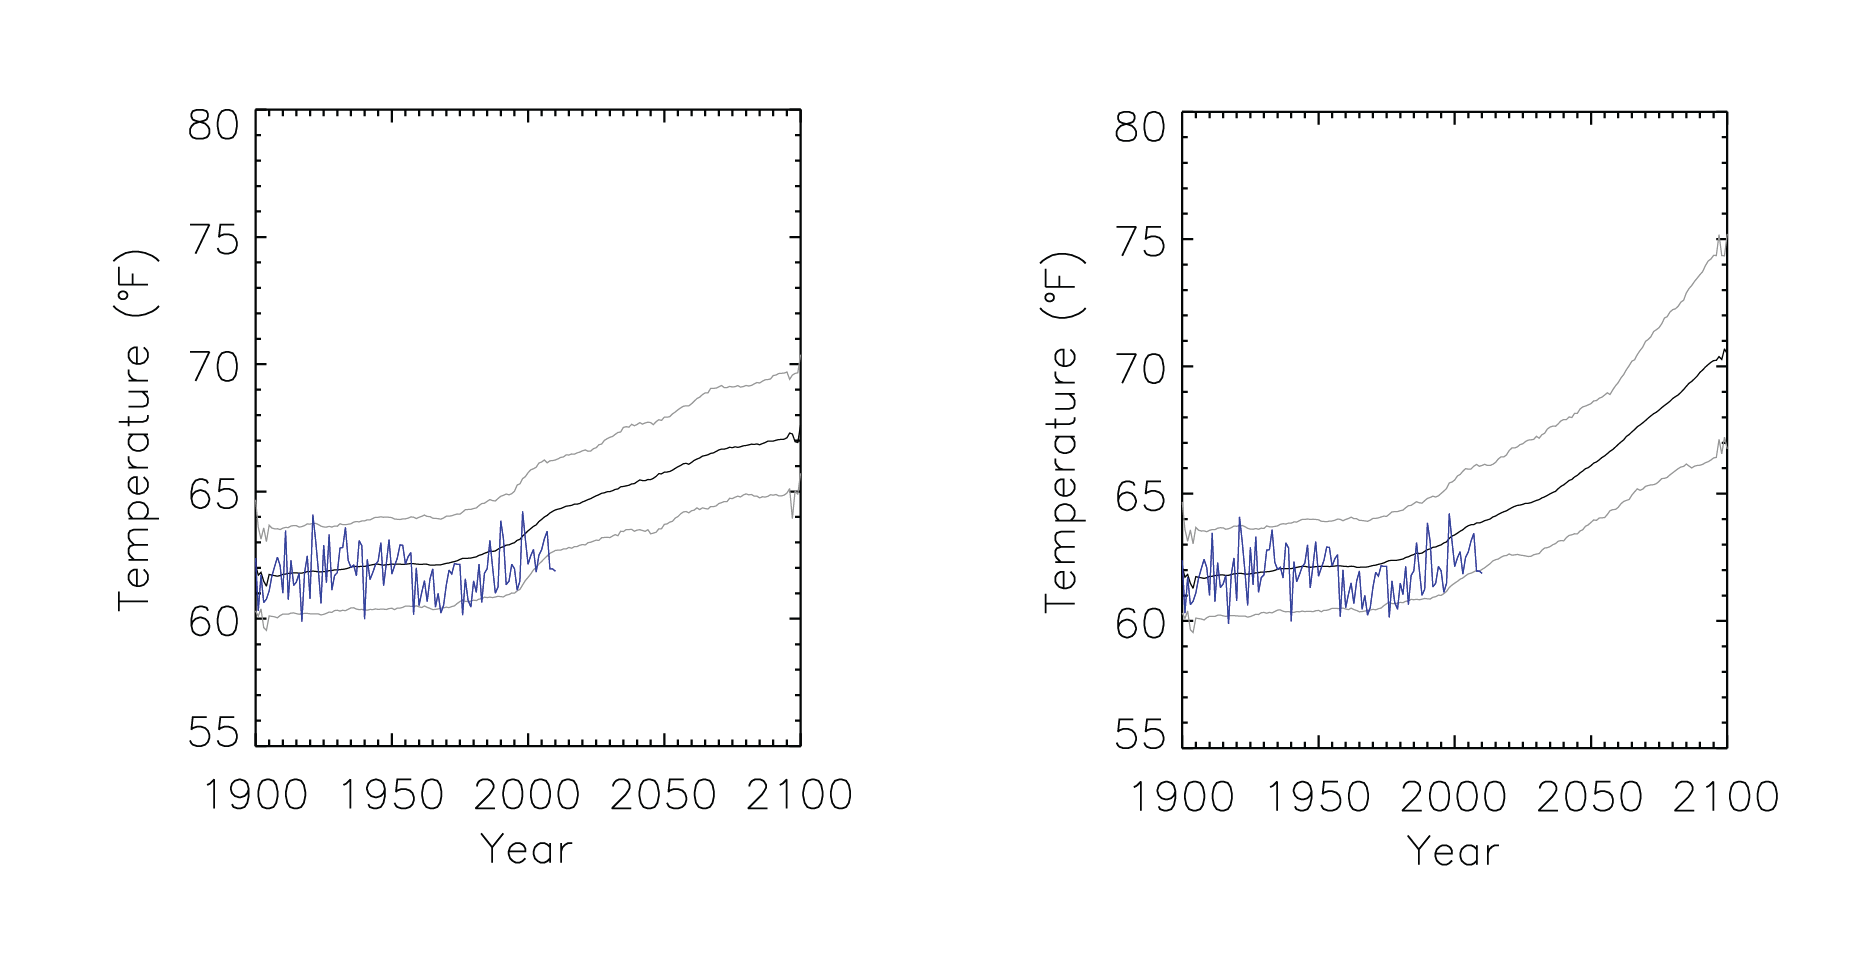
Time series of mean annual temperature simulated vs observational |
Observed, Simulated |
Temperature |
Great Plains |
Regional Climate Trends and Scenarios for the U.S. National Climate Assessment. Part 4. Climate of the U.S. Great Plains |
NCA 3 |
 |
|
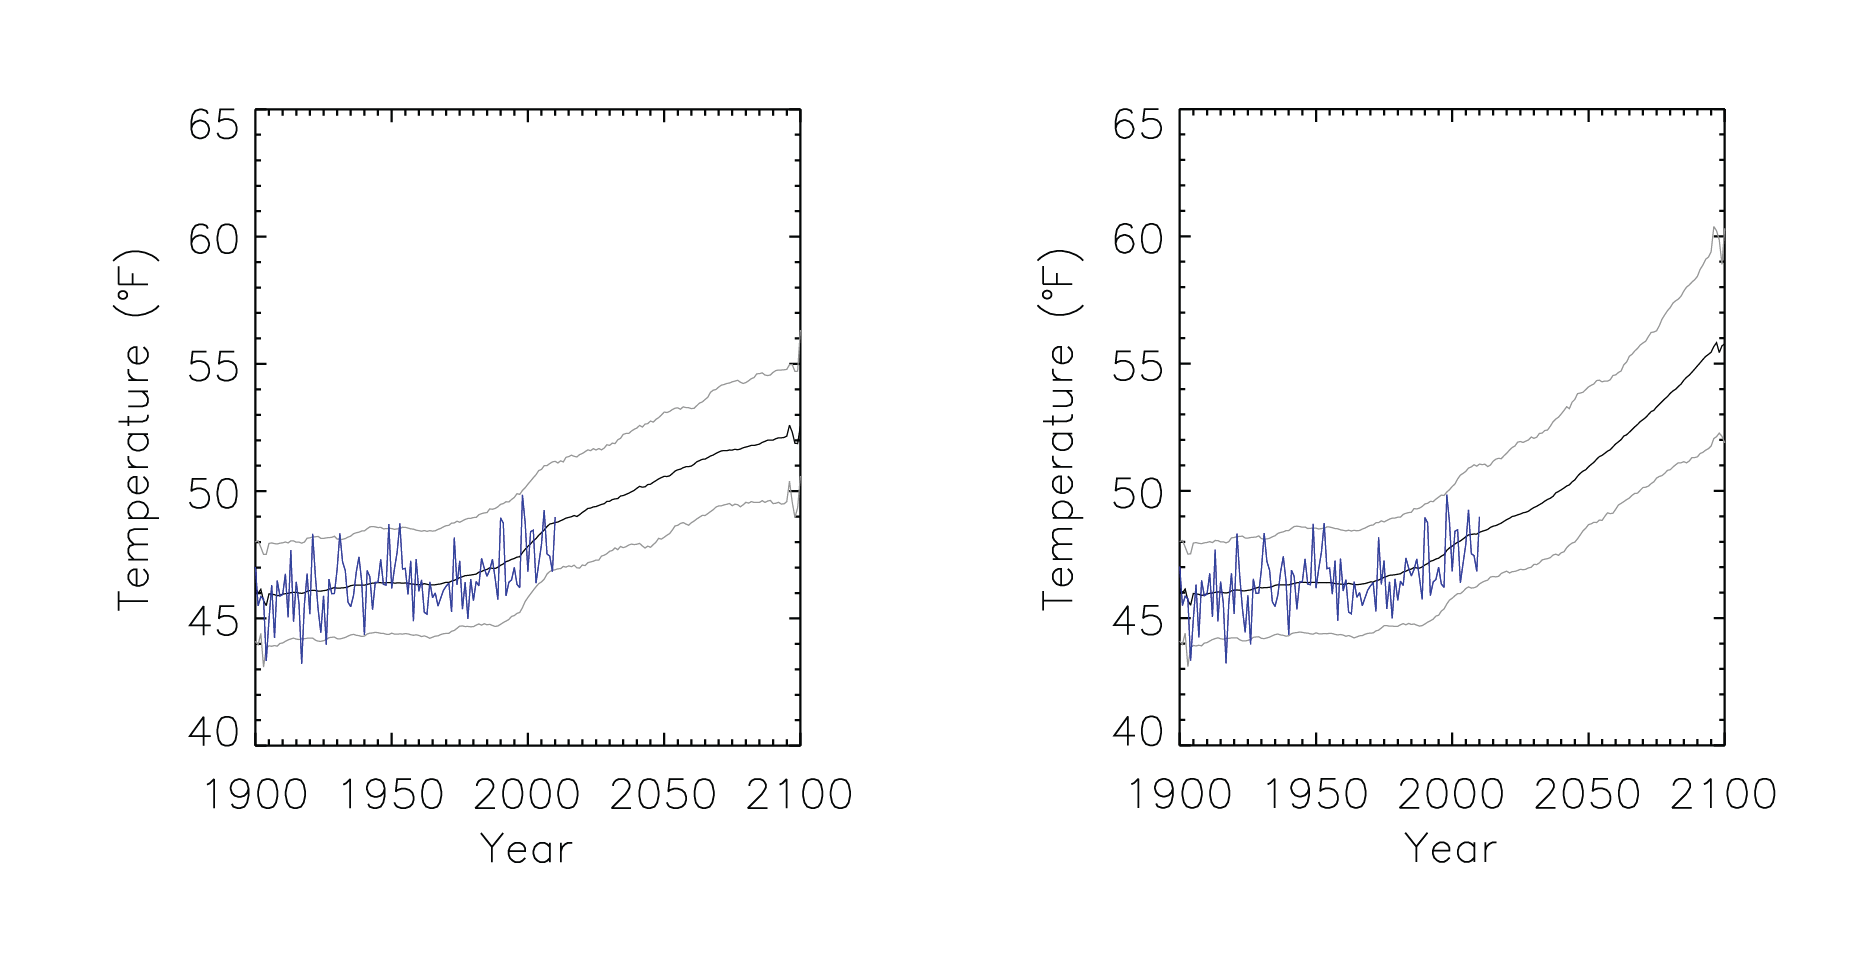
Time series of mean annual temperature |
Observed, Simulated |
Temperature |
Midwest |
Regional Climate Trends and Scenarios for the U.S. National Climate Assessment. Part 3. Climate of the Midwest U.S. |
NCA 3 |
 |
|
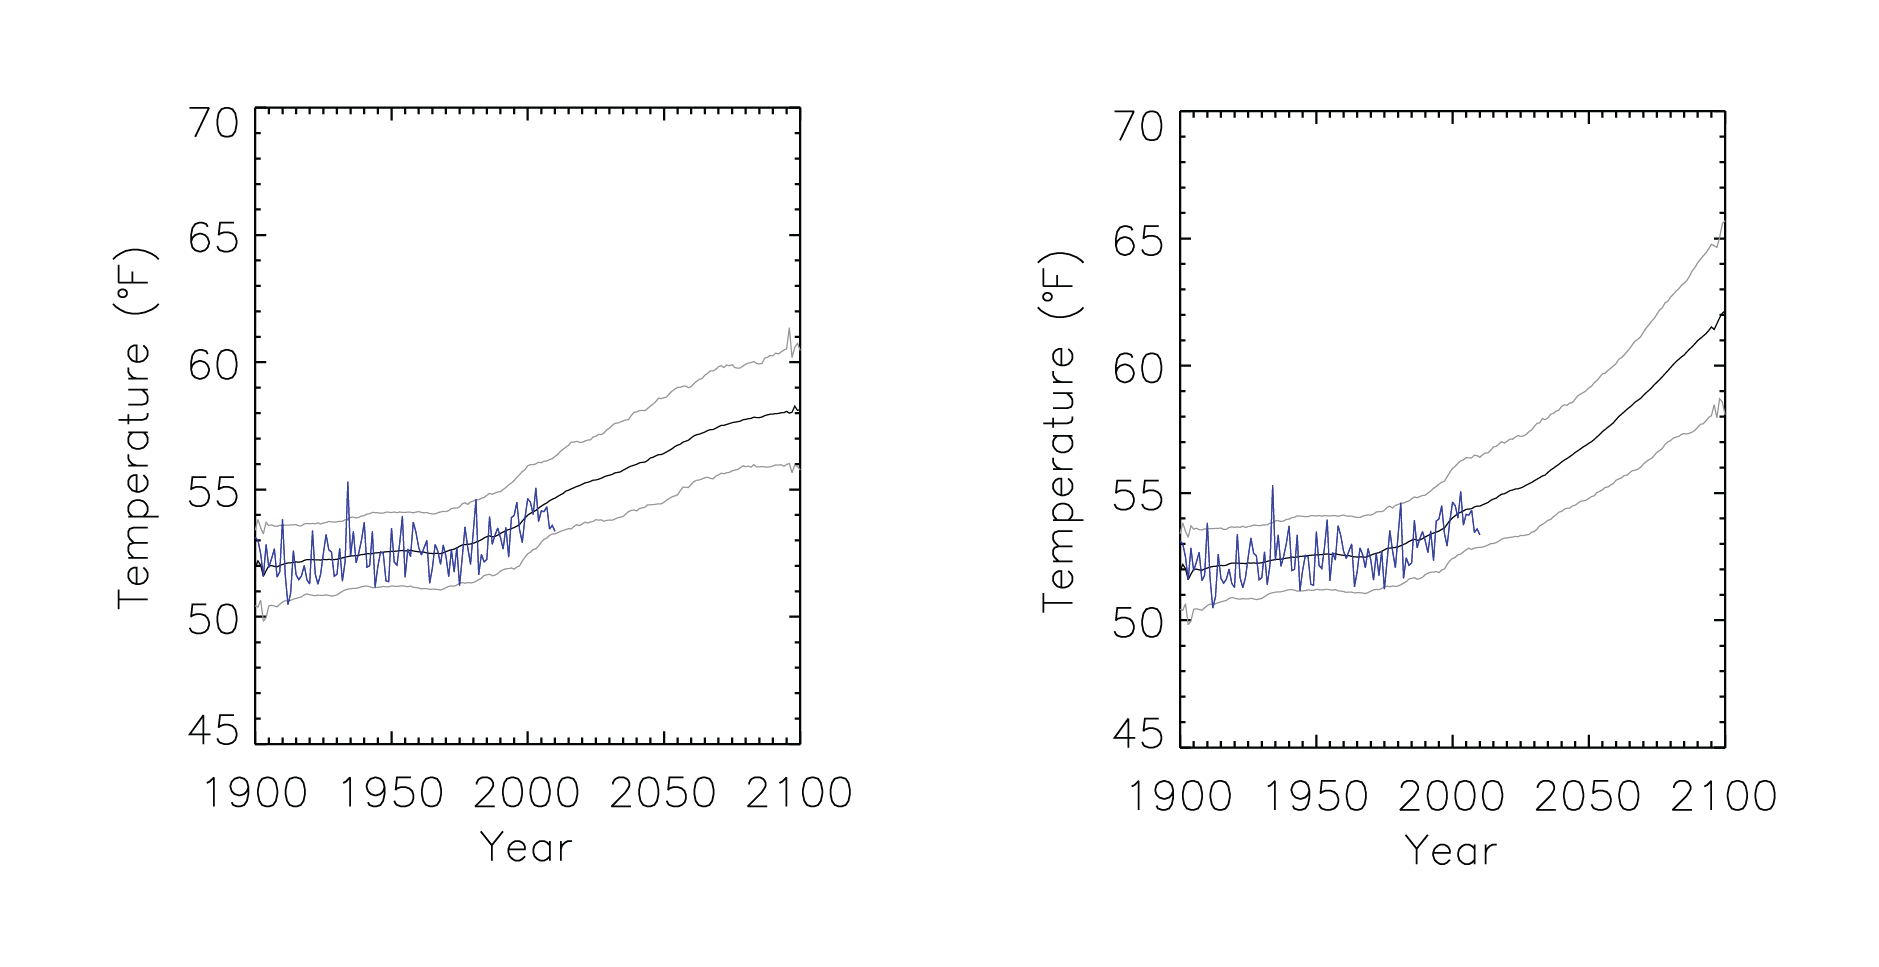
Time series of mean annual temperature |
Observed, Simulated |
Temperature |
Southeast and Caribbean |
Regional Climate Trends and Scenarios for the U.S. National Climate Assessment. Part 2. Climate of the Southeast U.S. |
NCA 3 |
 |
|
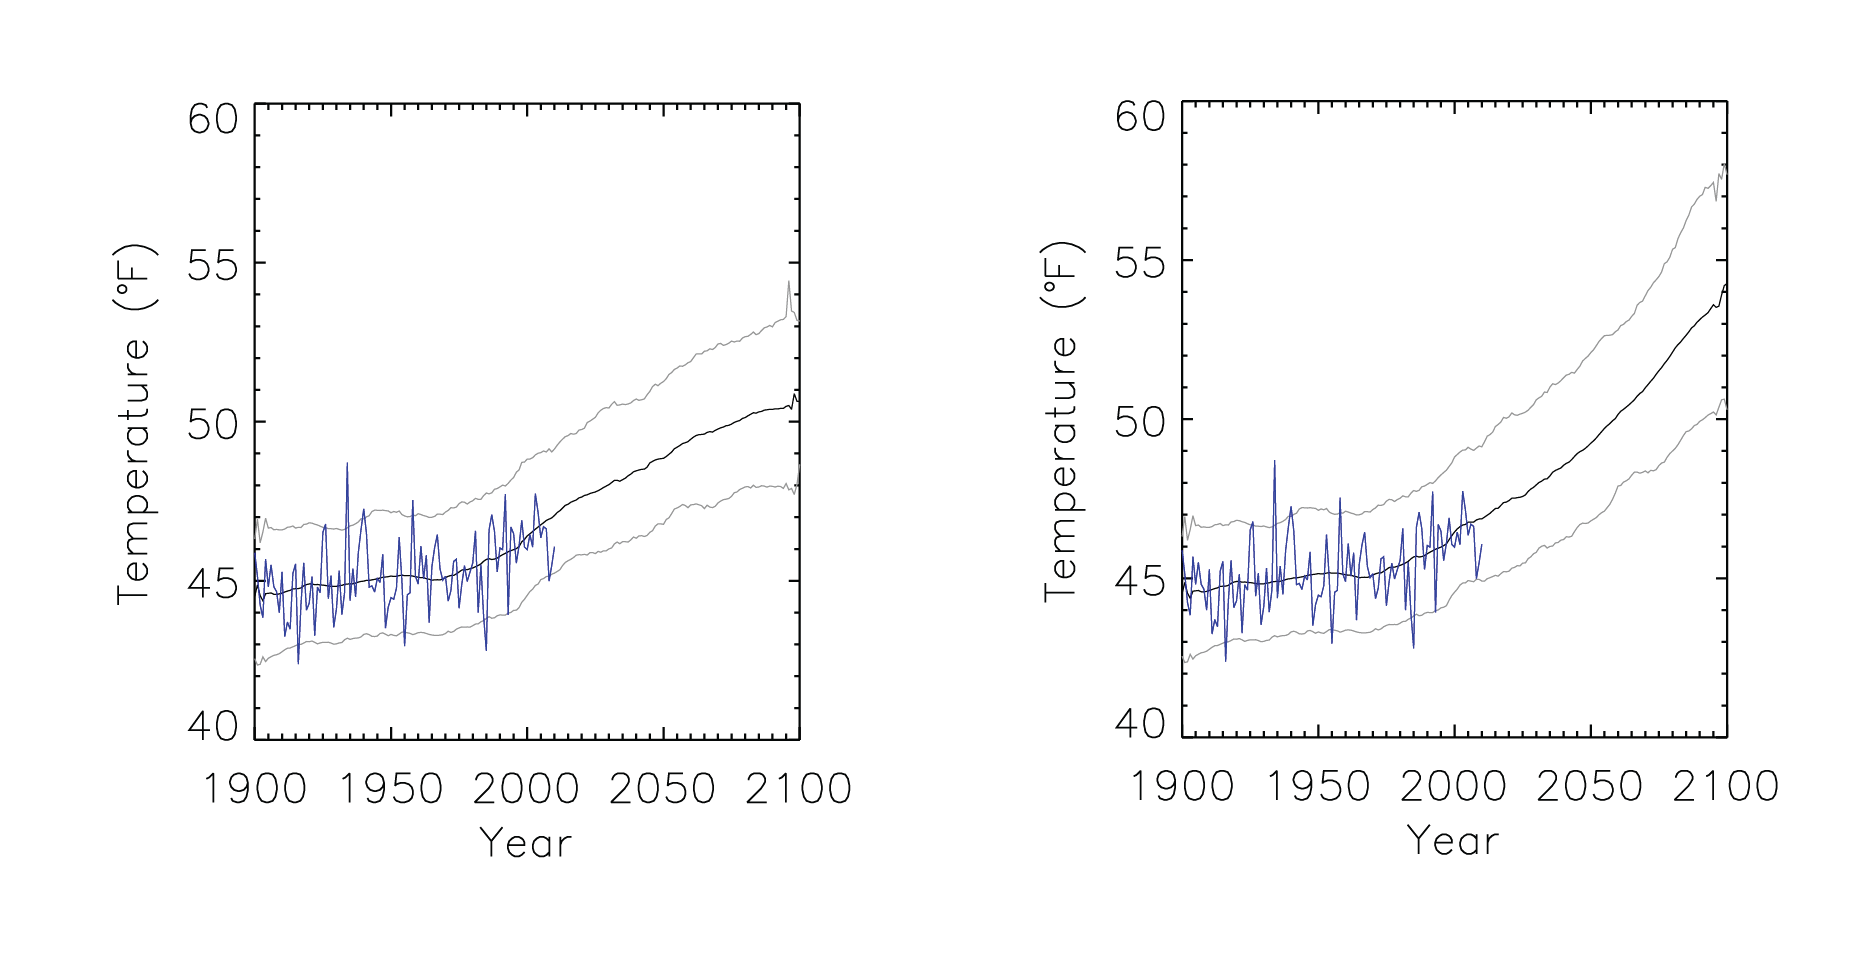
Time series of mean annual temperature |
Observed, Simulated |
Temperature |
Northeast |
Regional Climate Trends and Scenarios for the U.S. National Climate Assessment. Part 1. Climate of the Northeast U.S. |
NCA 3 |
 |
|
Time series of mean annual temperature |
Observed, Simulated |
Temperature |
Southwest |
Regional Climate Trends and Scenarios for the U.S. National Climate Assessment. Part 5. Climate of the Southwest U.S. |
NCA 3 |
 |
|
Time series of mean annual temperature |
Observed, Simulated |
Temperature |
Northwest |
Regional Climate Trends and Scenarios for the U.S. National Climate Assessment. Part 6. Climate of the Northwest U.S. |
NCA 3 |
 |
|
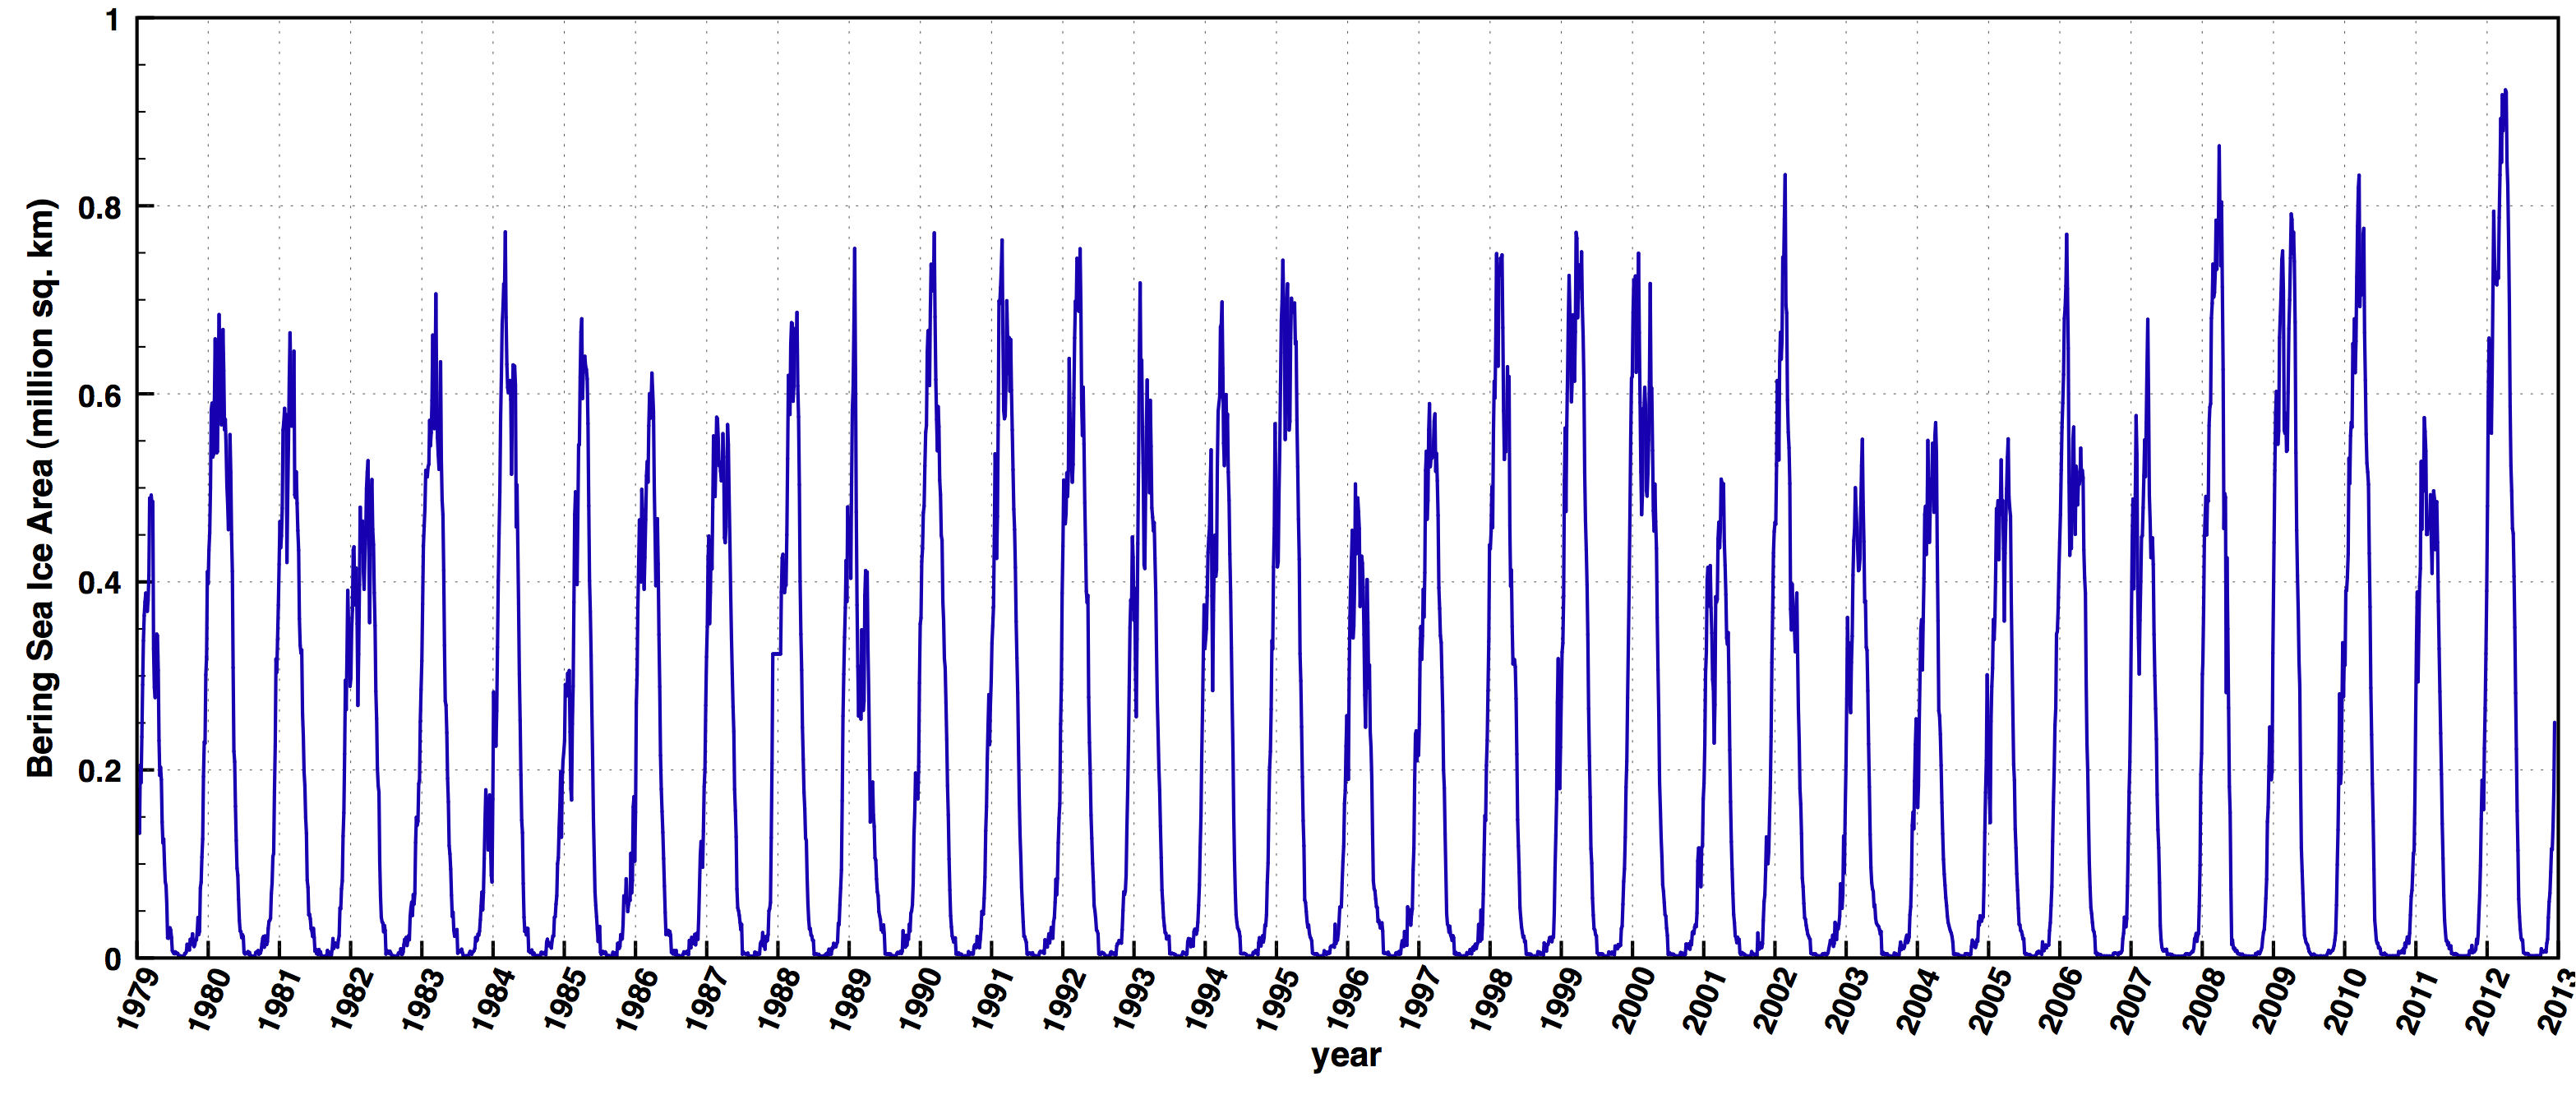
Time series of ice-covered area in the Bering Sea |
Observed |
Ice |
Alaska and Arctic |
Regional Climate Trends and Scenarios for the U.S. National Climate Assessment. Part 7. Climate of Alaska |
NCA 3 |
 |
|
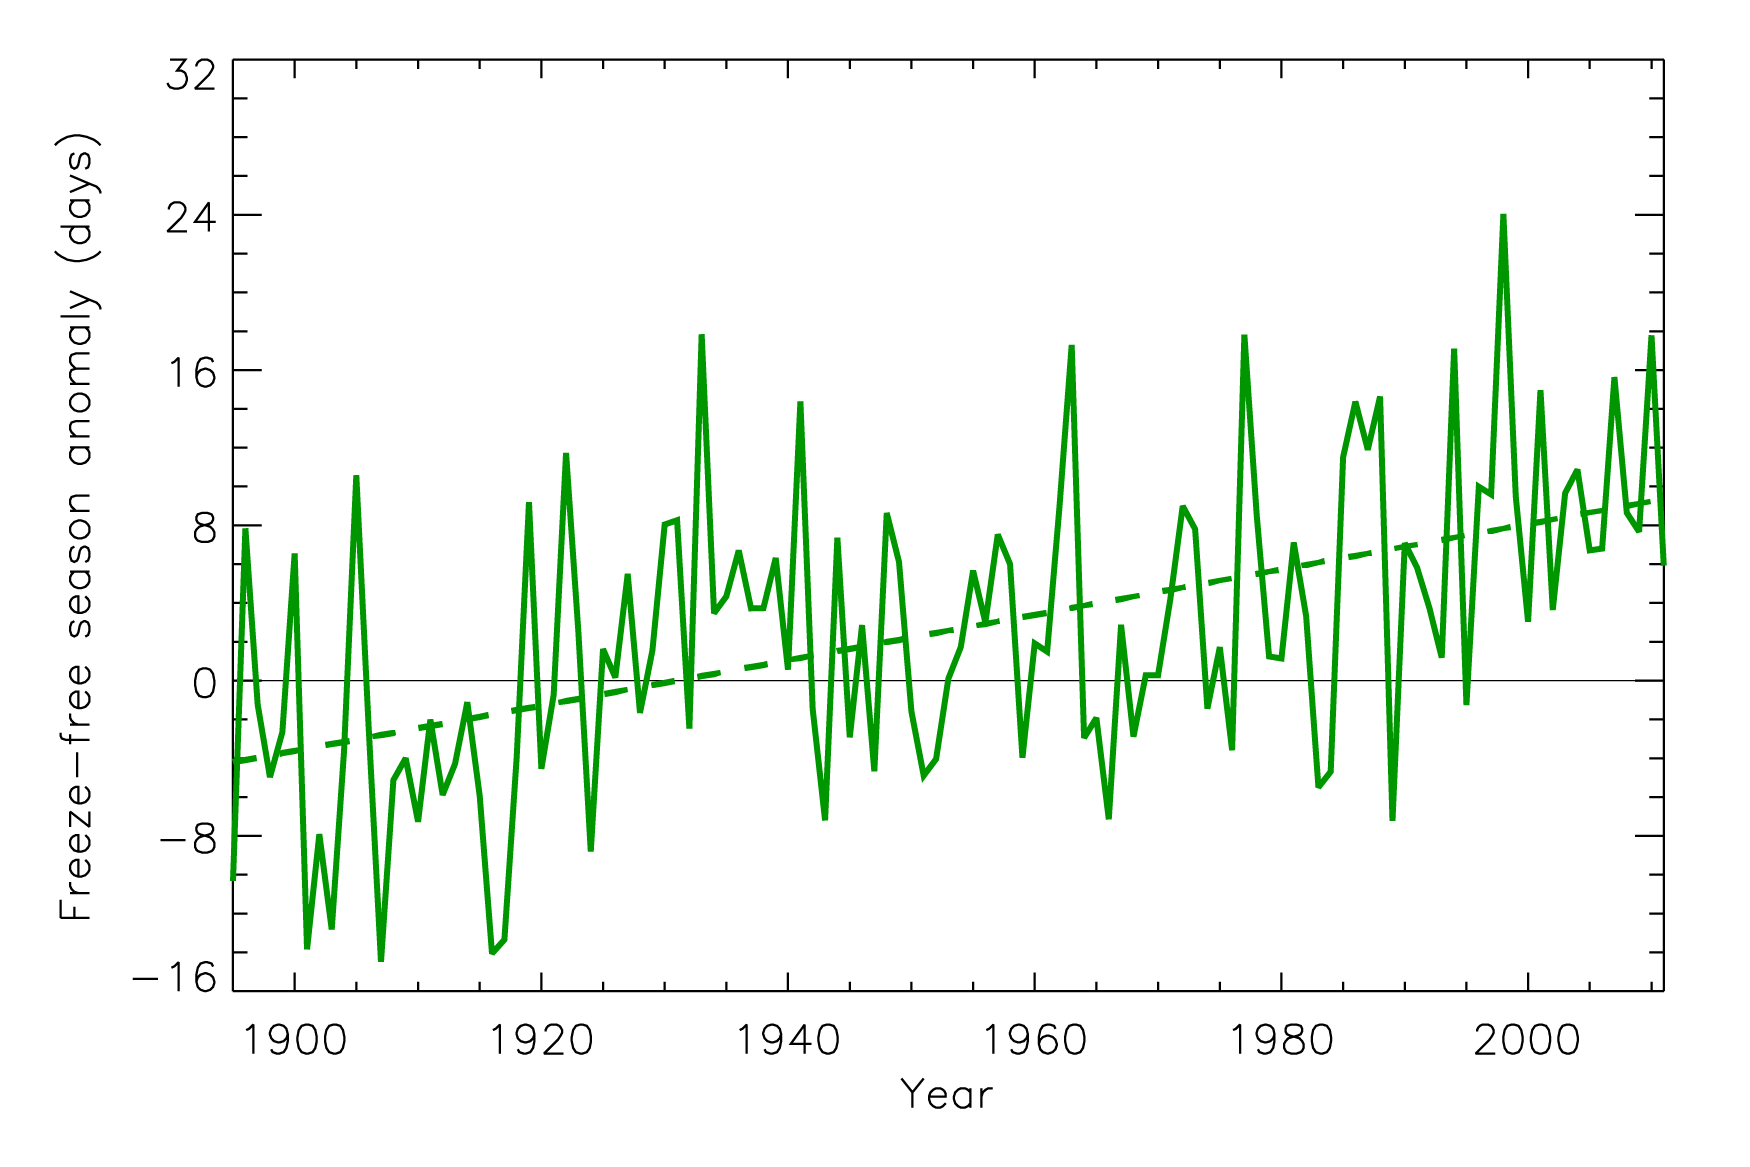
Time series of freeze-free season anomalies |
Observed |
Temperature |
National |
Regional Climate Trends and Scenarios for the U.S. National Climate Assessment. Part 9. Climate of the Contiguous United States |
NCA 3 |
 |
|
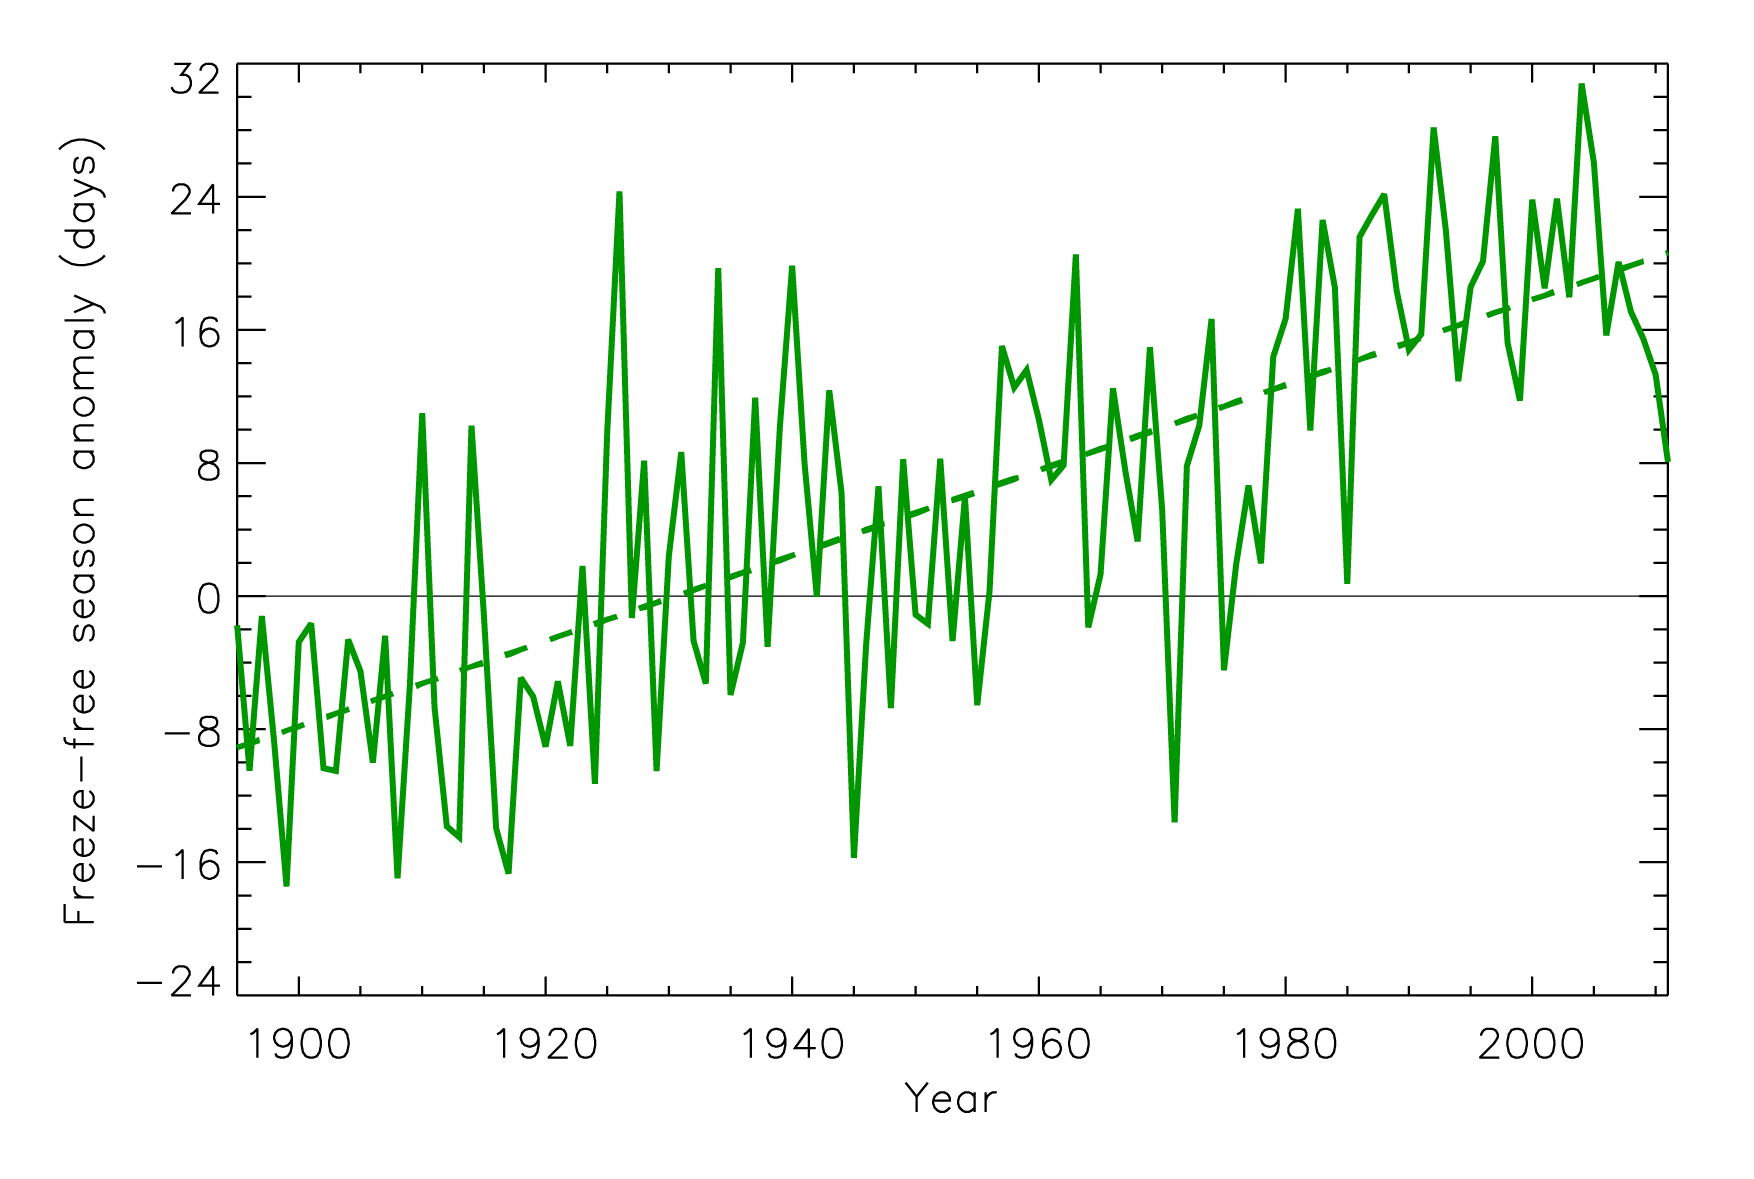
Time series of freeze-free season anomalies |
Observed |
Temperature |
Great Plains |
Regional Climate Trends and Scenarios for the U.S. National Climate Assessment. Part 4. Climate of the U.S. Great Plains |
NCA 3 |
 |
|
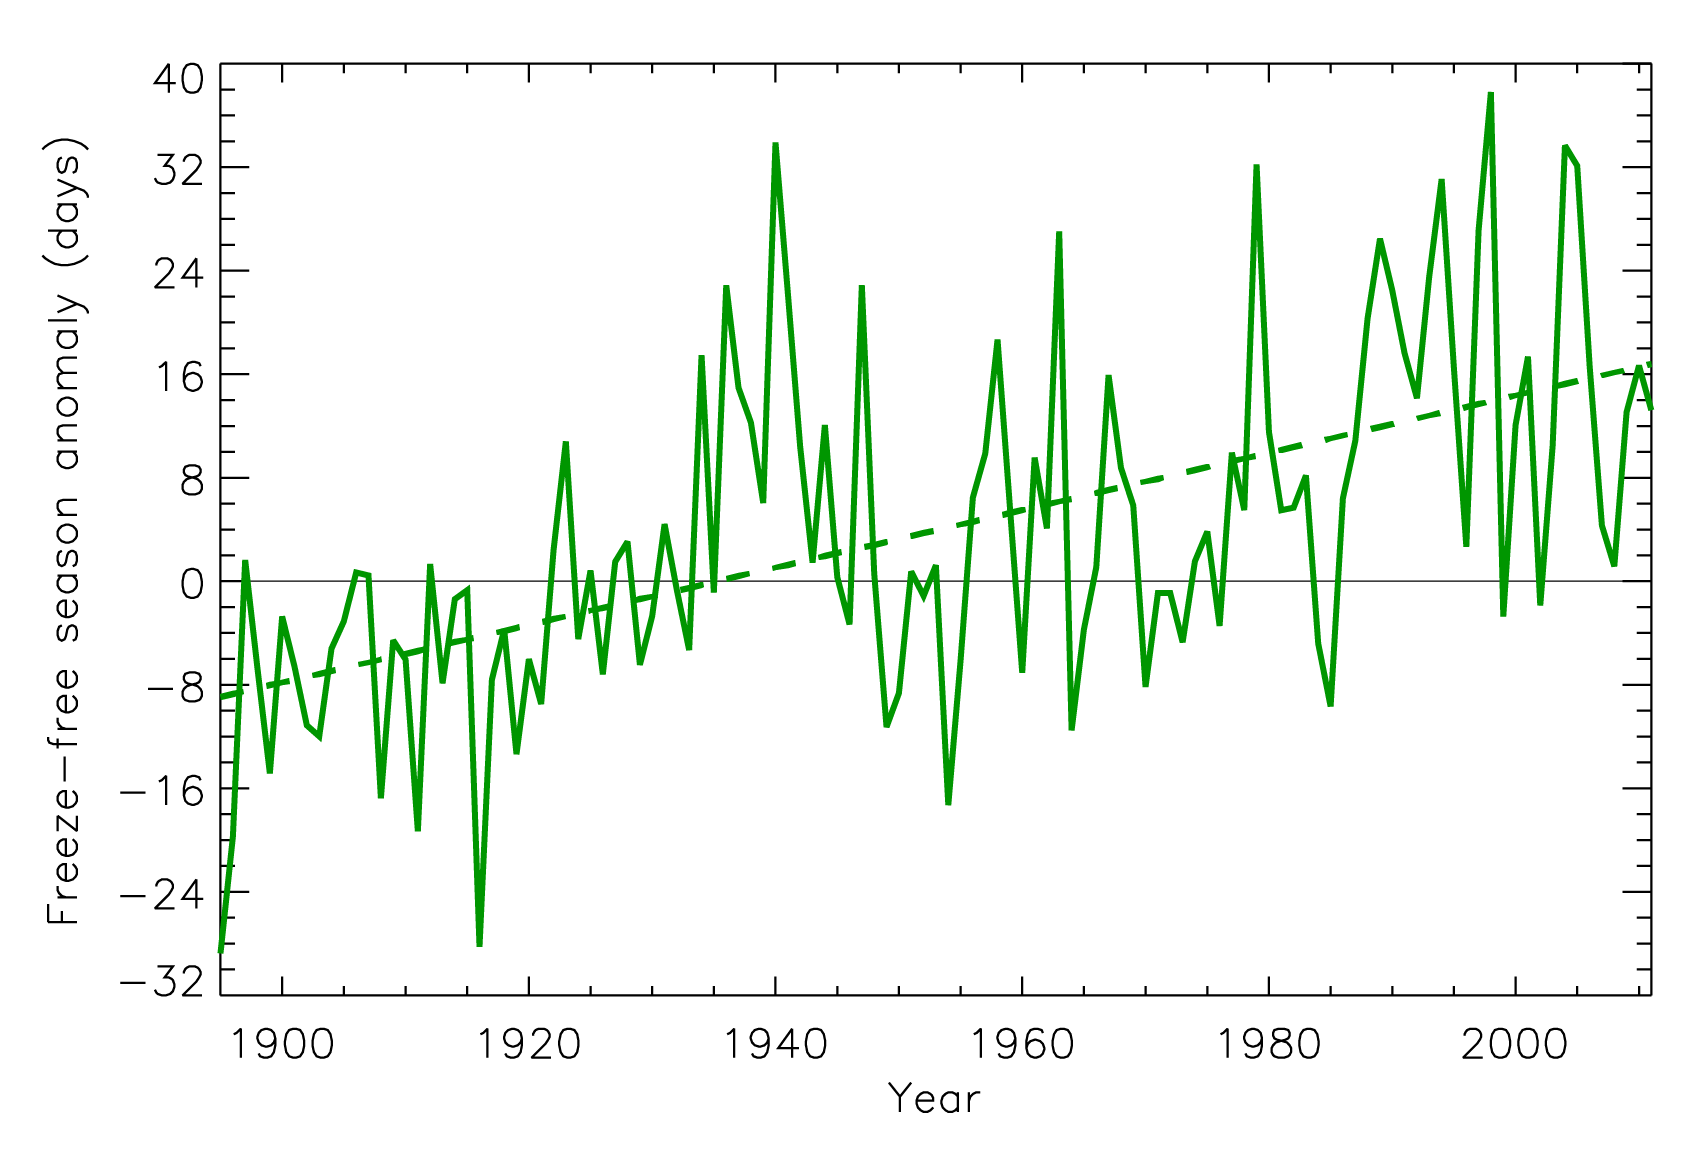
Time series of freeze-free season anomalies |
Observed |
Temperature |
Northeast |
Regional Climate Trends and Scenarios for the U.S. National Climate Assessment. Part 1. Climate of the Northeast U.S. |
NCA 3 |
 |
|
Time series of freeze-free season anomalies |
Observed |
Temperature |
Southeast and Caribbean |
Regional Climate Trends and Scenarios for the U.S. National Climate Assessment. Part 2. Climate of the Southeast U.S. |
NCA 3 |
 |
|
Time series of freeze-free season anomalies |
Observed |
Temperature |
Southwest |
Regional Climate Trends and Scenarios for the U.S. National Climate Assessment. Part 5. Climate of the Southwest U.S. |
NCA 3 |
 |
|
Time series of freeze-free season anomalies |
Observed |
Temperature |
Northwest |
Regional Climate Trends and Scenarios for the U.S. National Climate Assessment. Part 6. Climate of the Northwest U.S. |
NCA 3 |
 |
|
Time series of freeze-free season anomalies |
Observed |
Temperature |
Midwest |
Regional Climate Trends and Scenarios for the U.S. National Climate Assessment. Part 3. Climate of the Midwest U.S. |
NCA 3 |
 |
|
Time series of extreme precipitation index for the occurrence of 1-day, 1 in 5-year extreme precipitation |
Observed |
Precipitation |
Southeast and Caribbean |
Regional Climate Trends and Scenarios for the U.S. National Climate Assessment. Part 2. Climate of the Southeast U.S. |
NCA 3 |
 |
|
Time series of extreme precipitation index for the occurrence of 1-day, 1 in 5-year extreme precipitation |
Observed |
Precipitation |
Great Plains |
Regional Climate Trends and Scenarios for the U.S. National Climate Assessment. Part 4. Climate of the U.S. Great Plains |
NCA 3 |
 |
|
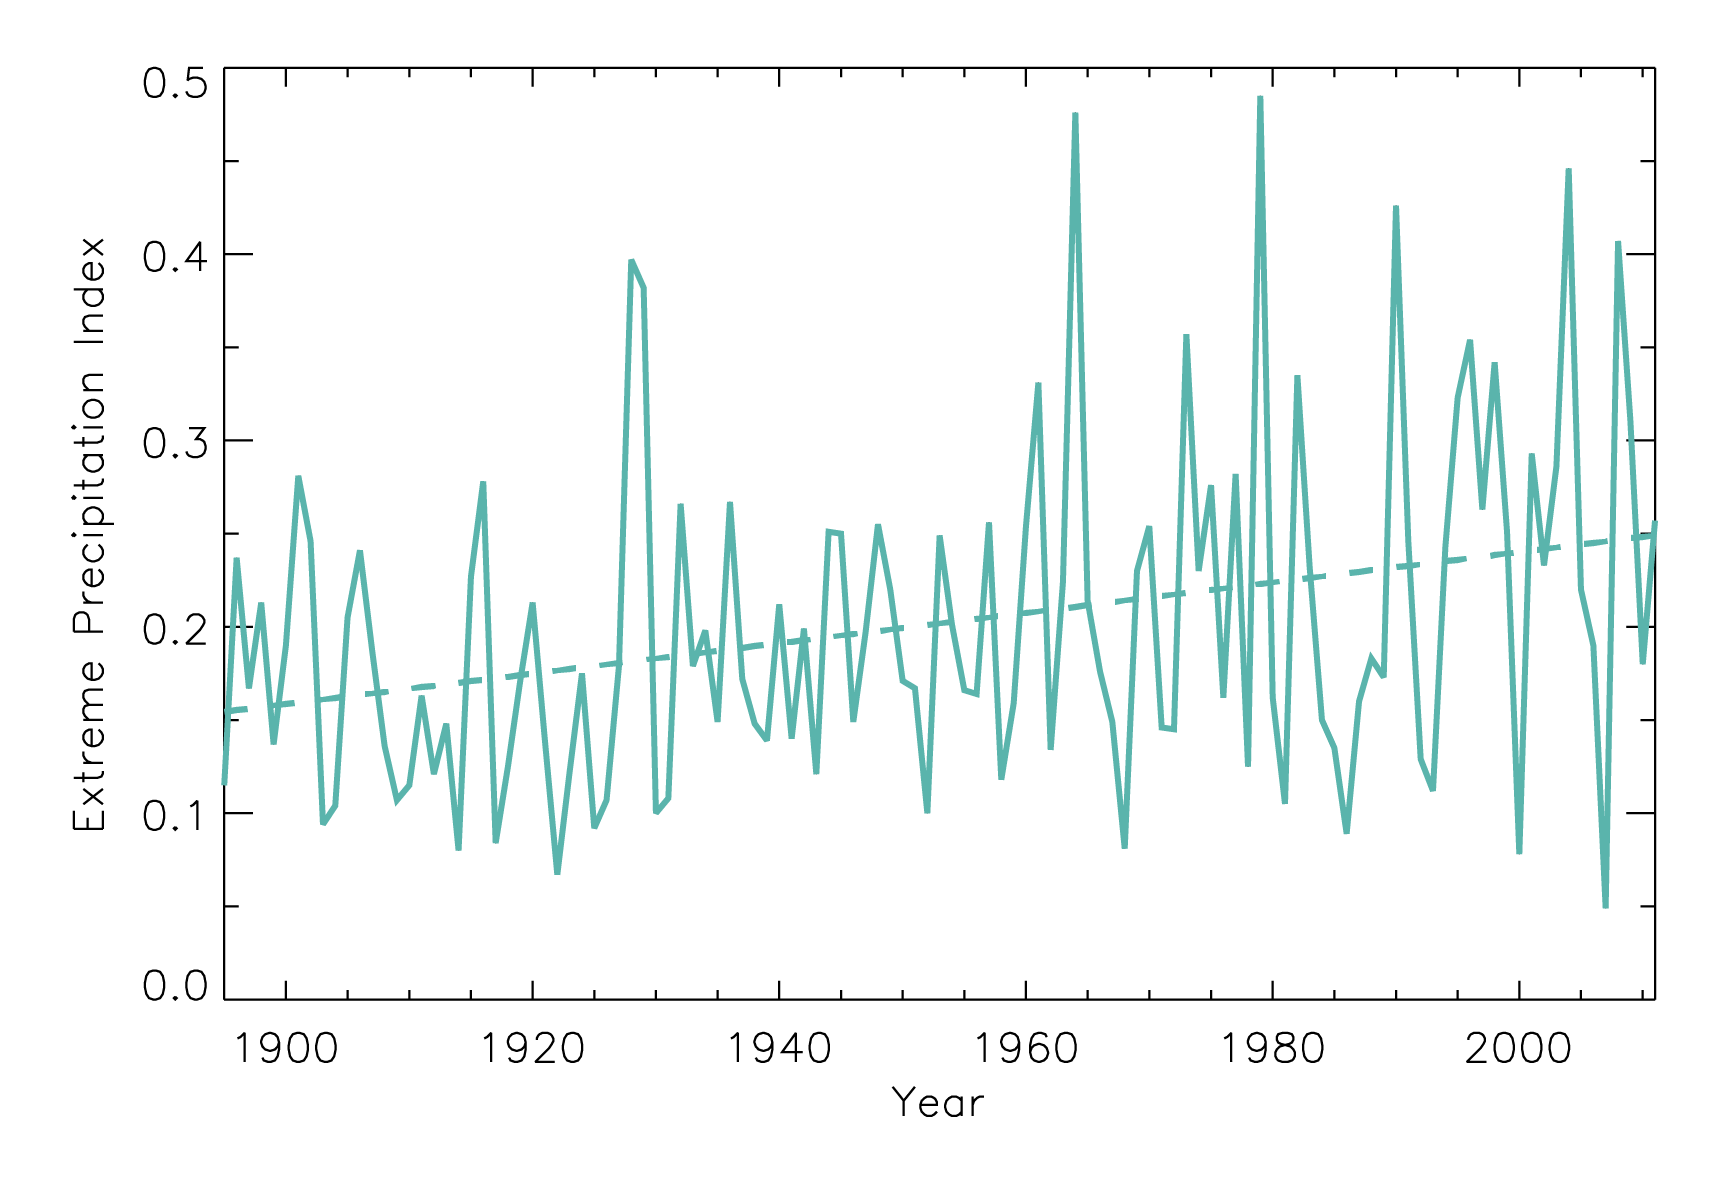
Time series of extreme precipitation index for the occurrence of 1-day, 1 in 5-year extreme precipitation |
Observed |
Precipitation |
Northeast |
Regional Climate Trends and Scenarios for the U.S. National Climate Assessment. Part 1. Climate of the Northeast U.S. |
NCA 3 |
 |
|
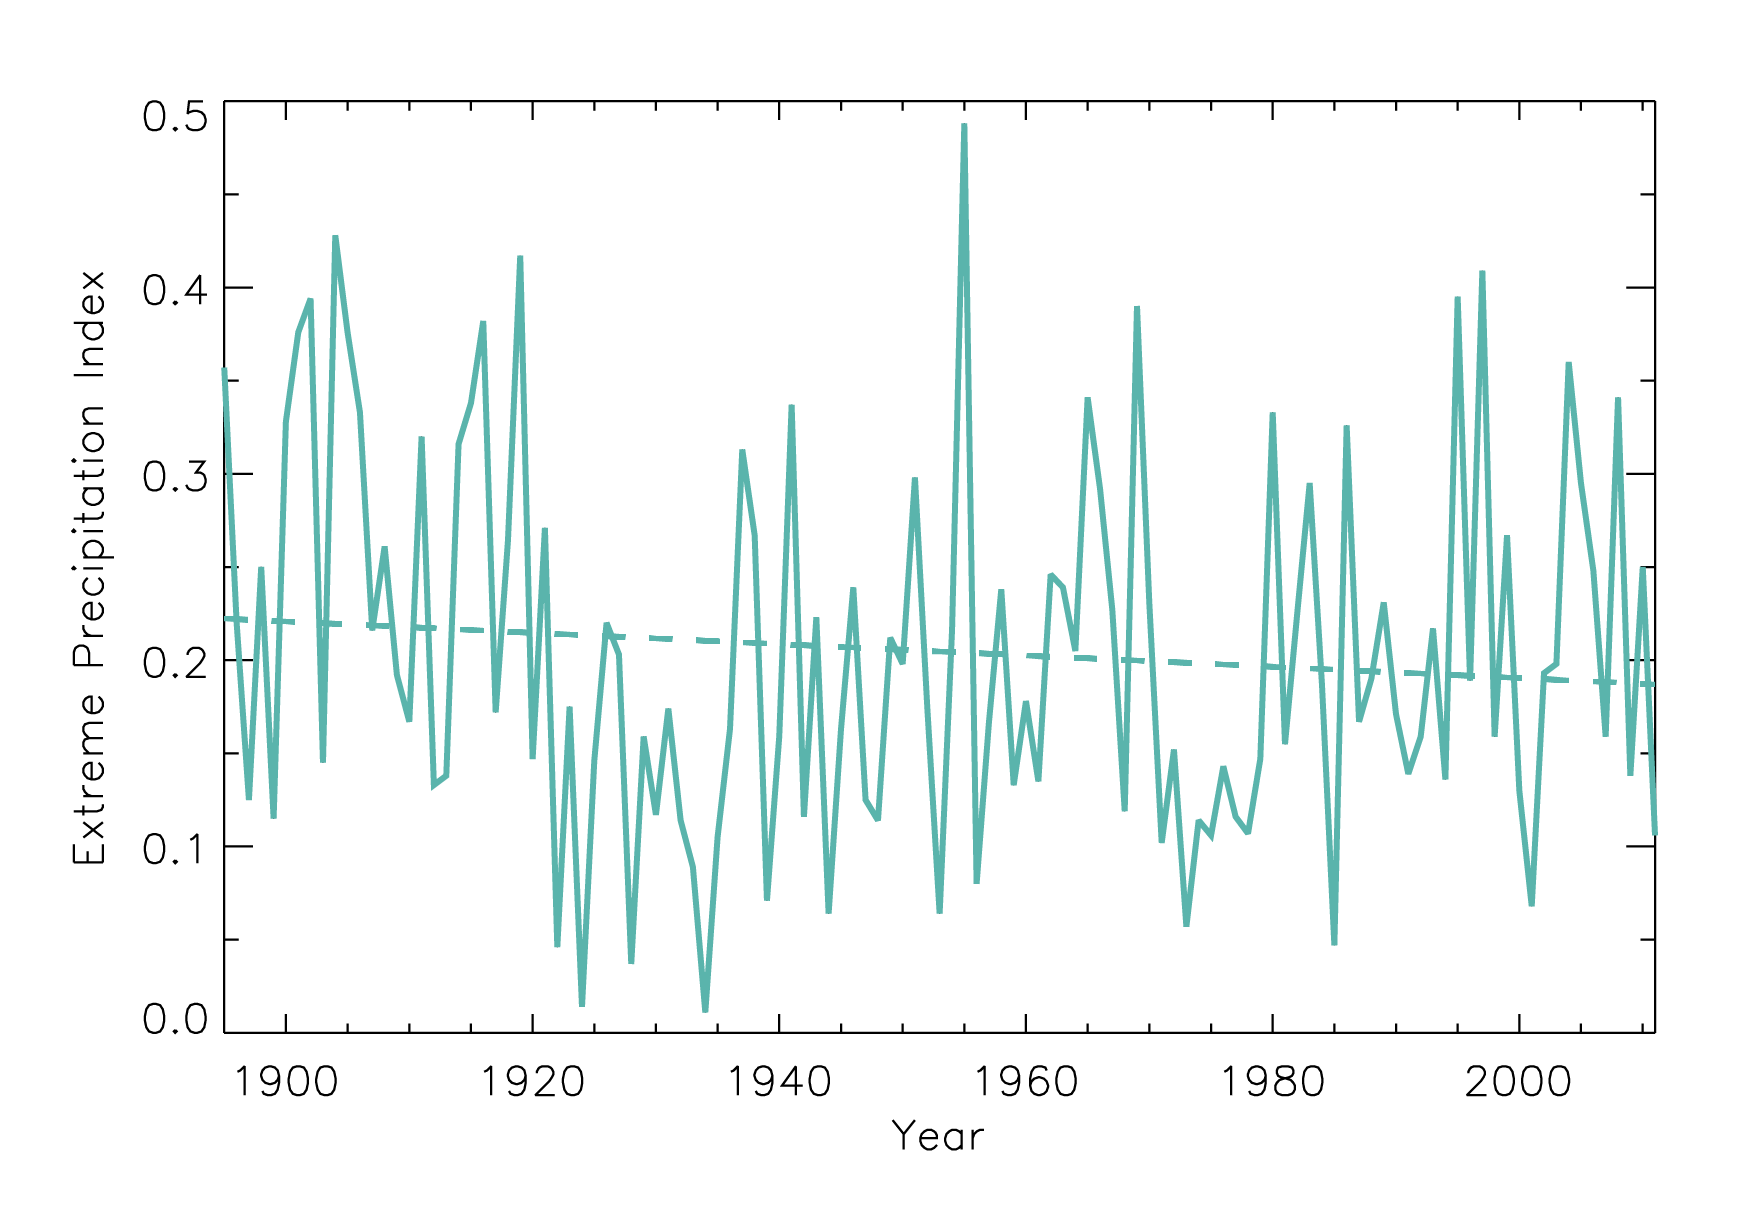
Time series of extreme precipitation index for the occurrence of 1-day, 1 in 5-year extreme precipitation |
Observed |
Precipitation |
Southwest |
Regional Climate Trends and Scenarios for the U.S. National Climate Assessment. Part 5. Climate of the Southwest U.S. |
NCA 3 |
 |
|
Time series of extreme precipitation index for the occurrence of 1-day, 1 in 5-year extreme precipitation |
Observed |
Precipitation |
Northwest |
Regional Climate Trends and Scenarios for the U.S. National Climate Assessment. Part 6. Climate of the Northwest U.S. |
NCA 3 |
 |
|
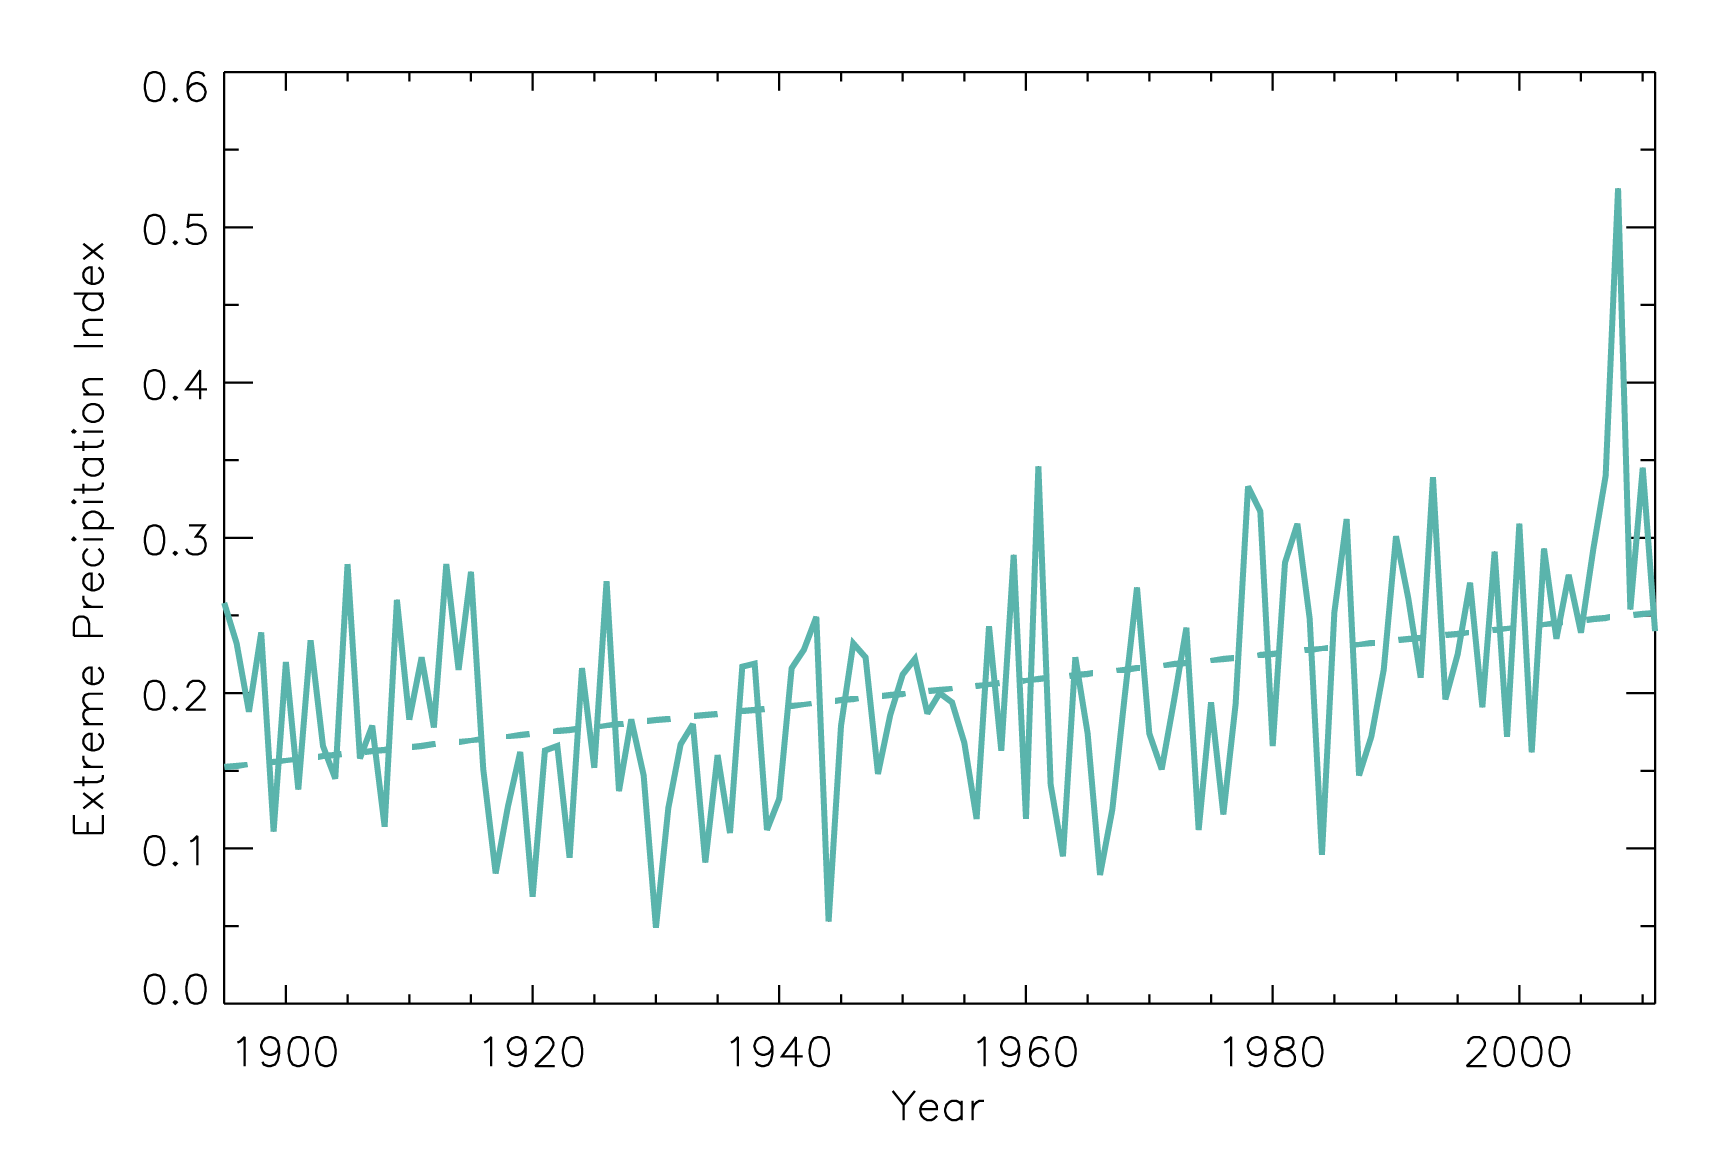
Time series of extreme precipitation index for the occurrence of 1-day, 1 in 5-year extreme precipitation |
Observed |
Precipitation |
Midwest |
Regional Climate Trends and Scenarios for the U.S. National Climate Assessment. Part 3. Climate of the Midwest U.S. |
NCA 3 |
 |
|
Time series of average snow depth at 23 snow course sites in Maine |
Observed |
Snow |
Northeast |
Regional Climate Trends and Scenarios for the U.S. National Climate Assessment. Part 1. Climate of the Northeast U.S. |
NCA 3 |
 |
|
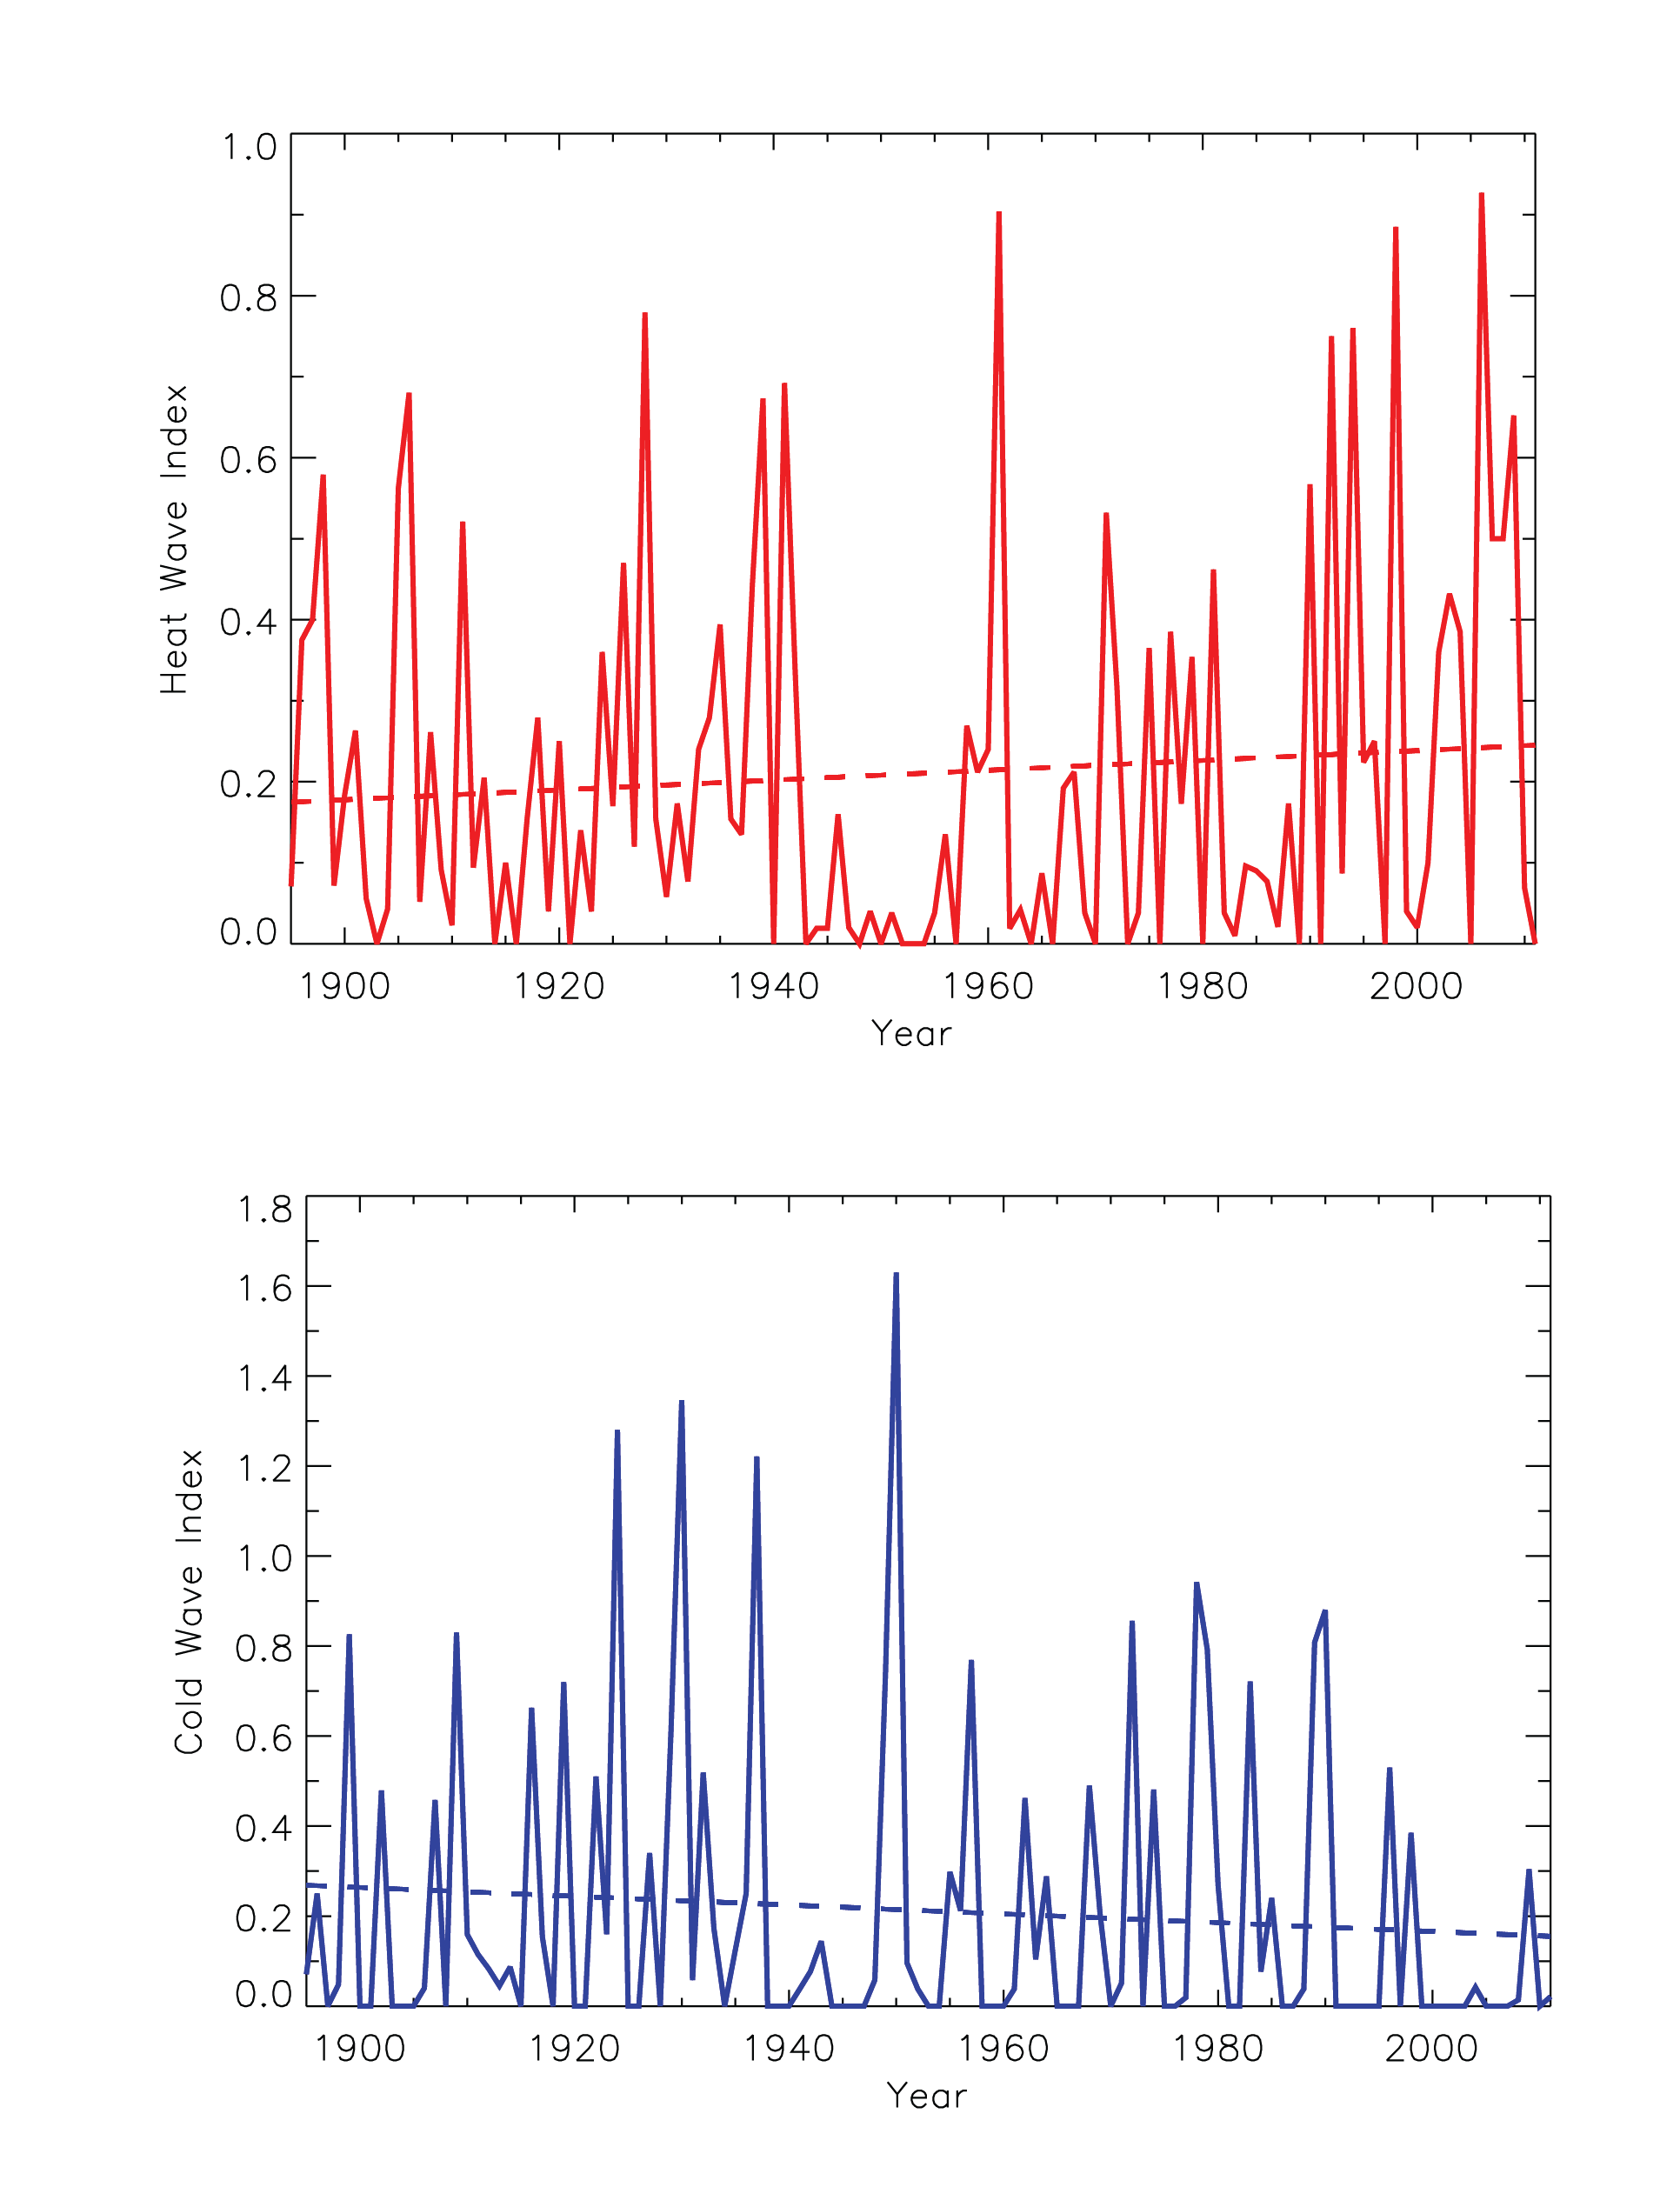
Time series of an index for the occurrence of heat waves and cold waves |
Observed |
Temperature |
Great Plains |
Regional Climate Trends and Scenarios for the U.S. National Climate Assessment. Part 4. Climate of the U.S. Great Plains |
NCA 3 |
 |
|
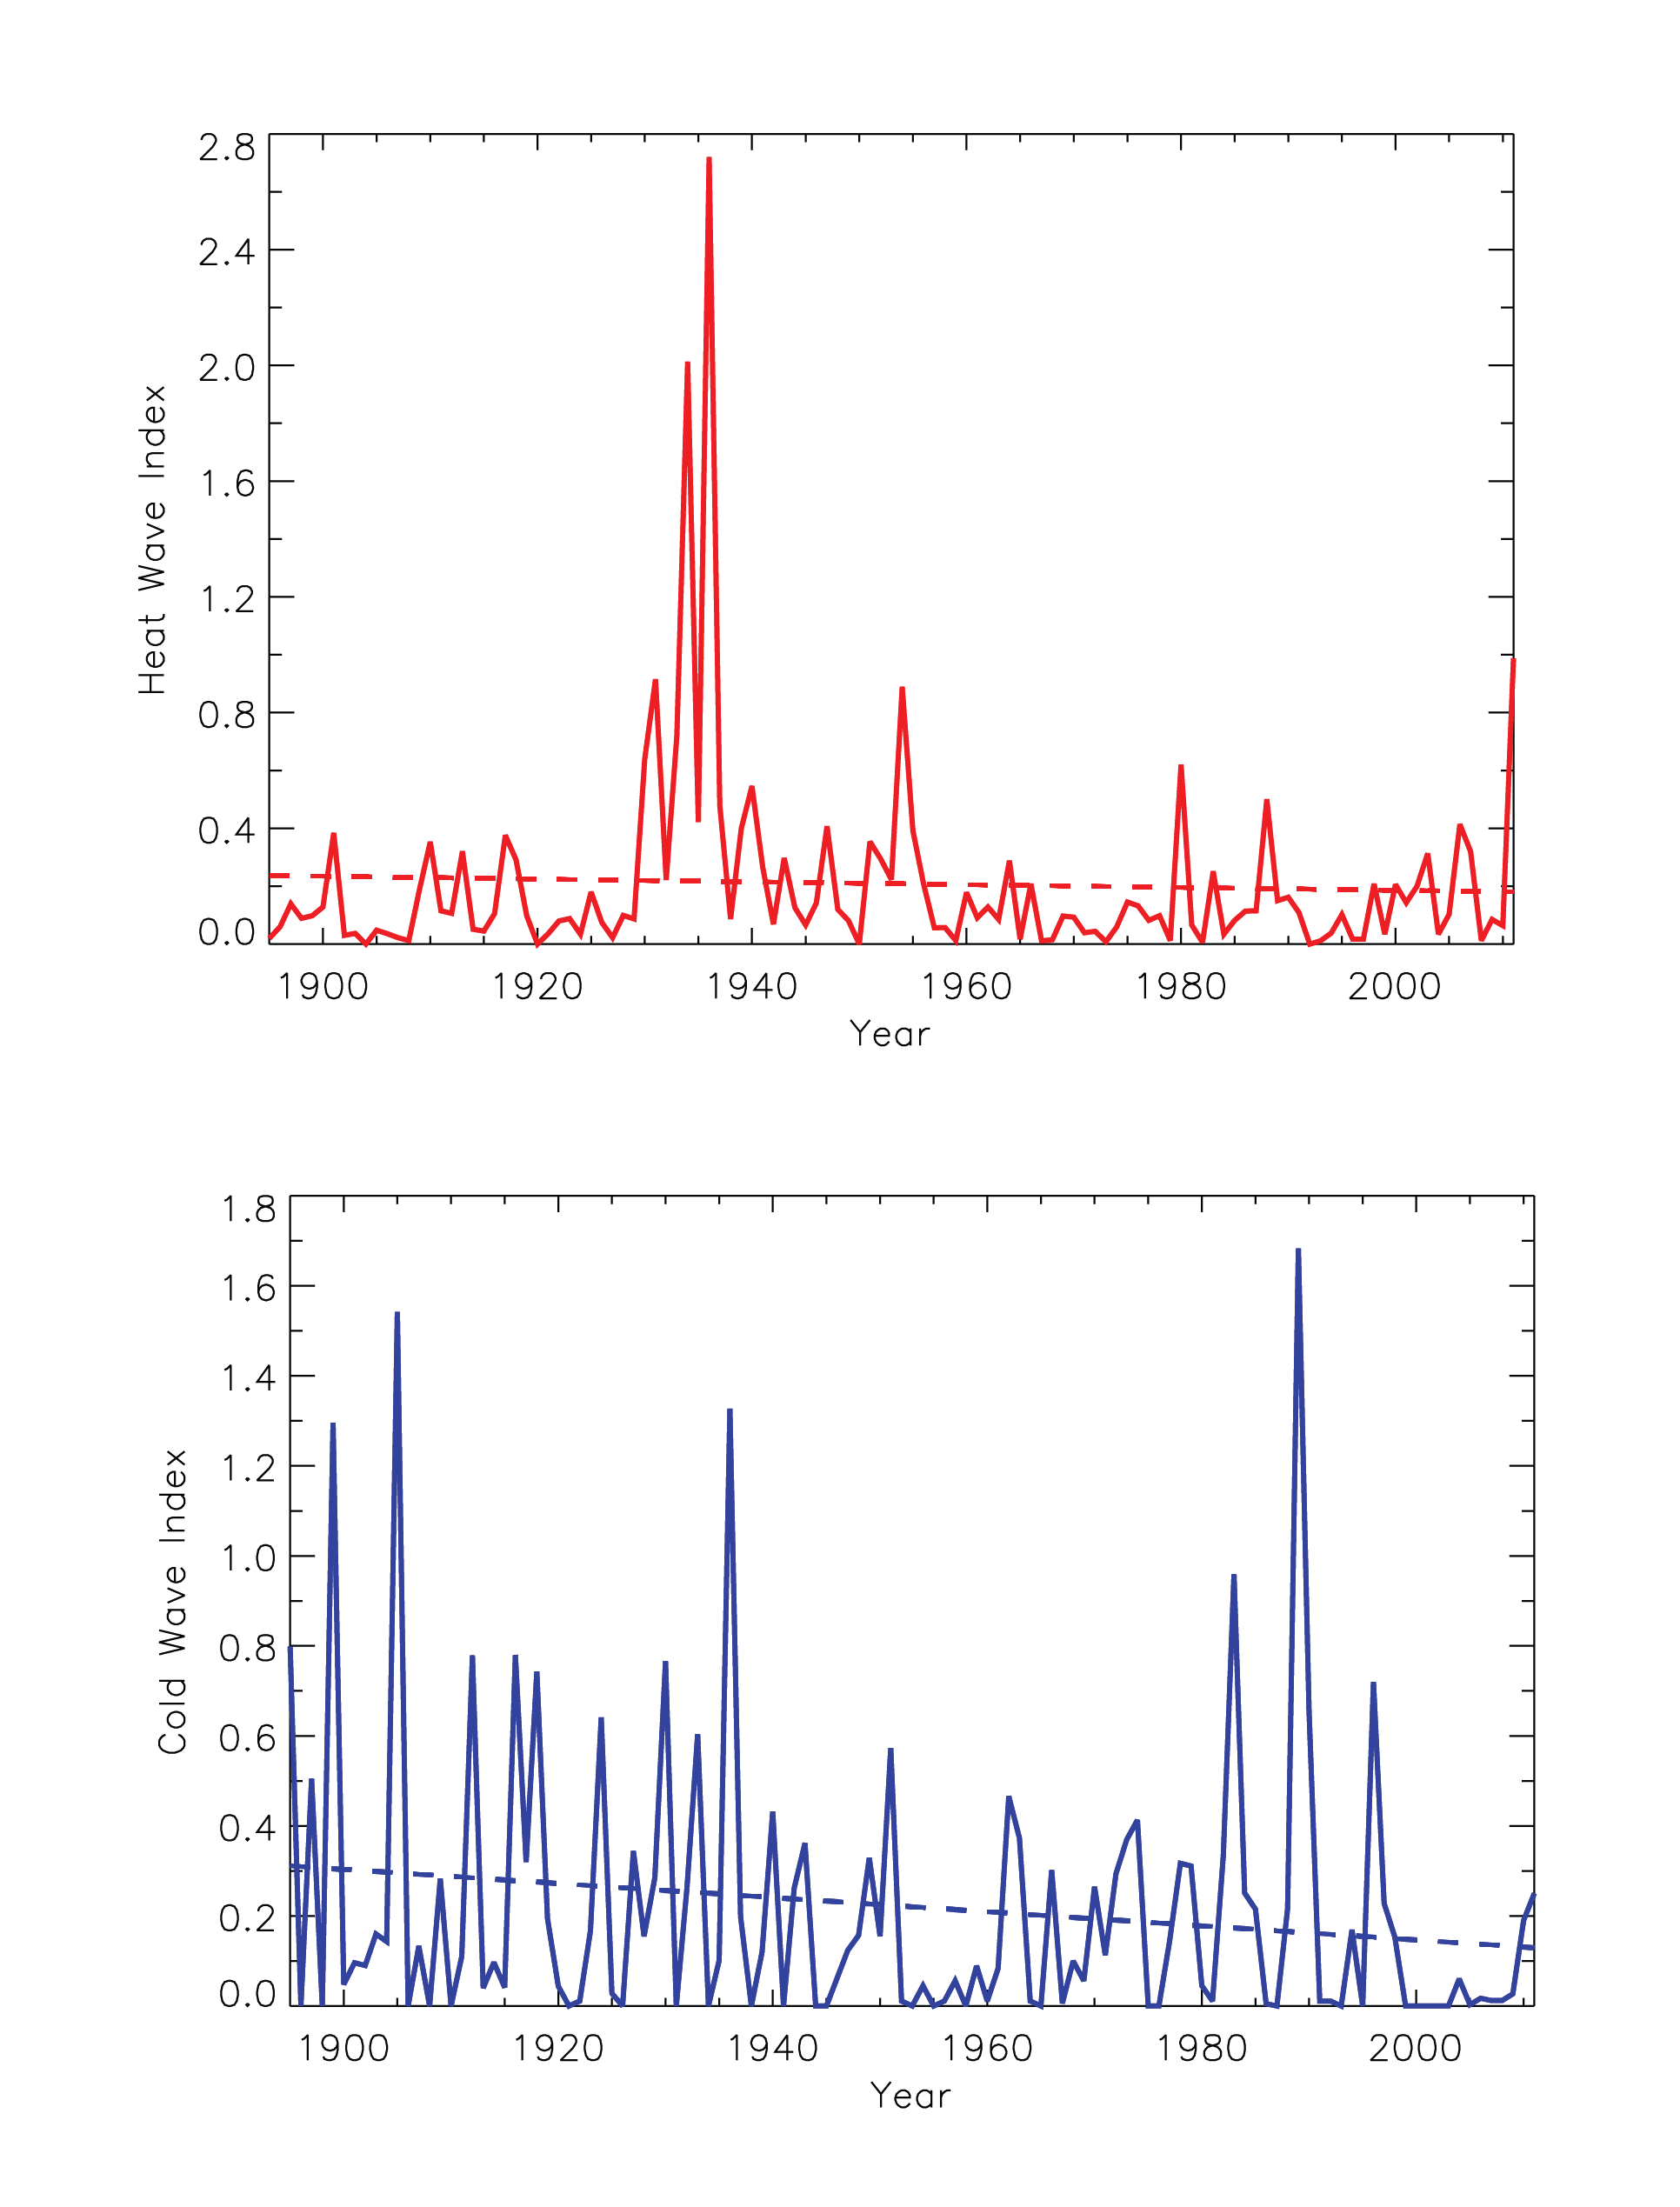
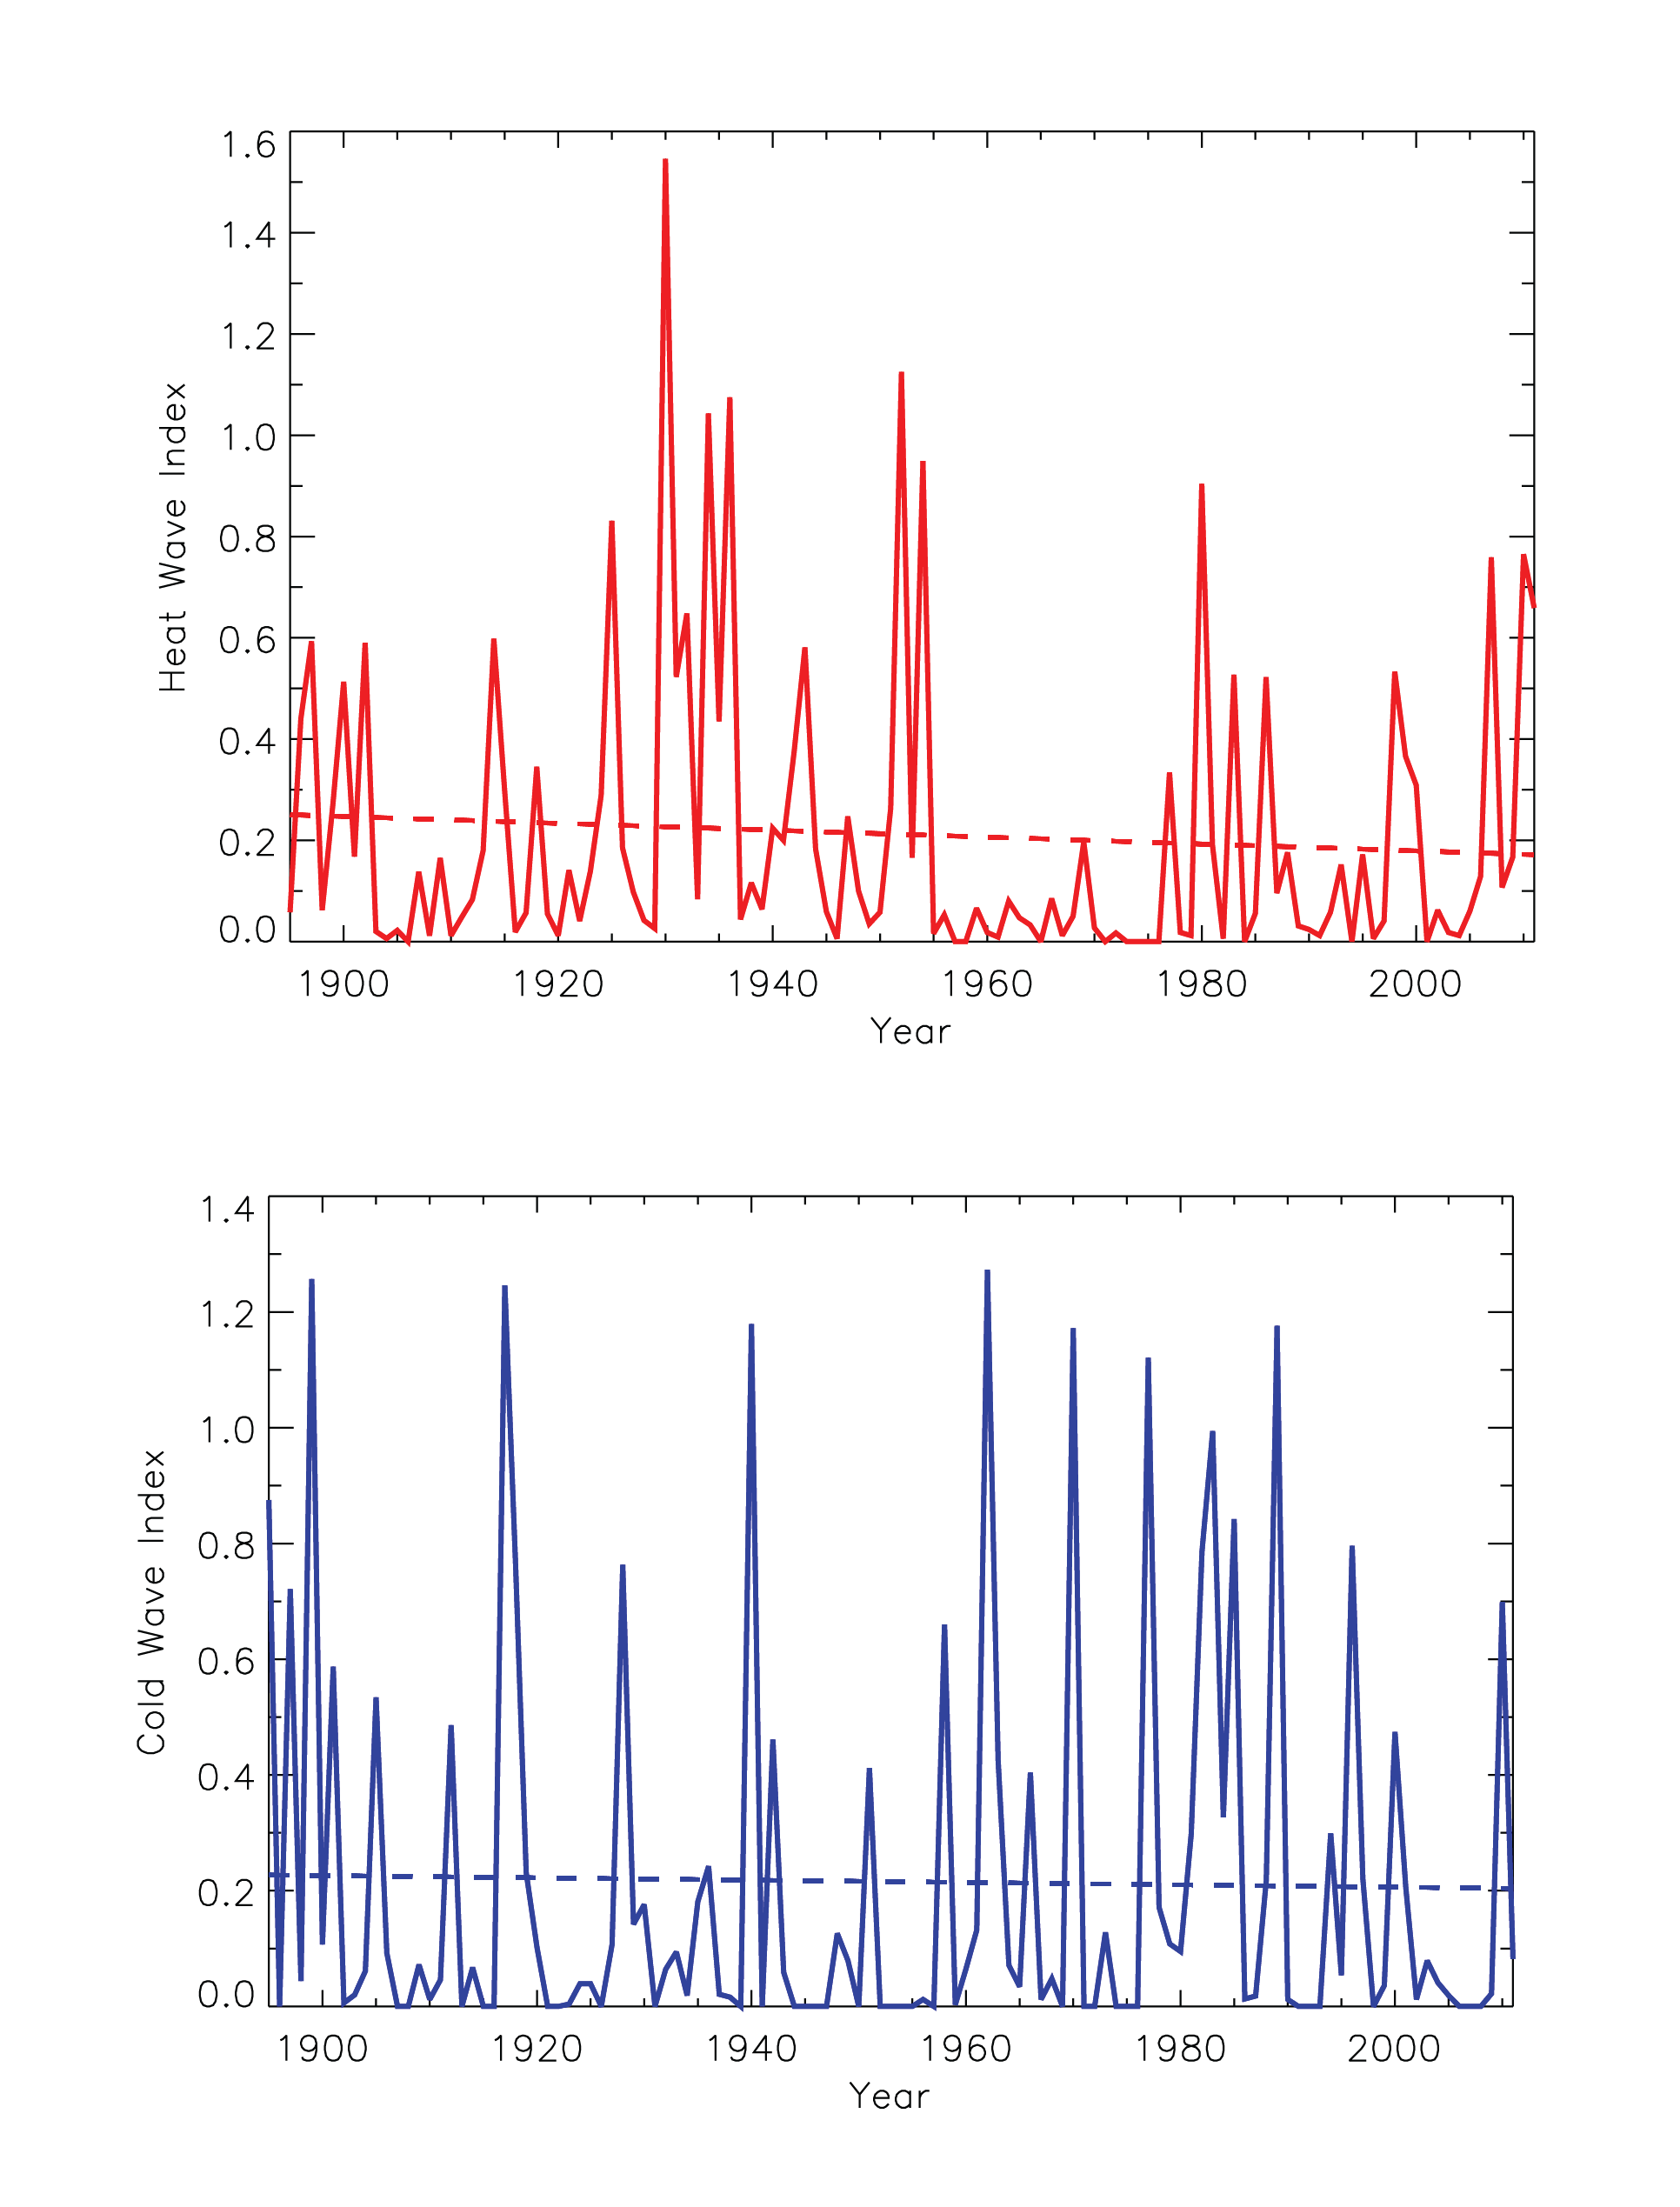
Time series of an index for the occurrence of heat waves and cold waves |
Observed |
Temperature |
Northeast |
Regional Climate Trends and Scenarios for the U.S. National Climate Assessment. Part 1. Climate of the Northeast U.S. |
NCA 3 |
 |
|
Time series of an index for the occurrence of heat waves and cold waves |
Observed |
Temperature |
Southeast and Caribbean |
Regional Climate Trends and Scenarios for the U.S. National Climate Assessment. Part 2. Climate of the Southeast U.S. |
NCA 3 |
 |
|
Time series of an index for the occurrence of heat waves and cold waves |
Observed |
Temperature |
Southwest |
Regional Climate Trends and Scenarios for the U.S. National Climate Assessment. Part 5. Climate of the Southwest U.S. |
NCA 3 |
 |
|
Time series of an index for the occurrence of heat waves and cold waves |
Observed |
Temperature |
Northwest |
Regional Climate Trends and Scenarios for the U.S. National Climate Assessment. Part 6. Climate of the Northwest U.S. |
NCA 3 |
 |
|
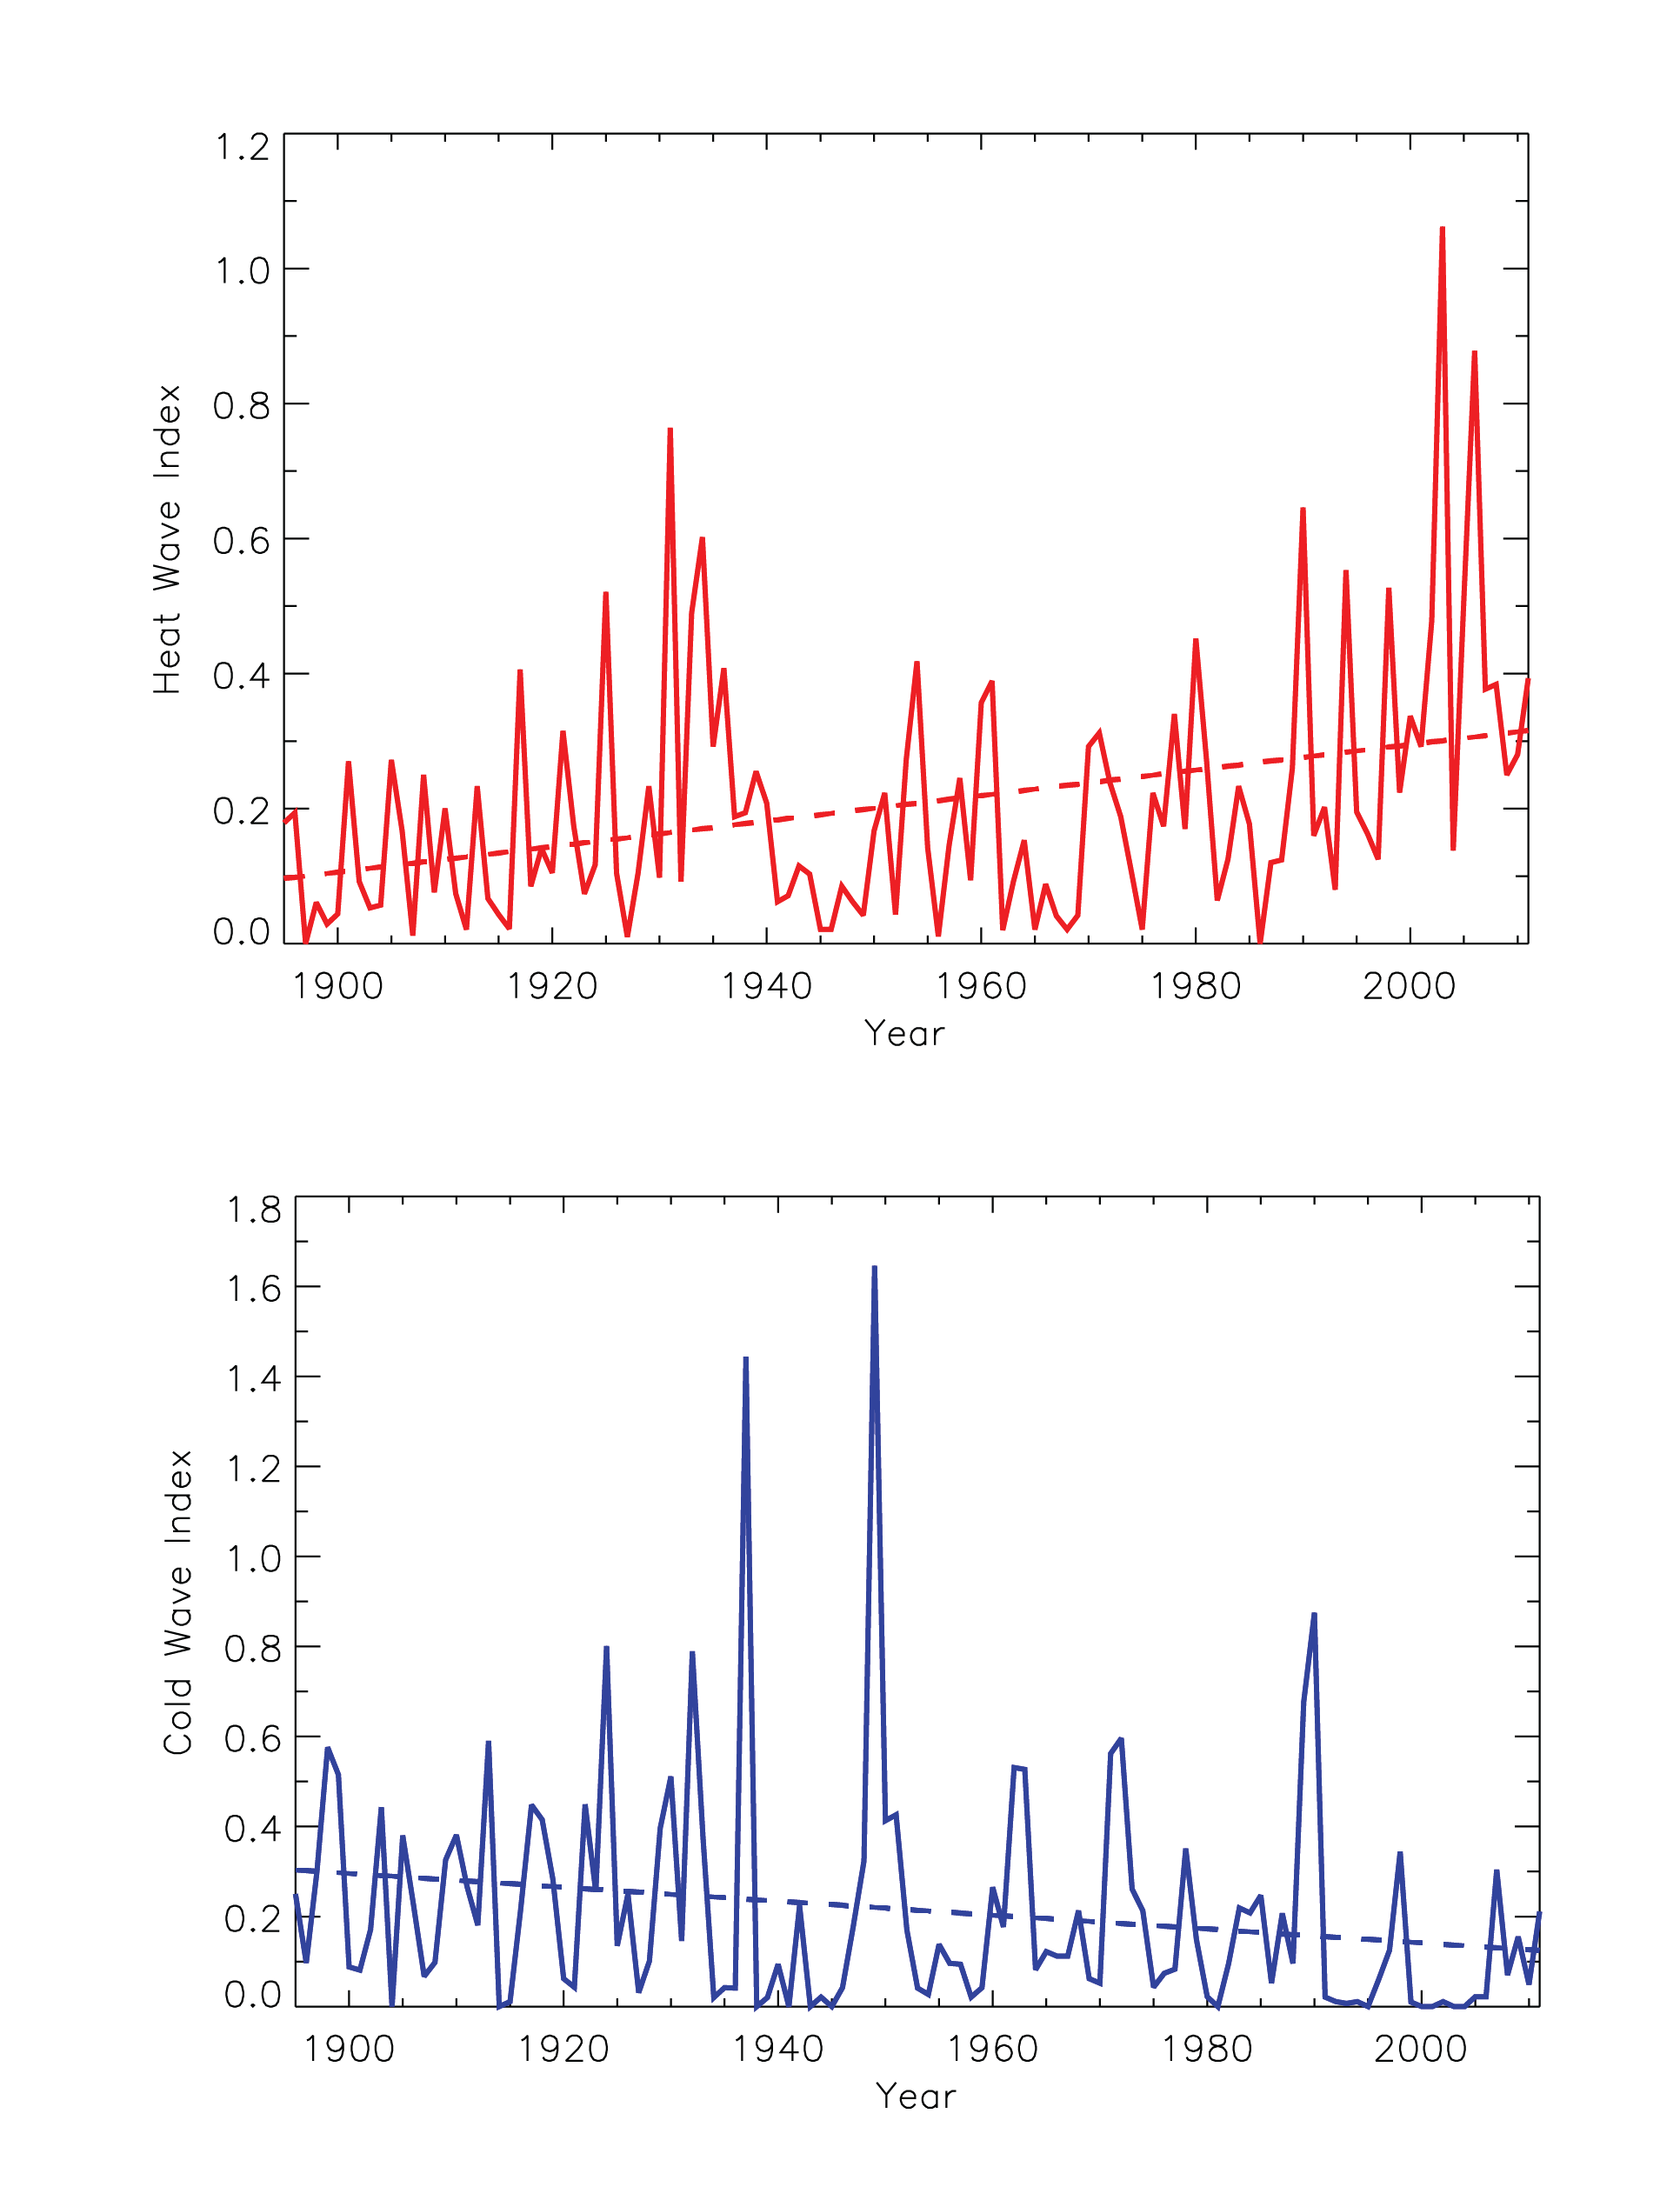
Time series of an index for the occurrence of heat waves and cold waves |
Observed |
Temperature |
Midwest |
Regional Climate Trends and Scenarios for the U.S. National Climate Assessment. Part 3. Climate of the Midwest U.S. |
NCA 3 |
 |
|
Time series of an index for the occurrence of cold waves and heat waves |
Observed |
Temperature |
Alaska and Arctic |
Regional Climate Trends and Scenarios for the U.S. National Climate Assessment. Part 7. Climate of Alaska |
NCA 3 |
 |
|
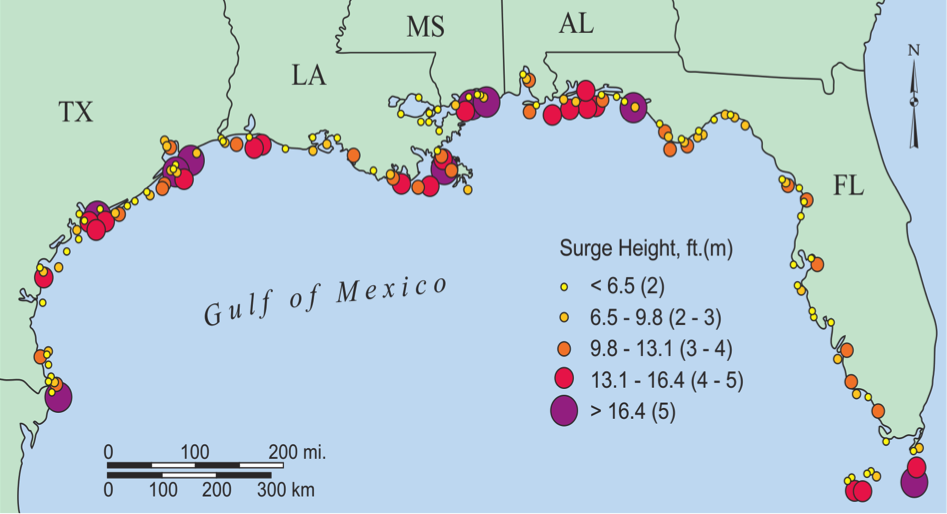
The location and height of peak storm surges along the U.S. Gulf Coast |
Observed |
Sea |
Southeast and Caribbean |
Regional Climate Trends and Scenarios for the U.S. National Climate Assessment. Part 2. Climate of the Southeast U.S. |
NCA 3 |
 |
|
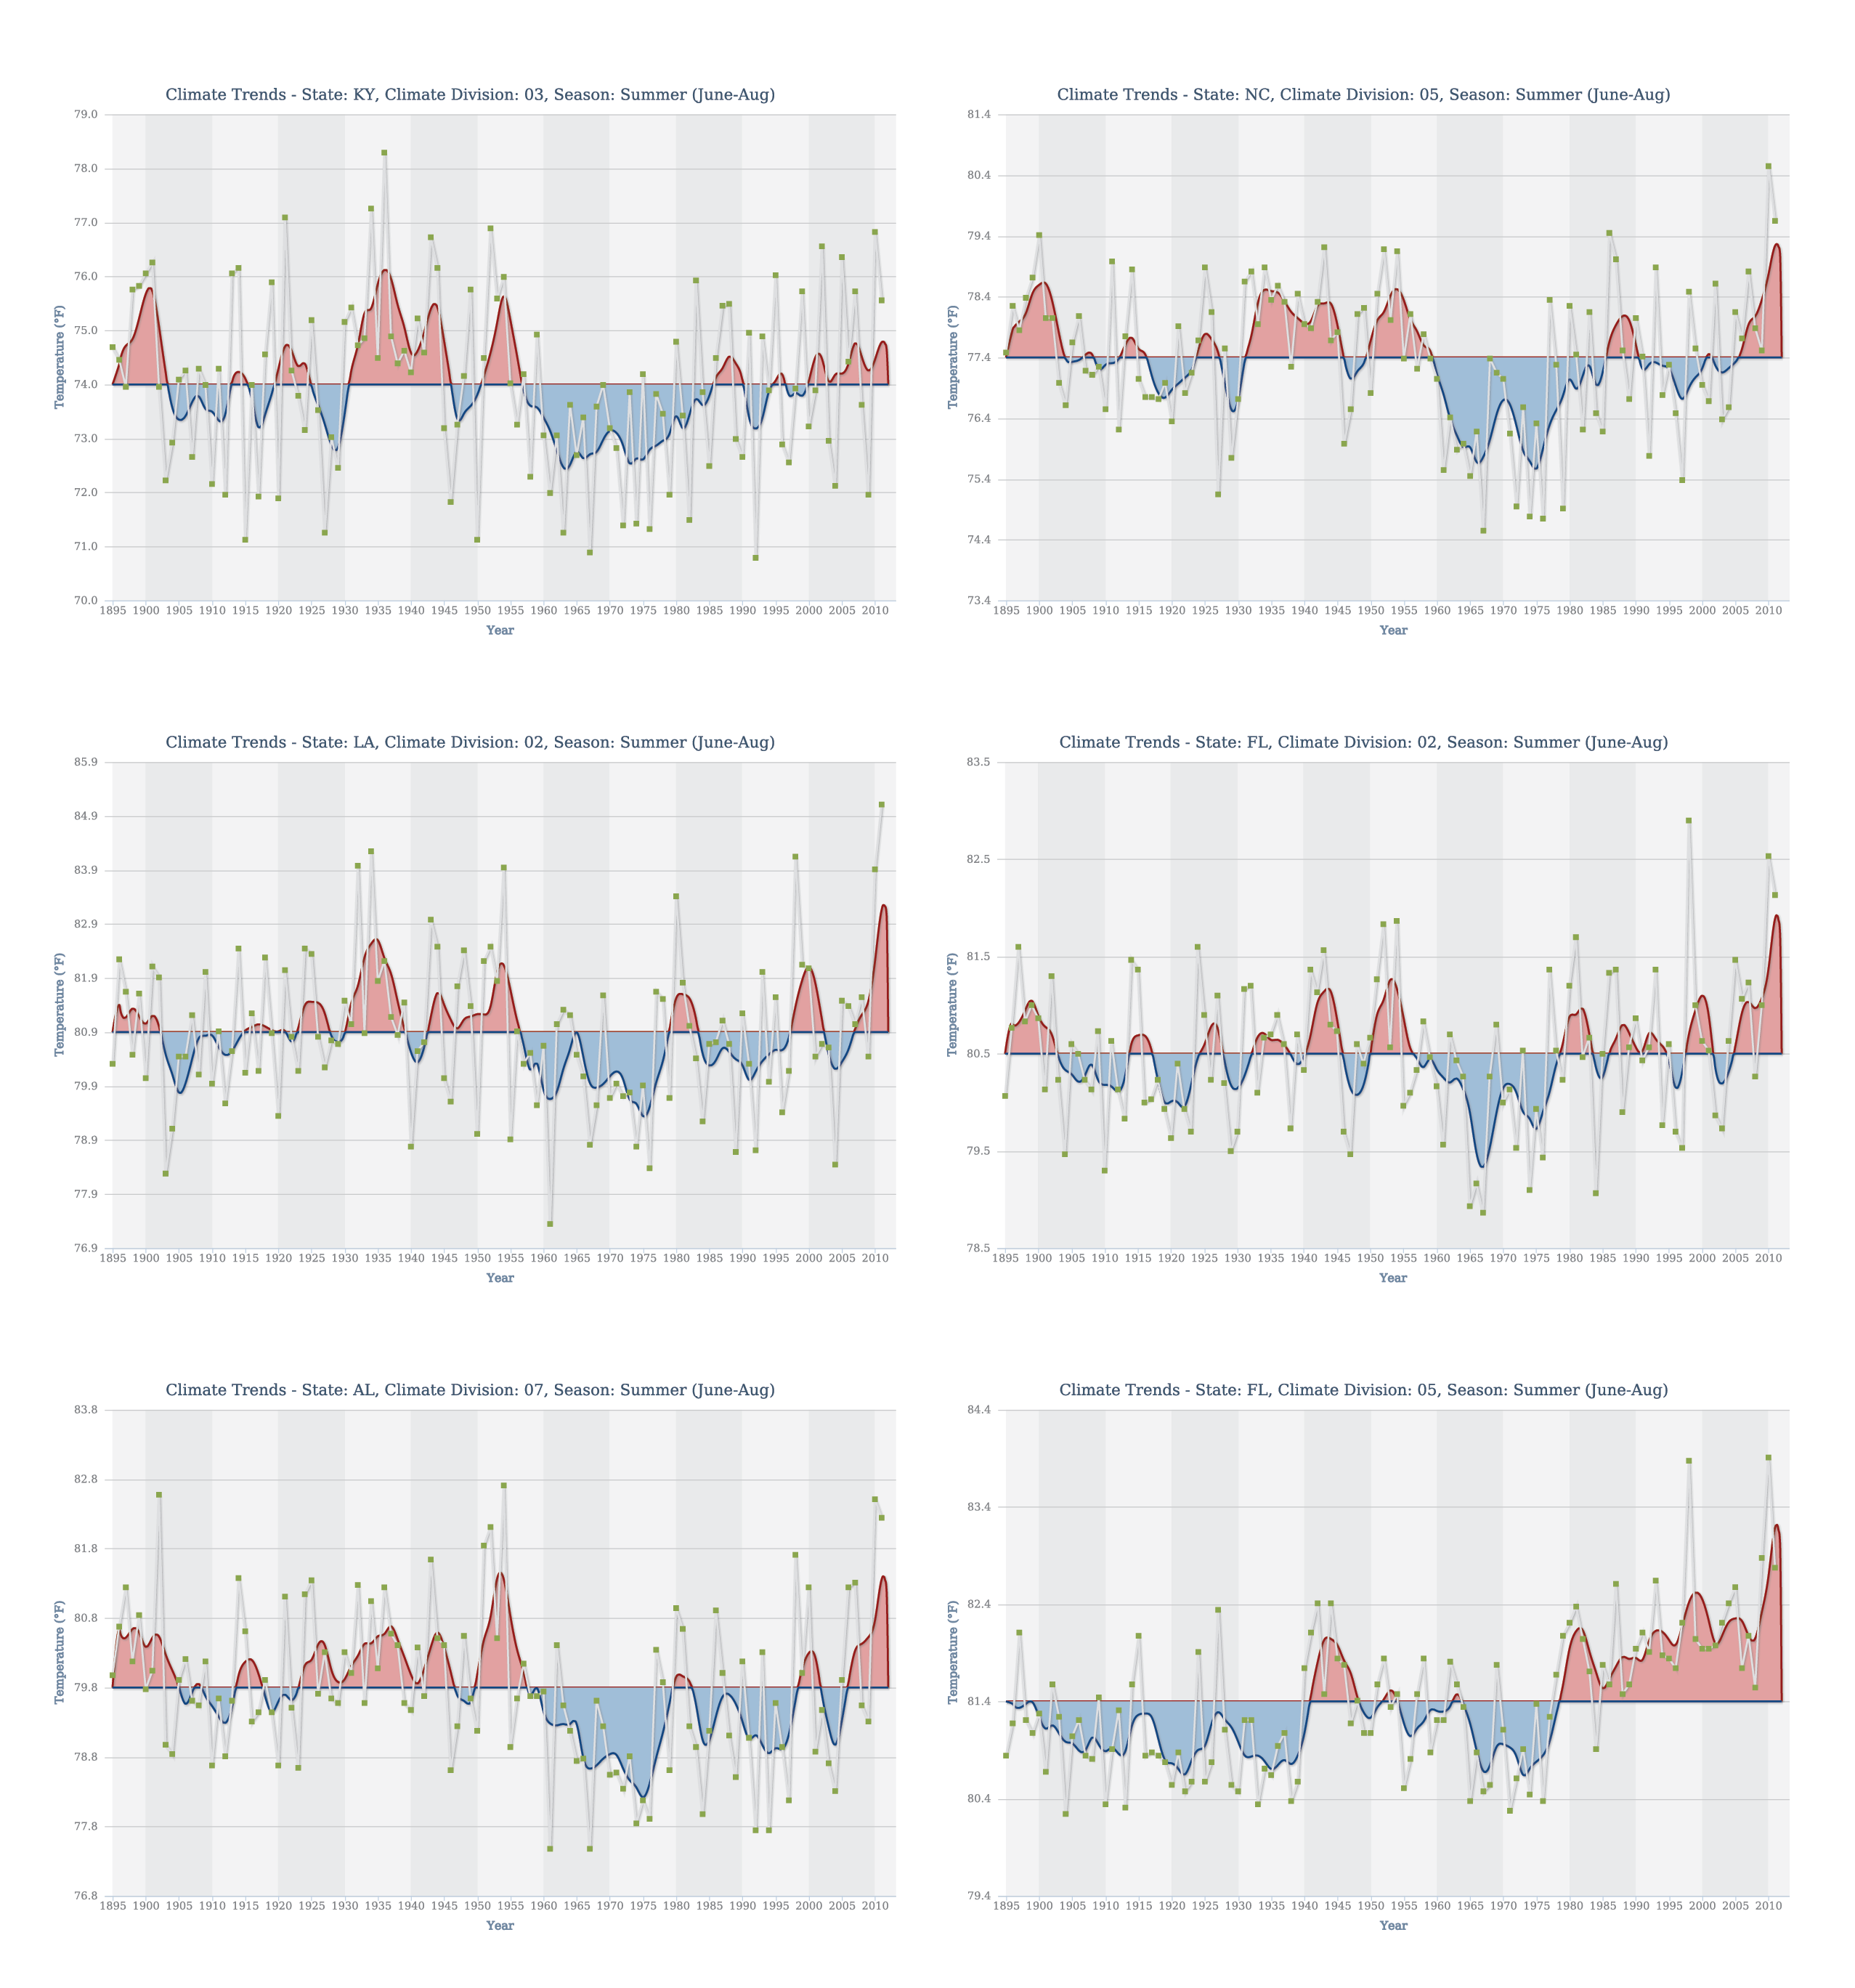
Summer temperature trends at six climate divisions in the Southeast region |
Observed |
Temperature |
Southeast and Caribbean |
Regional Climate Trends and Scenarios for the U.S. National Climate Assessment. Part 2. Climate of the Southeast U.S. |
NCA 3 |
 |
|
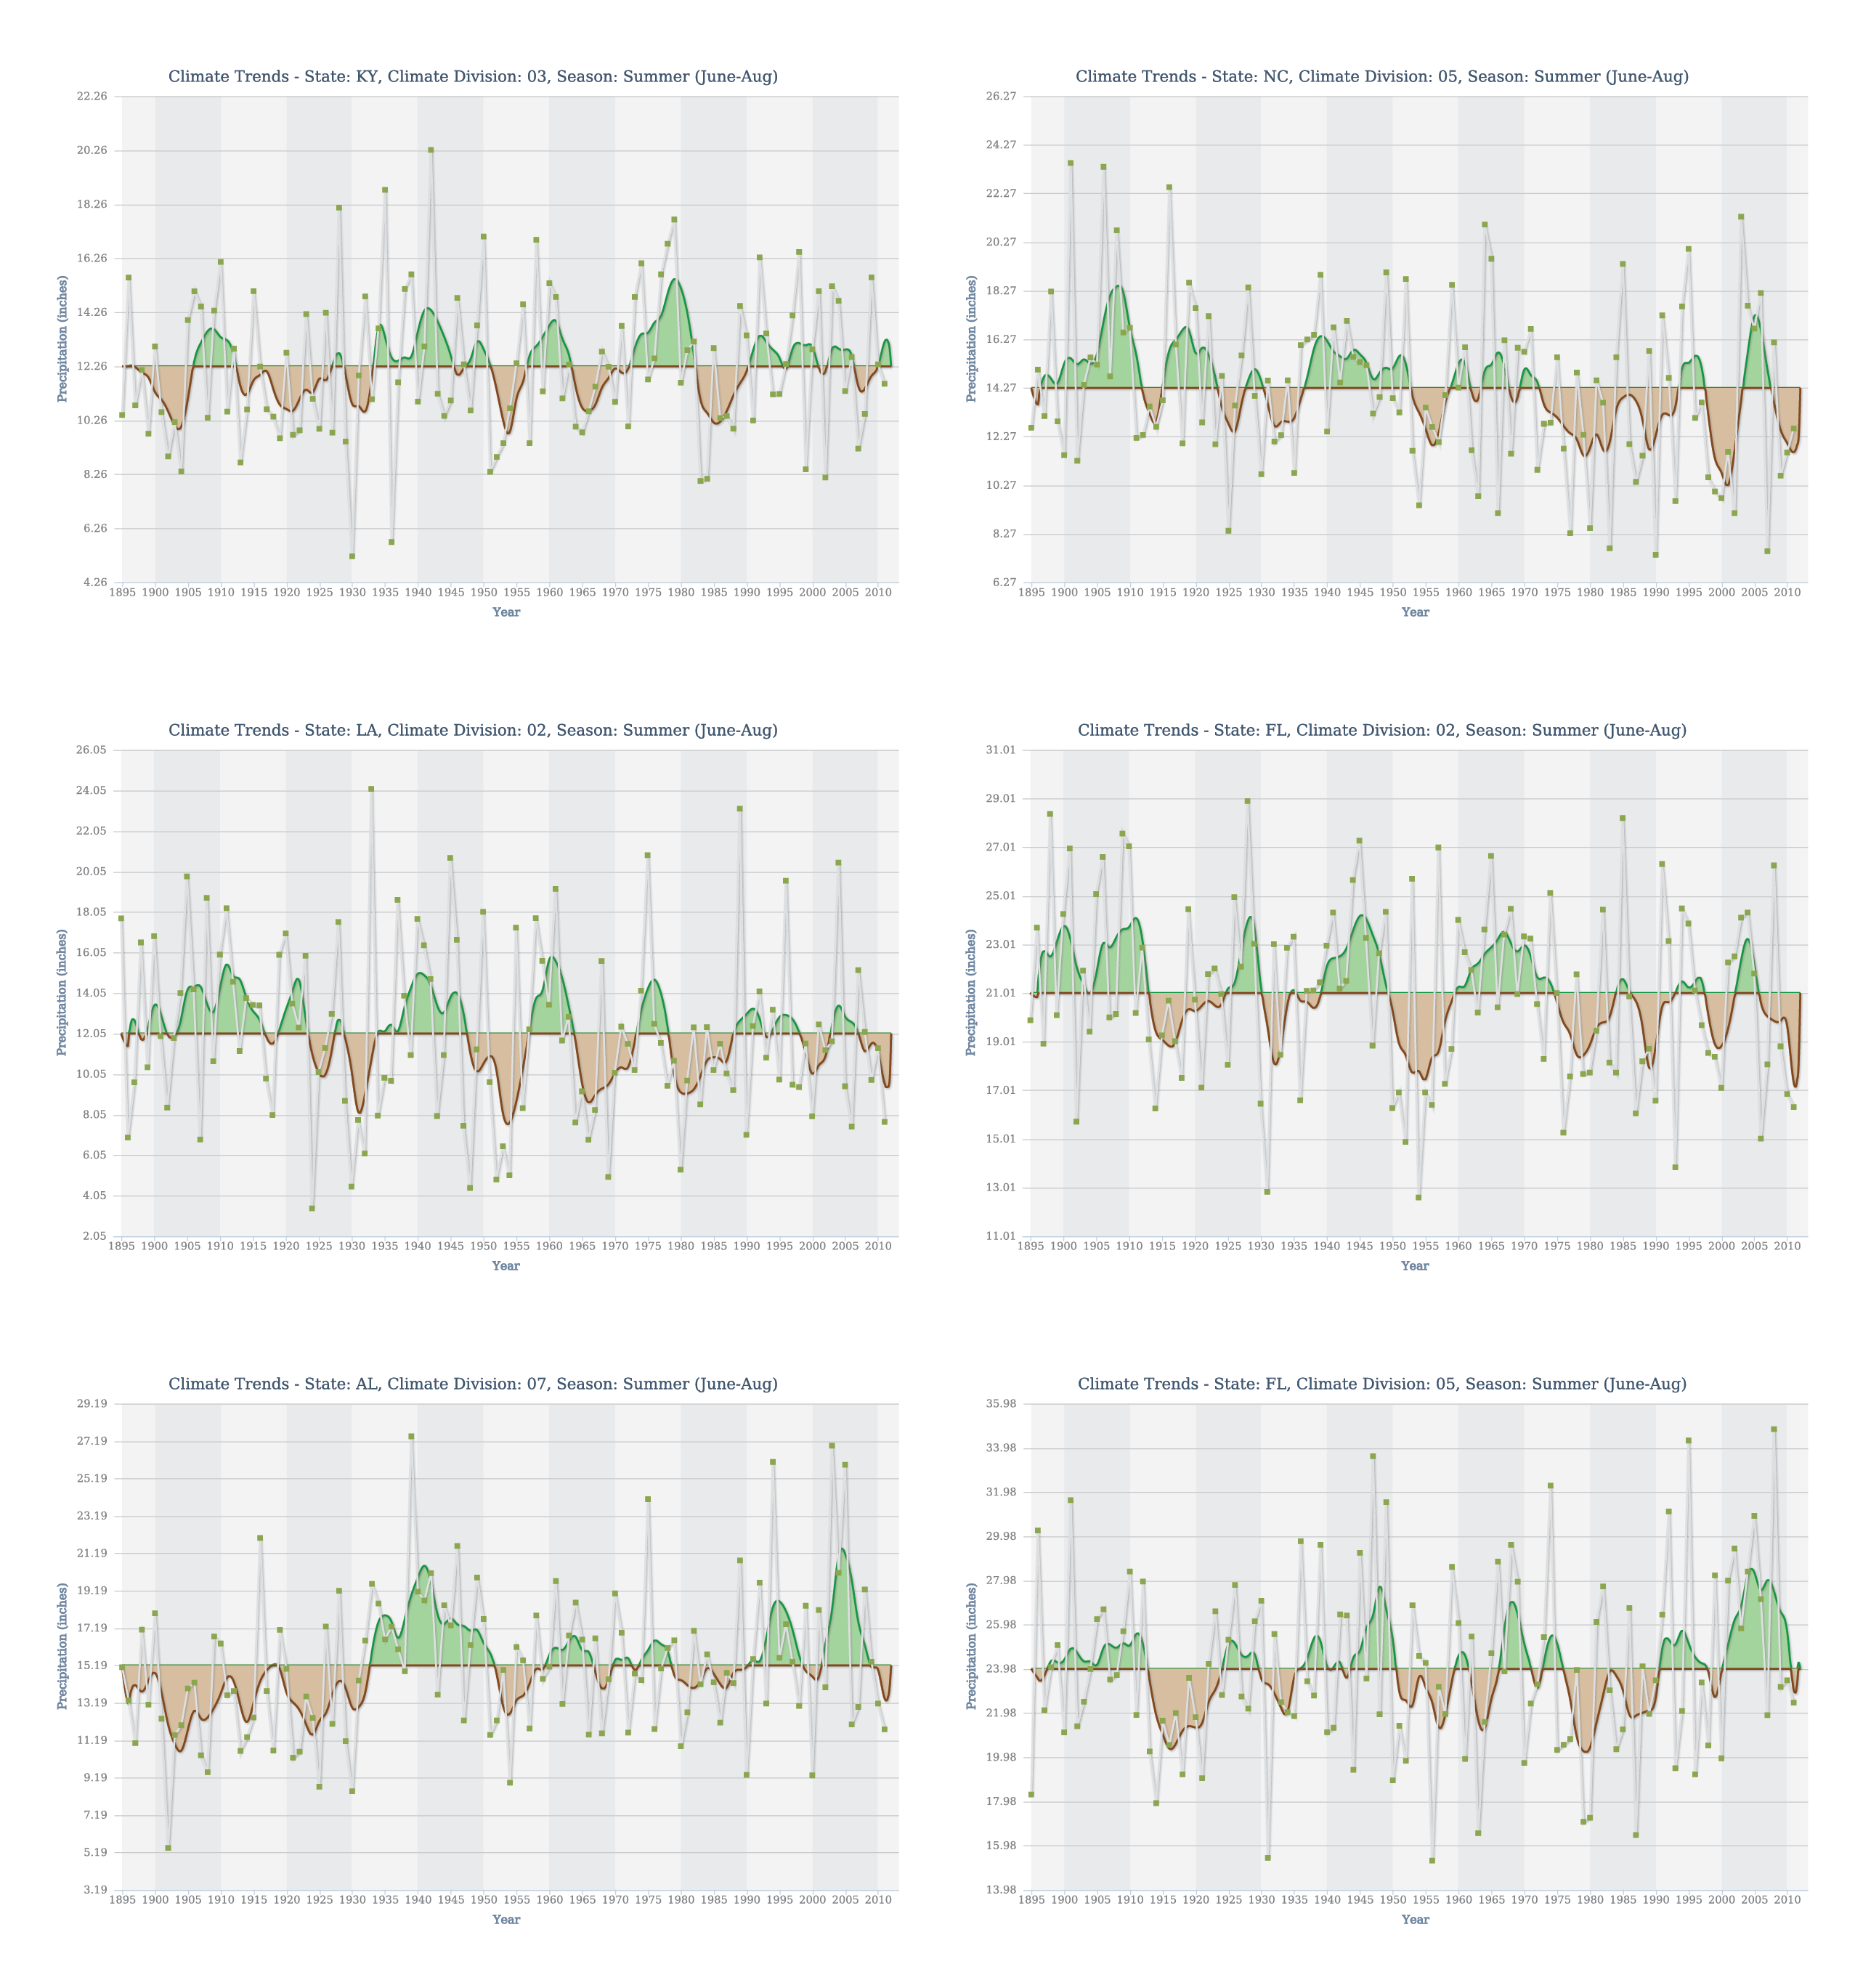
Summer precipitation trends at six climate divisions in the Southeast region. |
Observed |
Precipitation |
Southeast and Caribbean |
Regional Climate Trends and Scenarios for the U.S. National Climate Assessment. Part 2. Climate of the Southeast U.S. |
NCA 3 |
 |
|
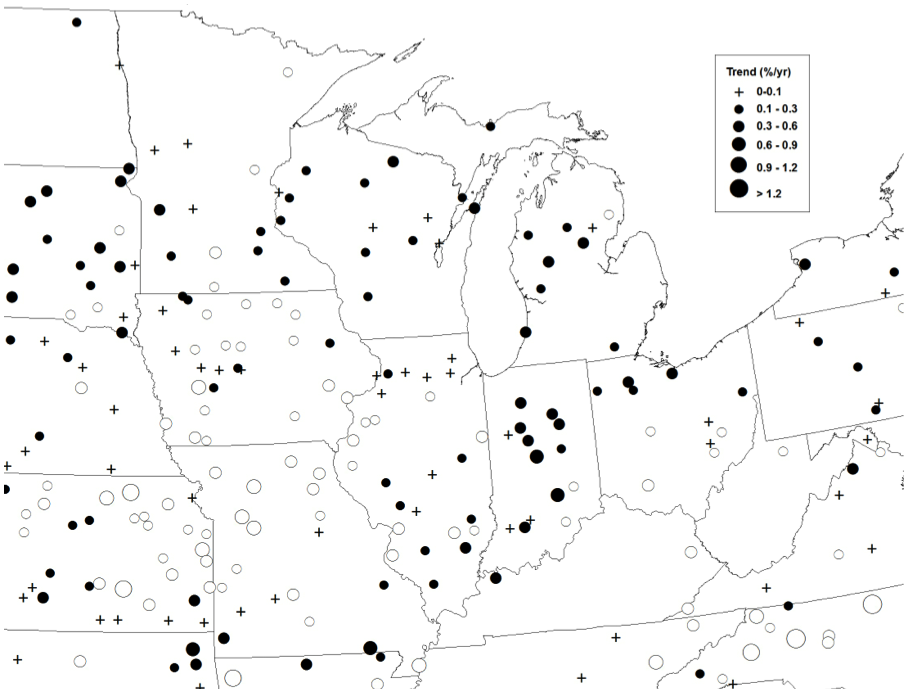
Snowfall trends for the Midwest region |
Observed |
Snow |
Midwest |
Regional Climate Trends and Scenarios for the U.S. National Climate Assessment. Part 3. Climate of the Midwest U.S. |
NCA 3 |
 |
|
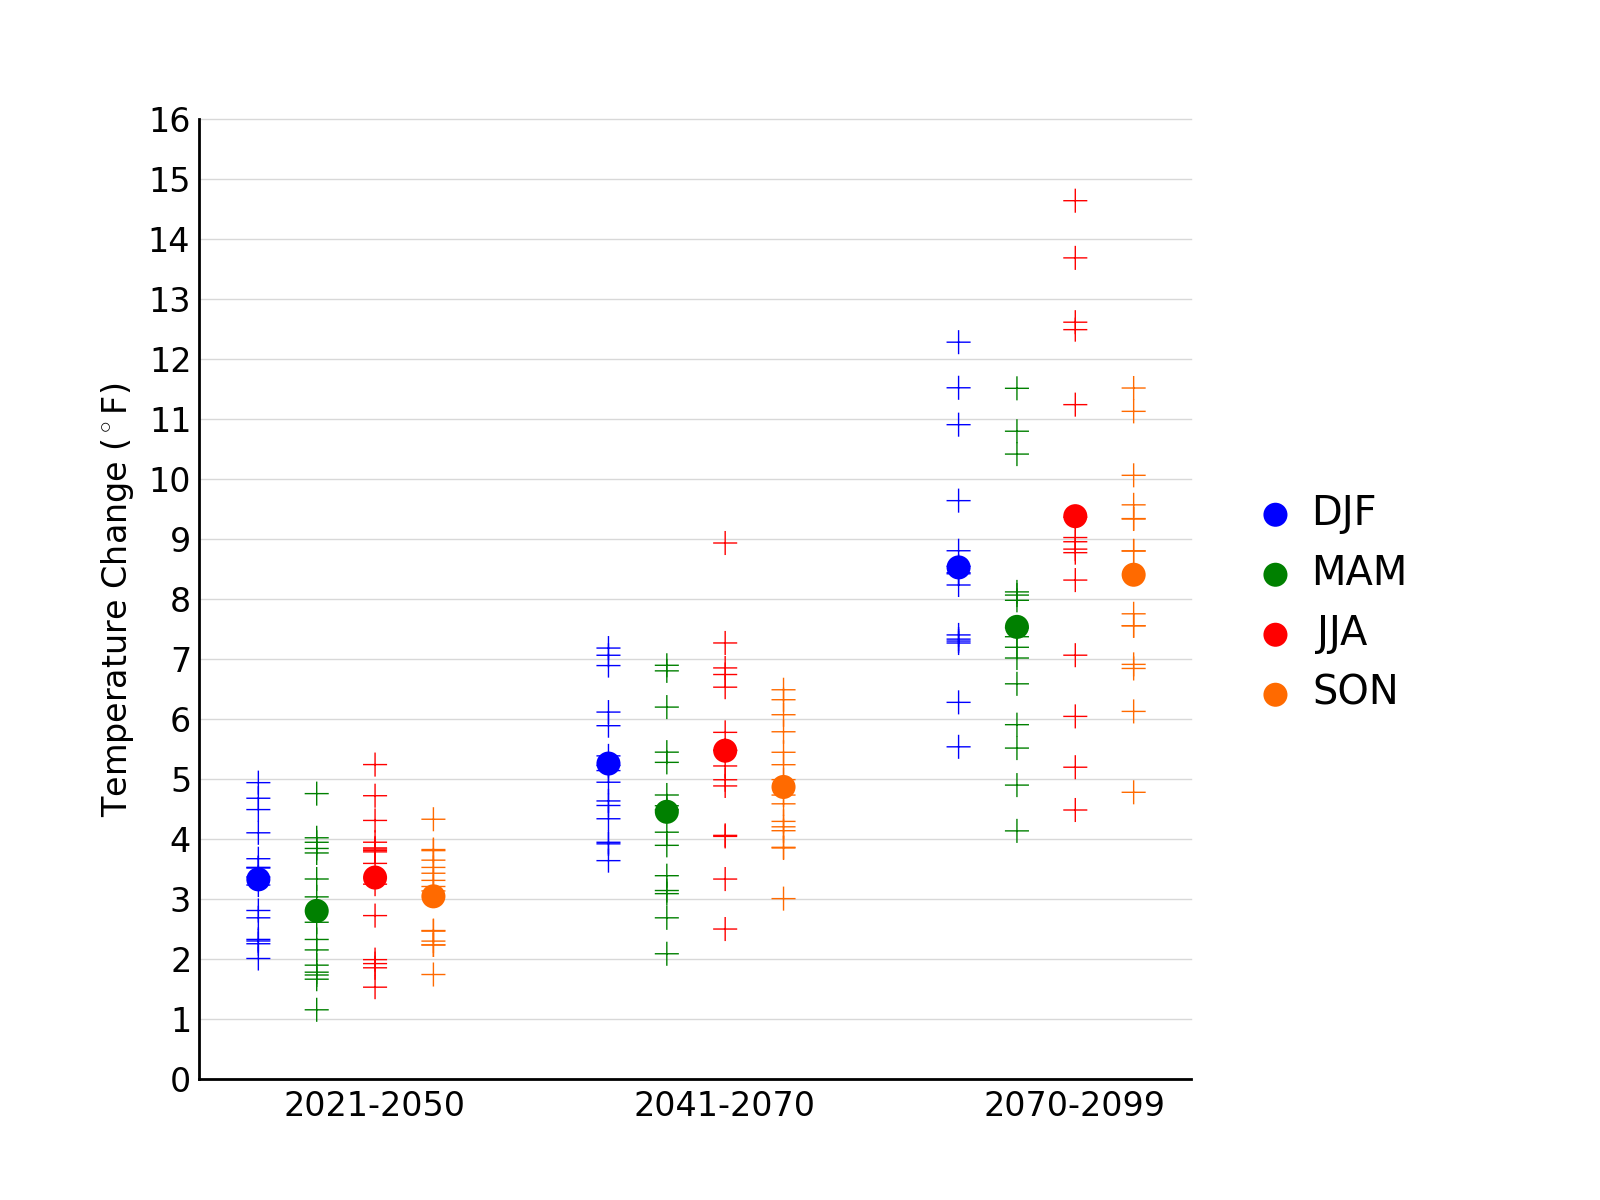
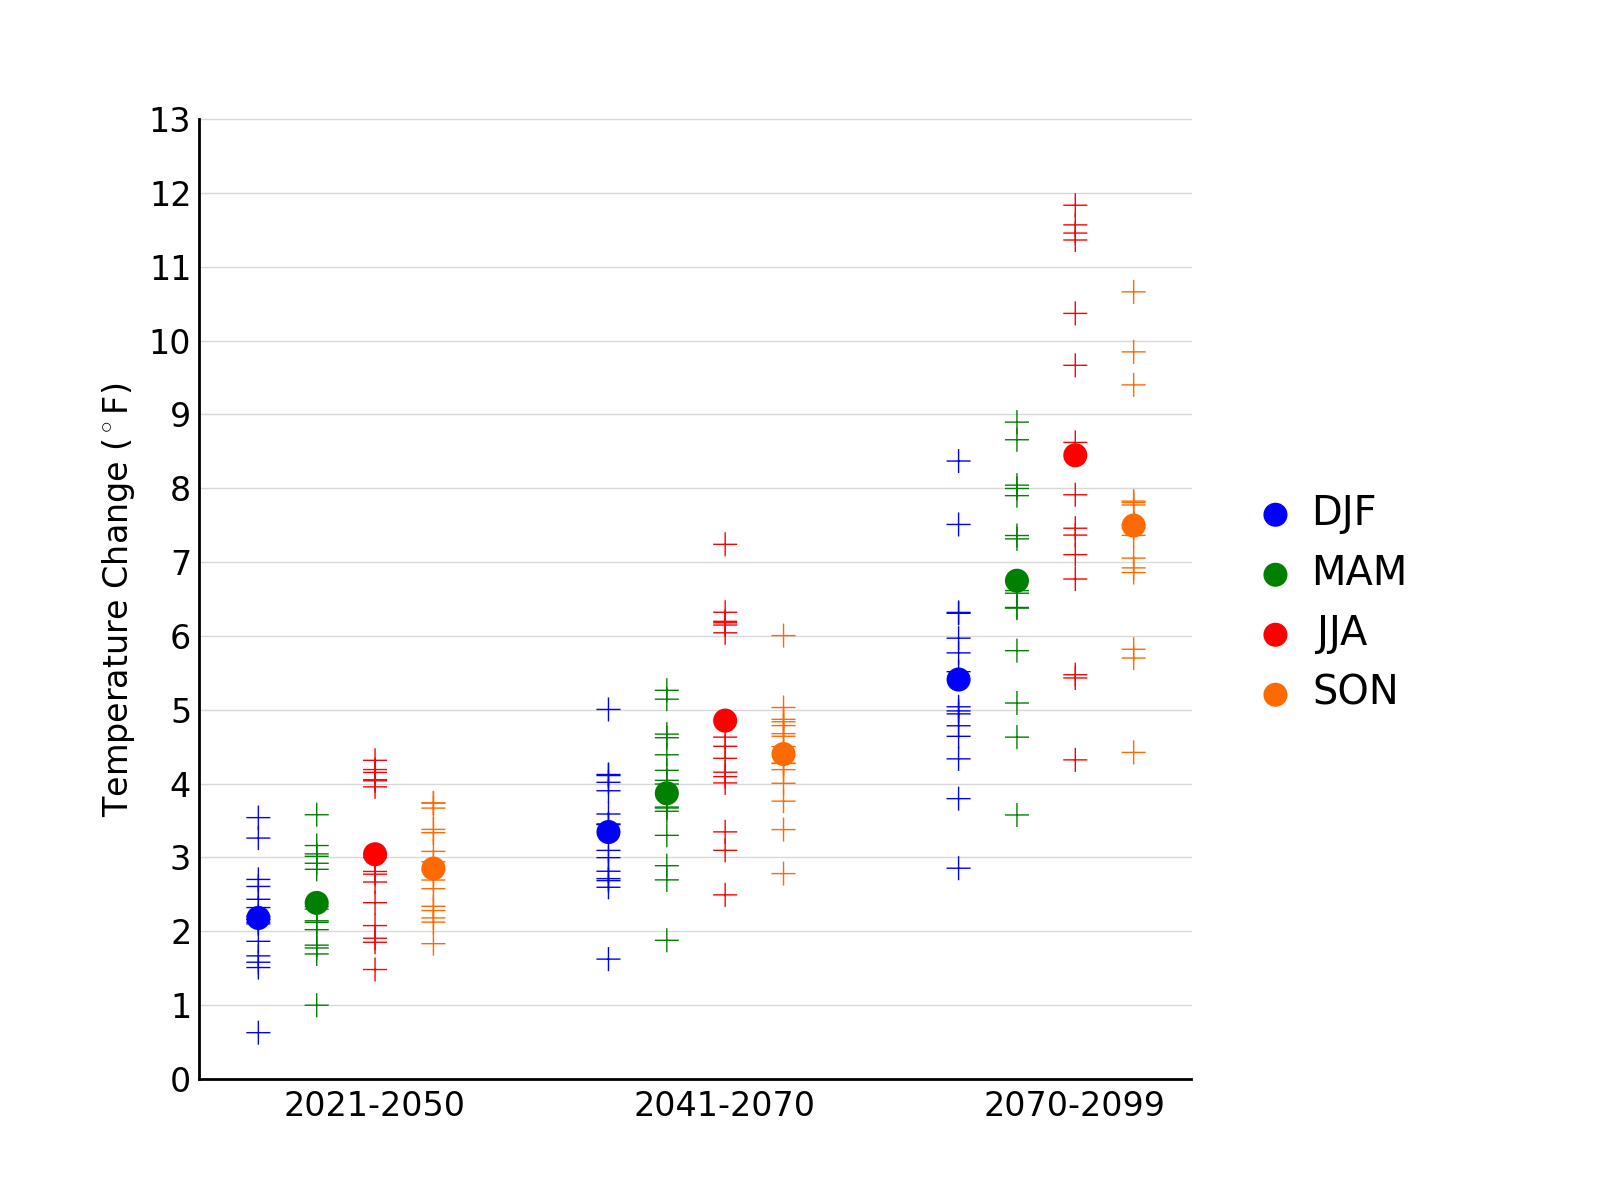
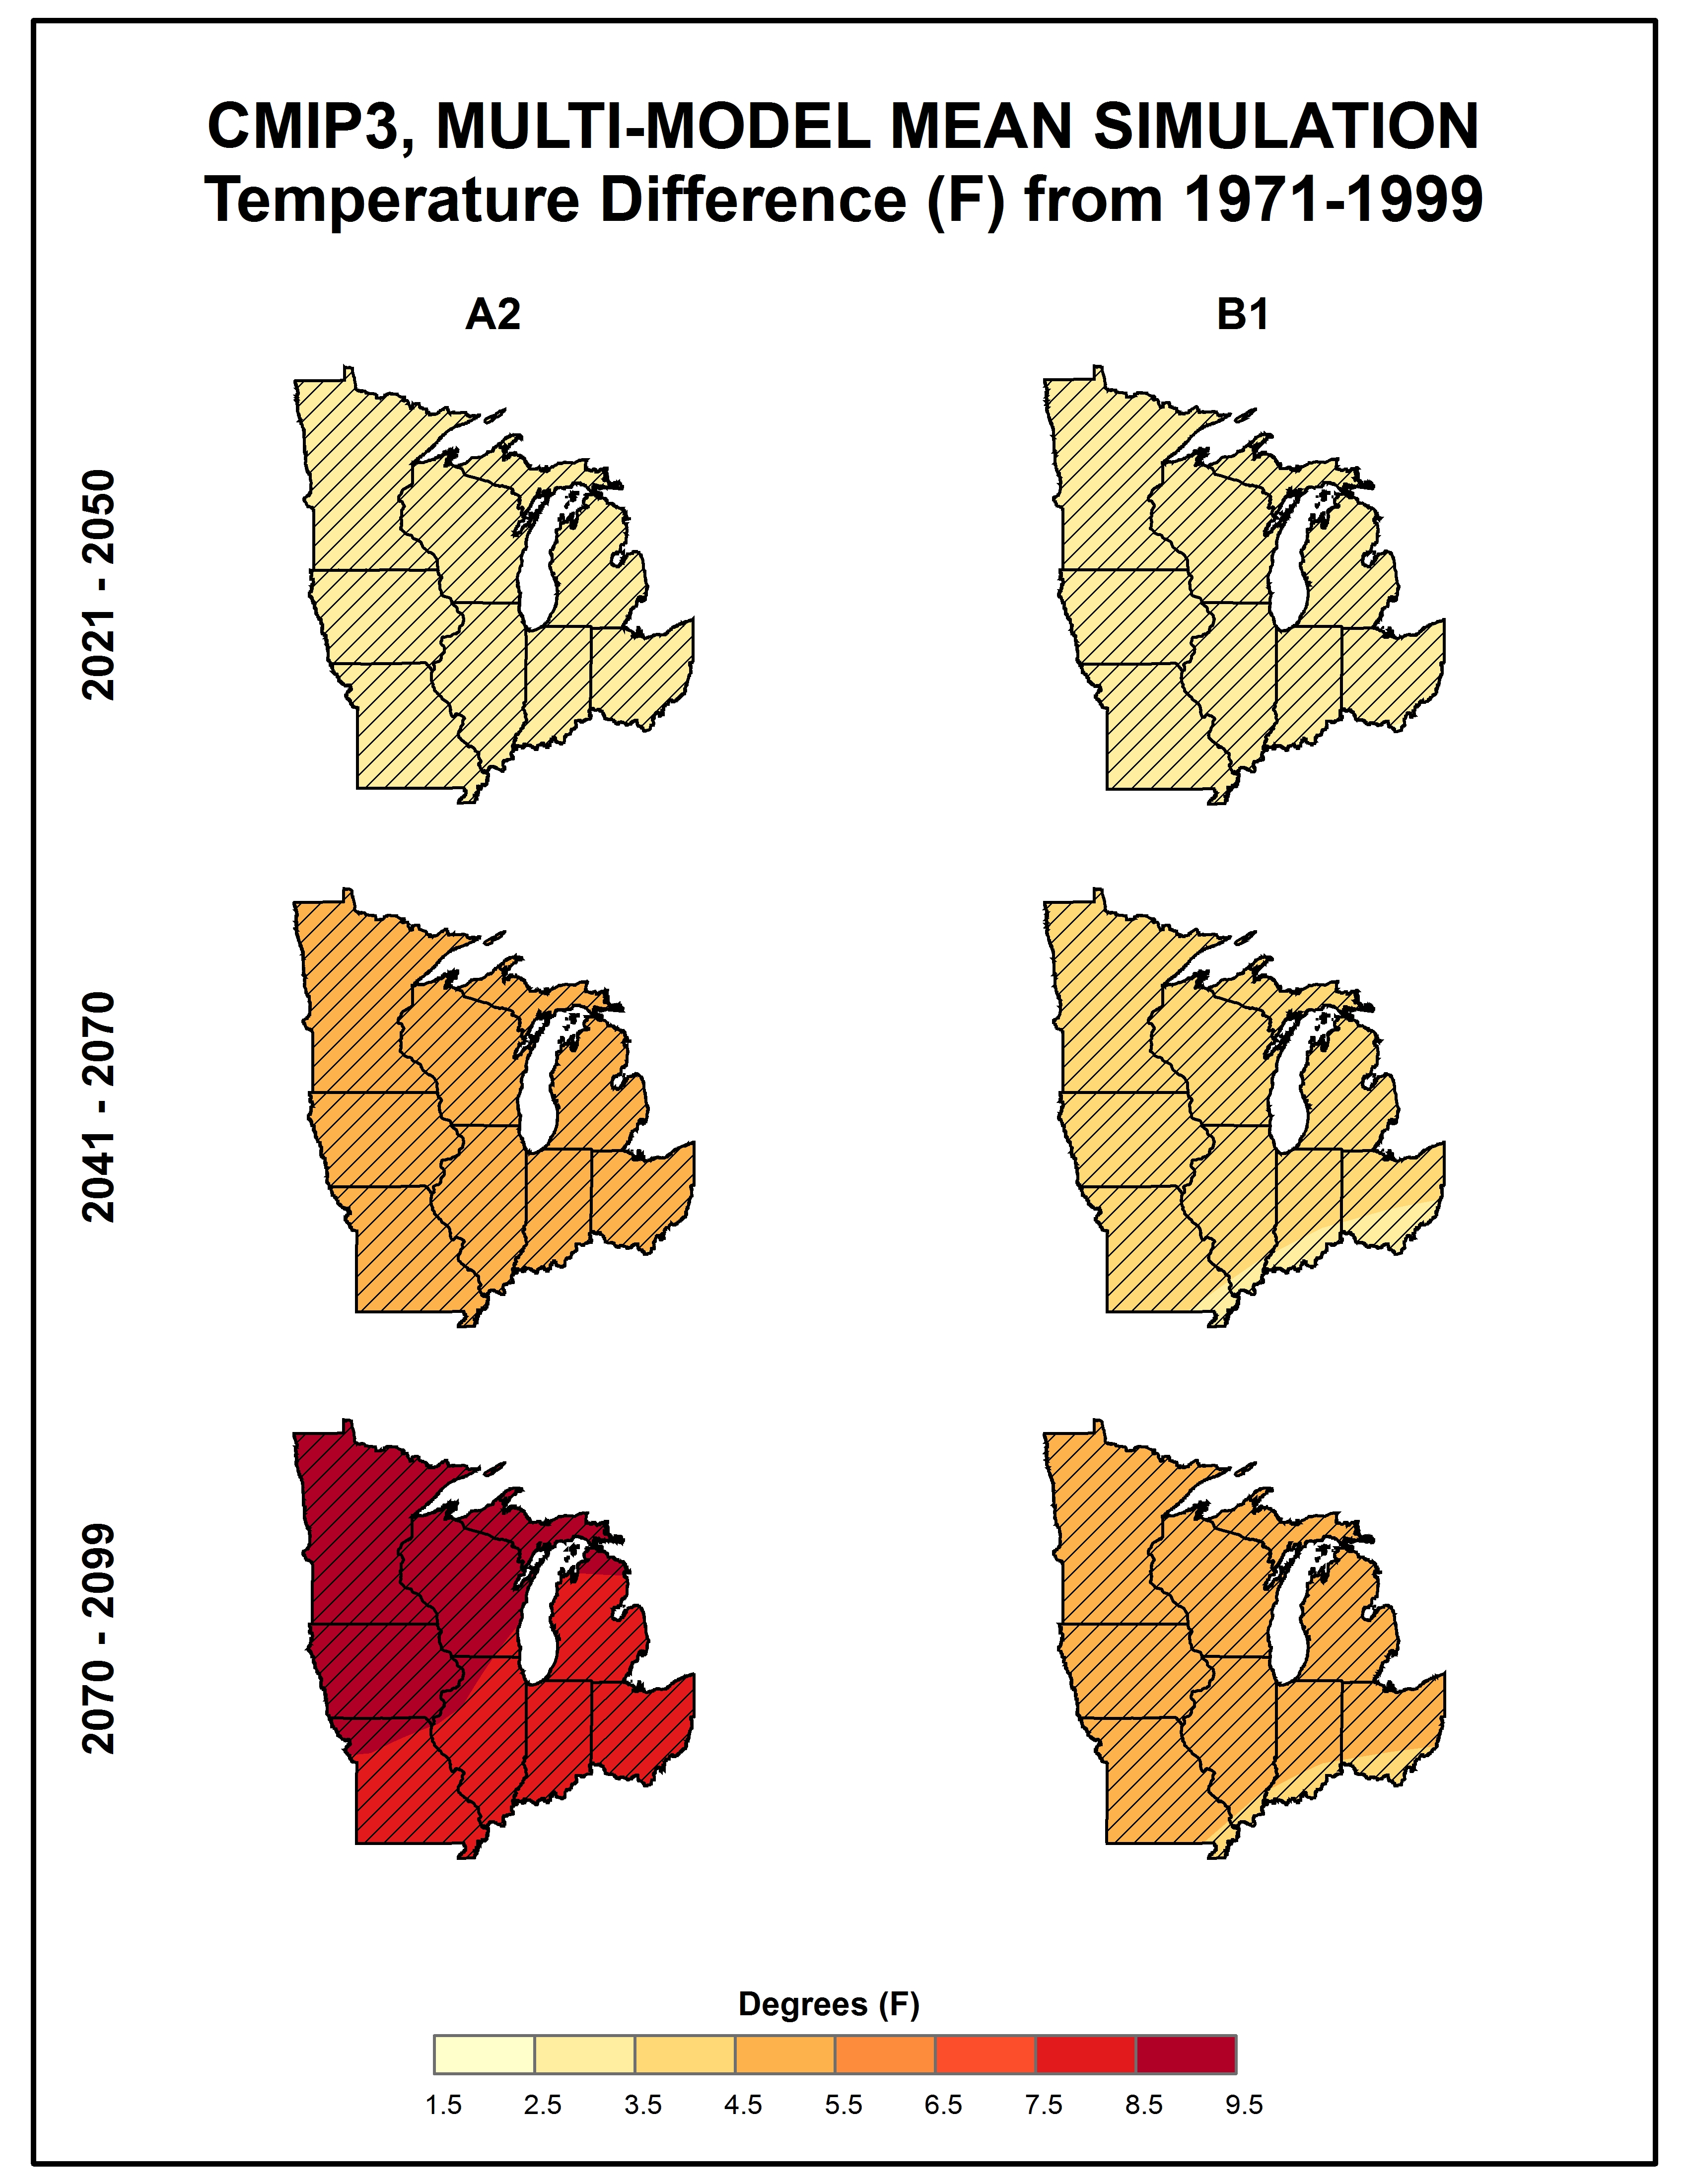
Simulated seasonal mean temperature change |
Simulated |
Temperature |
Midwest |
Regional Climate Trends and Scenarios for the U.S. National Climate Assessment. Part 3. Climate of the Midwest U.S. |
NCA 3 |
 |
|
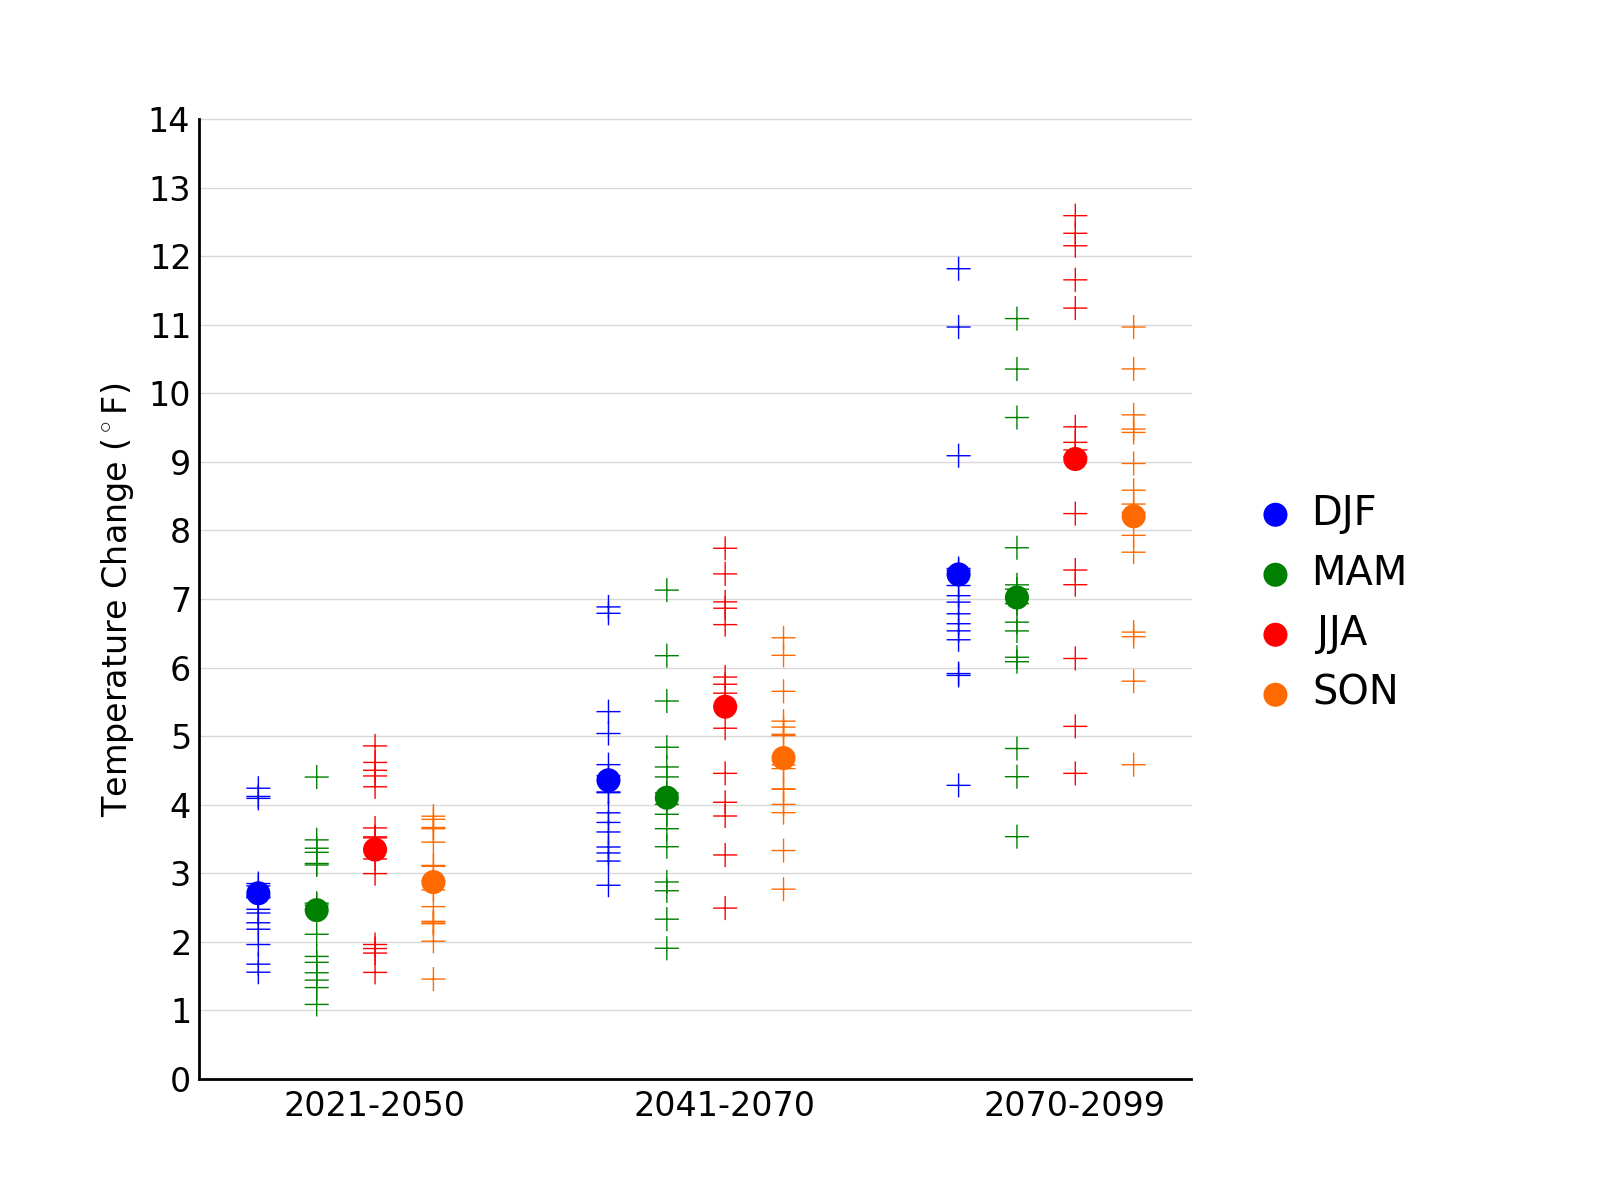
Simulated seasonal mean temperature change |
Simulated |
Temperature |
Southeast and Caribbean |
Regional Climate Trends and Scenarios for the U.S. National Climate Assessment. Part 2. Climate of the Southeast U.S. |
NCA 3 |
 |
|
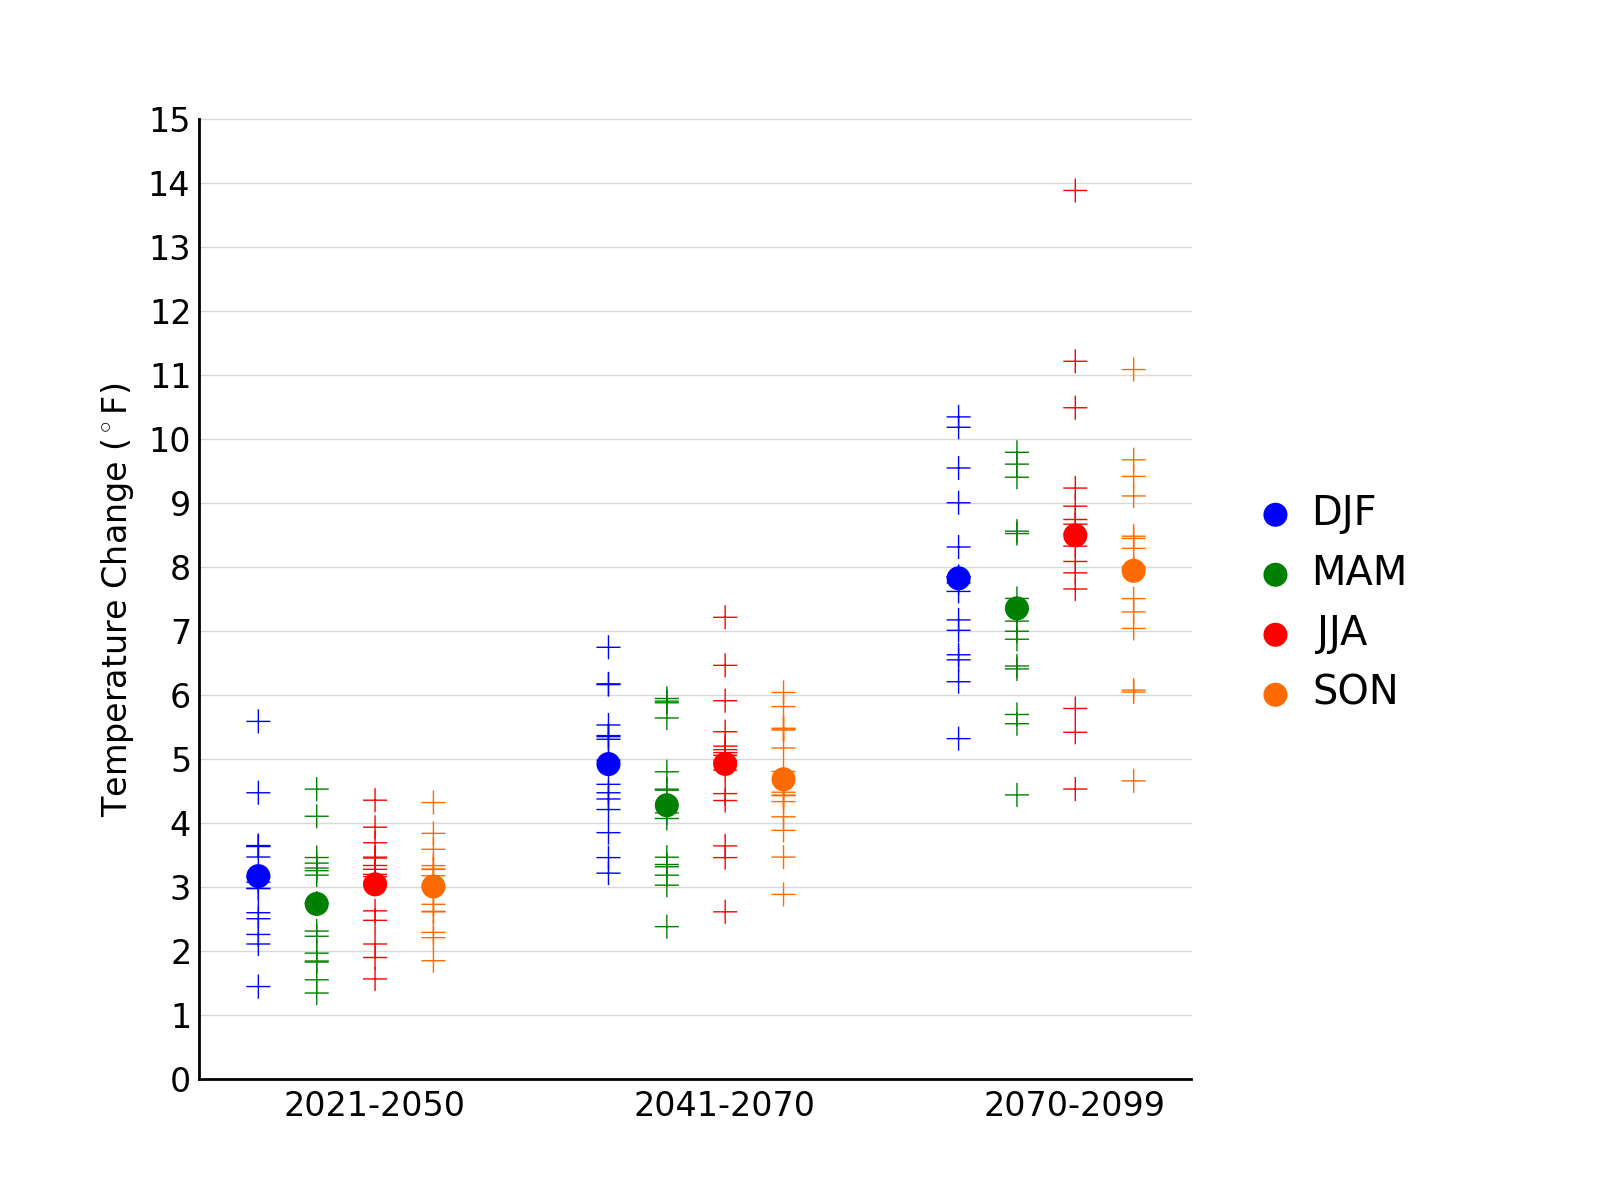
Simulated seasonal mean temperature change |
Simulated |
Temperature |
National |
Regional Climate Trends and Scenarios for the U.S. National Climate Assessment. Part 9. Climate of the Contiguous United States |
NCA 3 |
 |
|
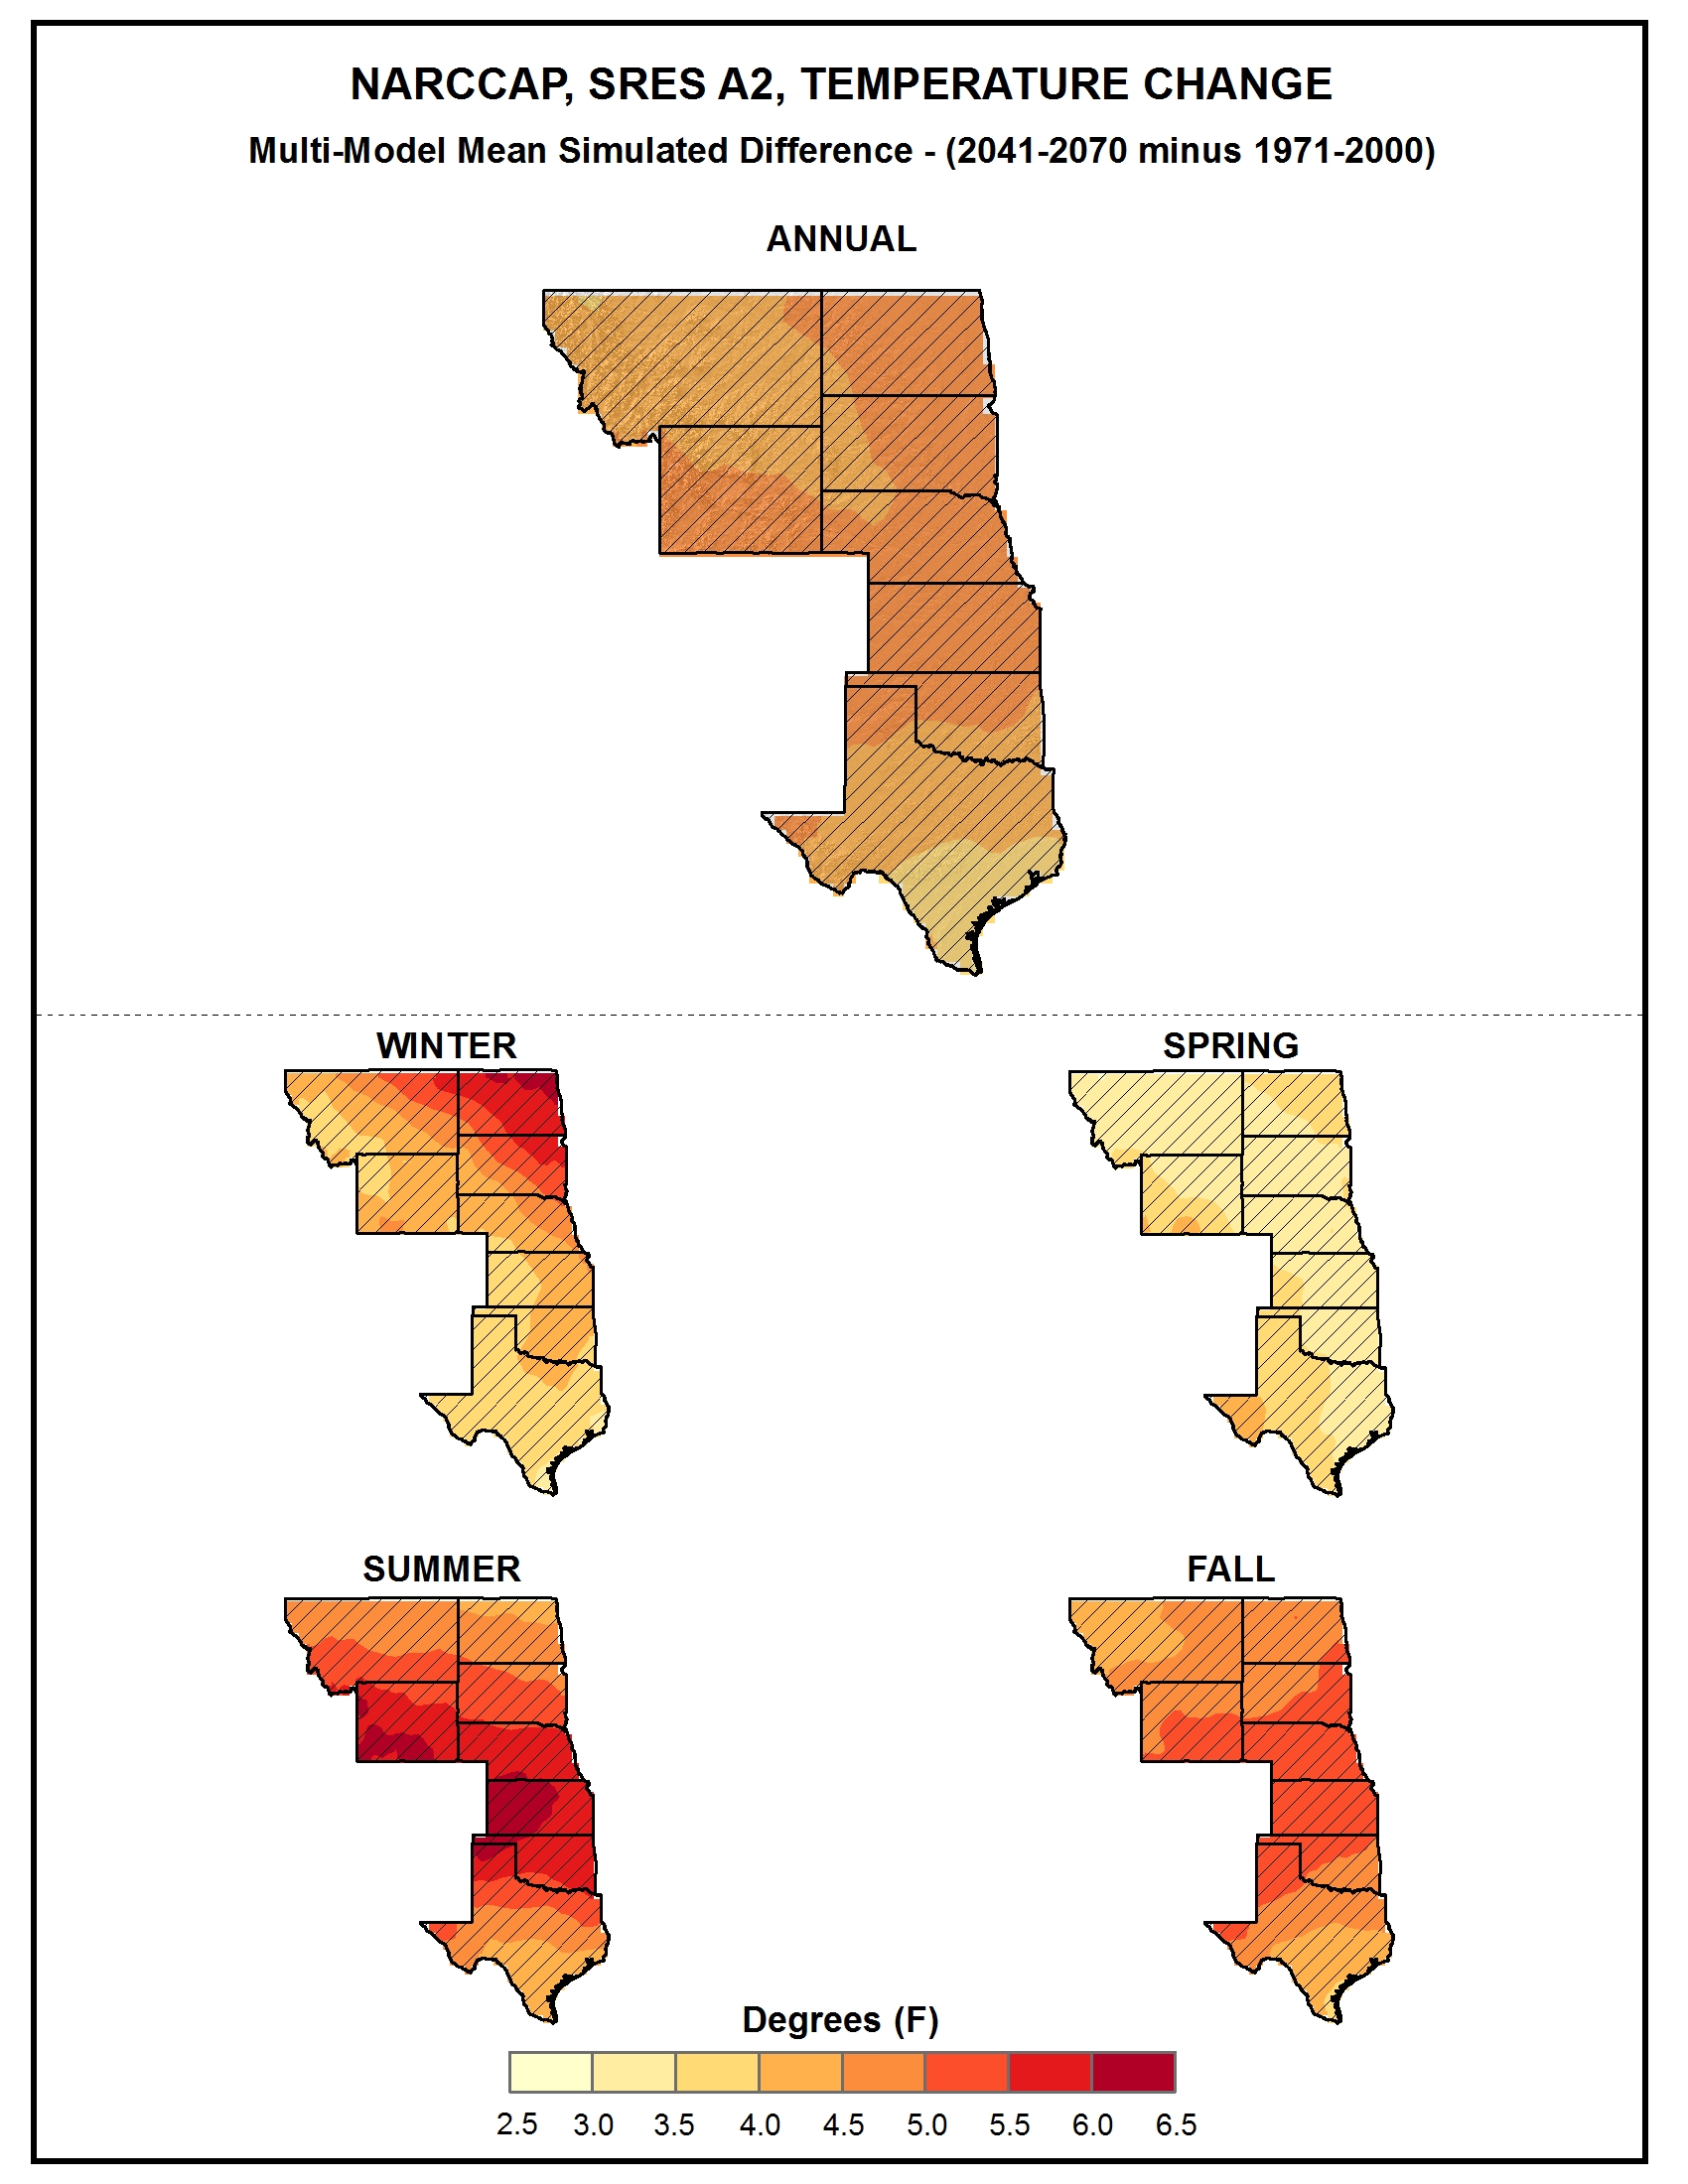
Simulated seasonal mean temperature change |
Simulated |
Temperature |
Great Plains |
Regional Climate Trends and Scenarios for the U.S. National Climate Assessment. Part 4. Climate of the U.S. Great Plains |
NCA 3 |
 |
|
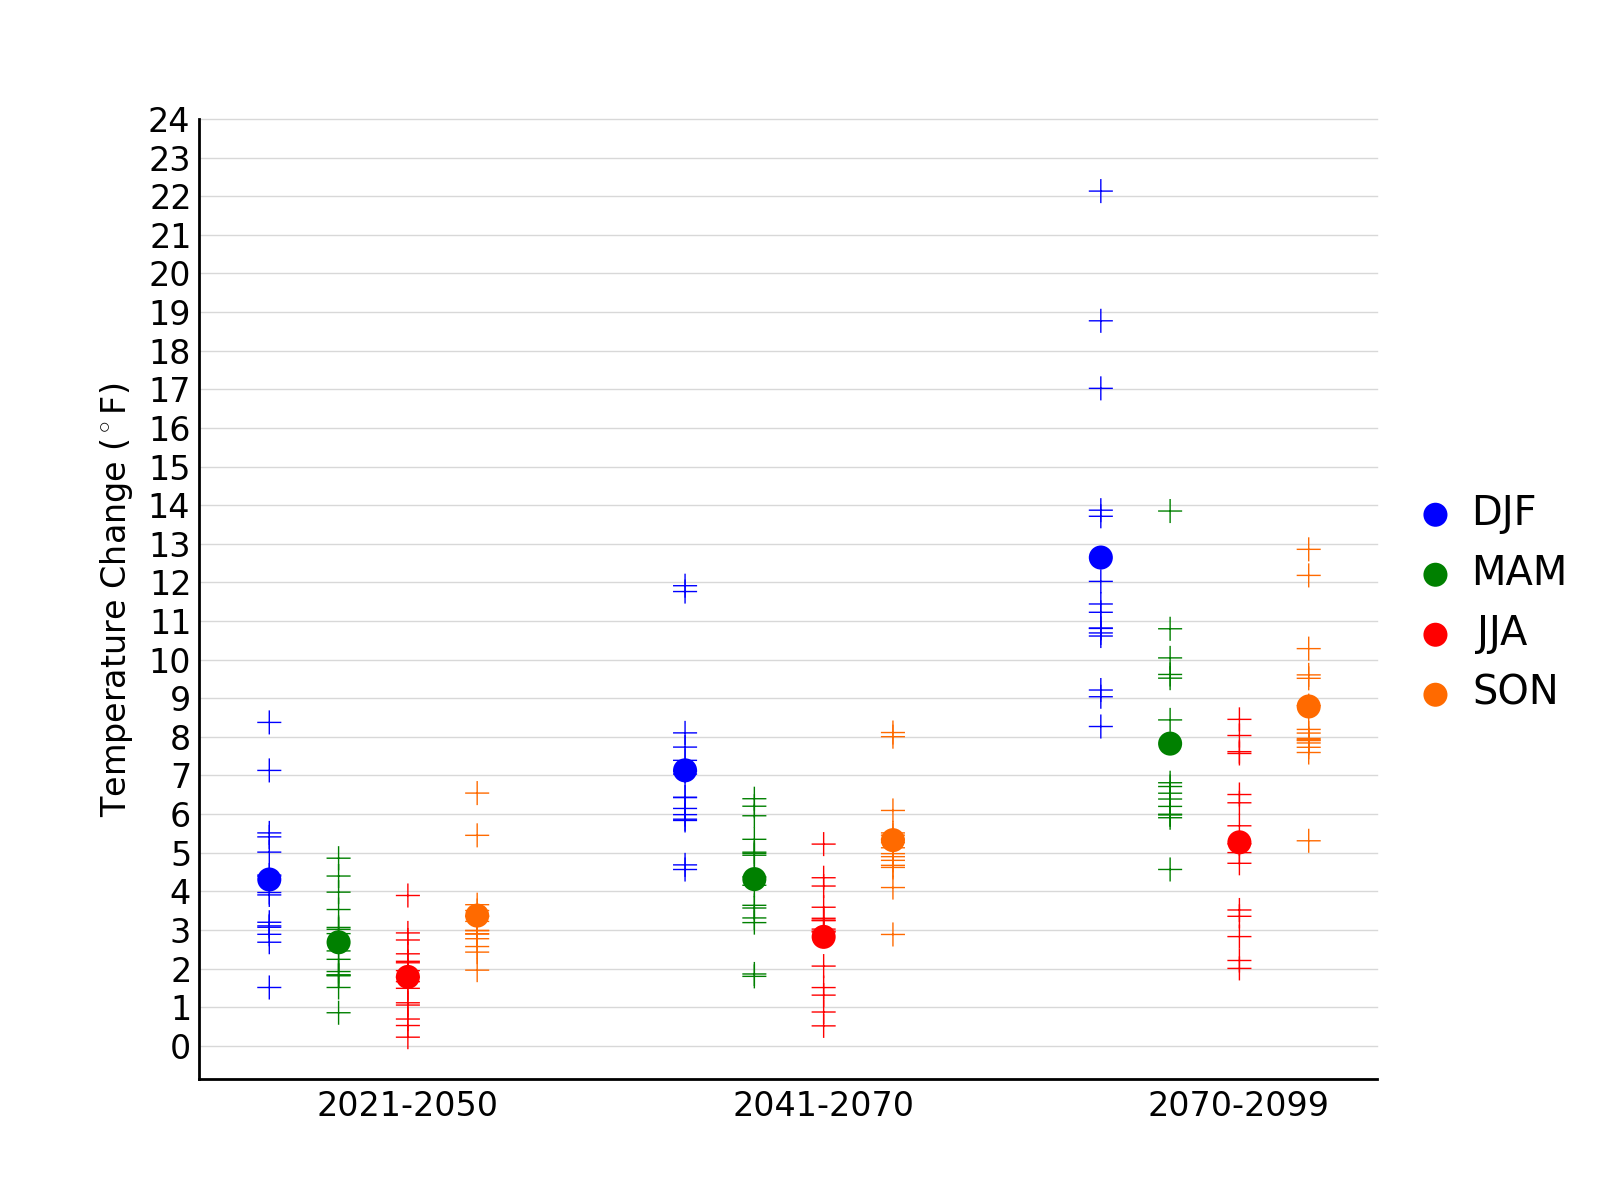
Simulated seasonal mean temperature change |
Simulated |
Temperature |
Alaska and Arctic |
Regional Climate Trends and Scenarios for the U.S. National Climate Assessment. Part 7. Climate of Alaska |
NCA 3 |
 |
|
Simulated seasonal mean temperature change |
Simulated |
Temperature |
Northeast |
Regional Climate Trends and Scenarios for the U.S. National Climate Assessment. Part 1. Climate of the Northeast U.S. |
NCA 3 |
 |
|
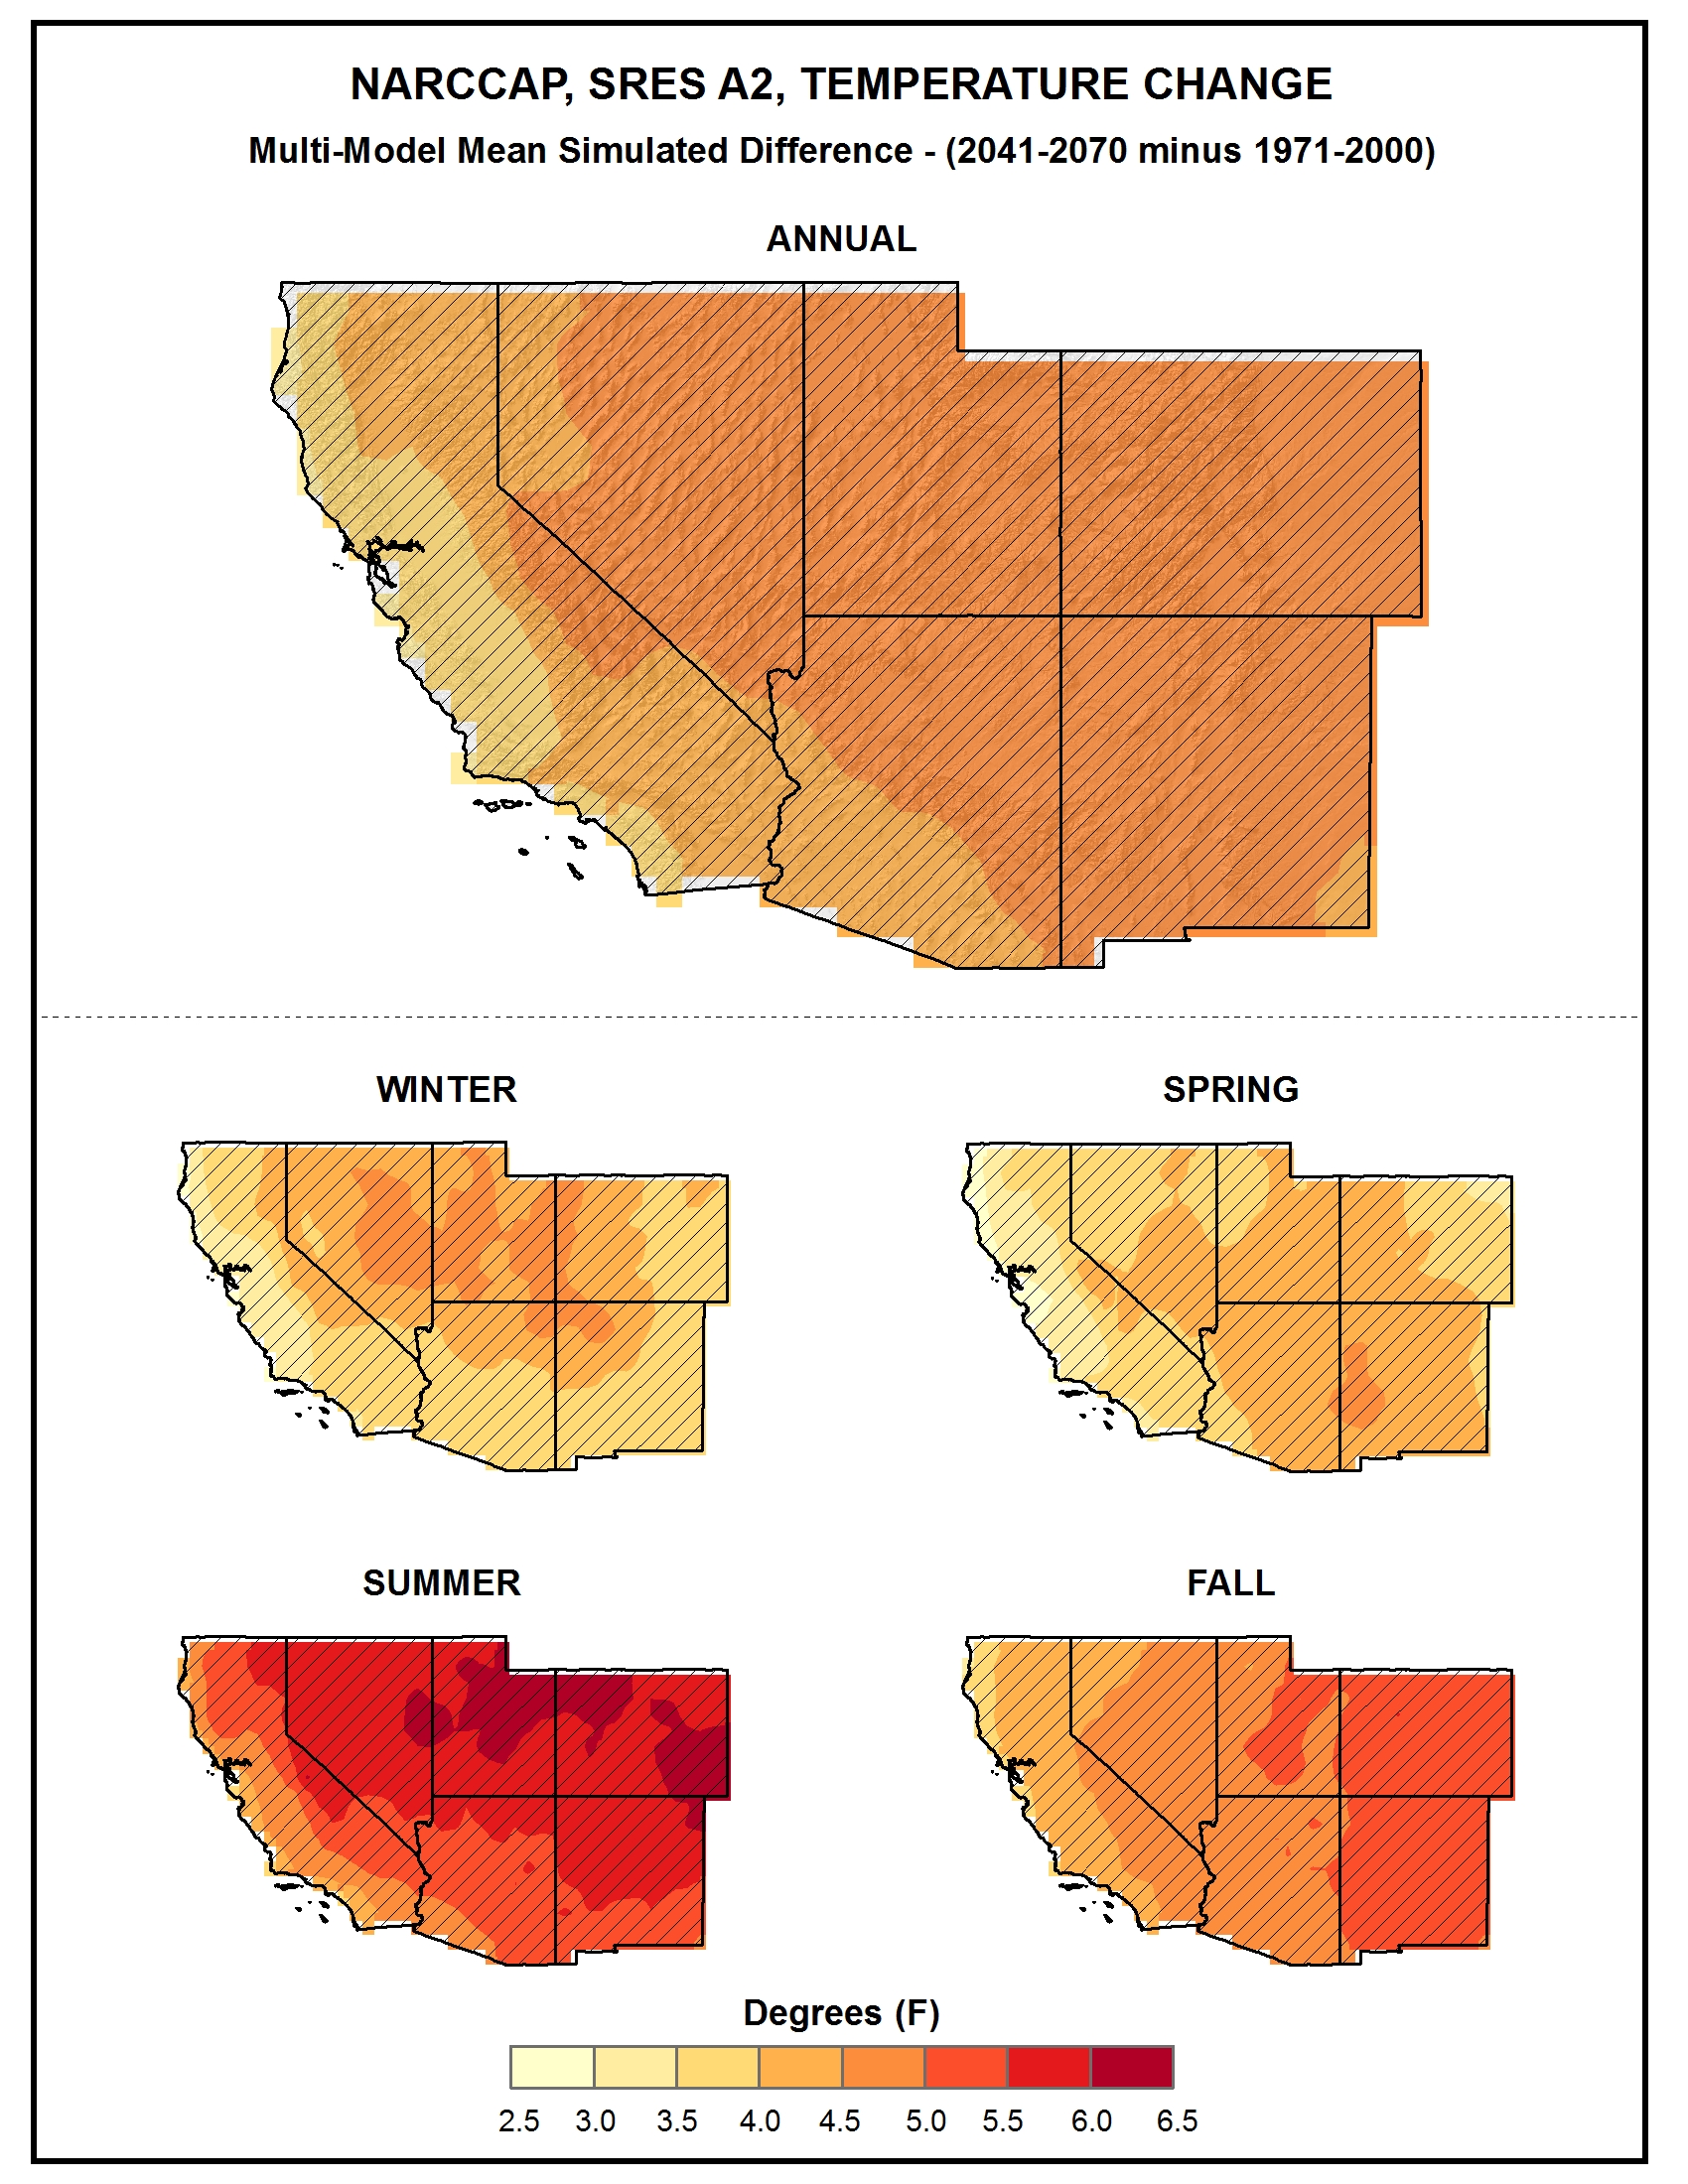
Simulated seasonal mean temperature change |
Simulated |
Temperature |
Southwest |
Regional Climate Trends and Scenarios for the U.S. National Climate Assessment. Part 5. Climate of the Southwest U.S. |
NCA 3 |
 |
|
Simulated seasonal mean temperature change |
Simulated |
Temperature |
Northwest |
Regional Climate Trends and Scenarios for the U.S. National Climate Assessment. Part 6. Climate of the Northwest U.S. |
NCA 3 |
 |
|
Simulated seasonal mean precipitation change |
Simulated |
Precipitation |
Midwest |
Regional Climate Trends and Scenarios for the U.S. National Climate Assessment. Part 3. Climate of the Midwest U.S. |
NCA 3 |
 |
|
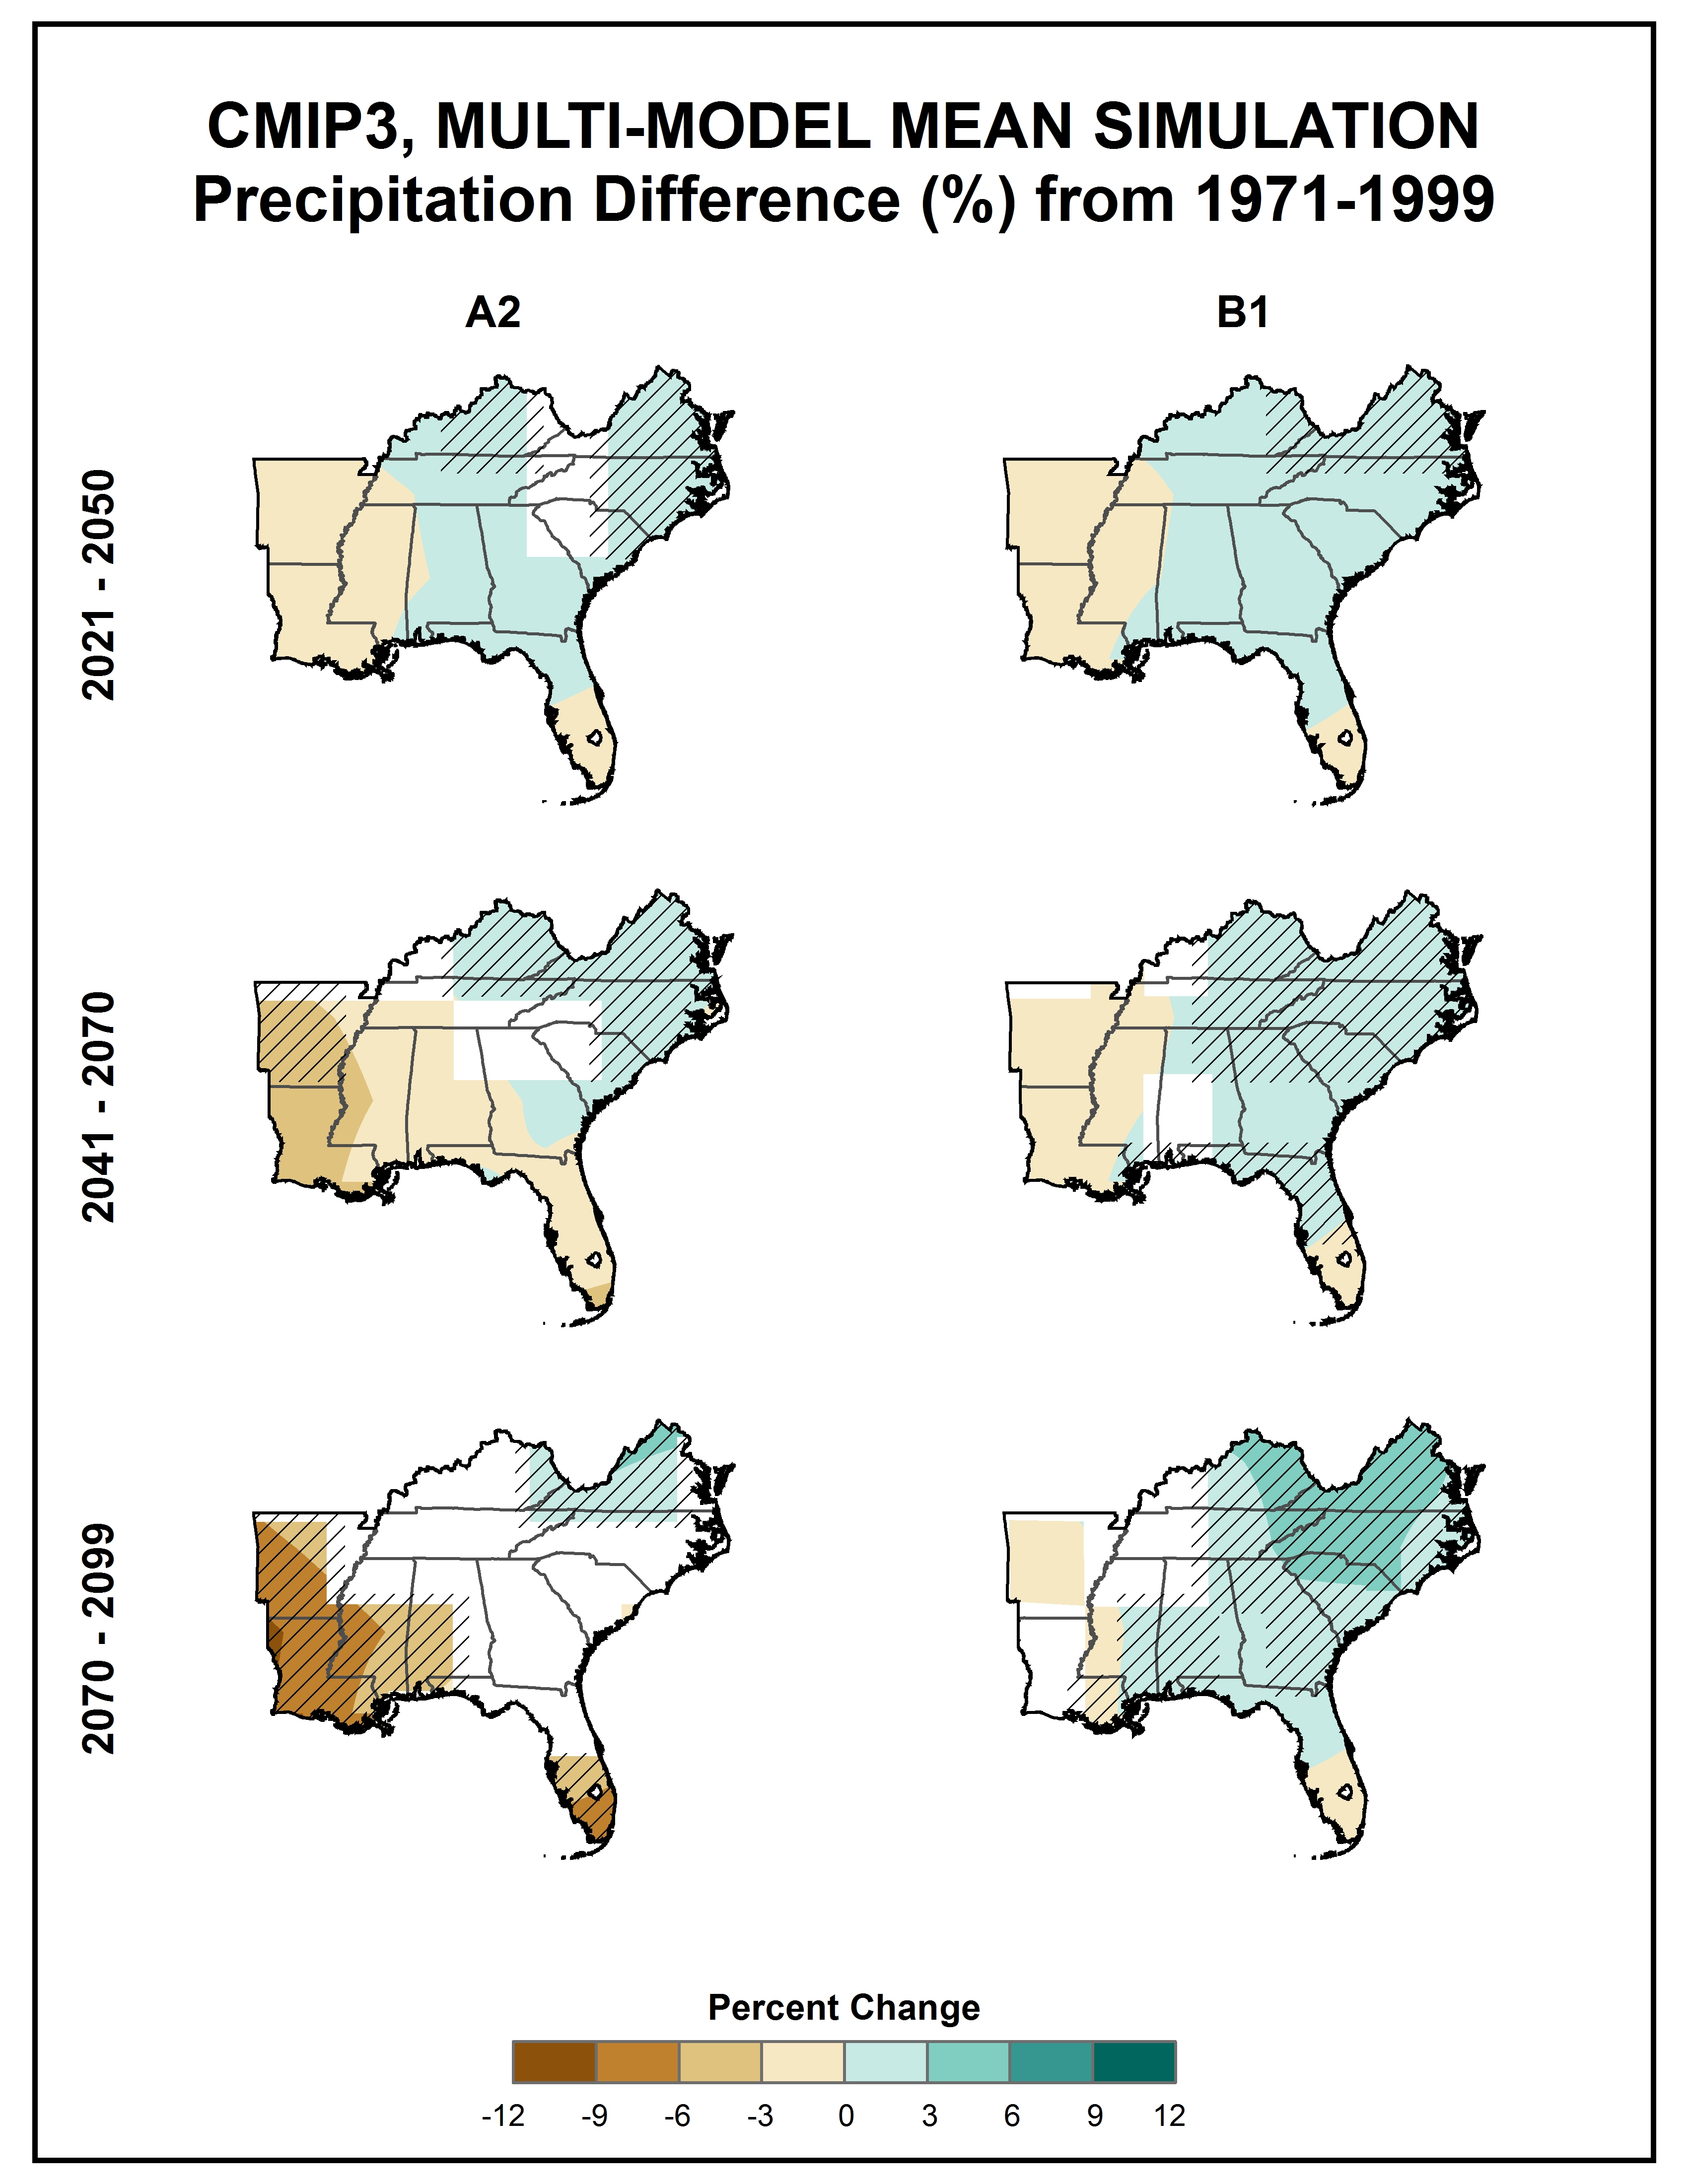
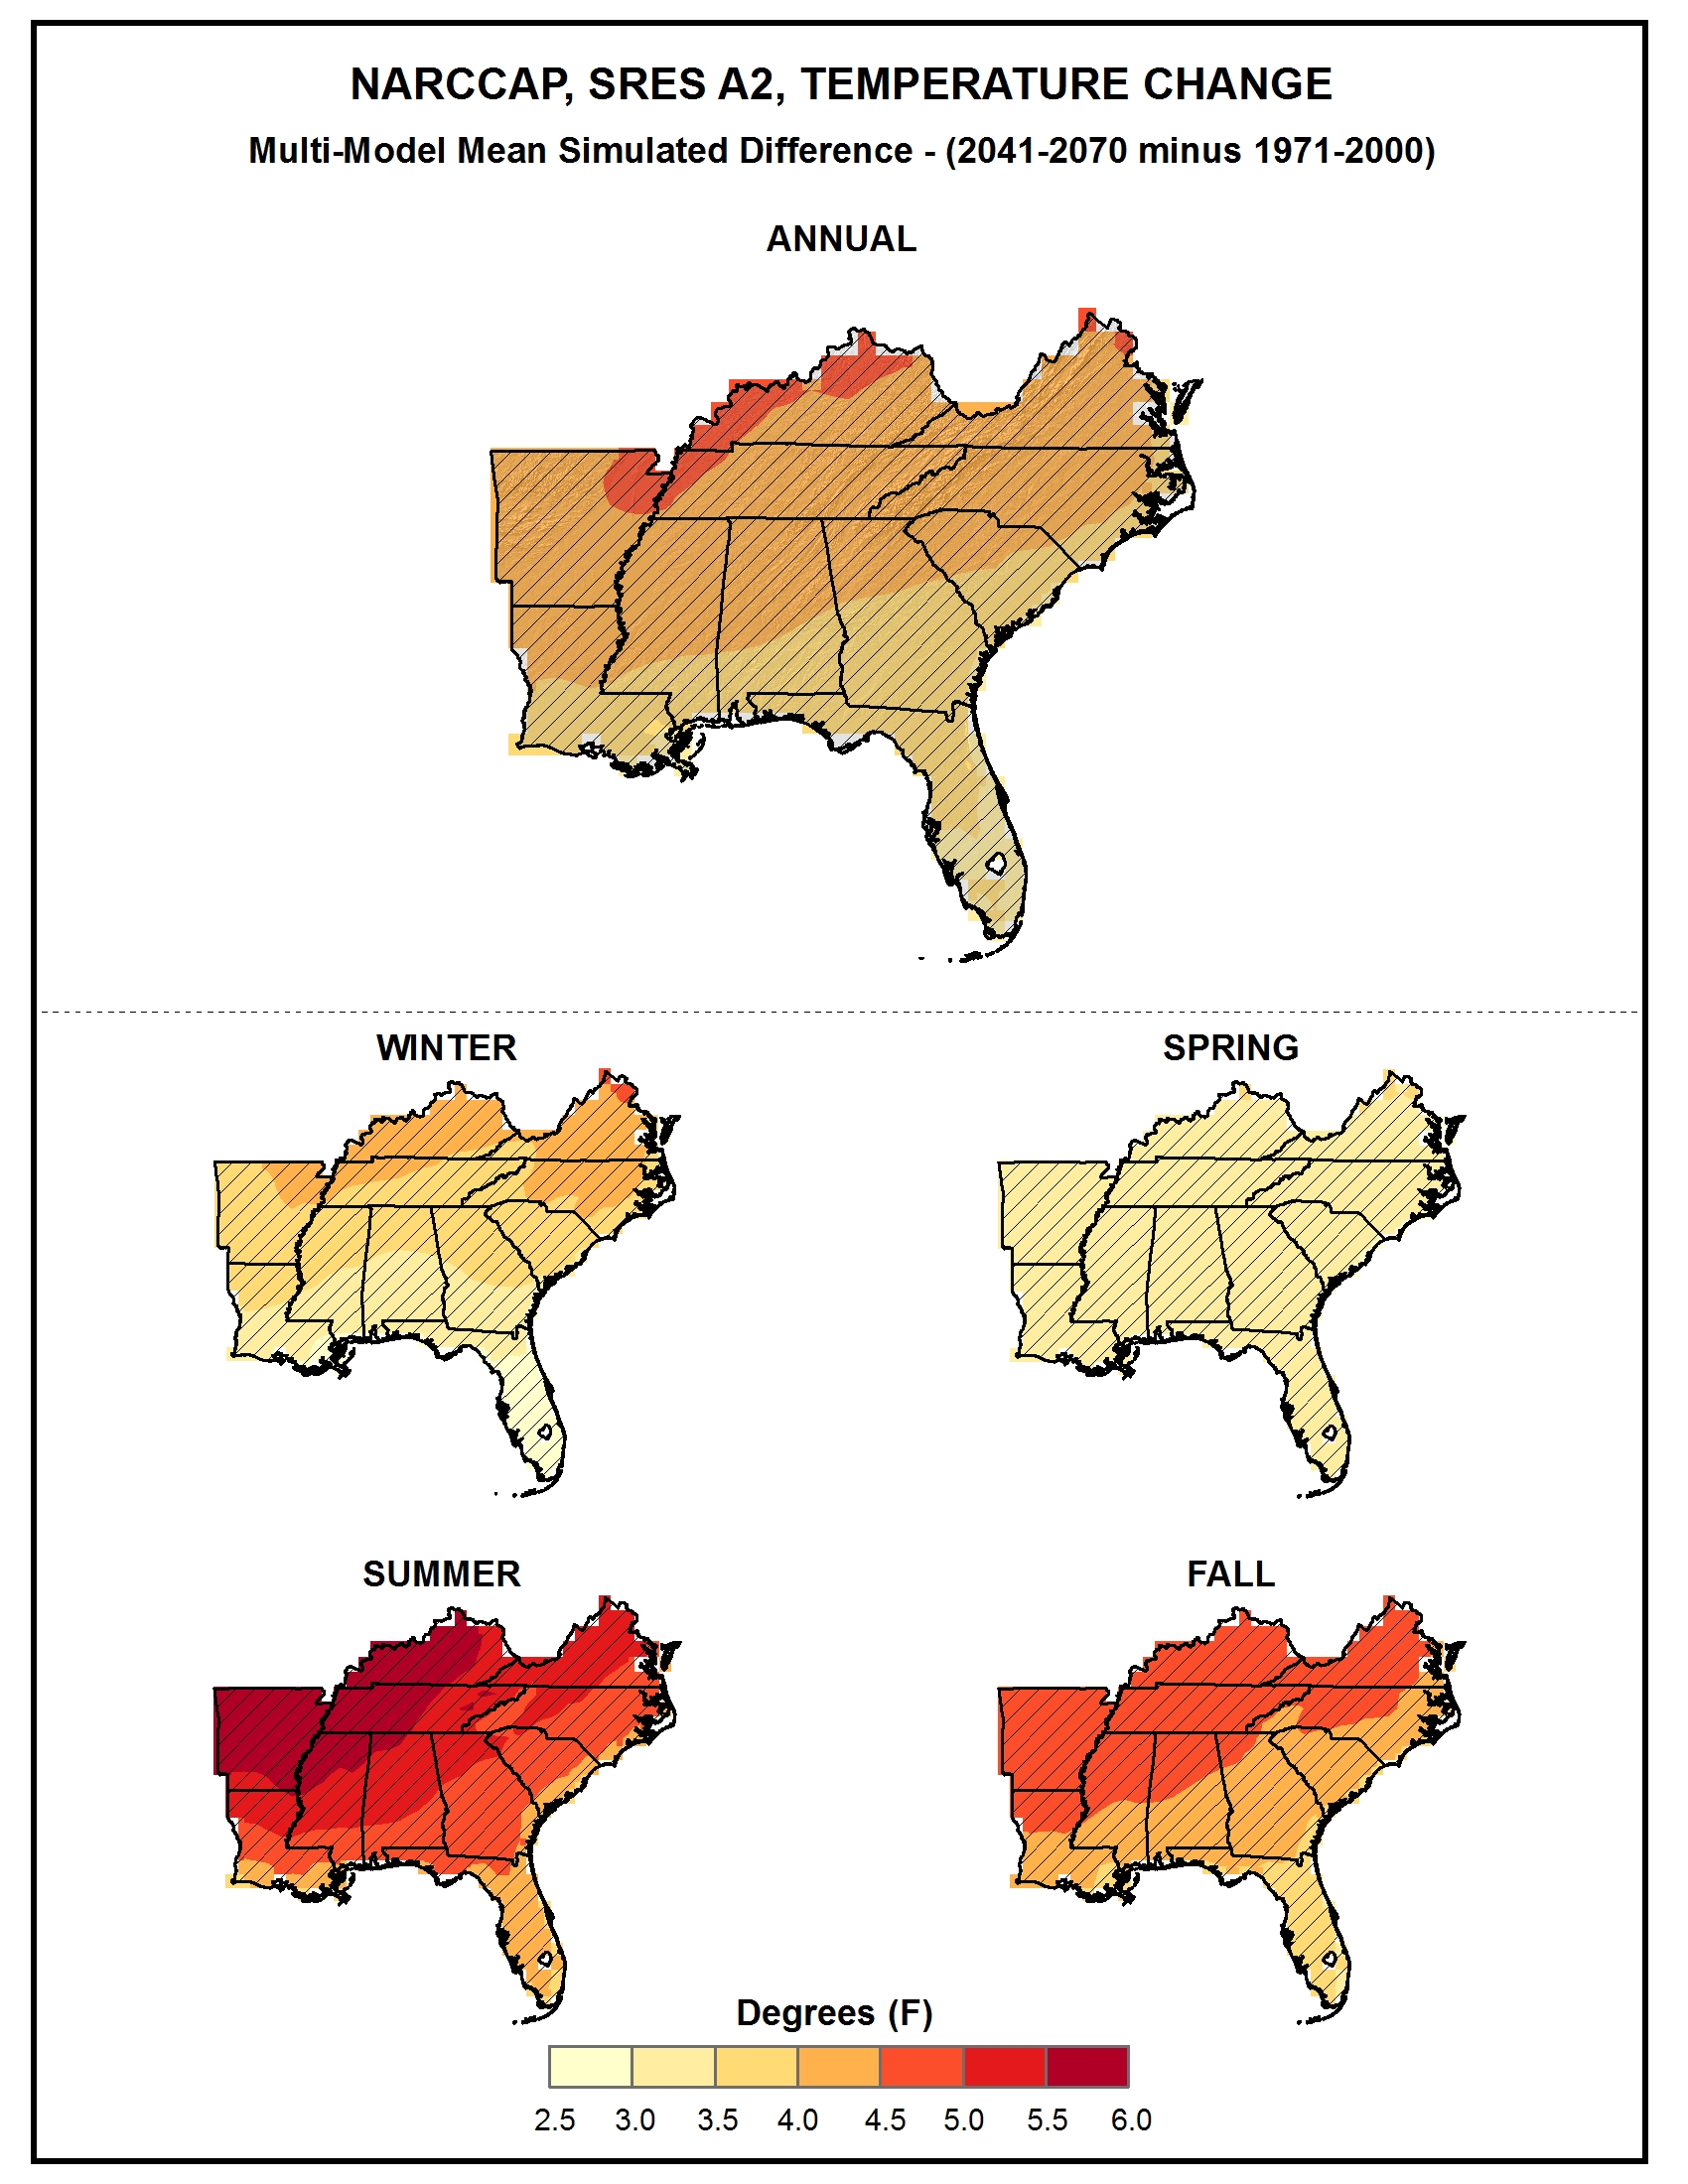
Simulated seasonal mean precipitation change |
Simulated |
Precipitation |
Southeast and Caribbean |
Regional Climate Trends and Scenarios for the U.S. National Climate Assessment. Part 2. Climate of the Southeast U.S. |
NCA 3 |
 |
|
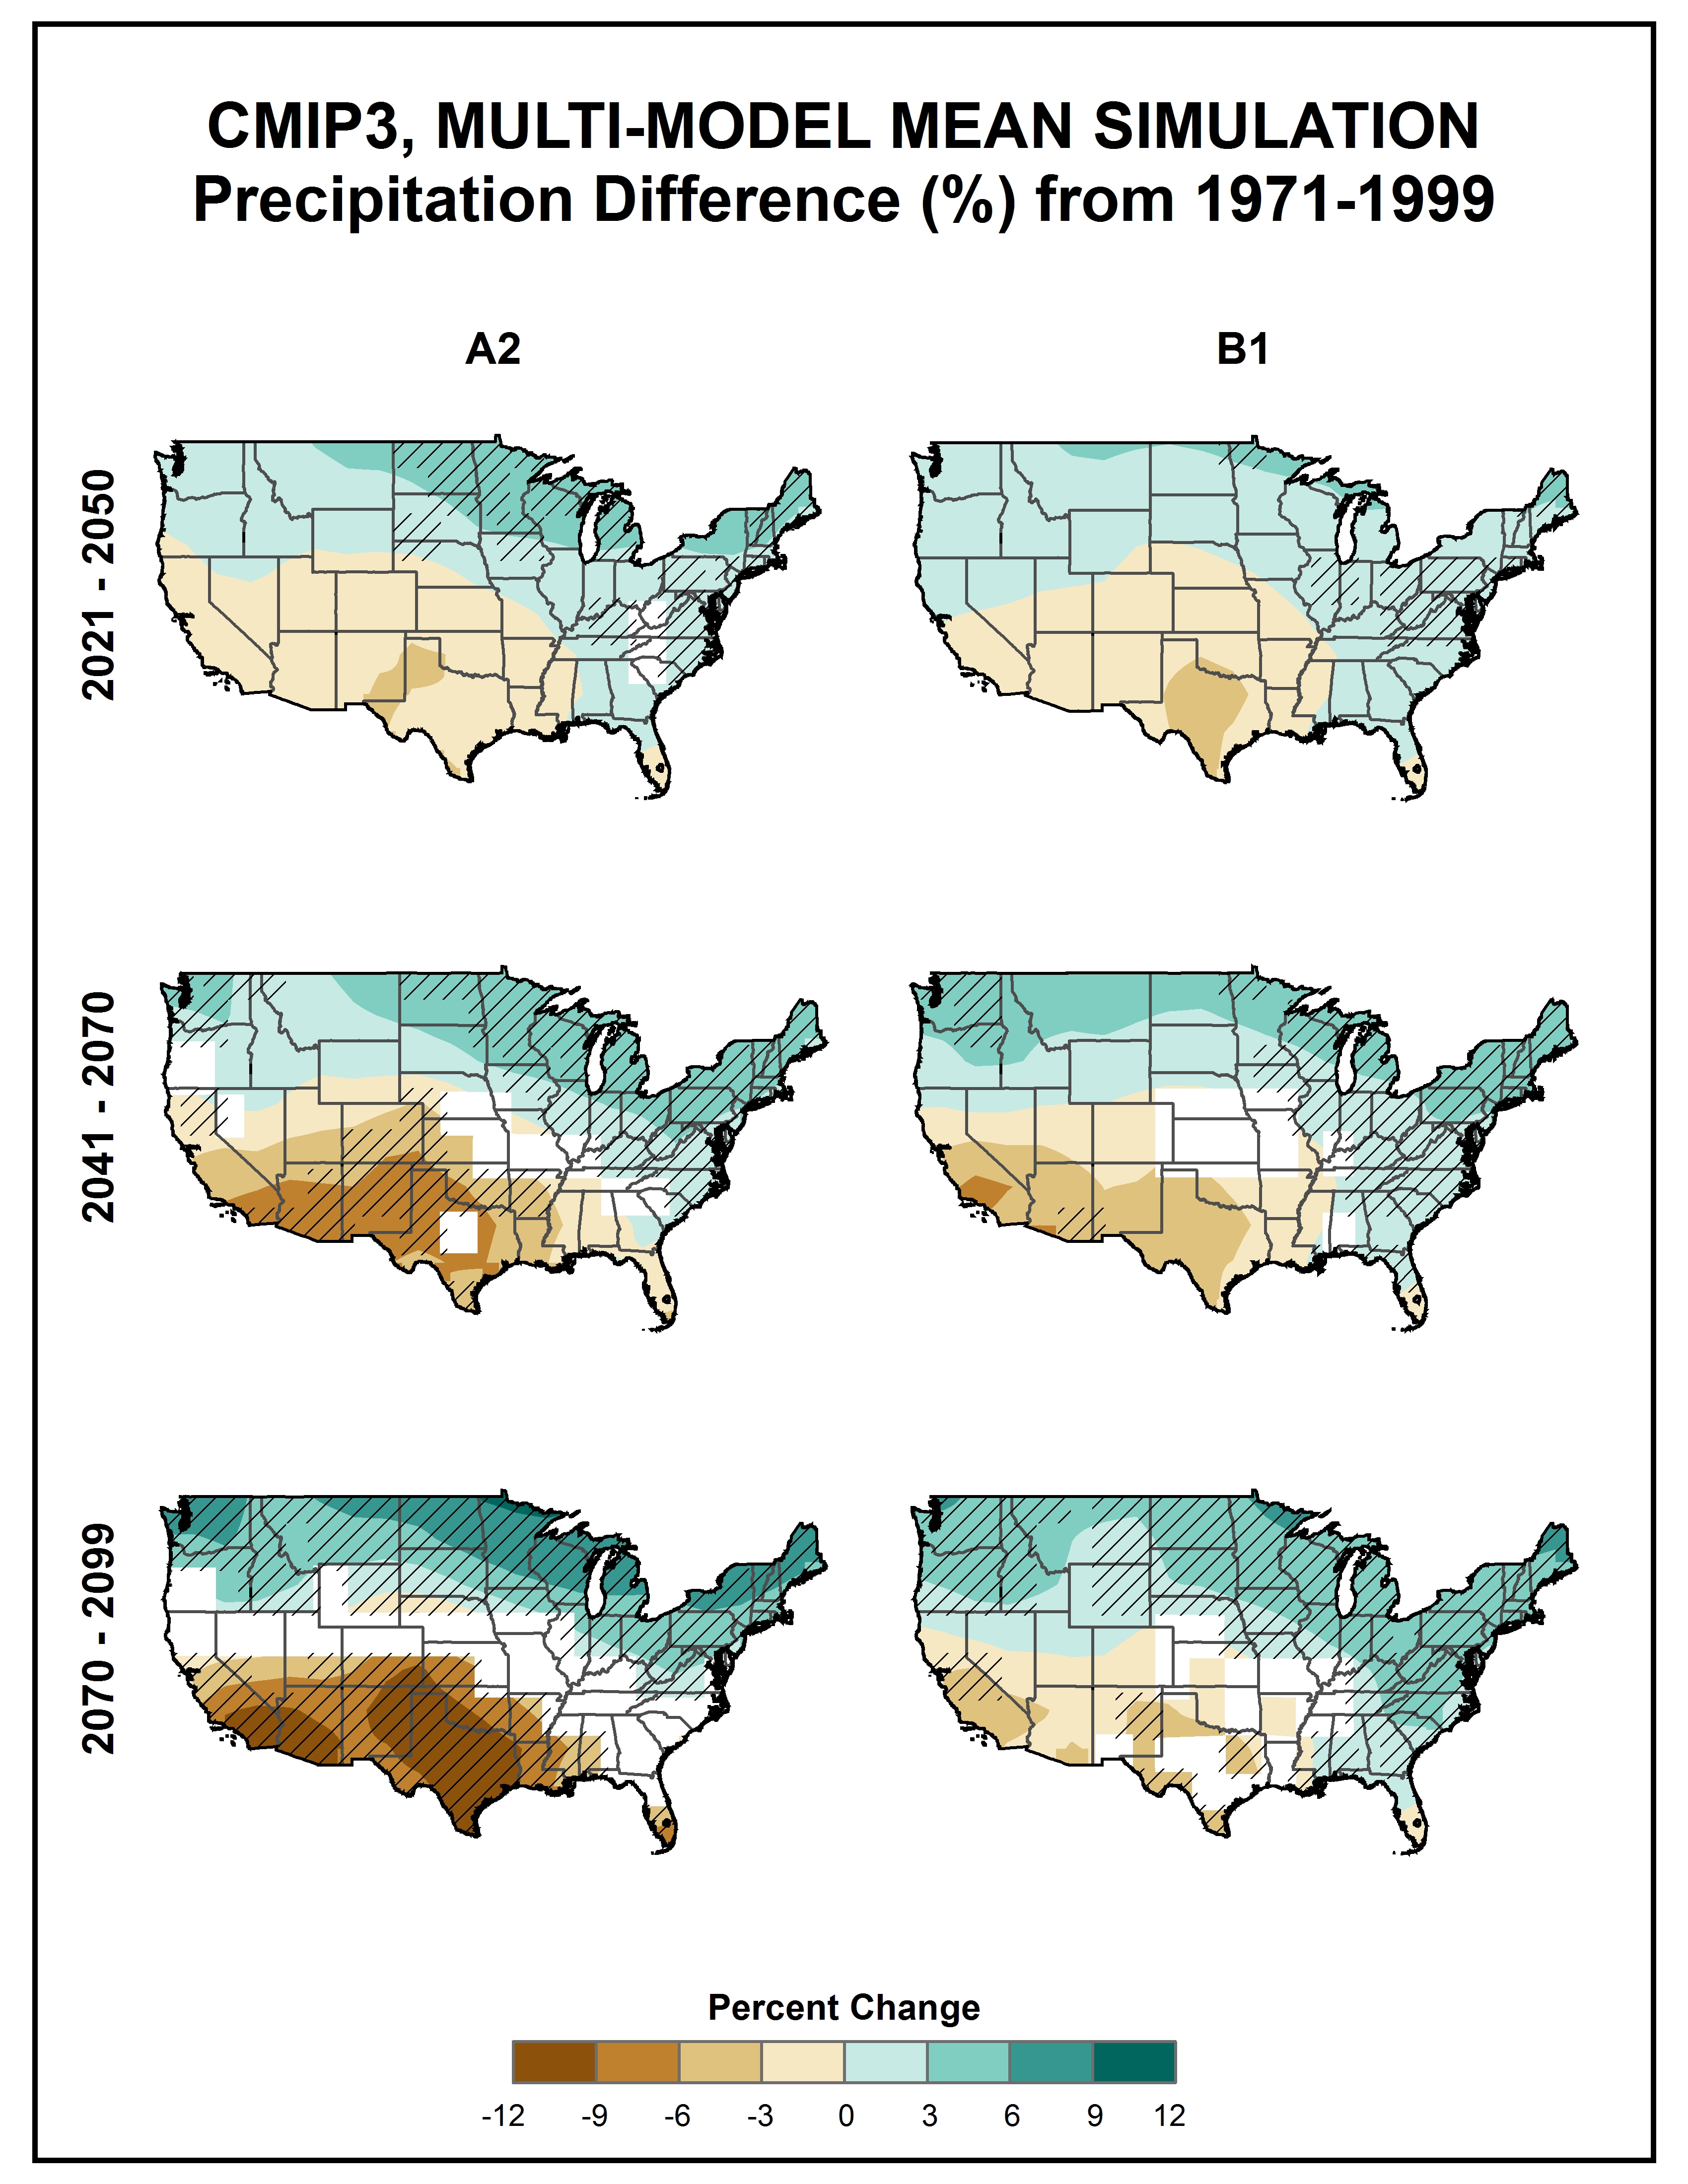
Simulated seasonal mean precipitation change |
Simulated |
Precipitation |
National |
Regional Climate Trends and Scenarios for the U.S. National Climate Assessment. Part 9. Climate of the Contiguous United States |
NCA 3 |
 |
|
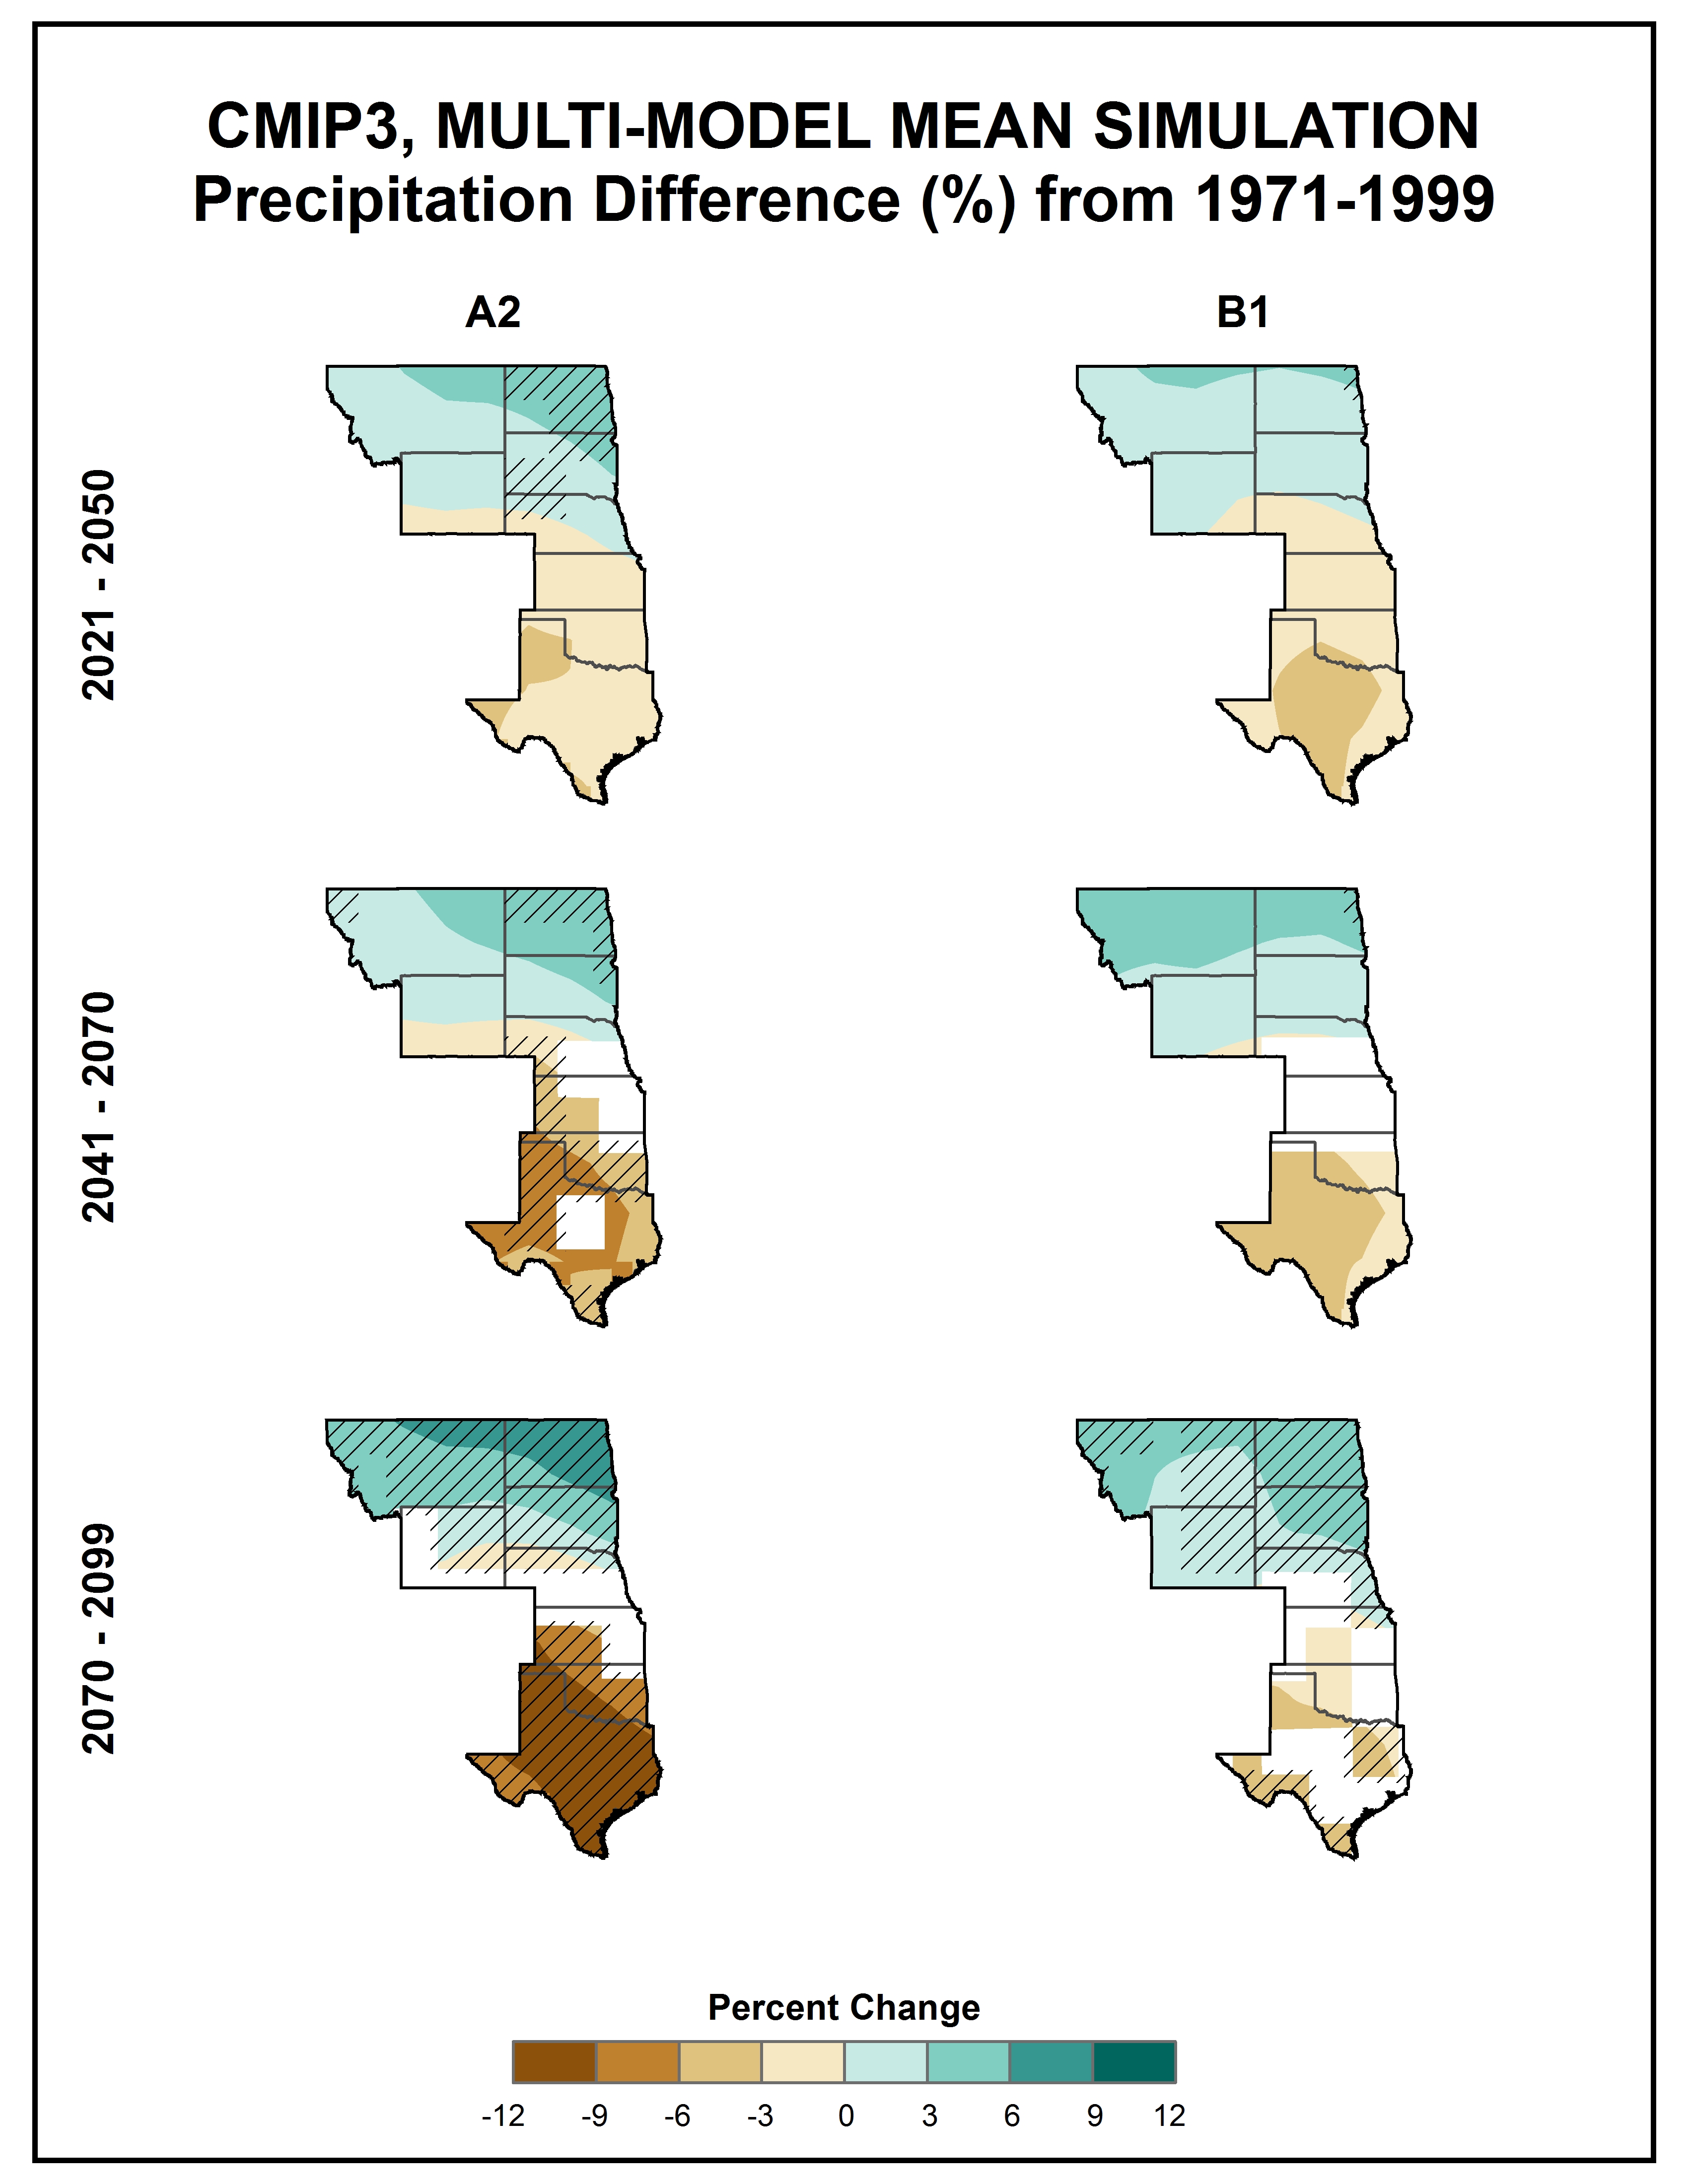
Simulated seasonal mean precipitation change |
Simulated |
Precipitation |
Great Plains |
Regional Climate Trends and Scenarios for the U.S. National Climate Assessment. Part 4. Climate of the U.S. Great Plains |
NCA 3 |
 |
|
Simulated seasonal mean precipitation change |
Simulated |
Precipitation |
Alaska and Arctic |
Regional Climate Trends and Scenarios for the U.S. National Climate Assessment. Part 7. Climate of Alaska |
NCA 3 |
 |
|
Simulated seasonal mean precipitation change |
Simulated |
Precipitation |
Northeast |
Regional Climate Trends and Scenarios for the U.S. National Climate Assessment. Part 1. Climate of the Northeast U.S. |
NCA 3 |
 |
|
Simulated seasonal mean precipitation change |
Simulated |
Precipitation |
Southwest |
Regional Climate Trends and Scenarios for the U.S. National Climate Assessment. Part 5. Climate of the Southwest U.S. |
NCA 3 |
 |
|
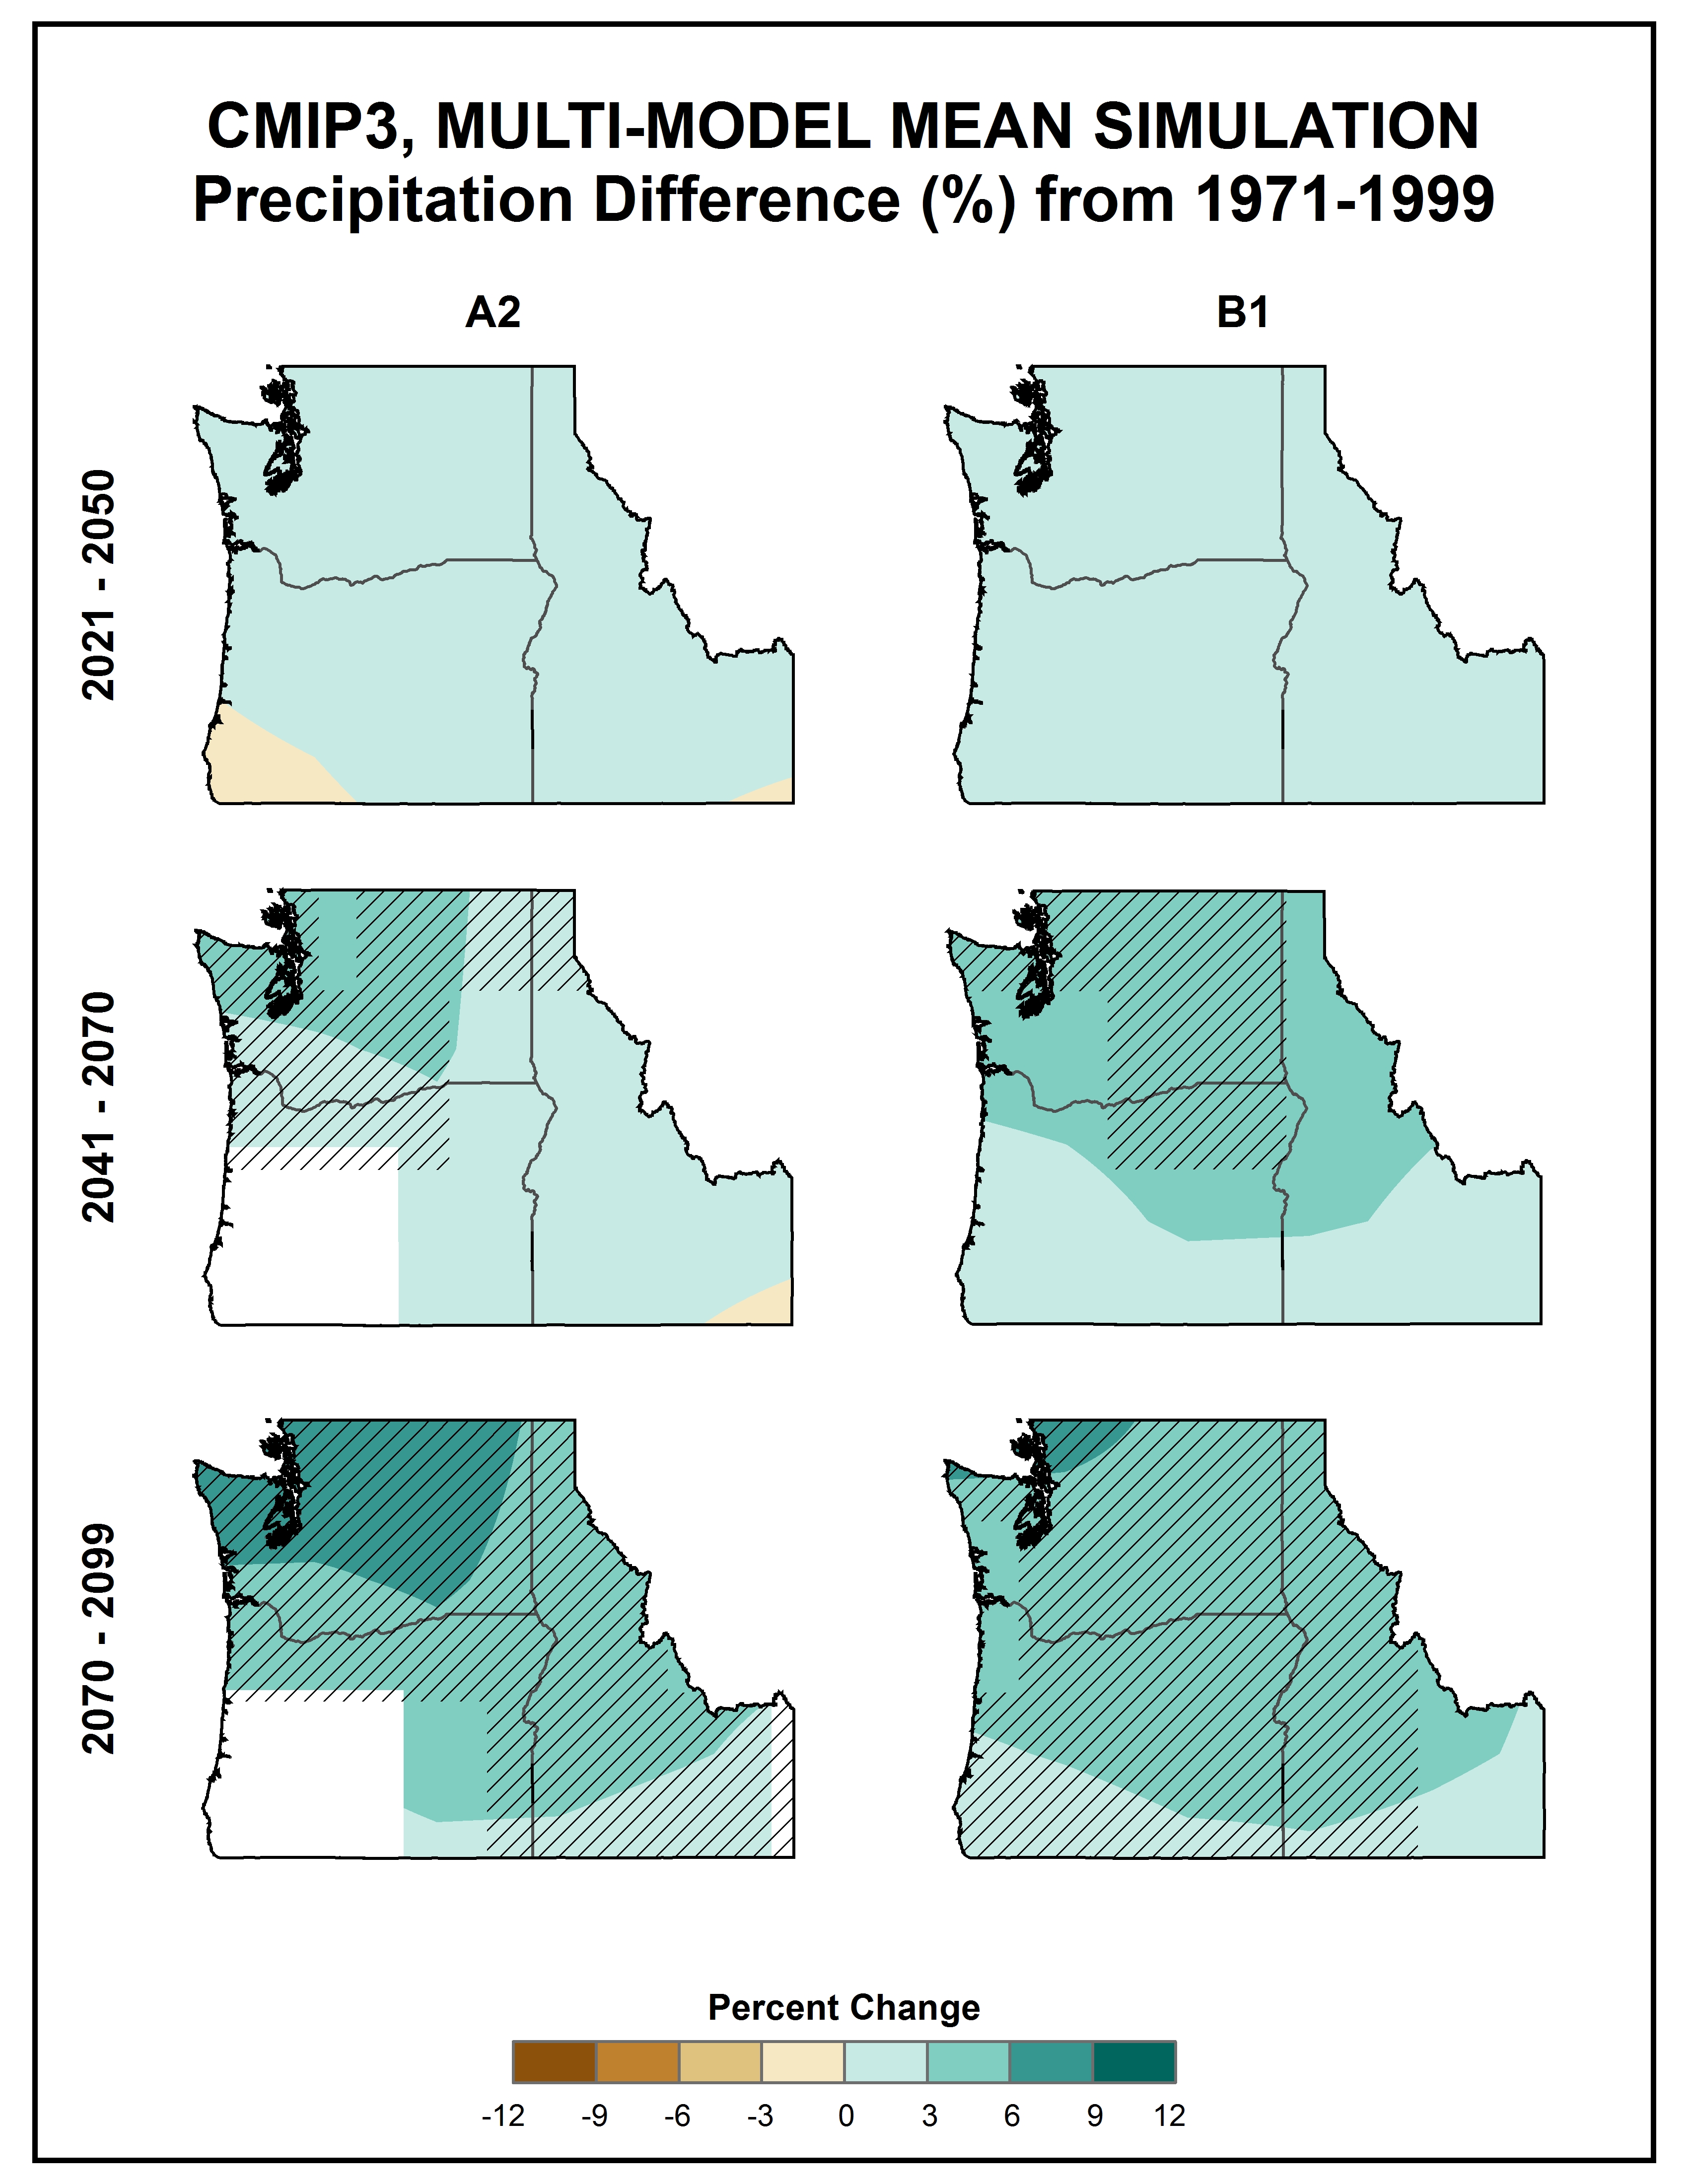
Simulated seasonal mean precipitation change |
Simulated |
Precipitation |
Northwest |
Regional Climate Trends and Scenarios for the U.S. National Climate Assessment. Part 6. Climate of the Northwest U.S. |
NCA 3 |
 |
|
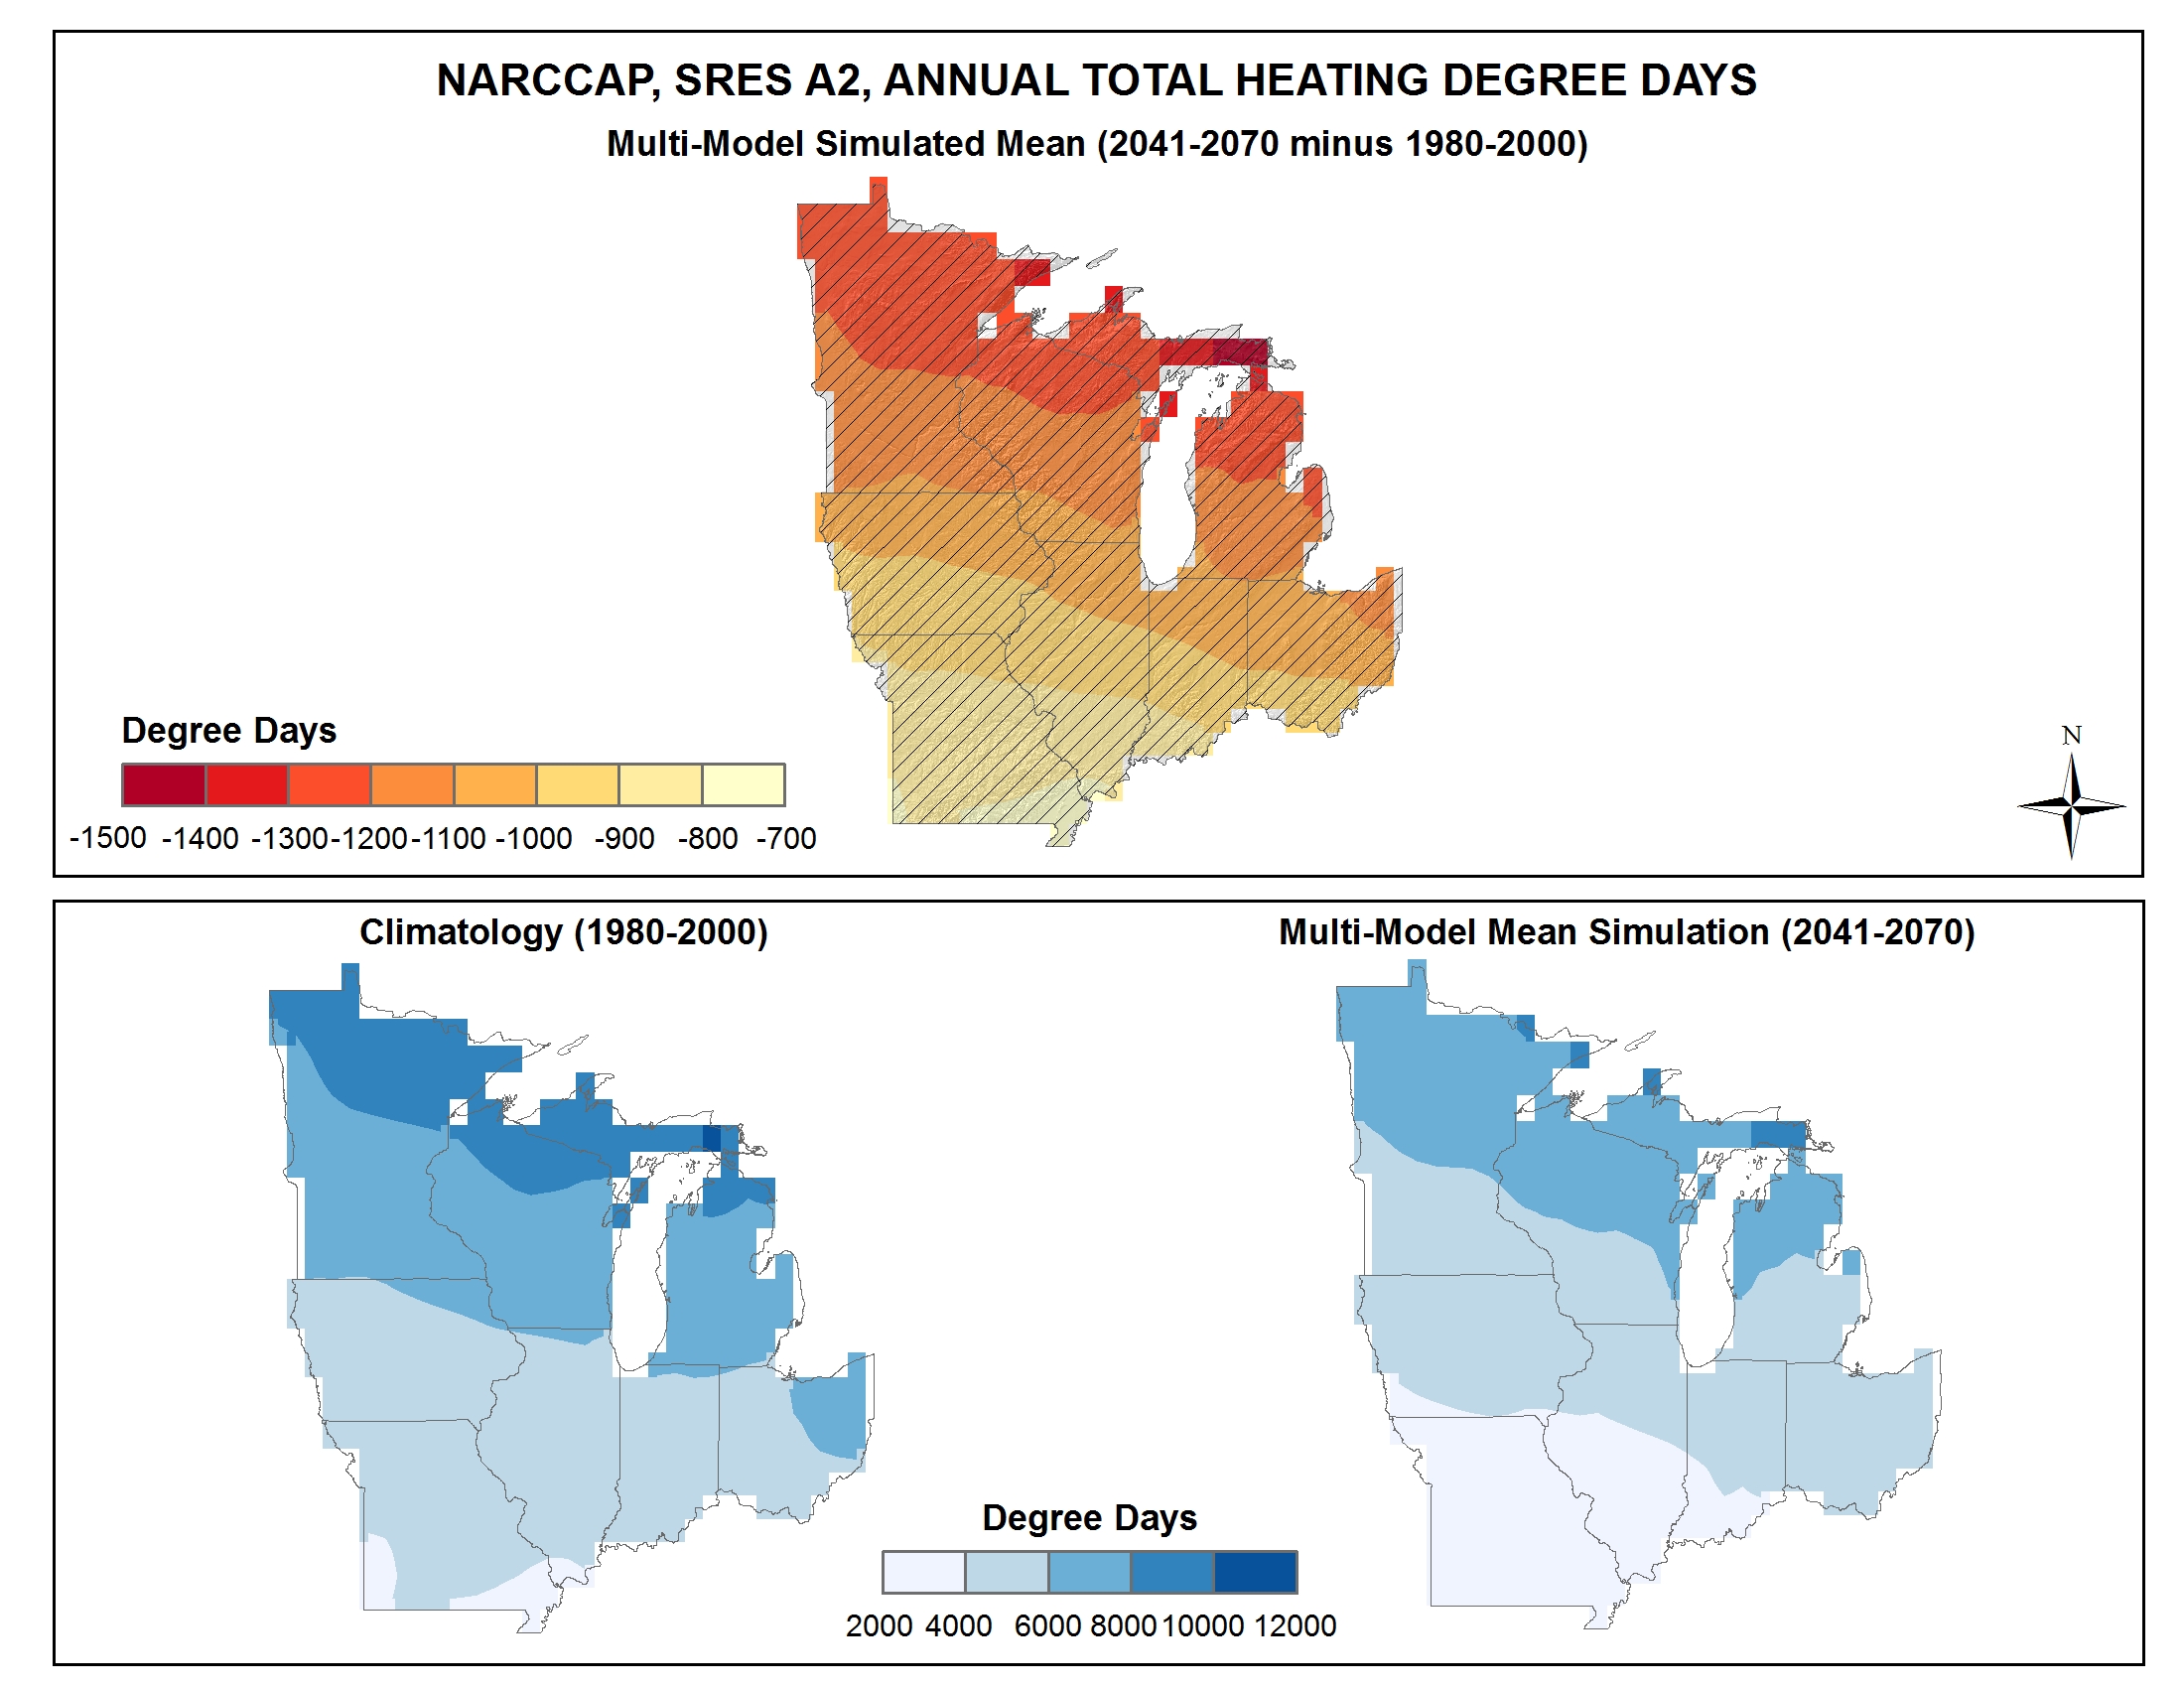
Simulated difference in the mean annual number of heating degree days |
Simulated |
Temperature |
Midwest |
Regional Climate Trends and Scenarios for the U.S. National Climate Assessment. Part 3. Climate of the Midwest U.S. |
NCA 3 |
 |
|
Simulated difference in the mean annual number of heating degree days |
Simulated |
Temperature |
Southeast and Caribbean |
Regional Climate Trends and Scenarios for the U.S. National Climate Assessment. Part 2. Climate of the Southeast U.S. |
NCA 3 |
 |
|
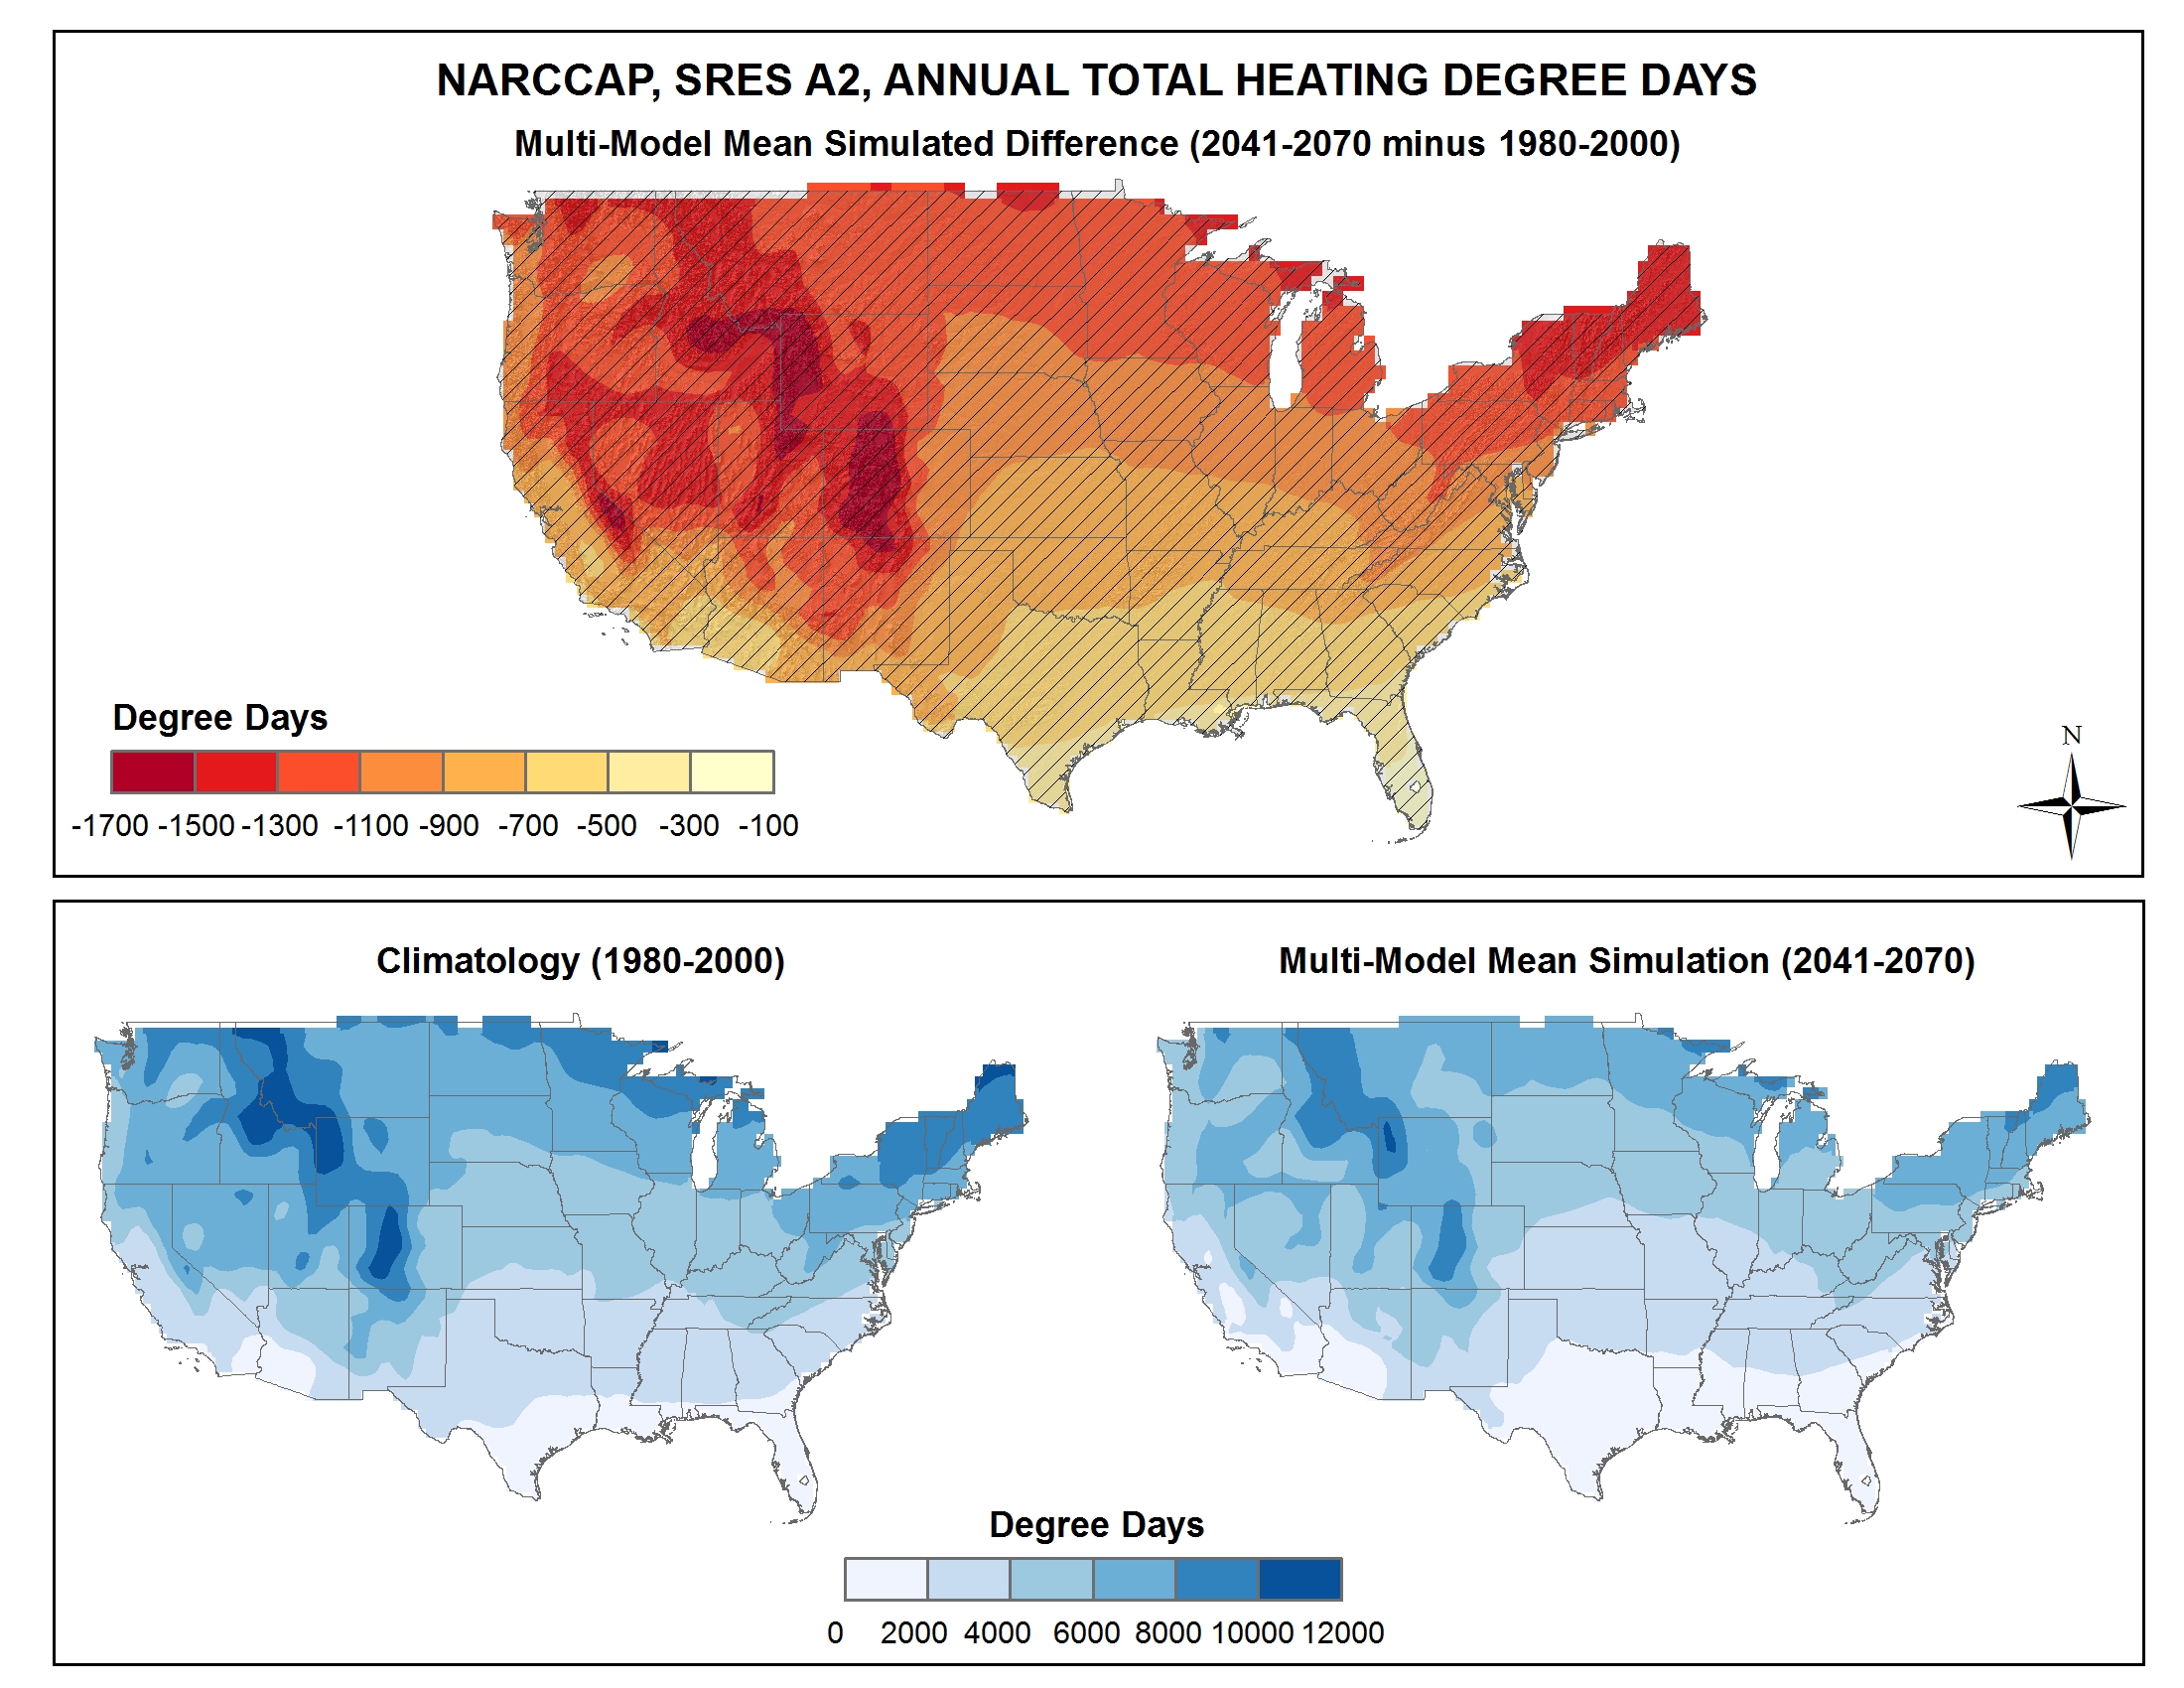
Simulated difference in the mean annual number of heating degree days |
Simulated |
Temperature |
National |
Regional Climate Trends and Scenarios for the U.S. National Climate Assessment. Part 9. Climate of the Contiguous United States |
NCA 3 |
 |
|
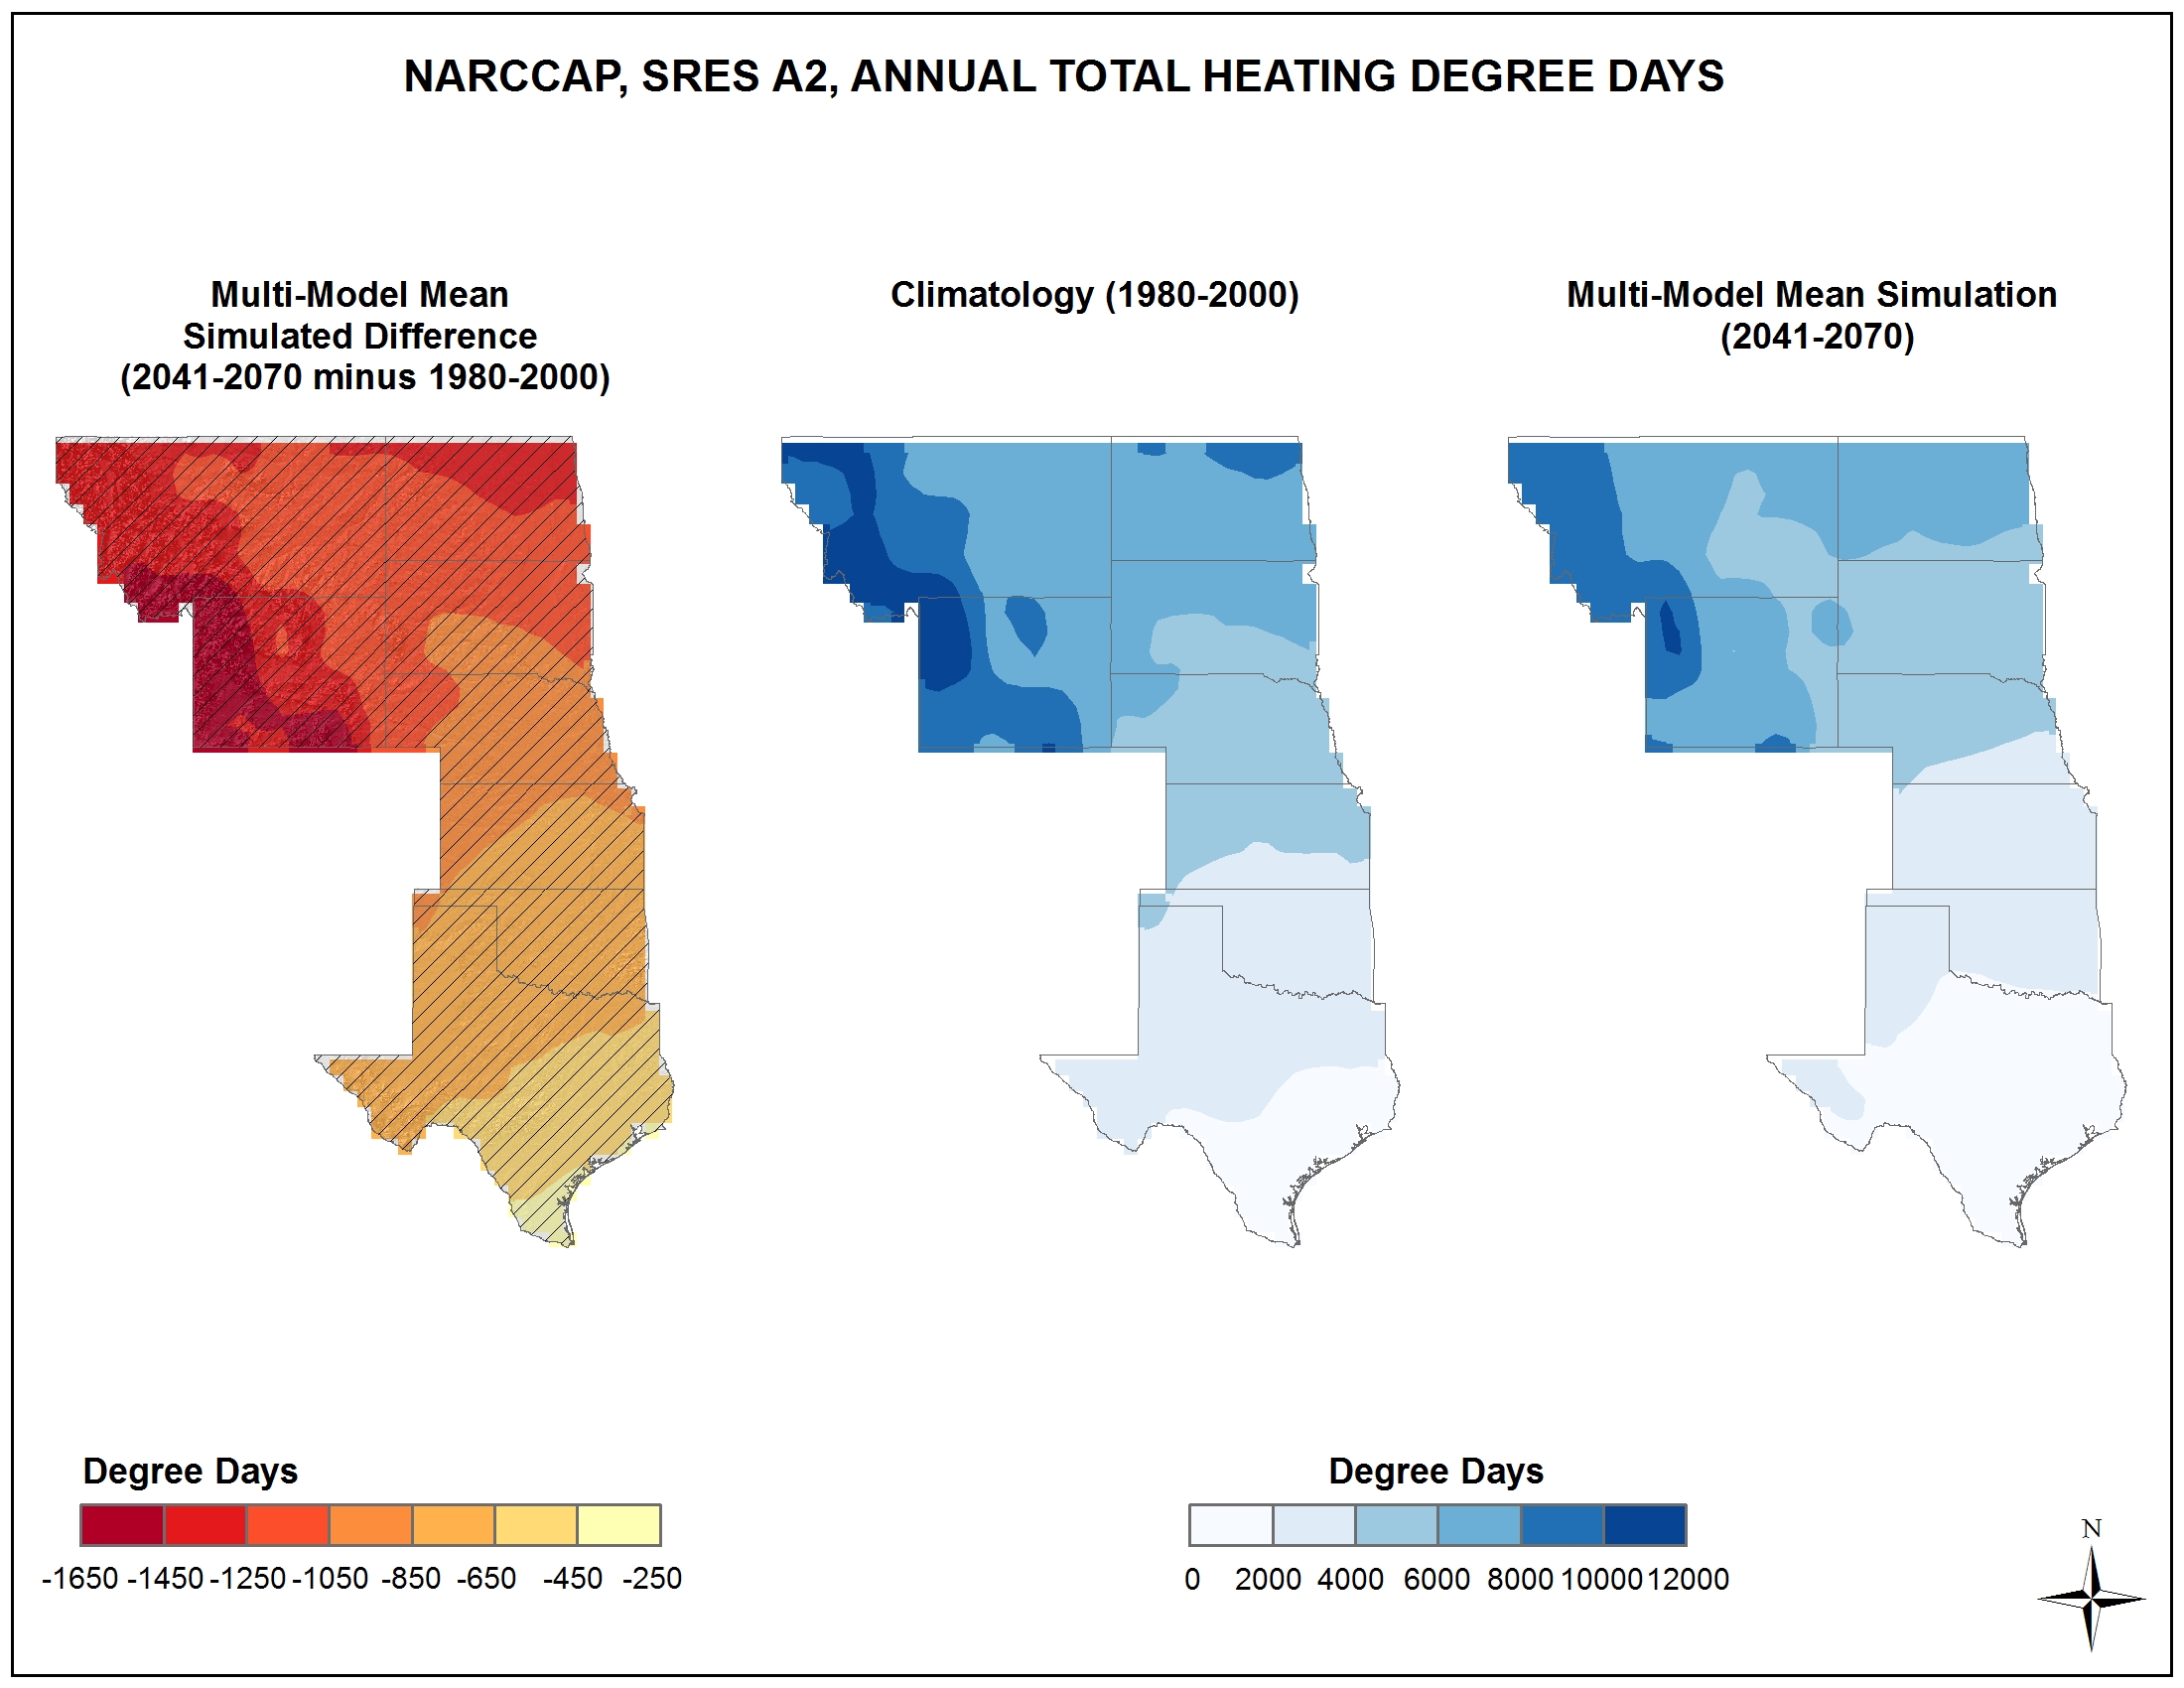
Simulated difference in the mean annual number of heating degree days |
Simulated |
Temperature |
Great Plains |
Regional Climate Trends and Scenarios for the U.S. National Climate Assessment. Part 4. Climate of the U.S. Great Plains |
NCA 3 |
 |
|
Simulated difference in the mean annual number of heating degree days |
Simulated |
Temperature |
Northeast |
Regional Climate Trends and Scenarios for the U.S. National Climate Assessment. Part 1. Climate of the Northeast U.S. |
NCA 3 |
 |
|
Simulated difference in the mean annual number of heating degree days |
Simulated |
Temperature |
Southwest |
Regional Climate Trends and Scenarios for the U.S. National Climate Assessment. Part 5. Climate of the Southwest U.S. |
NCA 3 |
 |
|
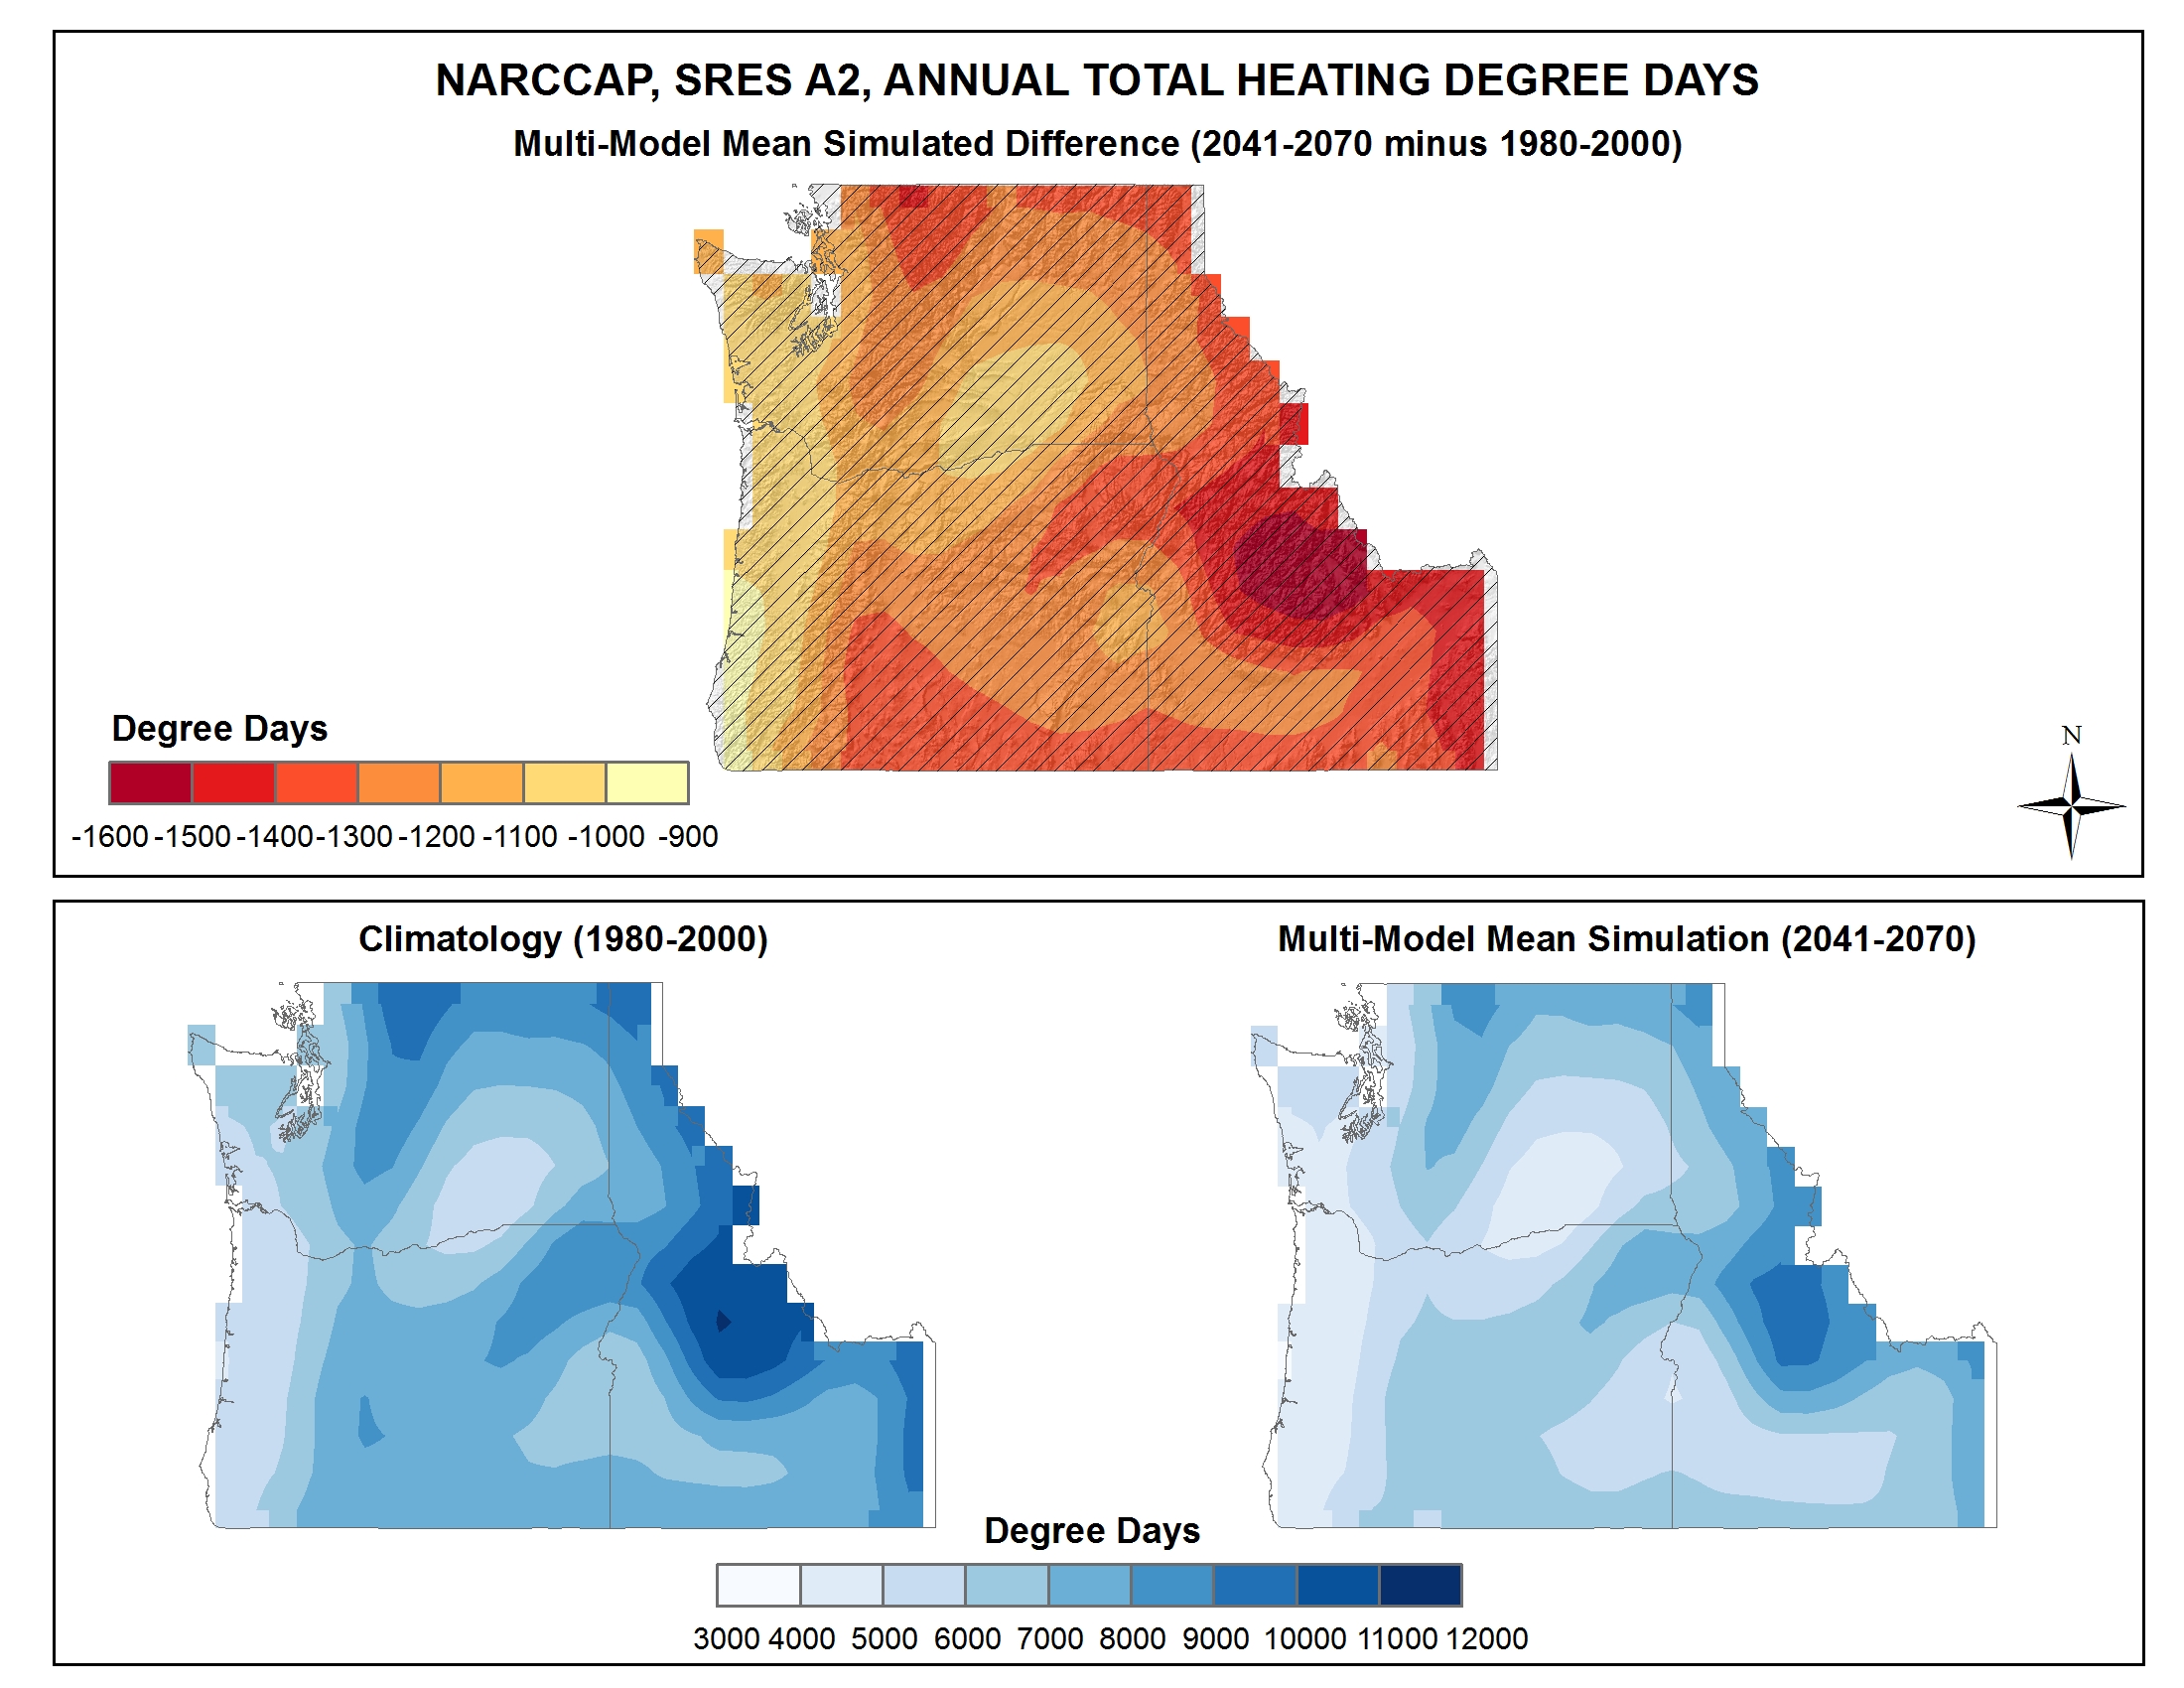
Simulated difference in the mean annual number of heating degree days |
Simulated |
Temperature |
Northwest |
Regional Climate Trends and Scenarios for the U.S. National Climate Assessment. Part 6. Climate of the Northwest U.S. |
NCA 3 |
 |
|
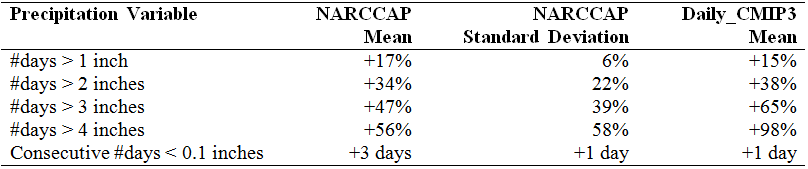
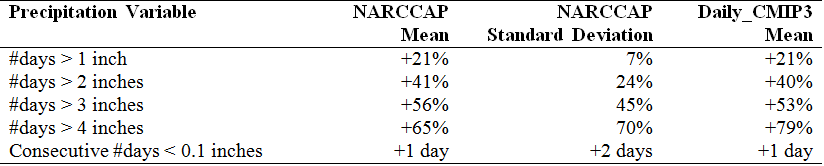
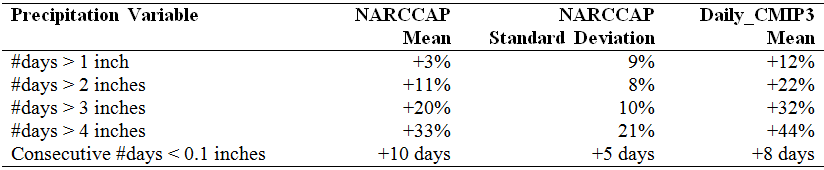
Simulated difference in the mean annual number of days with precipitation of greater than oSW inch |
Simulated |
Precipitation |
Southwest |
Regional Climate Trends and Scenarios for the U.S. National Climate Assessment. Part 5. Climate of the Southwest U.S. |
NCA 3 |
 |
|
Simulated difference in the mean annual number of days with precipitation of greater than one inch |
Simulated |
Precipitation |
Midwest |
Regional Climate Trends and Scenarios for the U.S. National Climate Assessment. Part 3. Climate of the Midwest U.S. |
NCA 3 |
 |
|
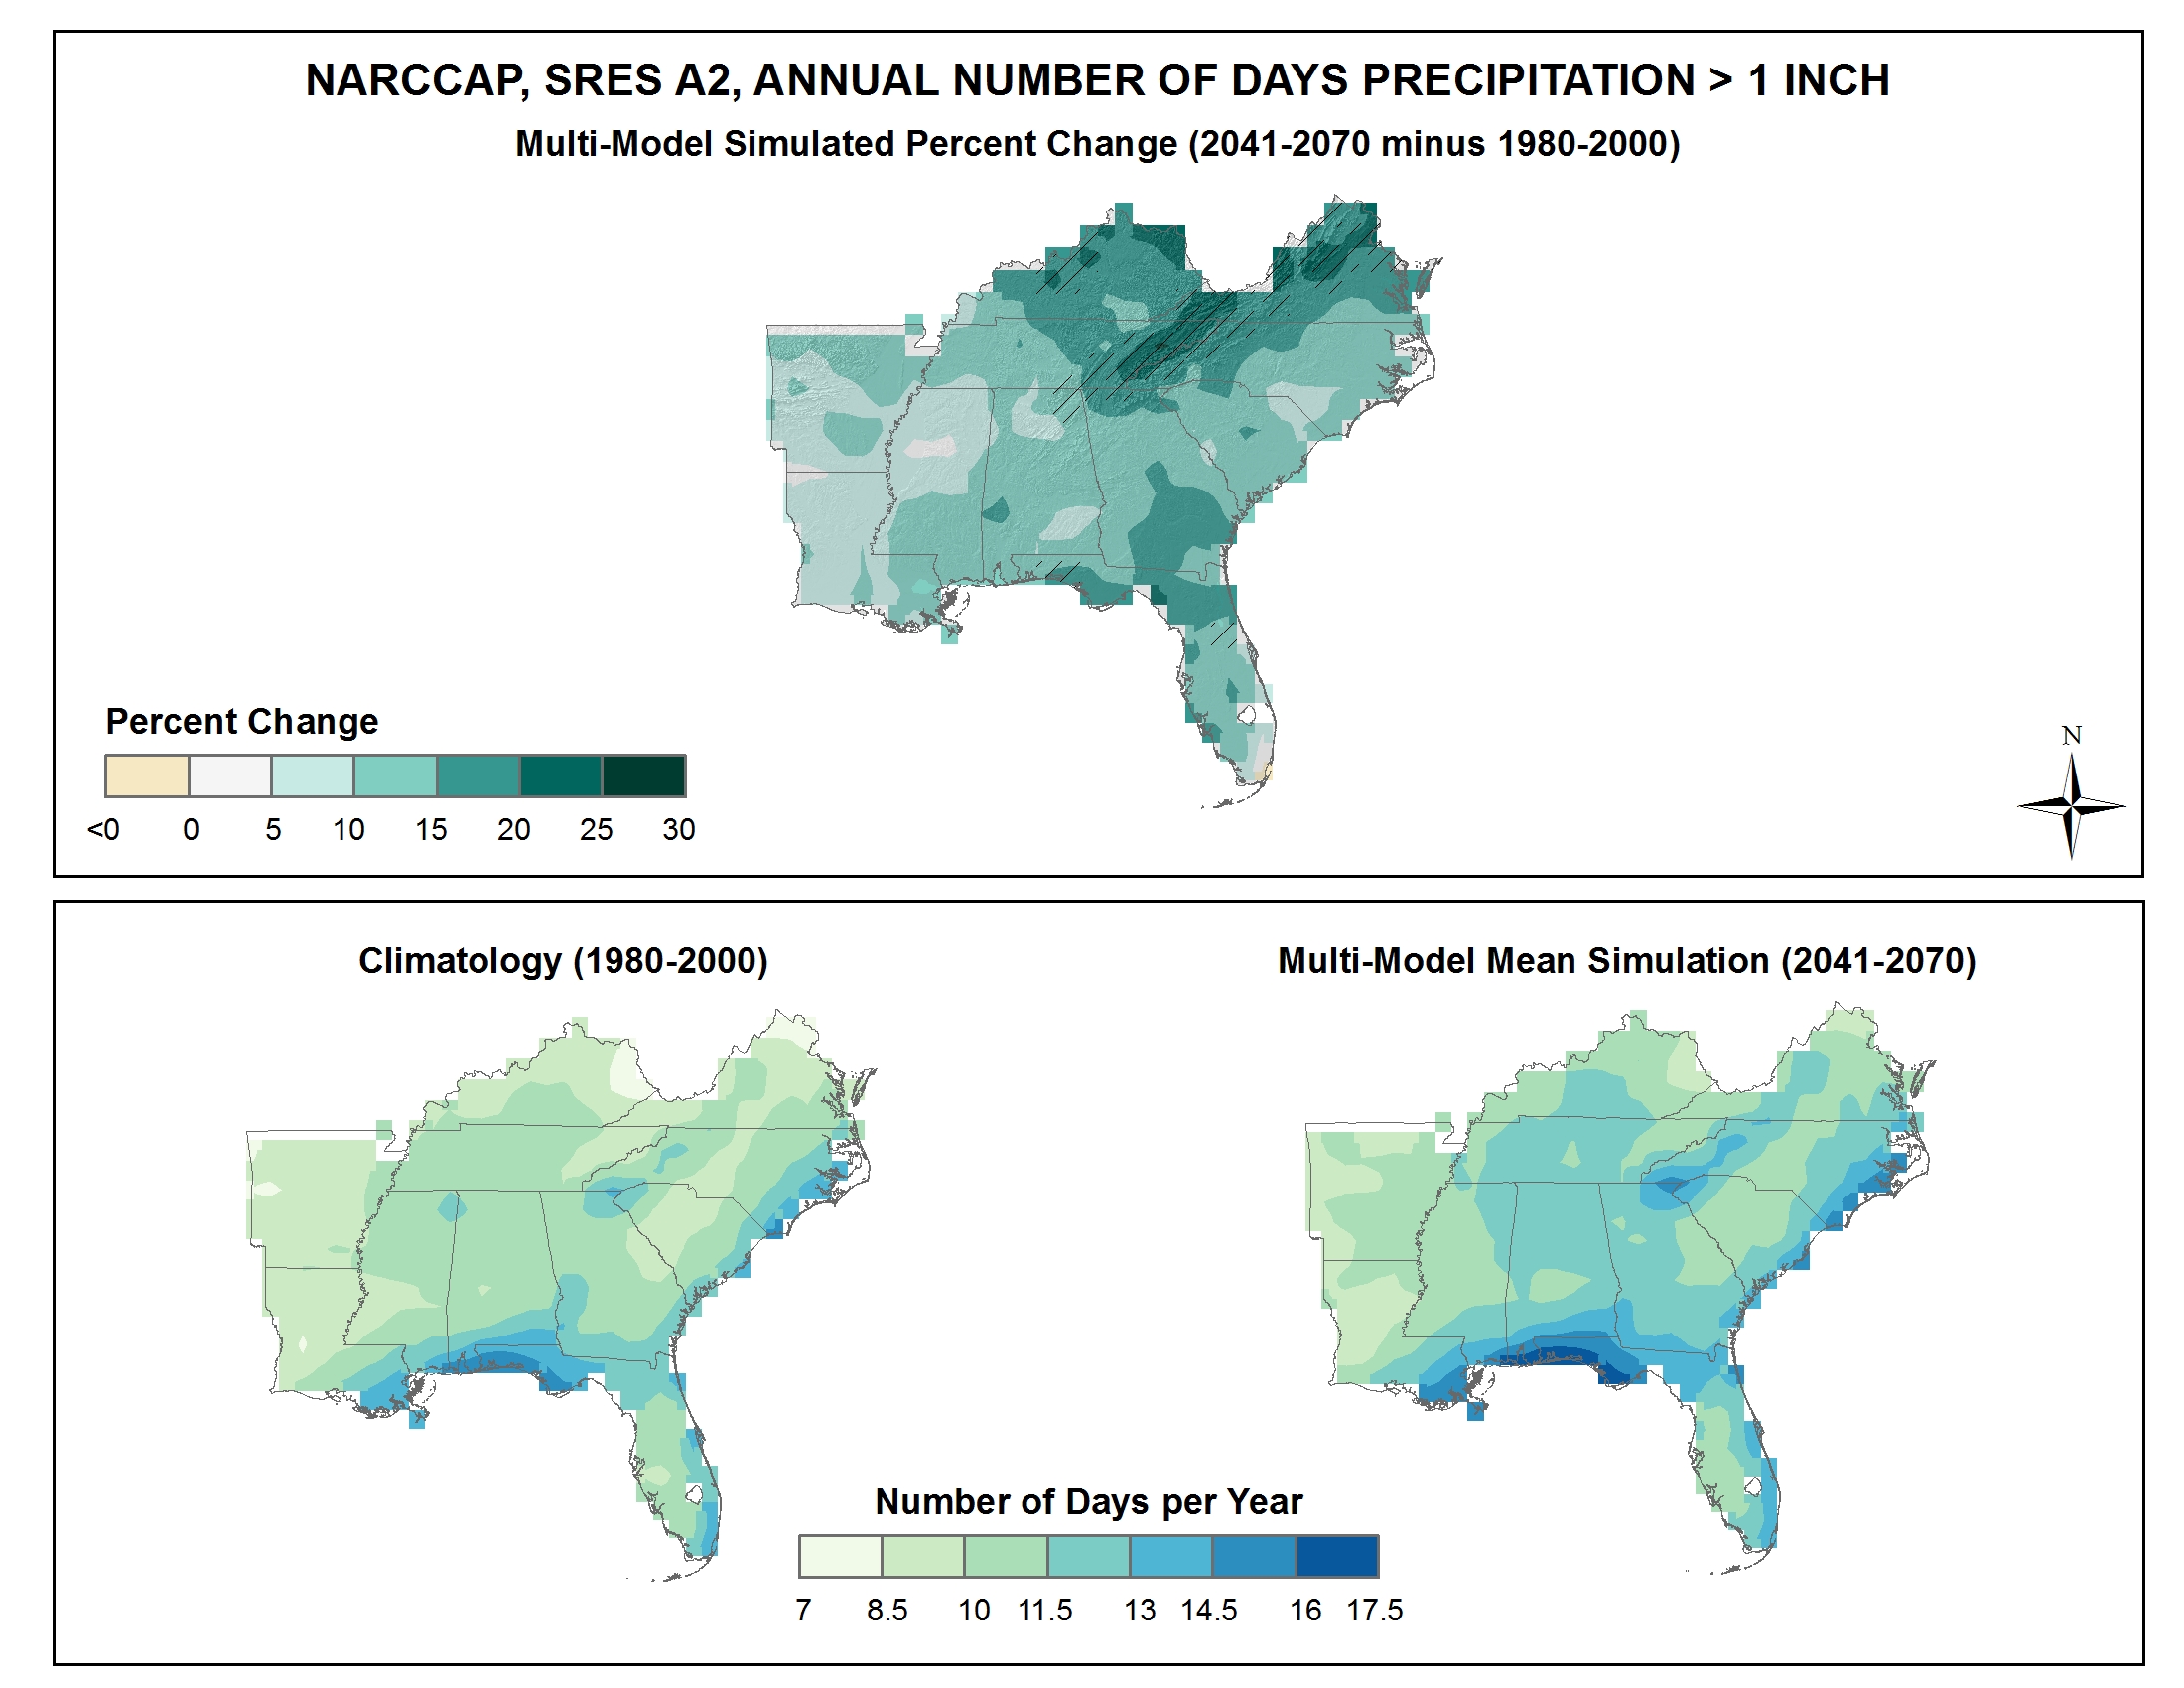
Simulated difference in the mean annual number of days with precipitation of greater than one inch |
Simulated |
Precipitation |
Southeast and Caribbean |
Regional Climate Trends and Scenarios for the U.S. National Climate Assessment. Part 2. Climate of the Southeast U.S. |
NCA 3 |
 |
|
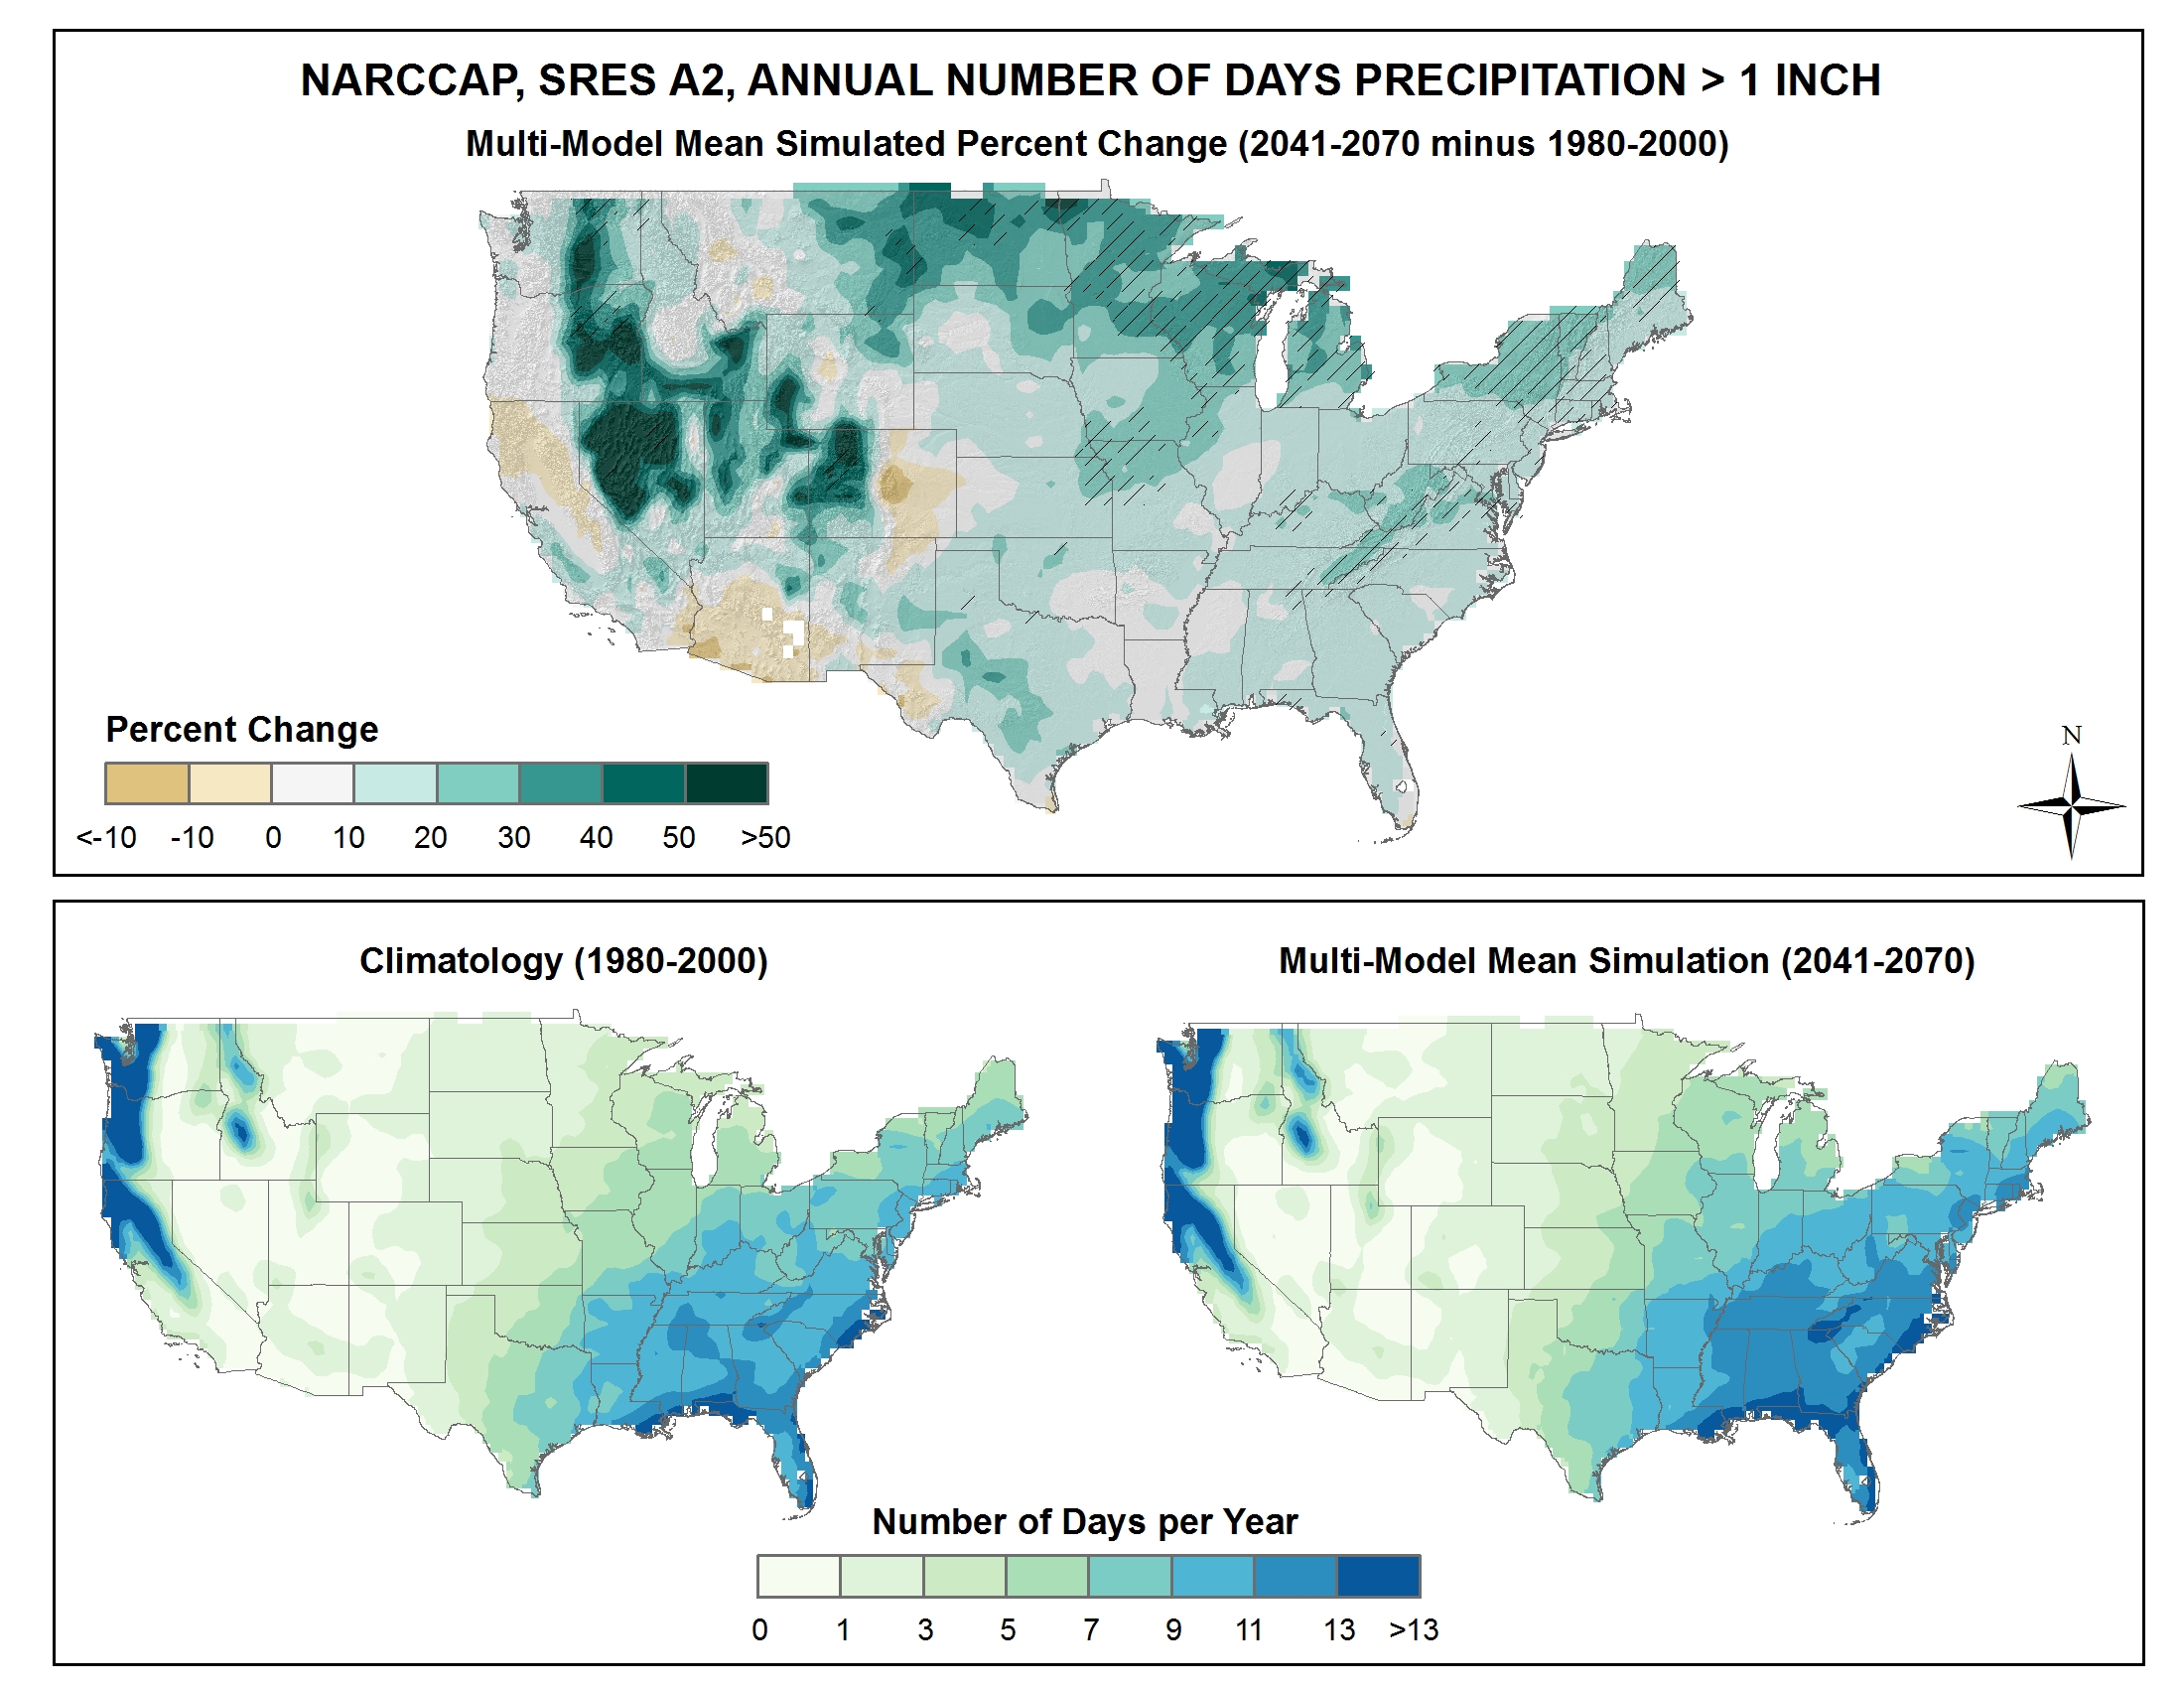
Simulated difference in the mean annual number of days with precipitation of greater than one inch |
Simulated |
Precipitation |
National |
Regional Climate Trends and Scenarios for the U.S. National Climate Assessment. Part 9. Climate of the Contiguous United States |
NCA 3 |
 |
|
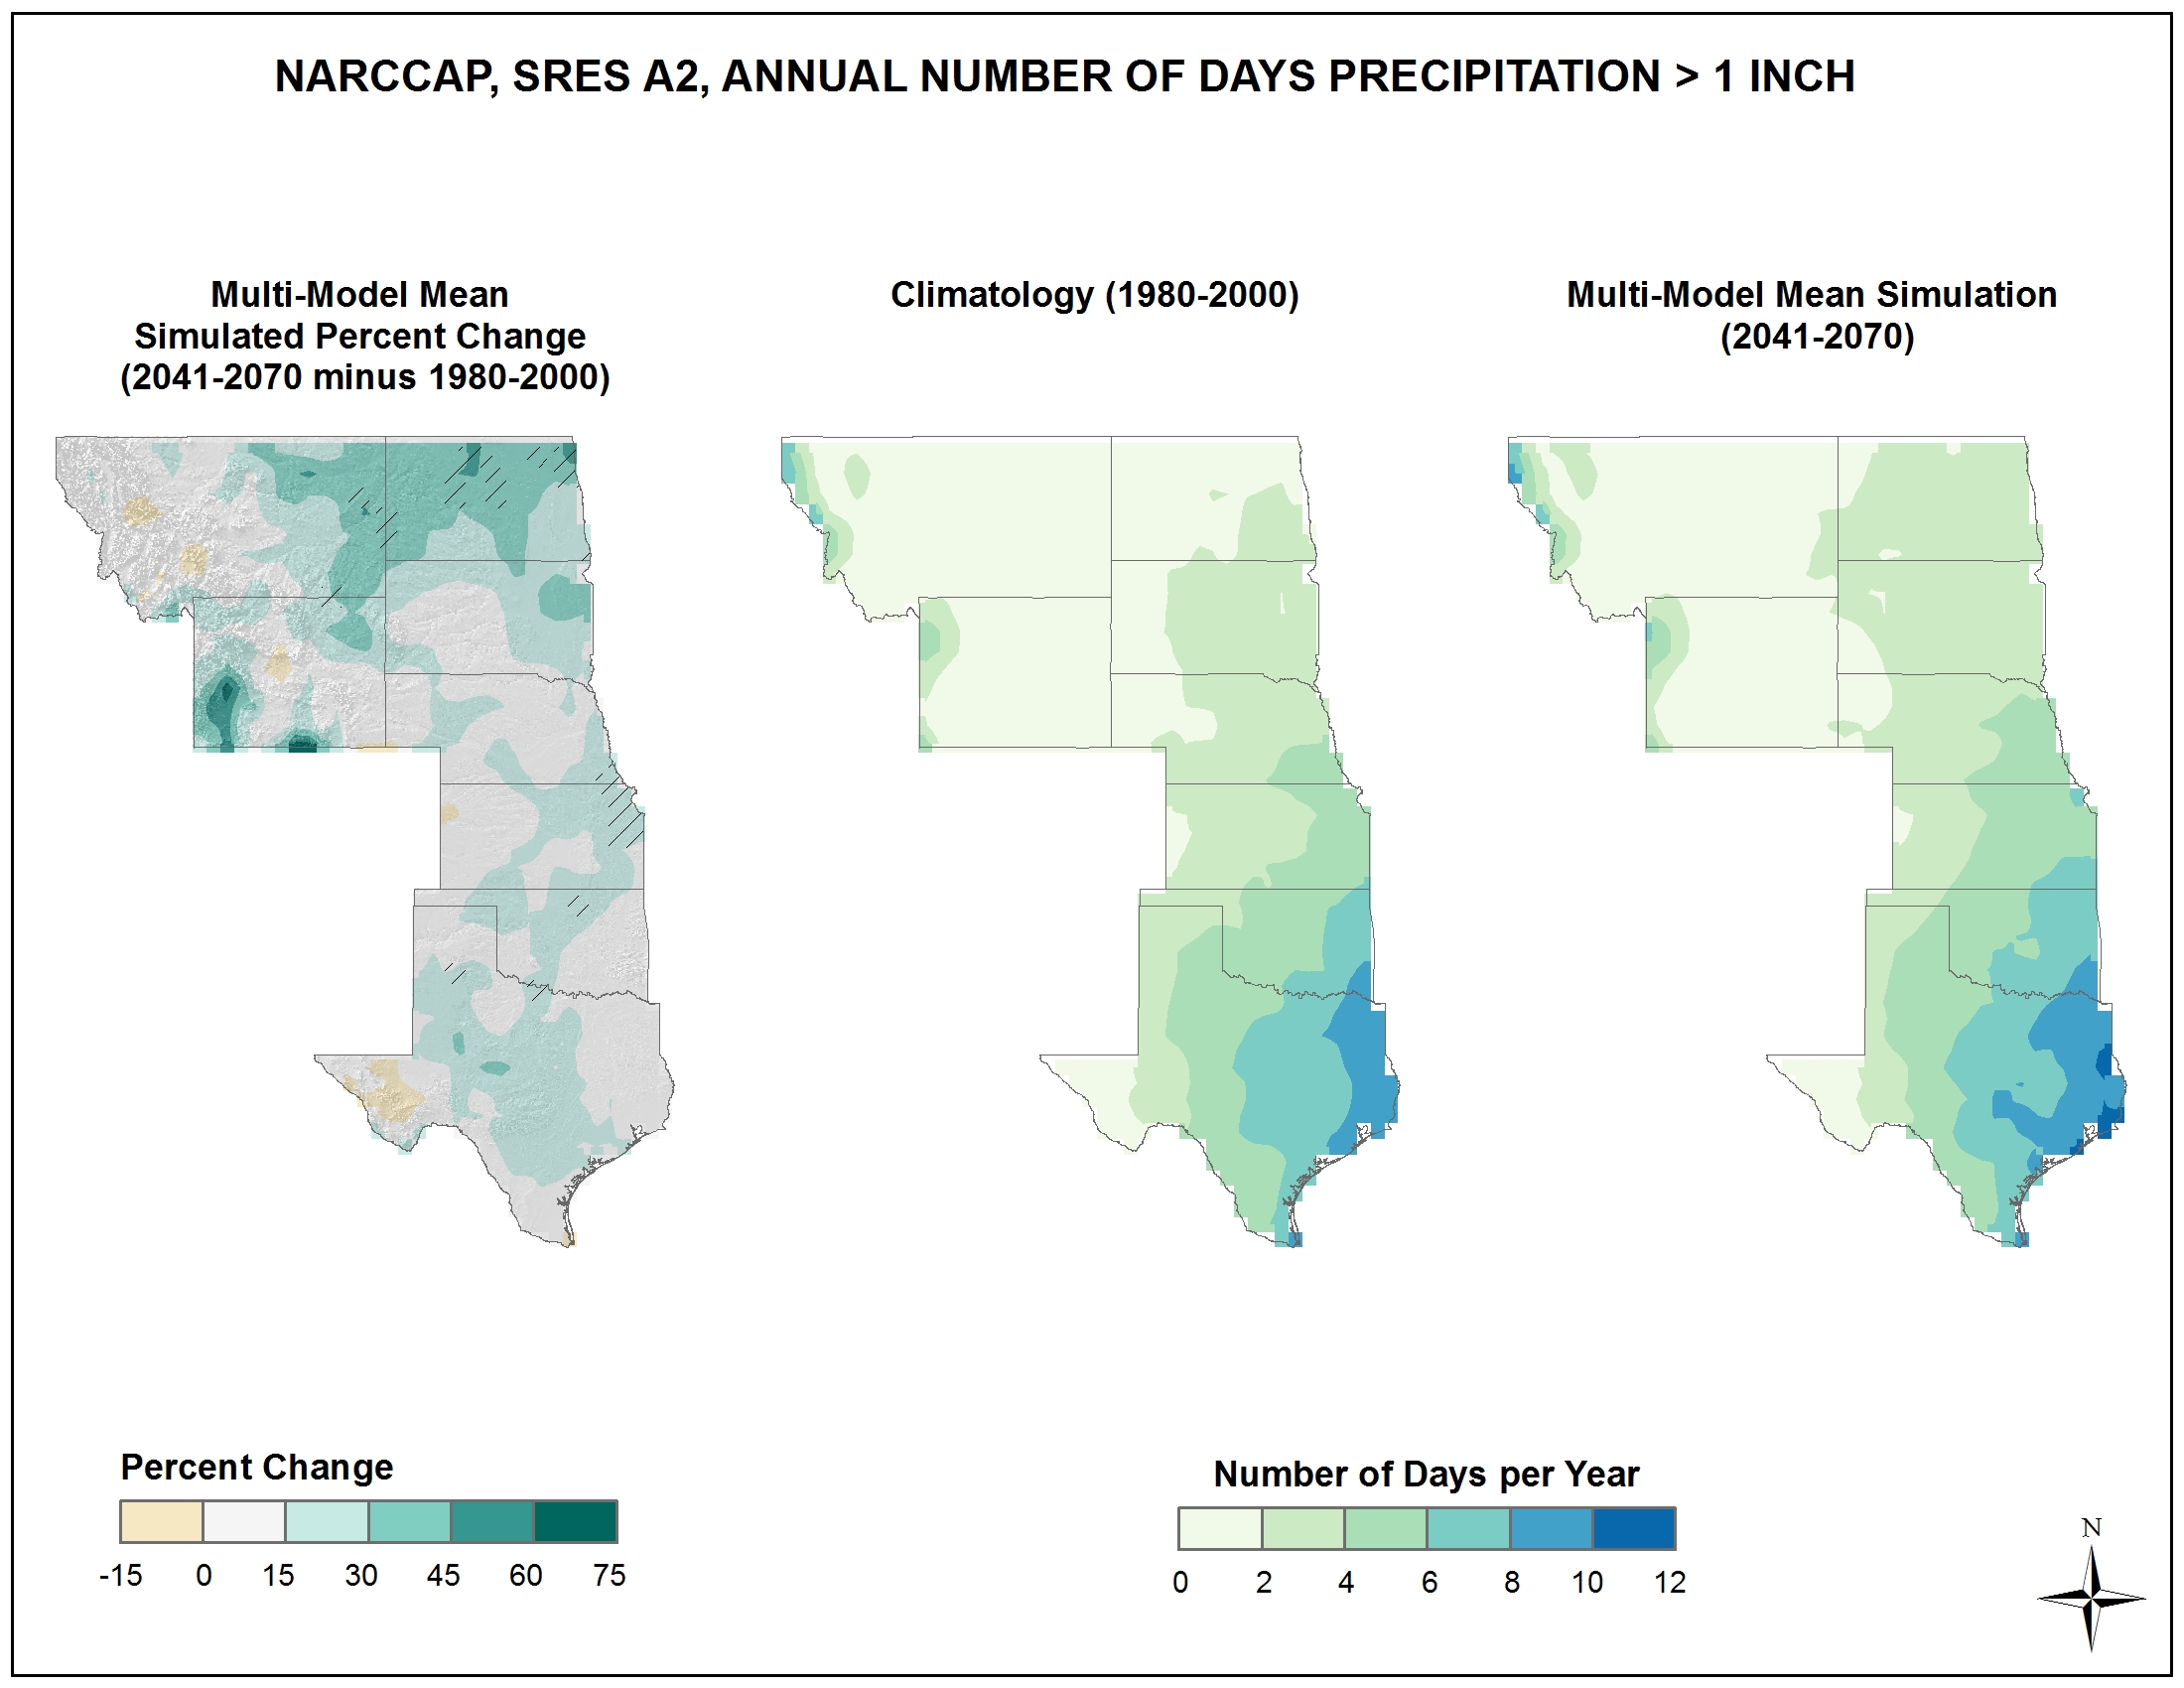
Simulated difference in the mean annual number of days with precipitation of greater than one inch |
Simulated |
Precipitation |
Great Plains |
Regional Climate Trends and Scenarios for the U.S. National Climate Assessment. Part 4. Climate of the U.S. Great Plains |
NCA 3 |
 |
|
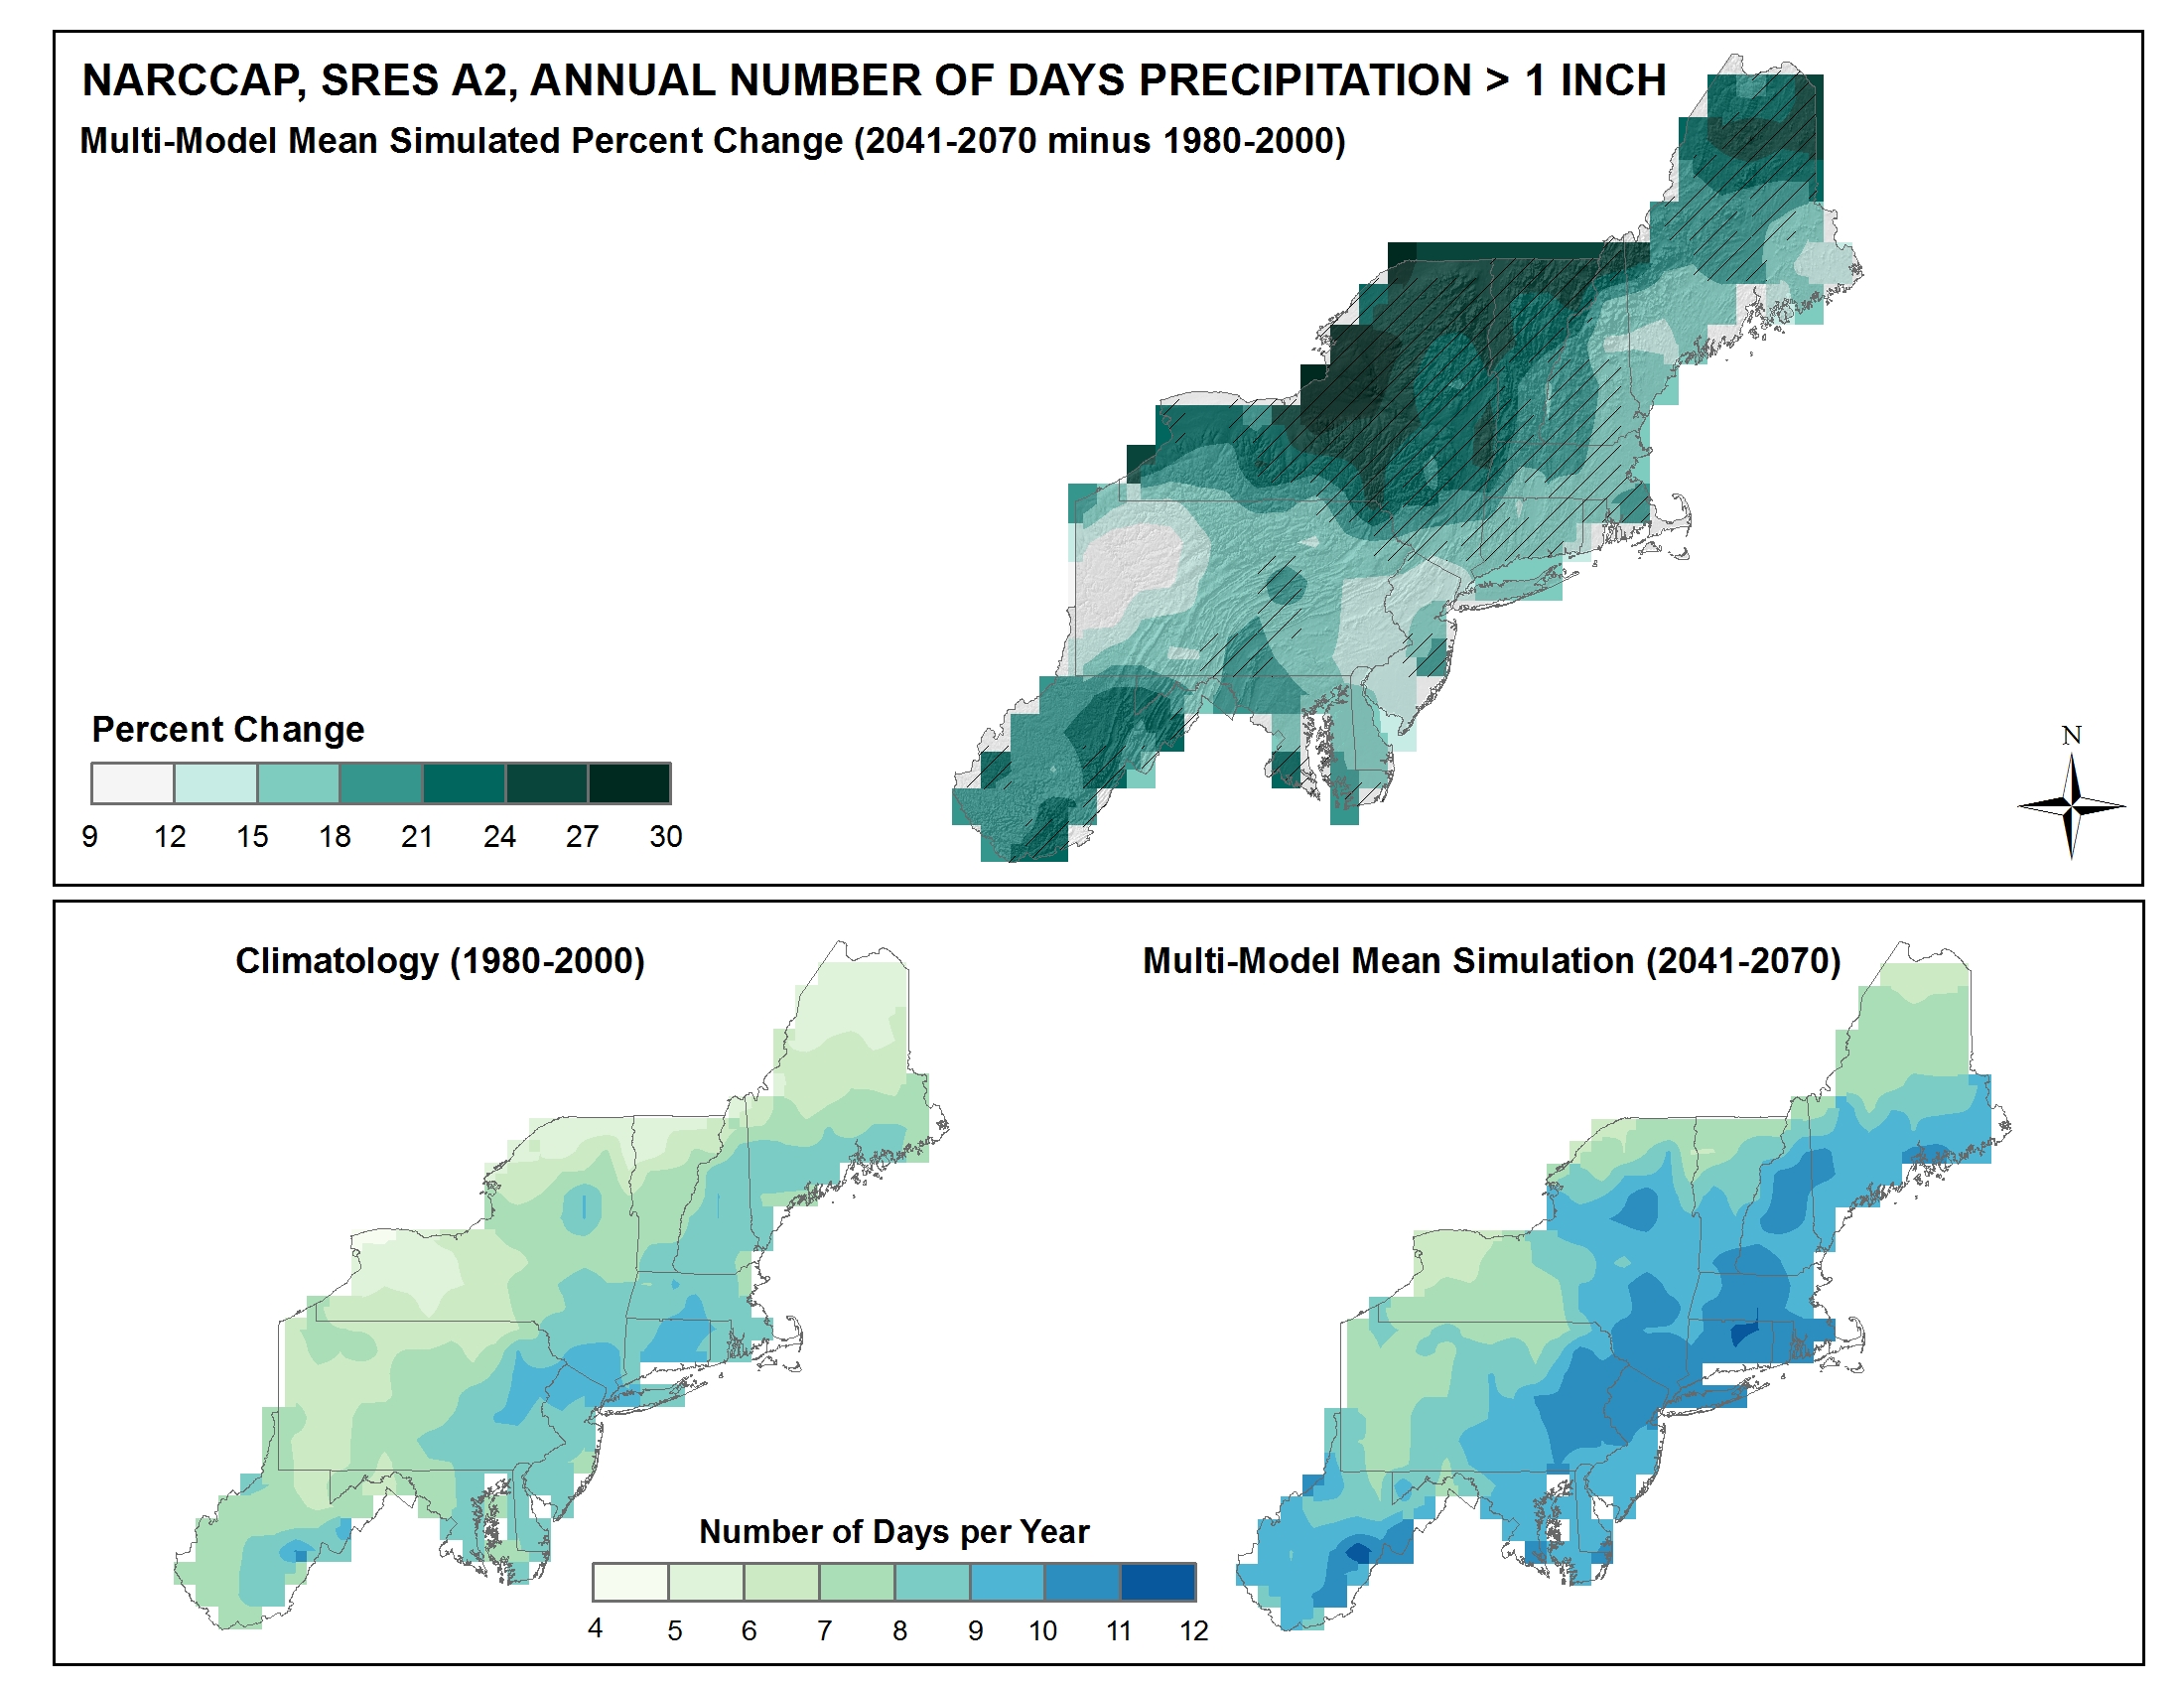
Simulated difference in the mean annual number of days with precipitation of greater than one inch |
Simulated |
Precipitation |
Northeast |
Regional Climate Trends and Scenarios for the U.S. National Climate Assessment. Part 1. Climate of the Northeast U.S. |
NCA 3 |
 |
|
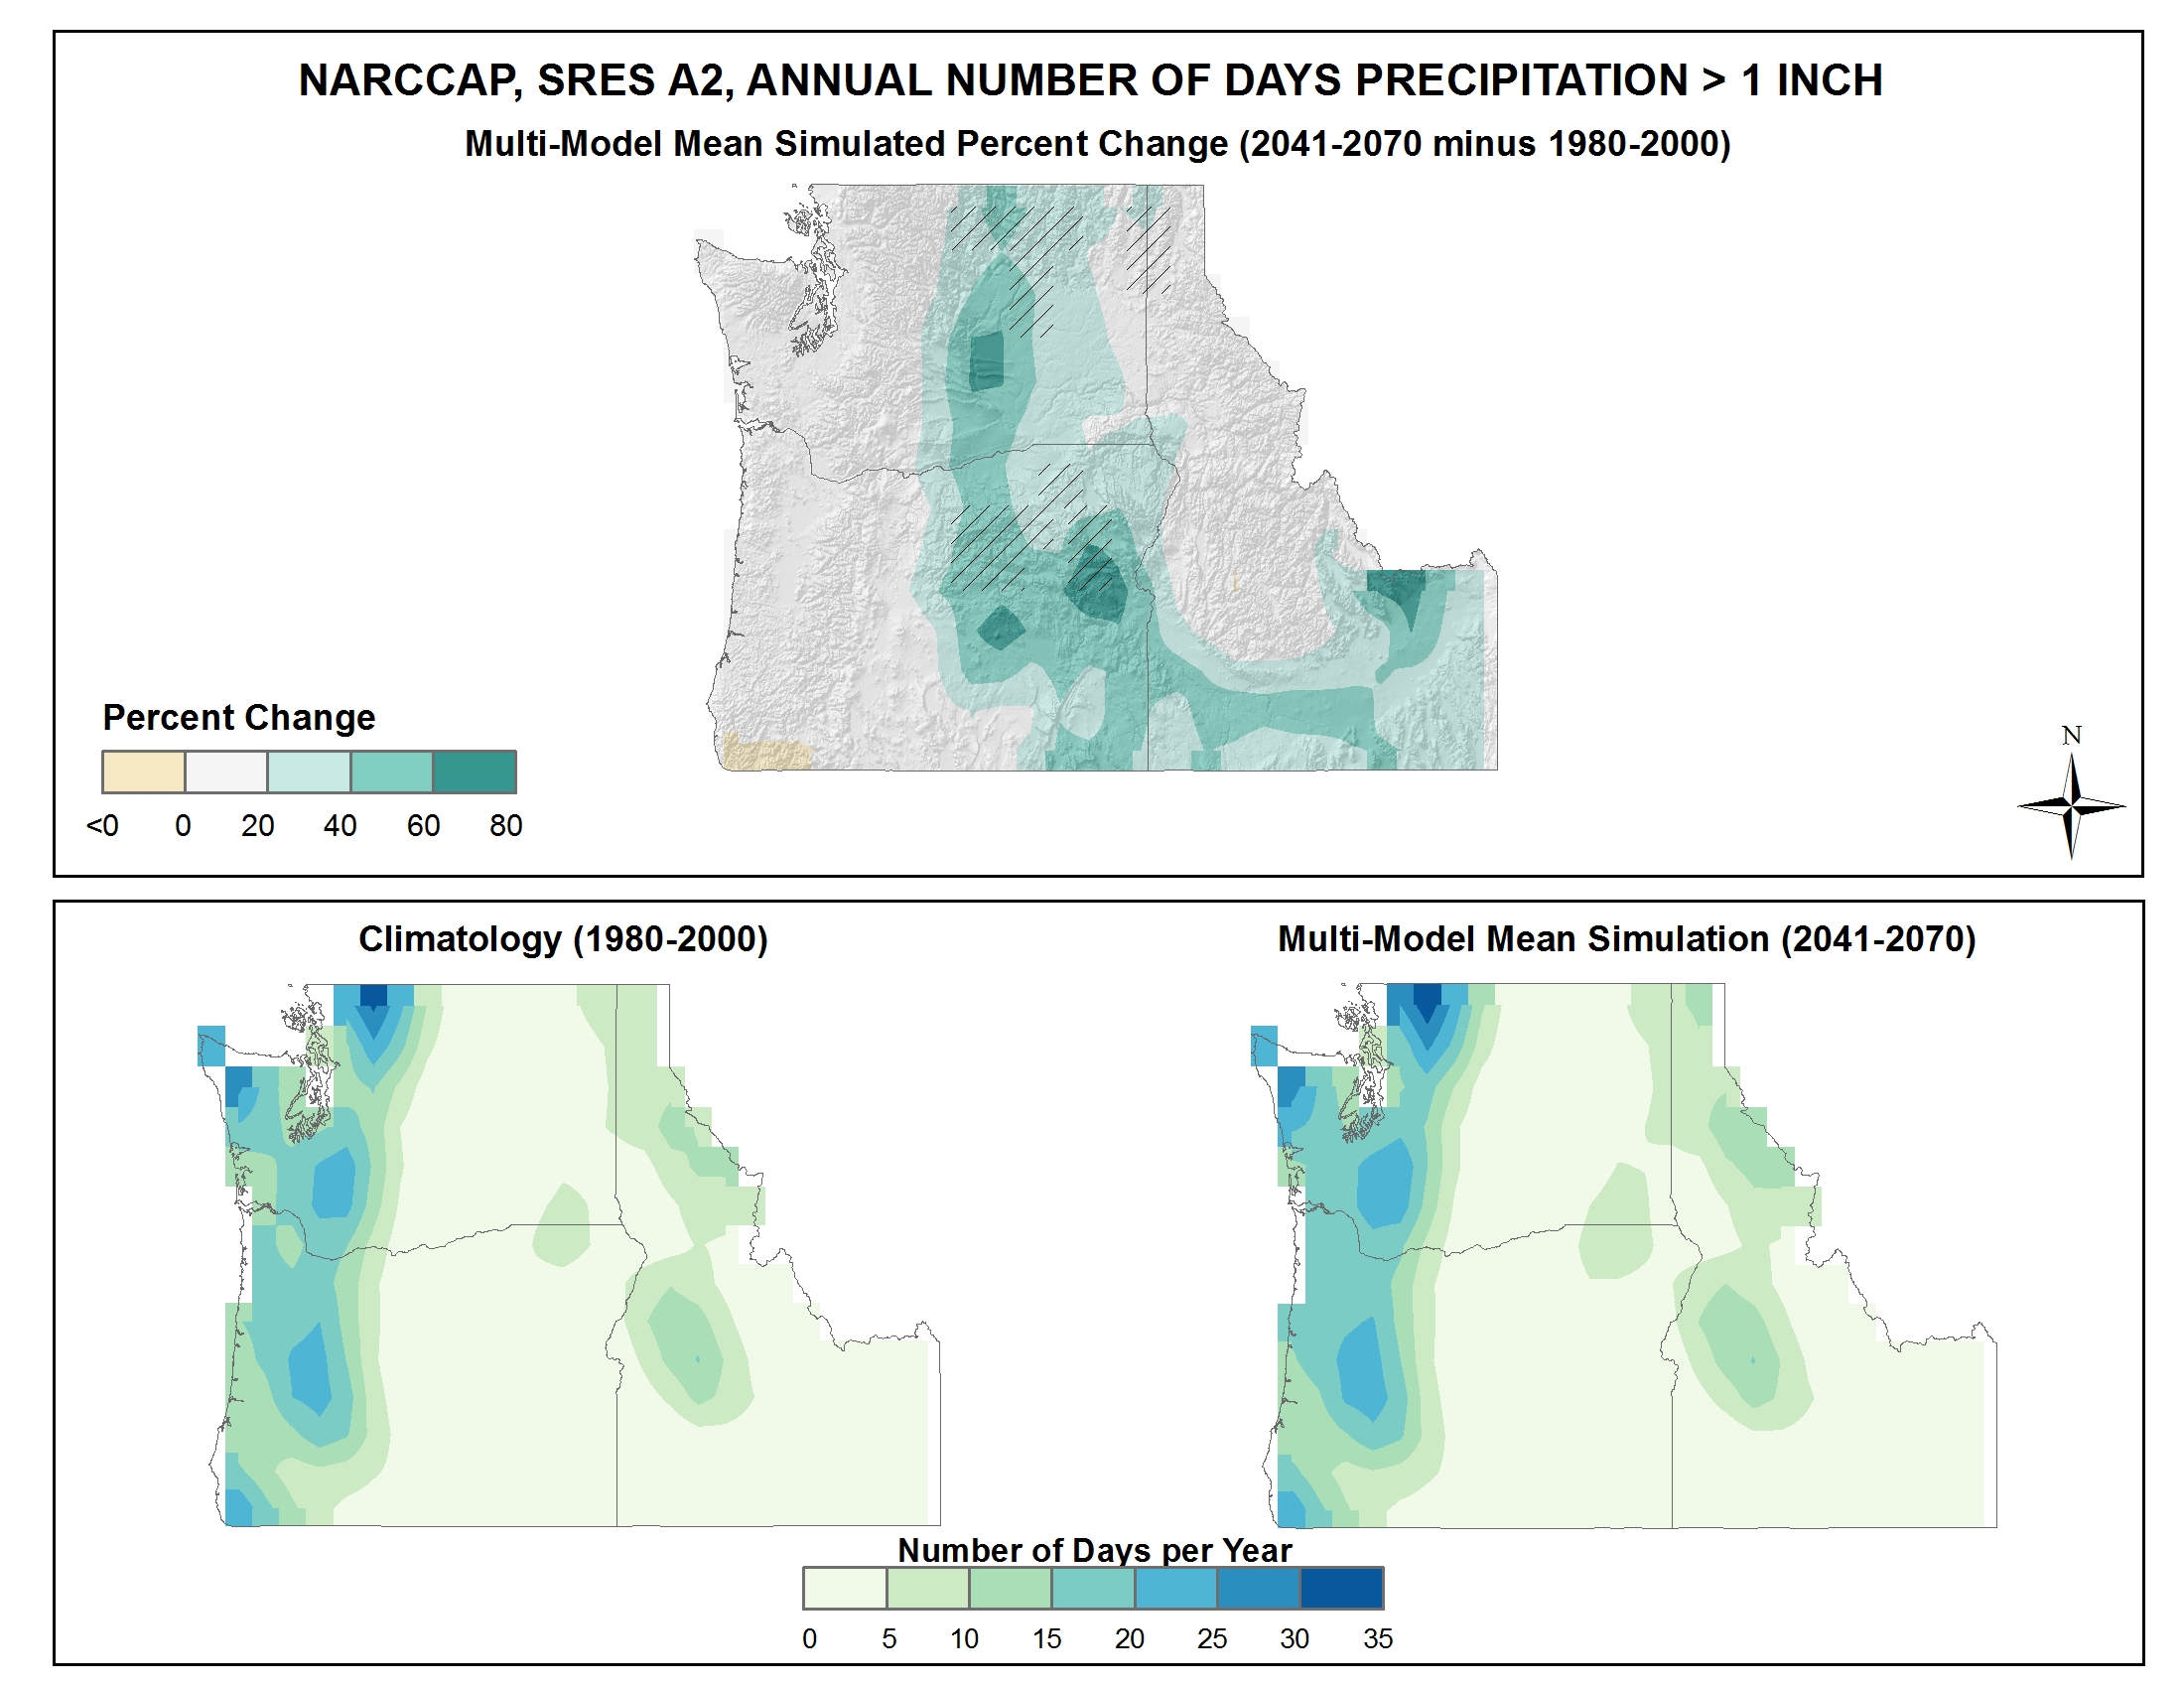
Simulated difference in the mean annual number of days with precipitation of greater than one inch |
Simulated |
Precipitation |
Northwest |
Regional Climate Trends and Scenarios for the U.S. National Climate Assessment. Part 6. Climate of the Northwest U.S. |
NCA 3 |
 |
|
Simulated difference in the mean annual number of days with precipitation of greater than 0.1 inches |
Simulated |
Precipitation |
Northwest |
Regional Climate Trends and Scenarios for the U.S. National Climate Assessment. Part 6. Climate of the Northwest U.S. |
NCA 3 |
 |
|
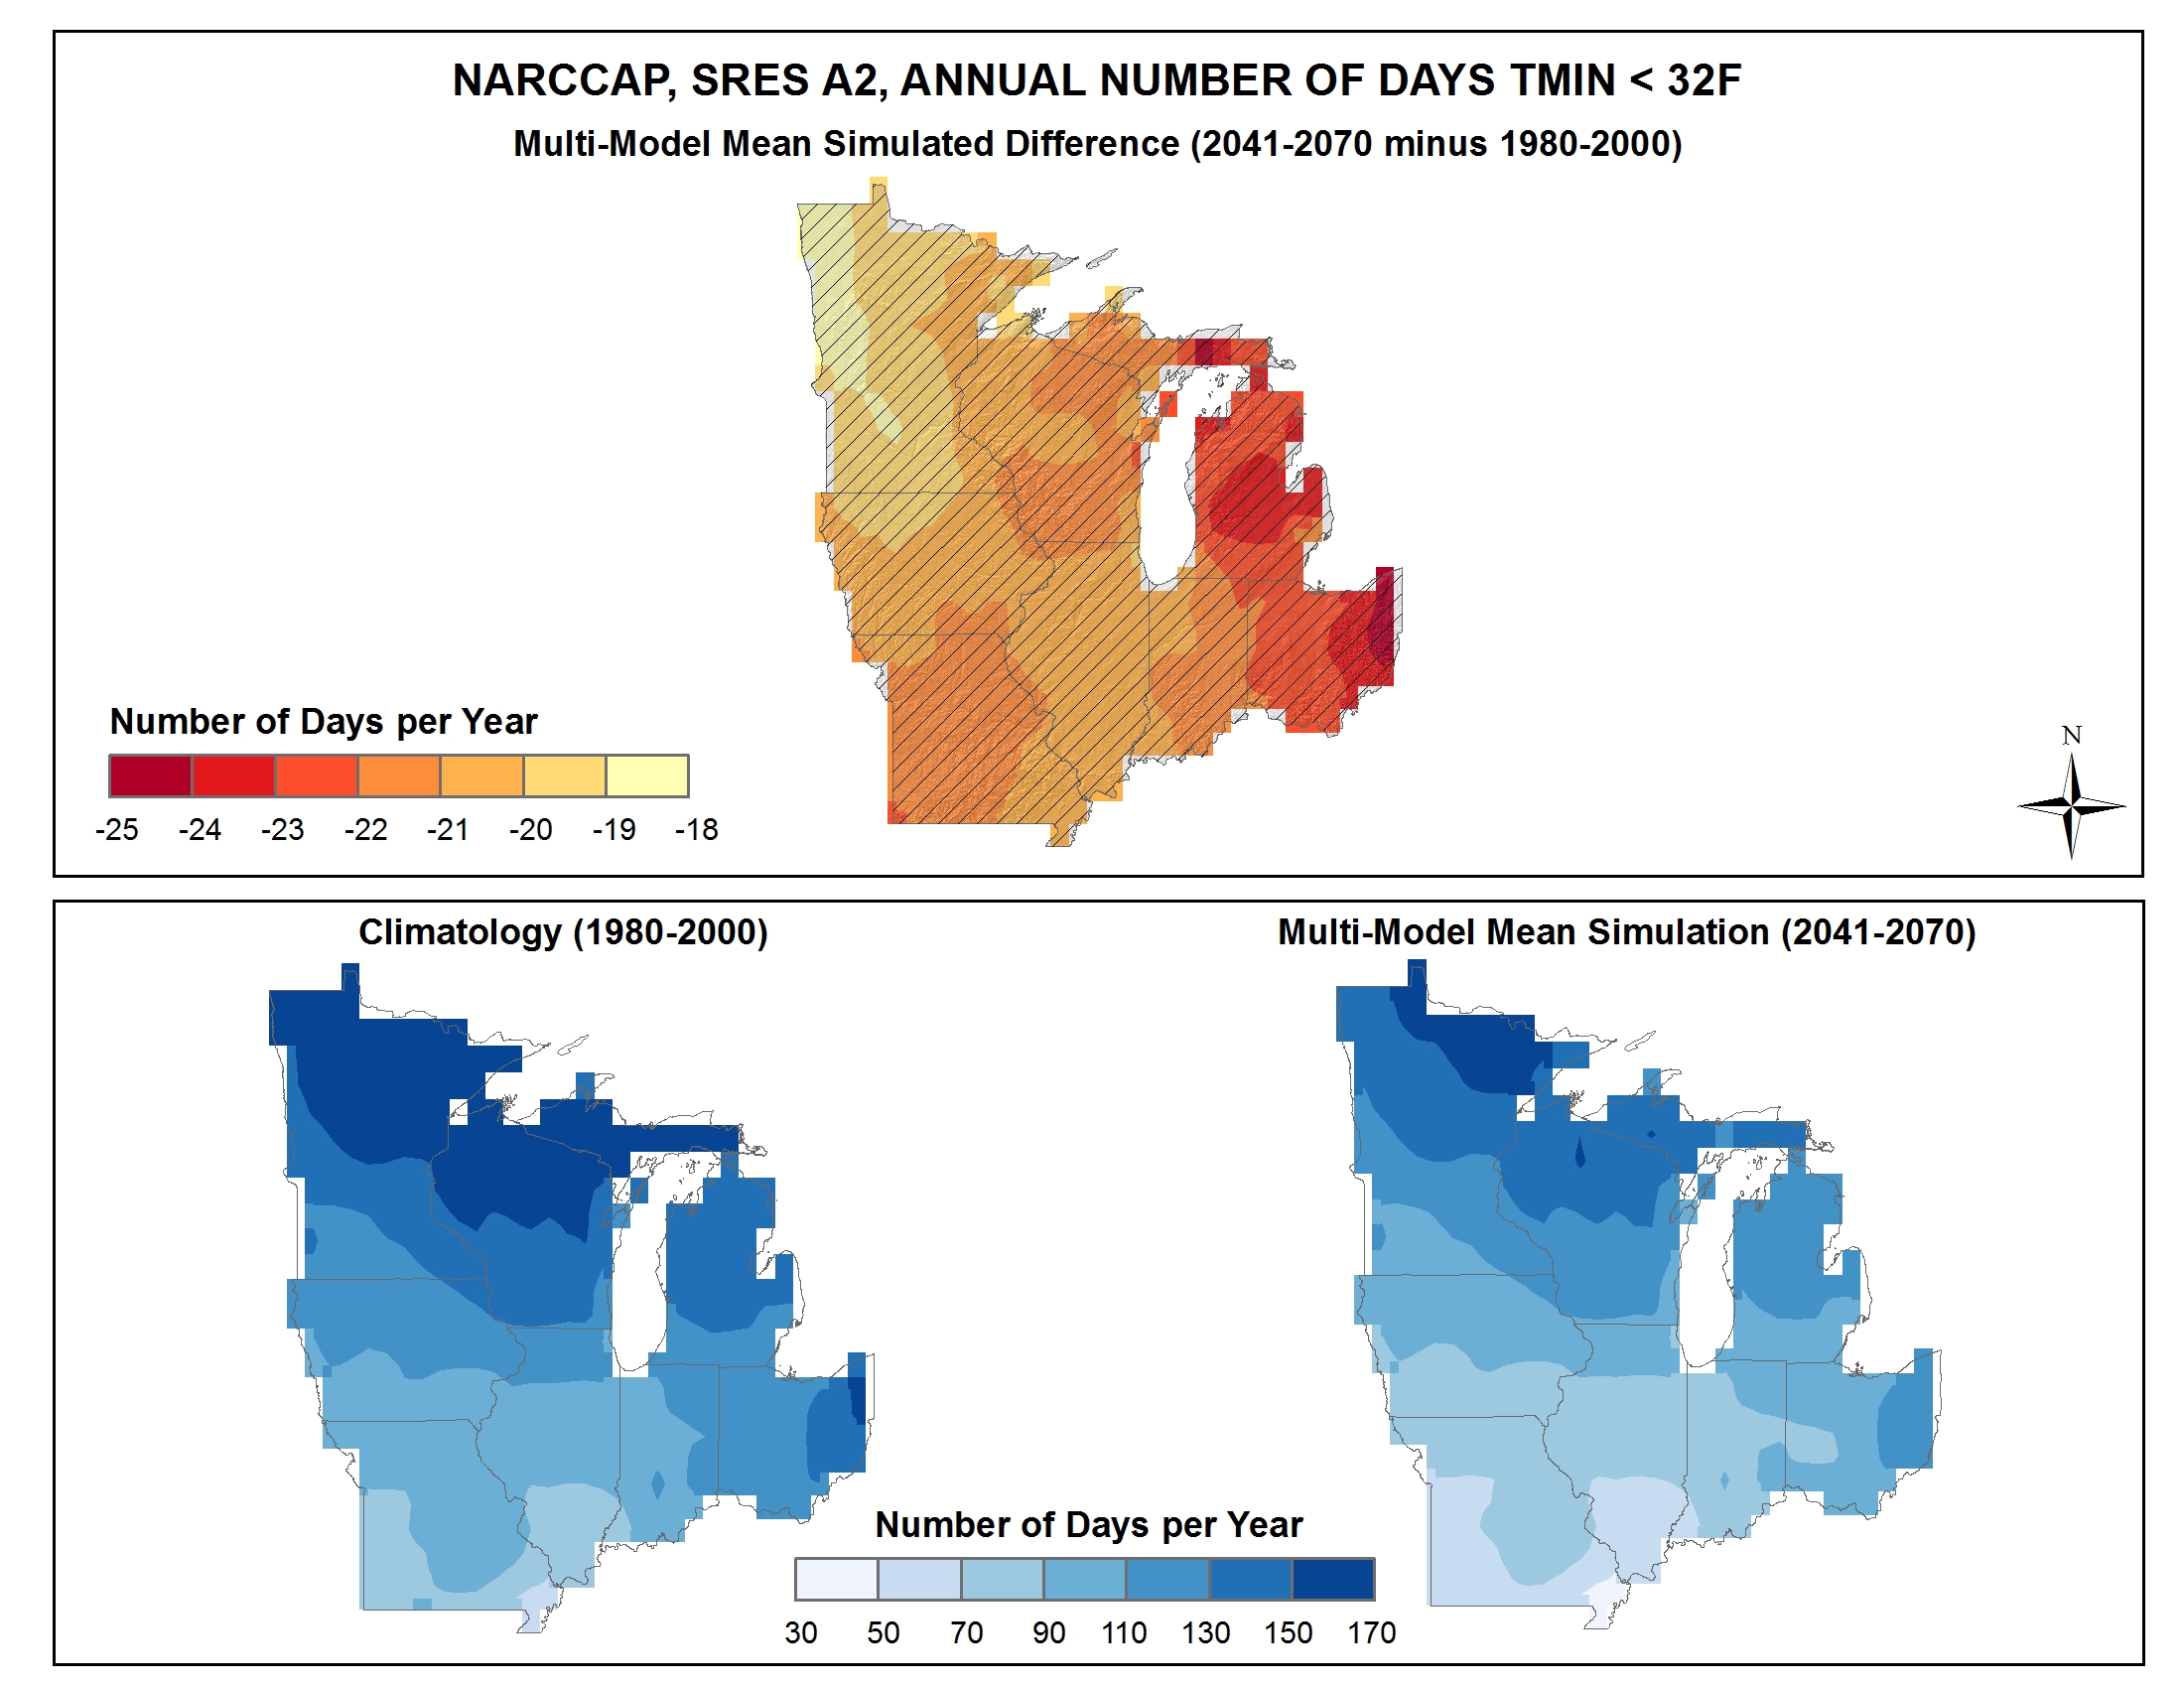
Simulated difference in the mean annual number of days with a minimum temperature less than 32F |
Simulated |
Temperature |
Midwest |
Regional Climate Trends and Scenarios for the U.S. National Climate Assessment. Part 3. Climate of the Midwest U.S. |
NCA 3 |
 |
|
Simulated difference in the mean annual number of days with a minimum temperature less than 32F |
Simulated |
Temperature |
Southeast and Caribbean |
Regional Climate Trends and Scenarios for the U.S. National Climate Assessment. Part 2. Climate of the Southeast U.S. |
NCA 3 |
 |
|
Simulated difference in the mean annual number of days with a minimum temperature less than 32F |
Simulated |
Temperature |
National |
Regional Climate Trends and Scenarios for the U.S. National Climate Assessment. Part 9. Climate of the Contiguous United States |
NCA 3 |
 |
|
Simulated difference in the mean annual number of days with a minimum temperature less than 32F |
Simulated |
Temperature |
Great Plains |
Regional Climate Trends and Scenarios for the U.S. National Climate Assessment. Part 4. Climate of the U.S. Great Plains |
NCA 3 |
 |
|
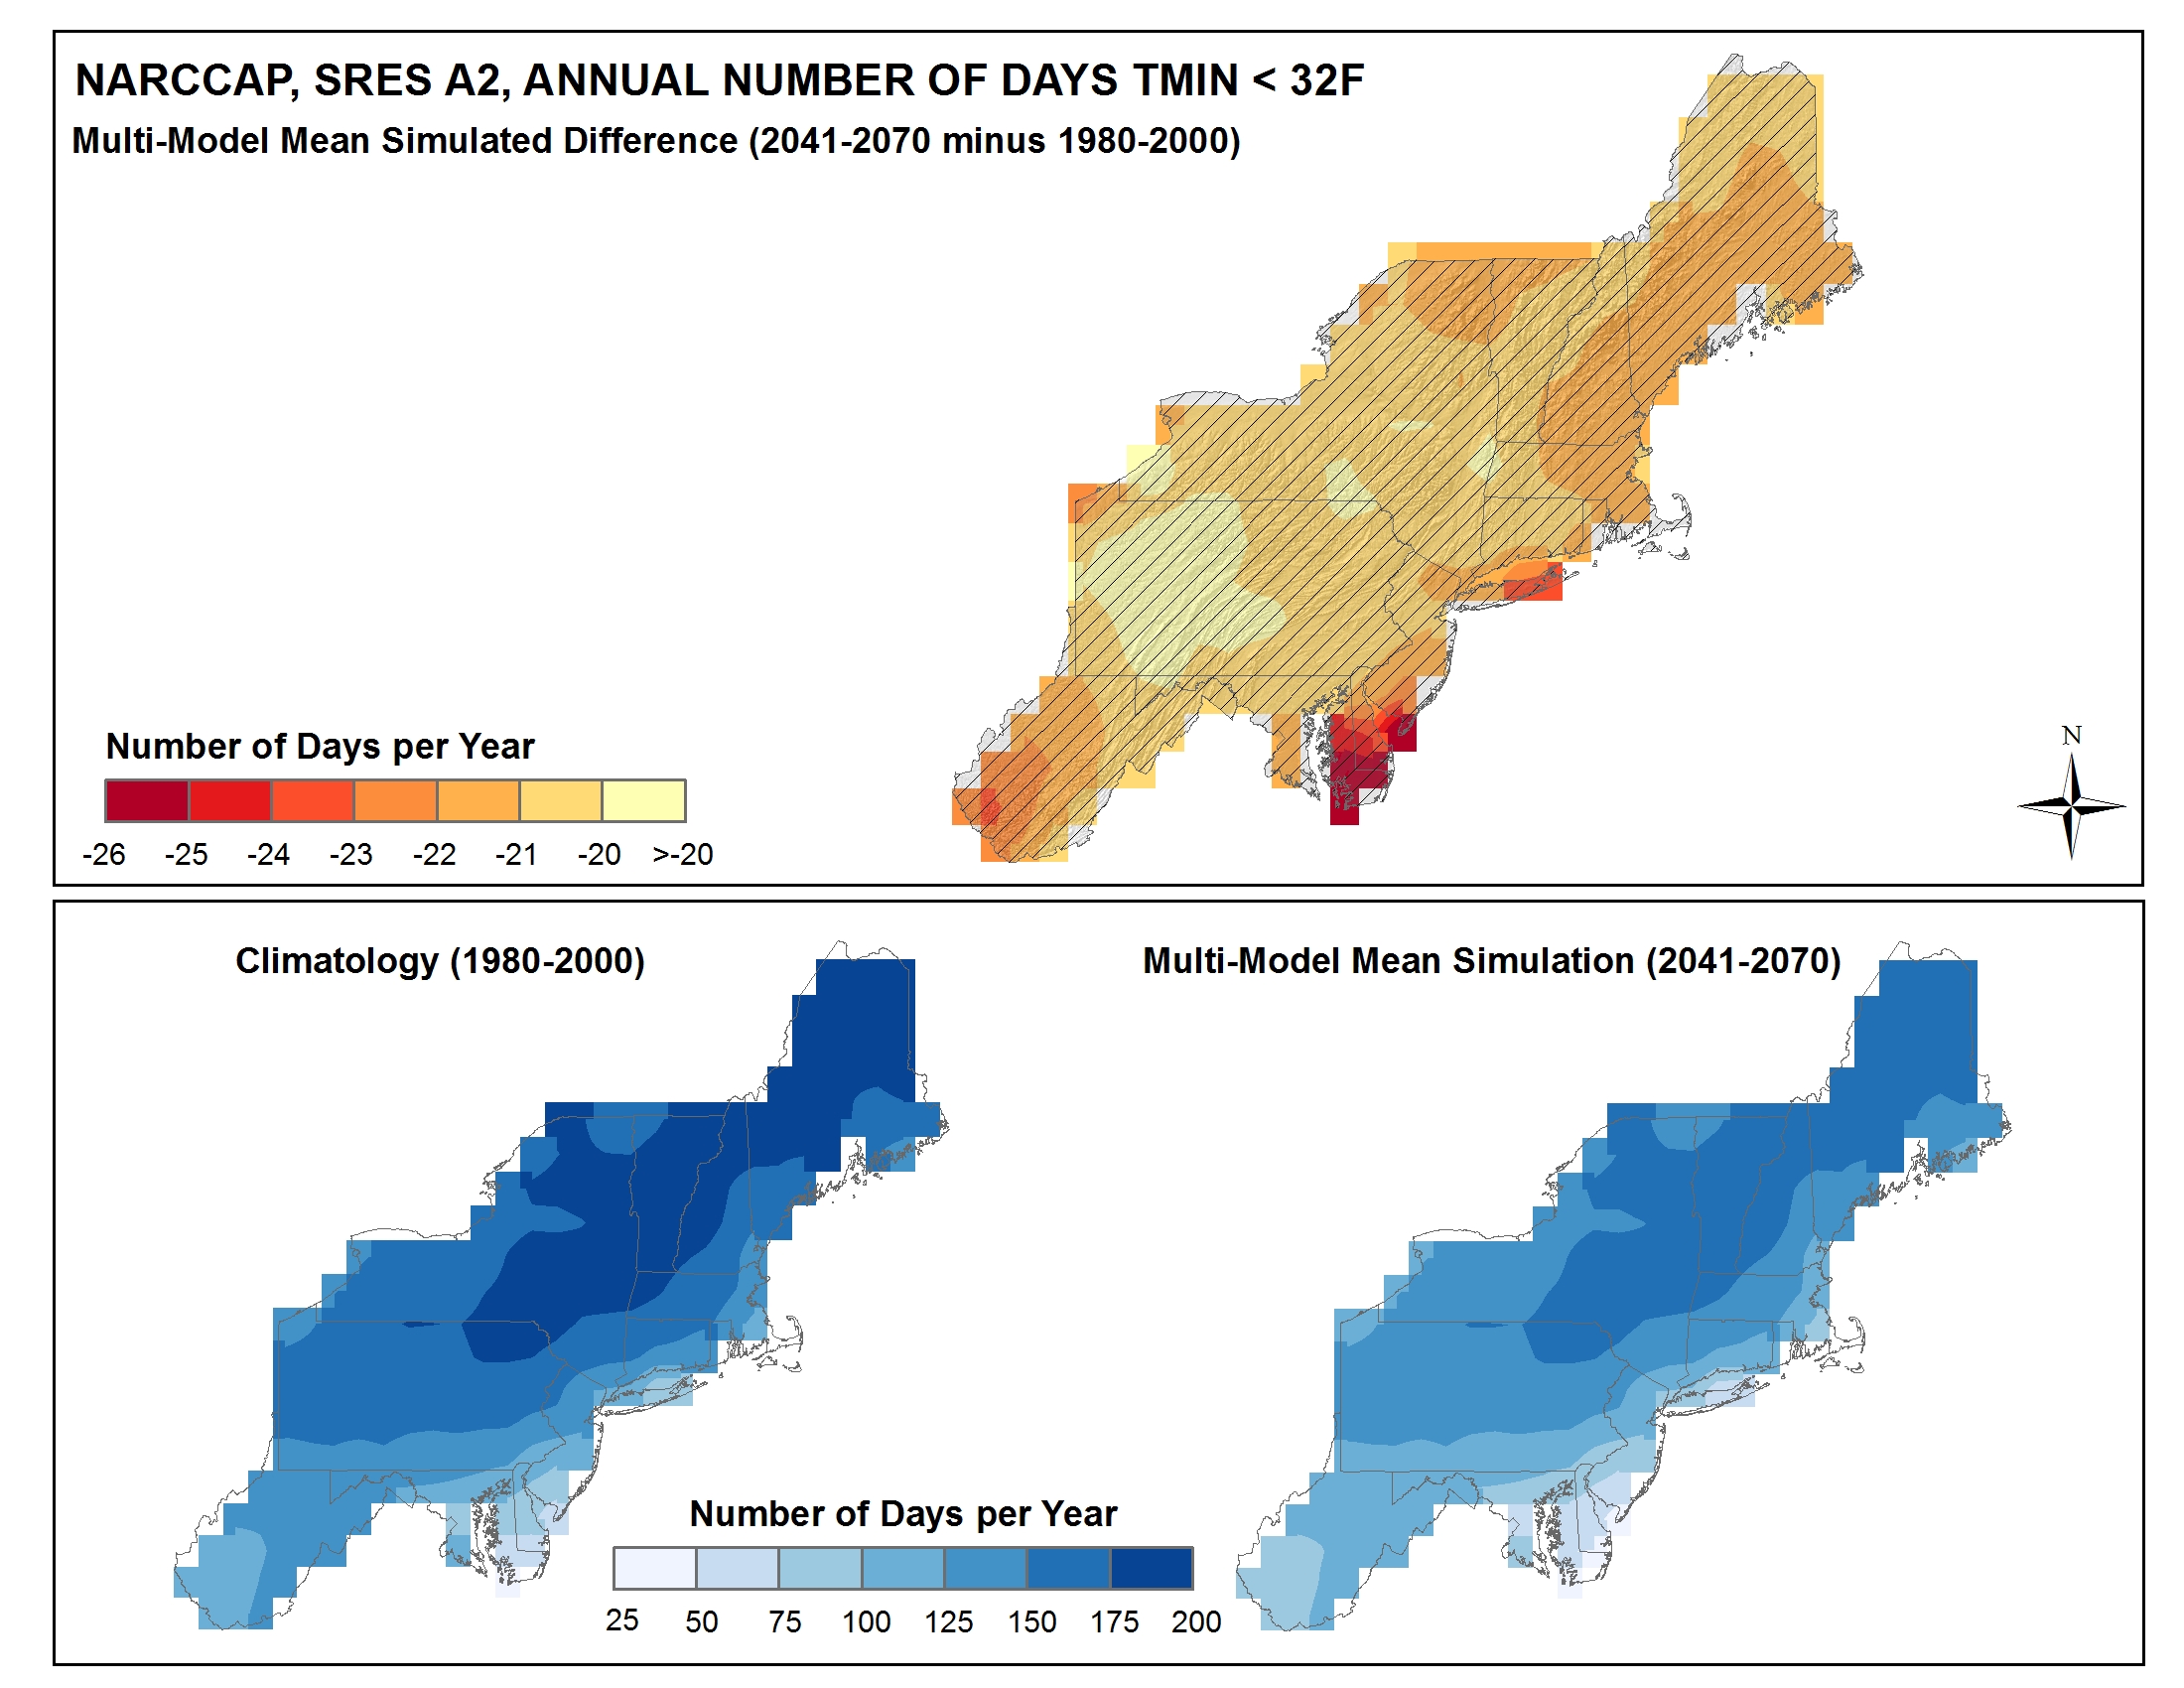
Simulated difference in the mean annual number of days with a minimum temperature less than 32F |
Simulated |
Temperature |
Northeast |
Regional Climate Trends and Scenarios for the U.S. National Climate Assessment. Part 1. Climate of the Northeast U.S. |
NCA 3 |
 |
|
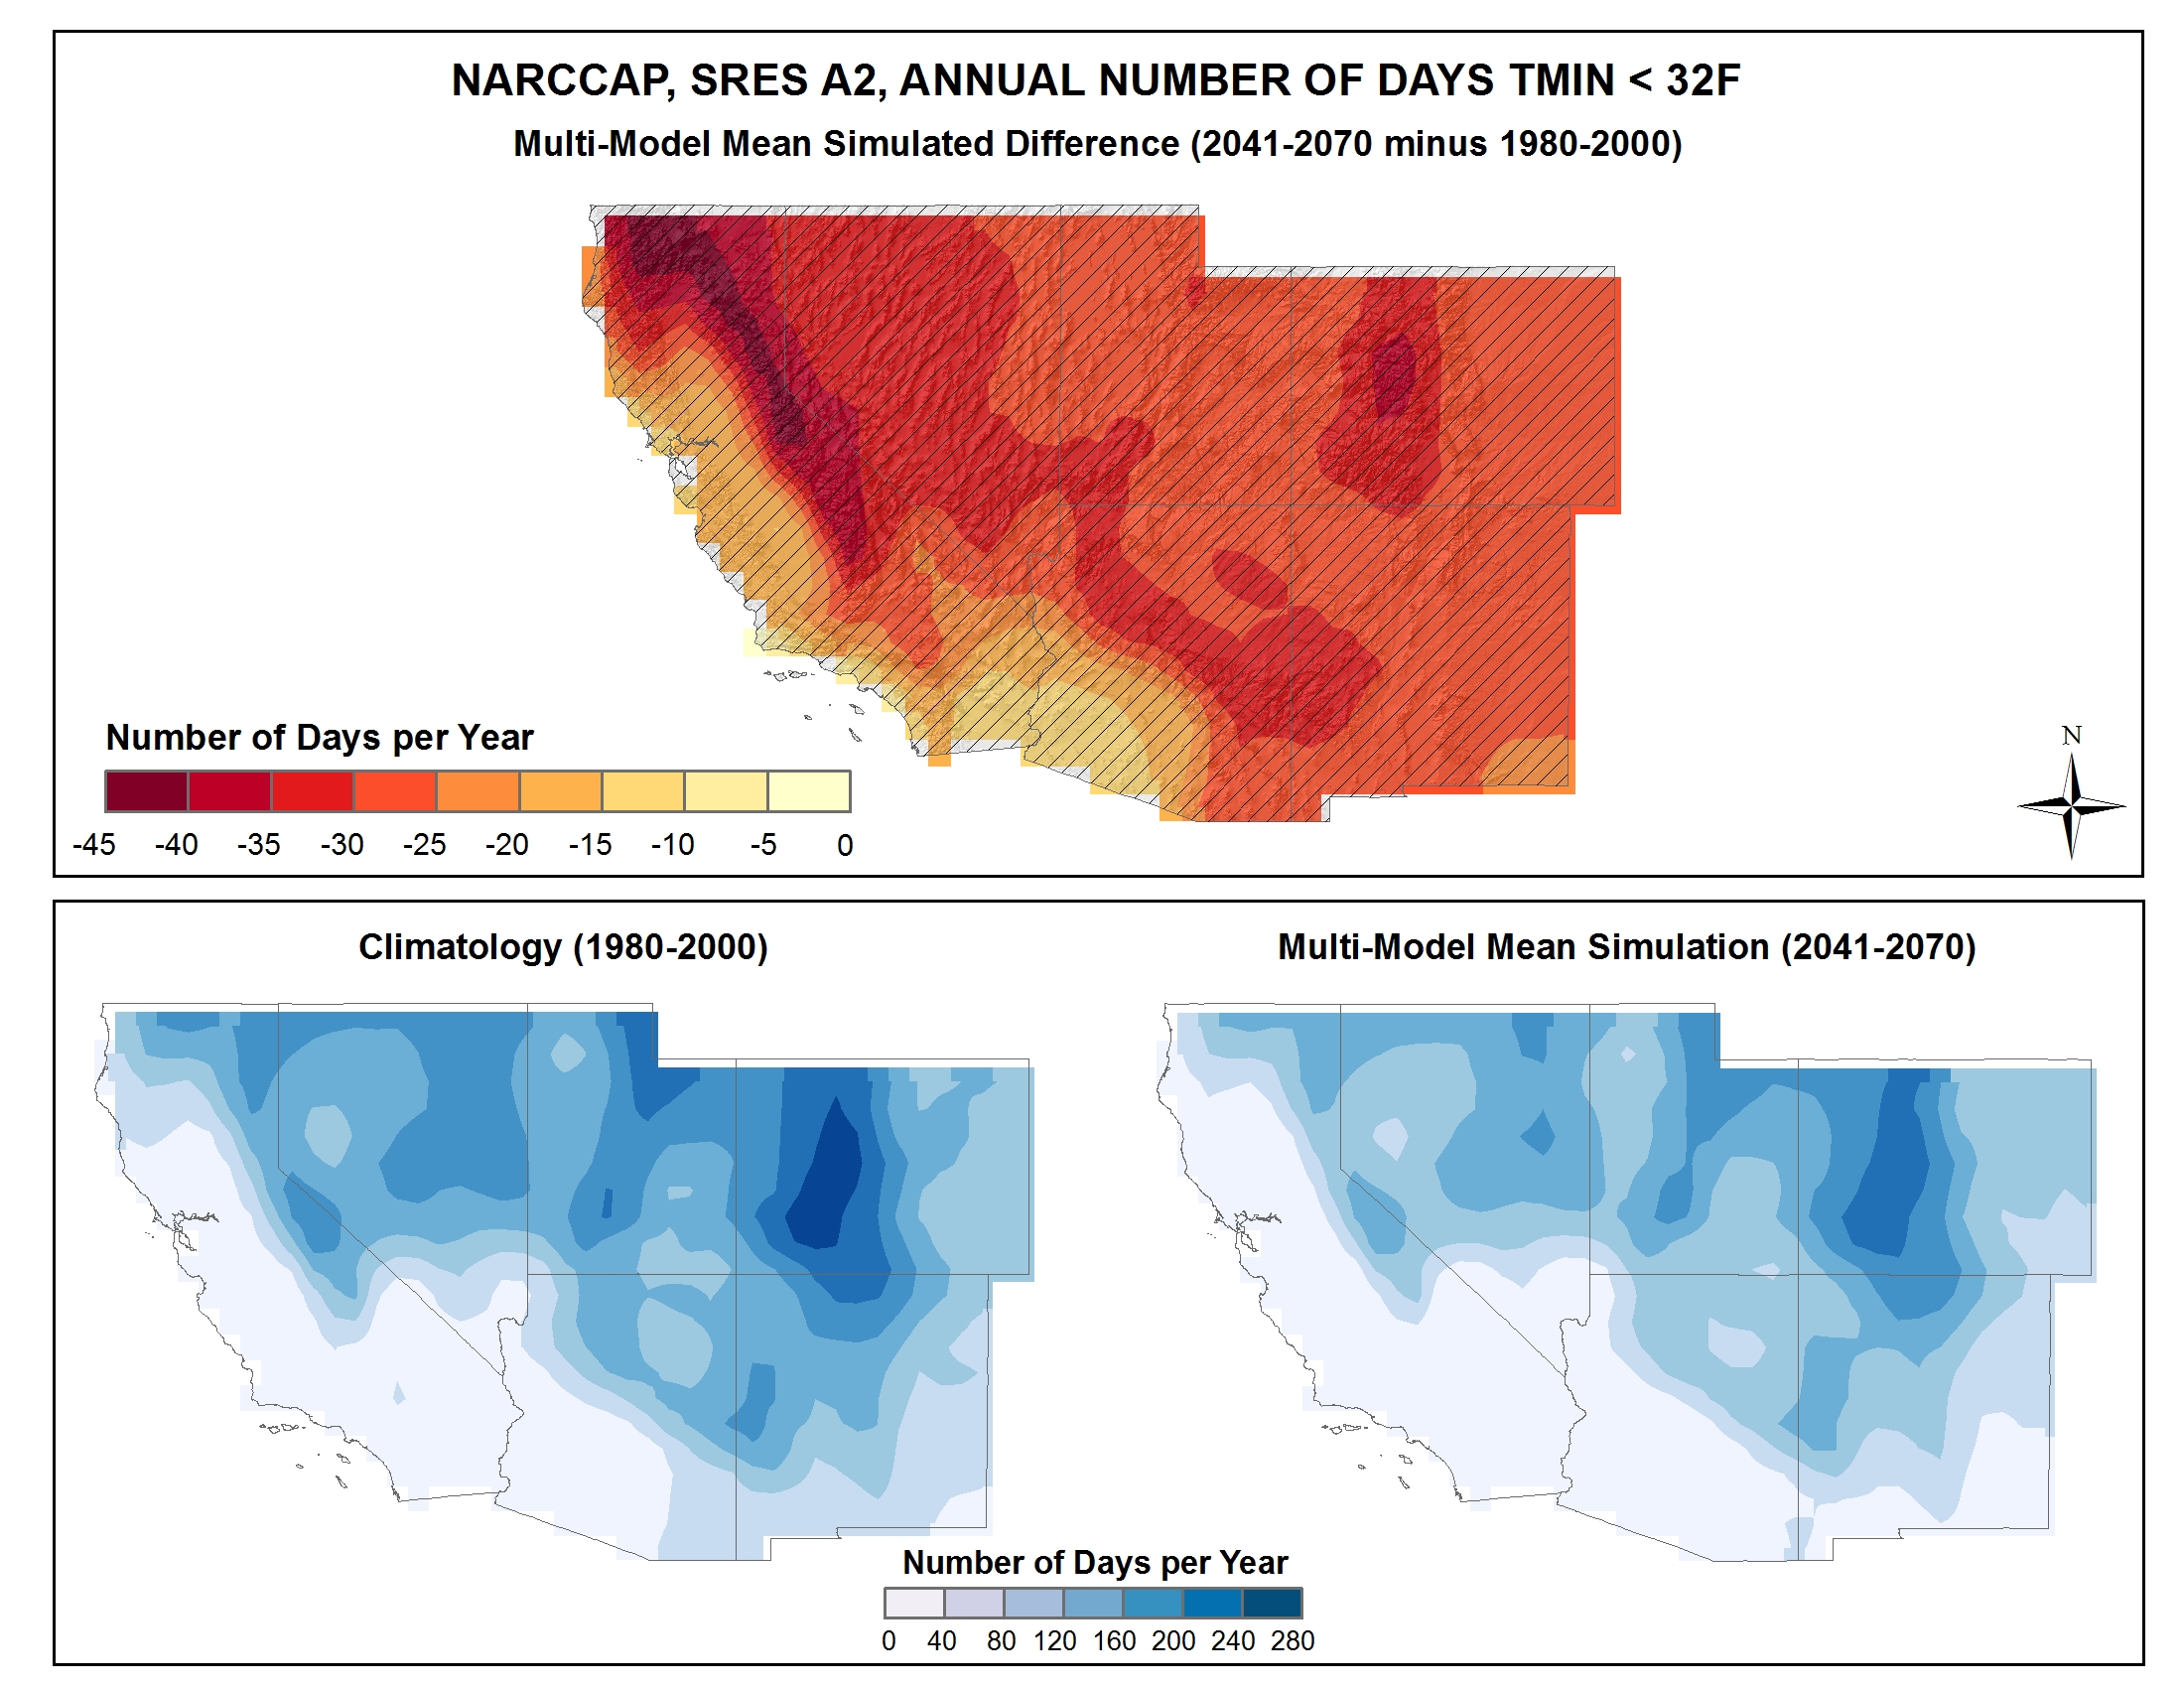
Simulated difference in the mean annual number of days with a minimum temperature less than 32F |
Simulated |
Temperature |
Southwest |
Regional Climate Trends and Scenarios for the U.S. National Climate Assessment. Part 5. Climate of the Southwest U.S. |
NCA 3 |
 |
|
Simulated difference in the mean annual number of days with a minimum temperature less than 32F |
Simulated |
Temperature |
Northwest |
Regional Climate Trends and Scenarios for the U.S. National Climate Assessment. Part 6. Climate of the Northwest U.S. |
NCA 3 |
 |
|
Simulated difference in the mean annual number of days with a minimum temperature less than 10F |
Simulated |
Temperature |
Midwest |
Regional Climate Trends and Scenarios for the U.S. National Climate Assessment. Part 3. Climate of the Midwest U.S. |
NCA 3 |
 |
|
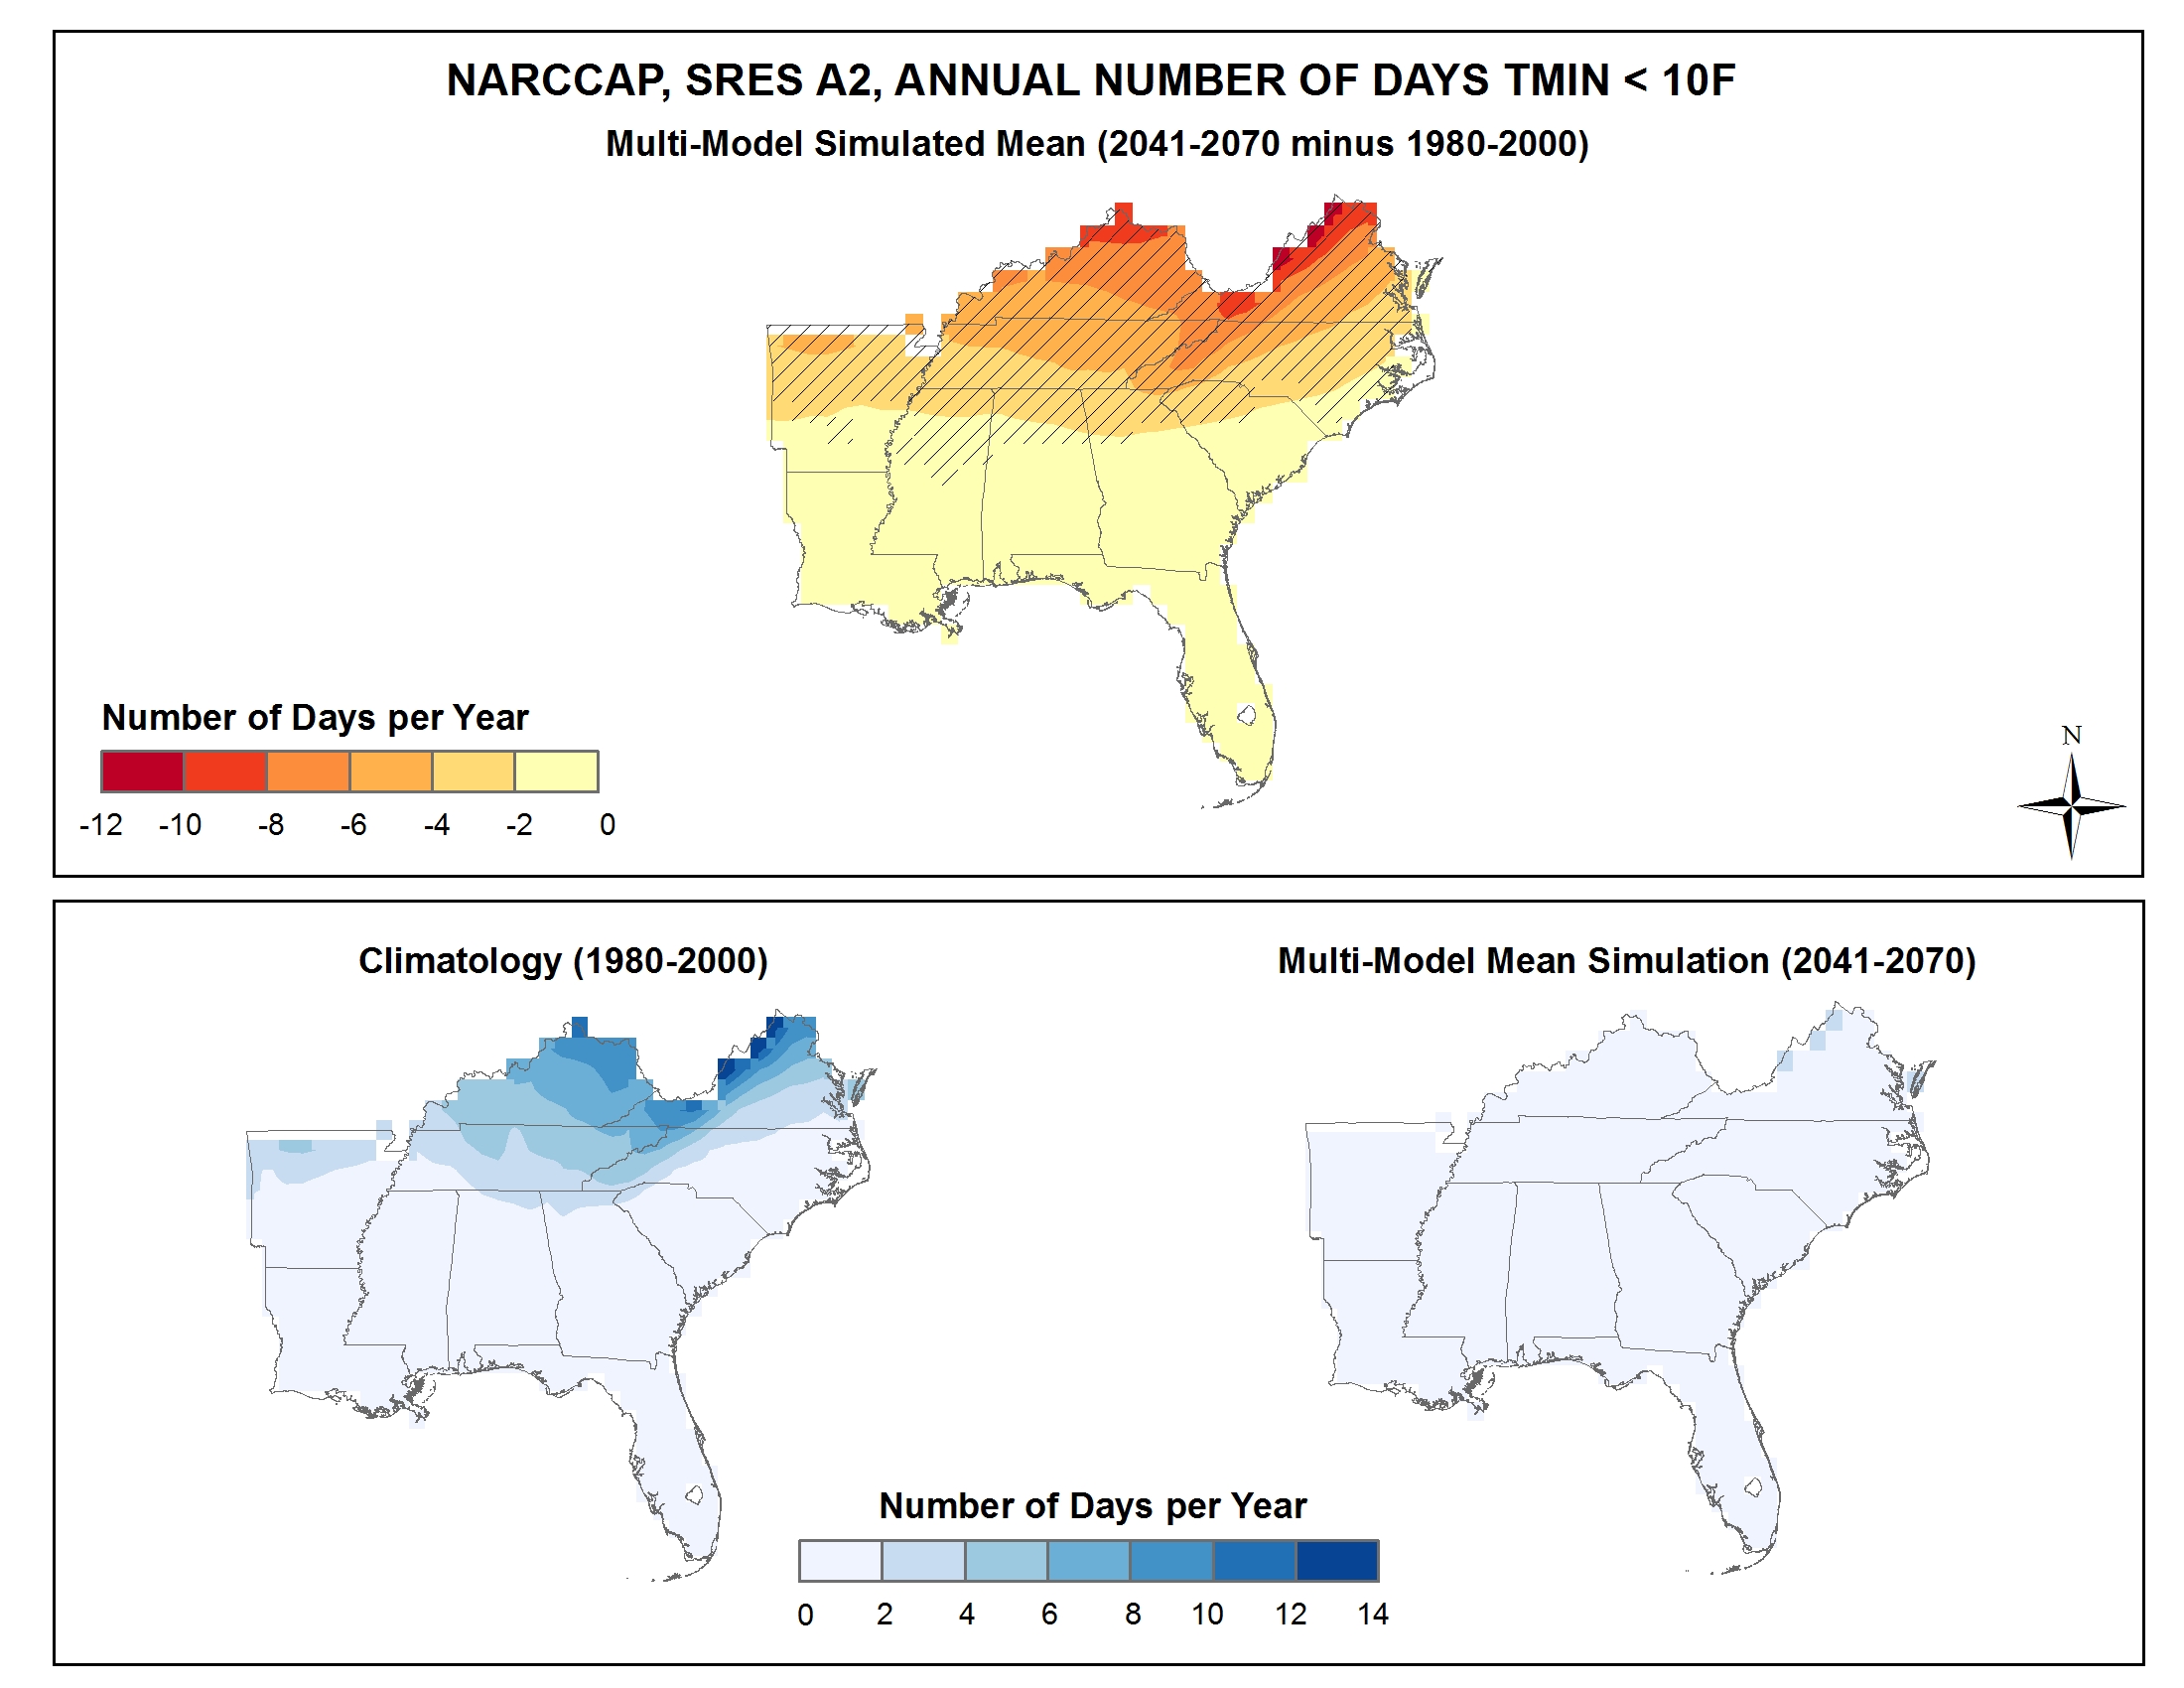
Simulated difference in the mean annual number of days with a minimum temperature less than 10F |
Simulated |
Temperature |
Southeast and Caribbean |
Regional Climate Trends and Scenarios for the U.S. National Climate Assessment. Part 2. Climate of the Southeast U.S. |
NCA 3 |
 |
|
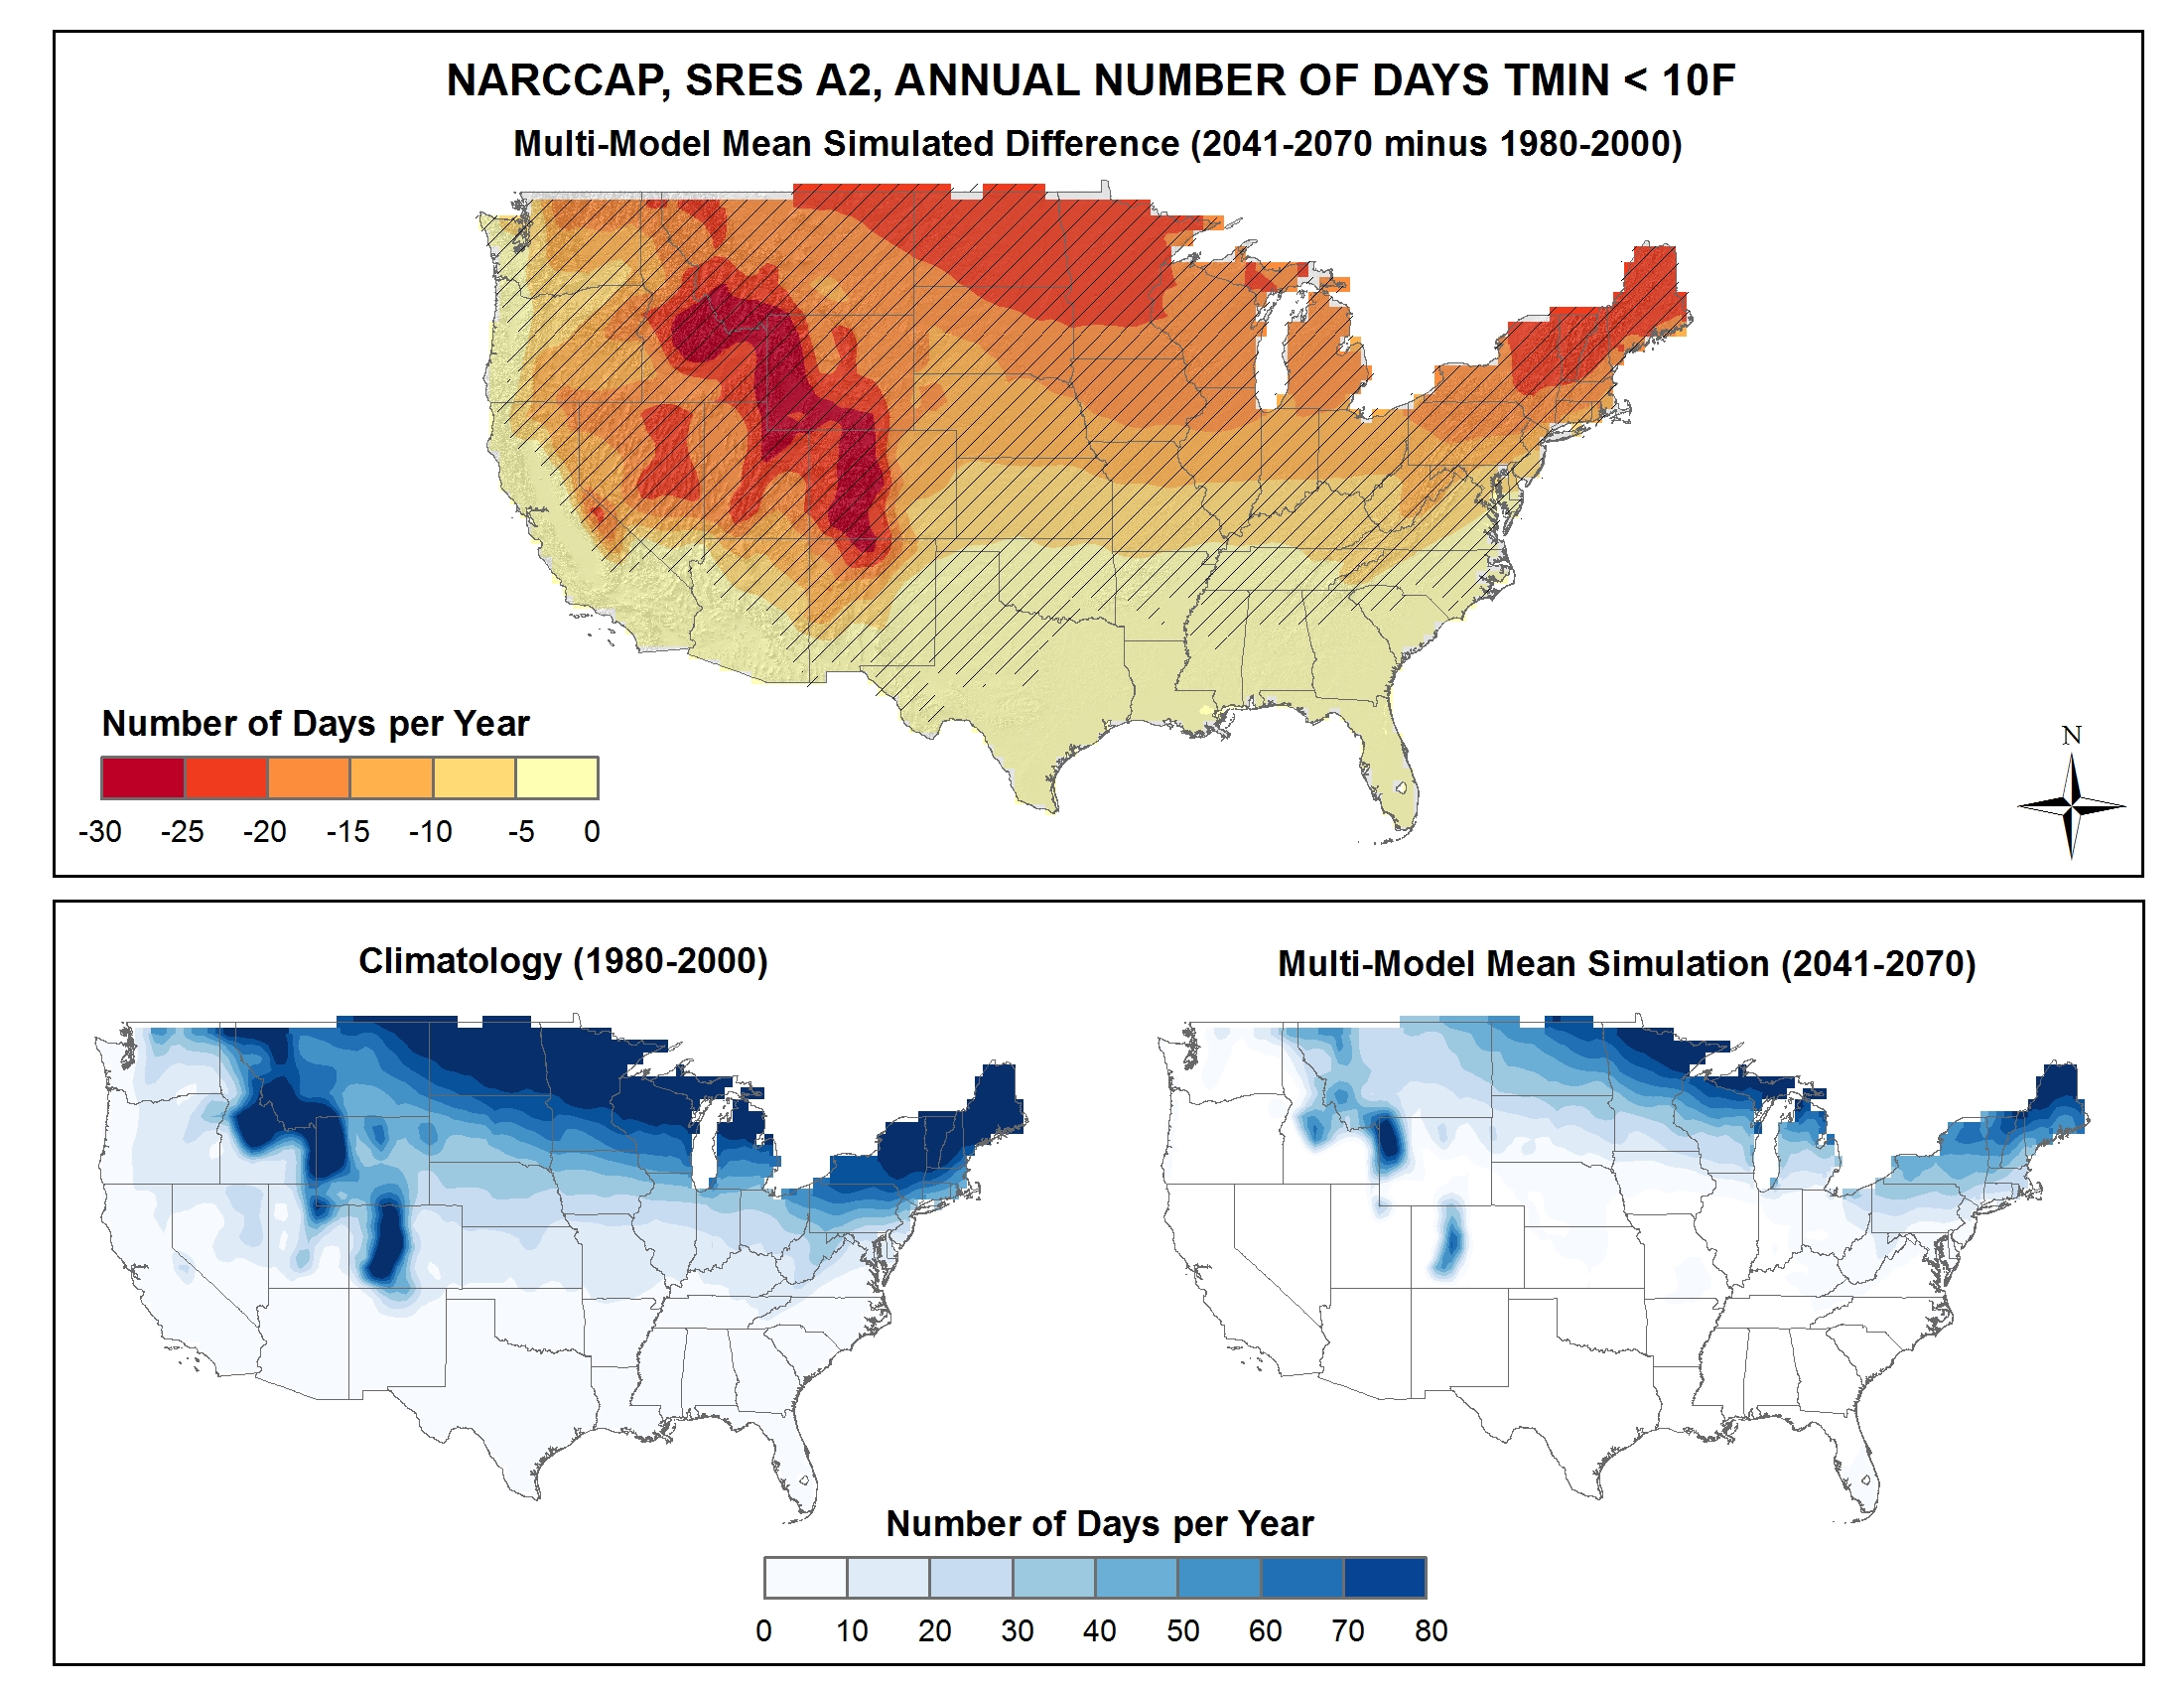
Simulated difference in the mean annual number of days with a minimum temperature less than 10F |
Simulated |
Temperature |
National |
Regional Climate Trends and Scenarios for the U.S. National Climate Assessment. Part 9. Climate of the Contiguous United States |
NCA 3 |
 |
|
Simulated difference in the mean annual number of days with a minimum temperature less than 10F |
Simulated |
Temperature |
Great Plains |
Regional Climate Trends and Scenarios for the U.S. National Climate Assessment. Part 4. Climate of the U.S. Great Plains |
NCA 3 |
 |
|
Simulated difference in the mean annual number of days with a minimum temperature less than 10F |
Simulated |
Temperature |
Northeast |
Regional Climate Trends and Scenarios for the U.S. National Climate Assessment. Part 1. Climate of the Northeast U.S. |
NCA 3 |
 |
|
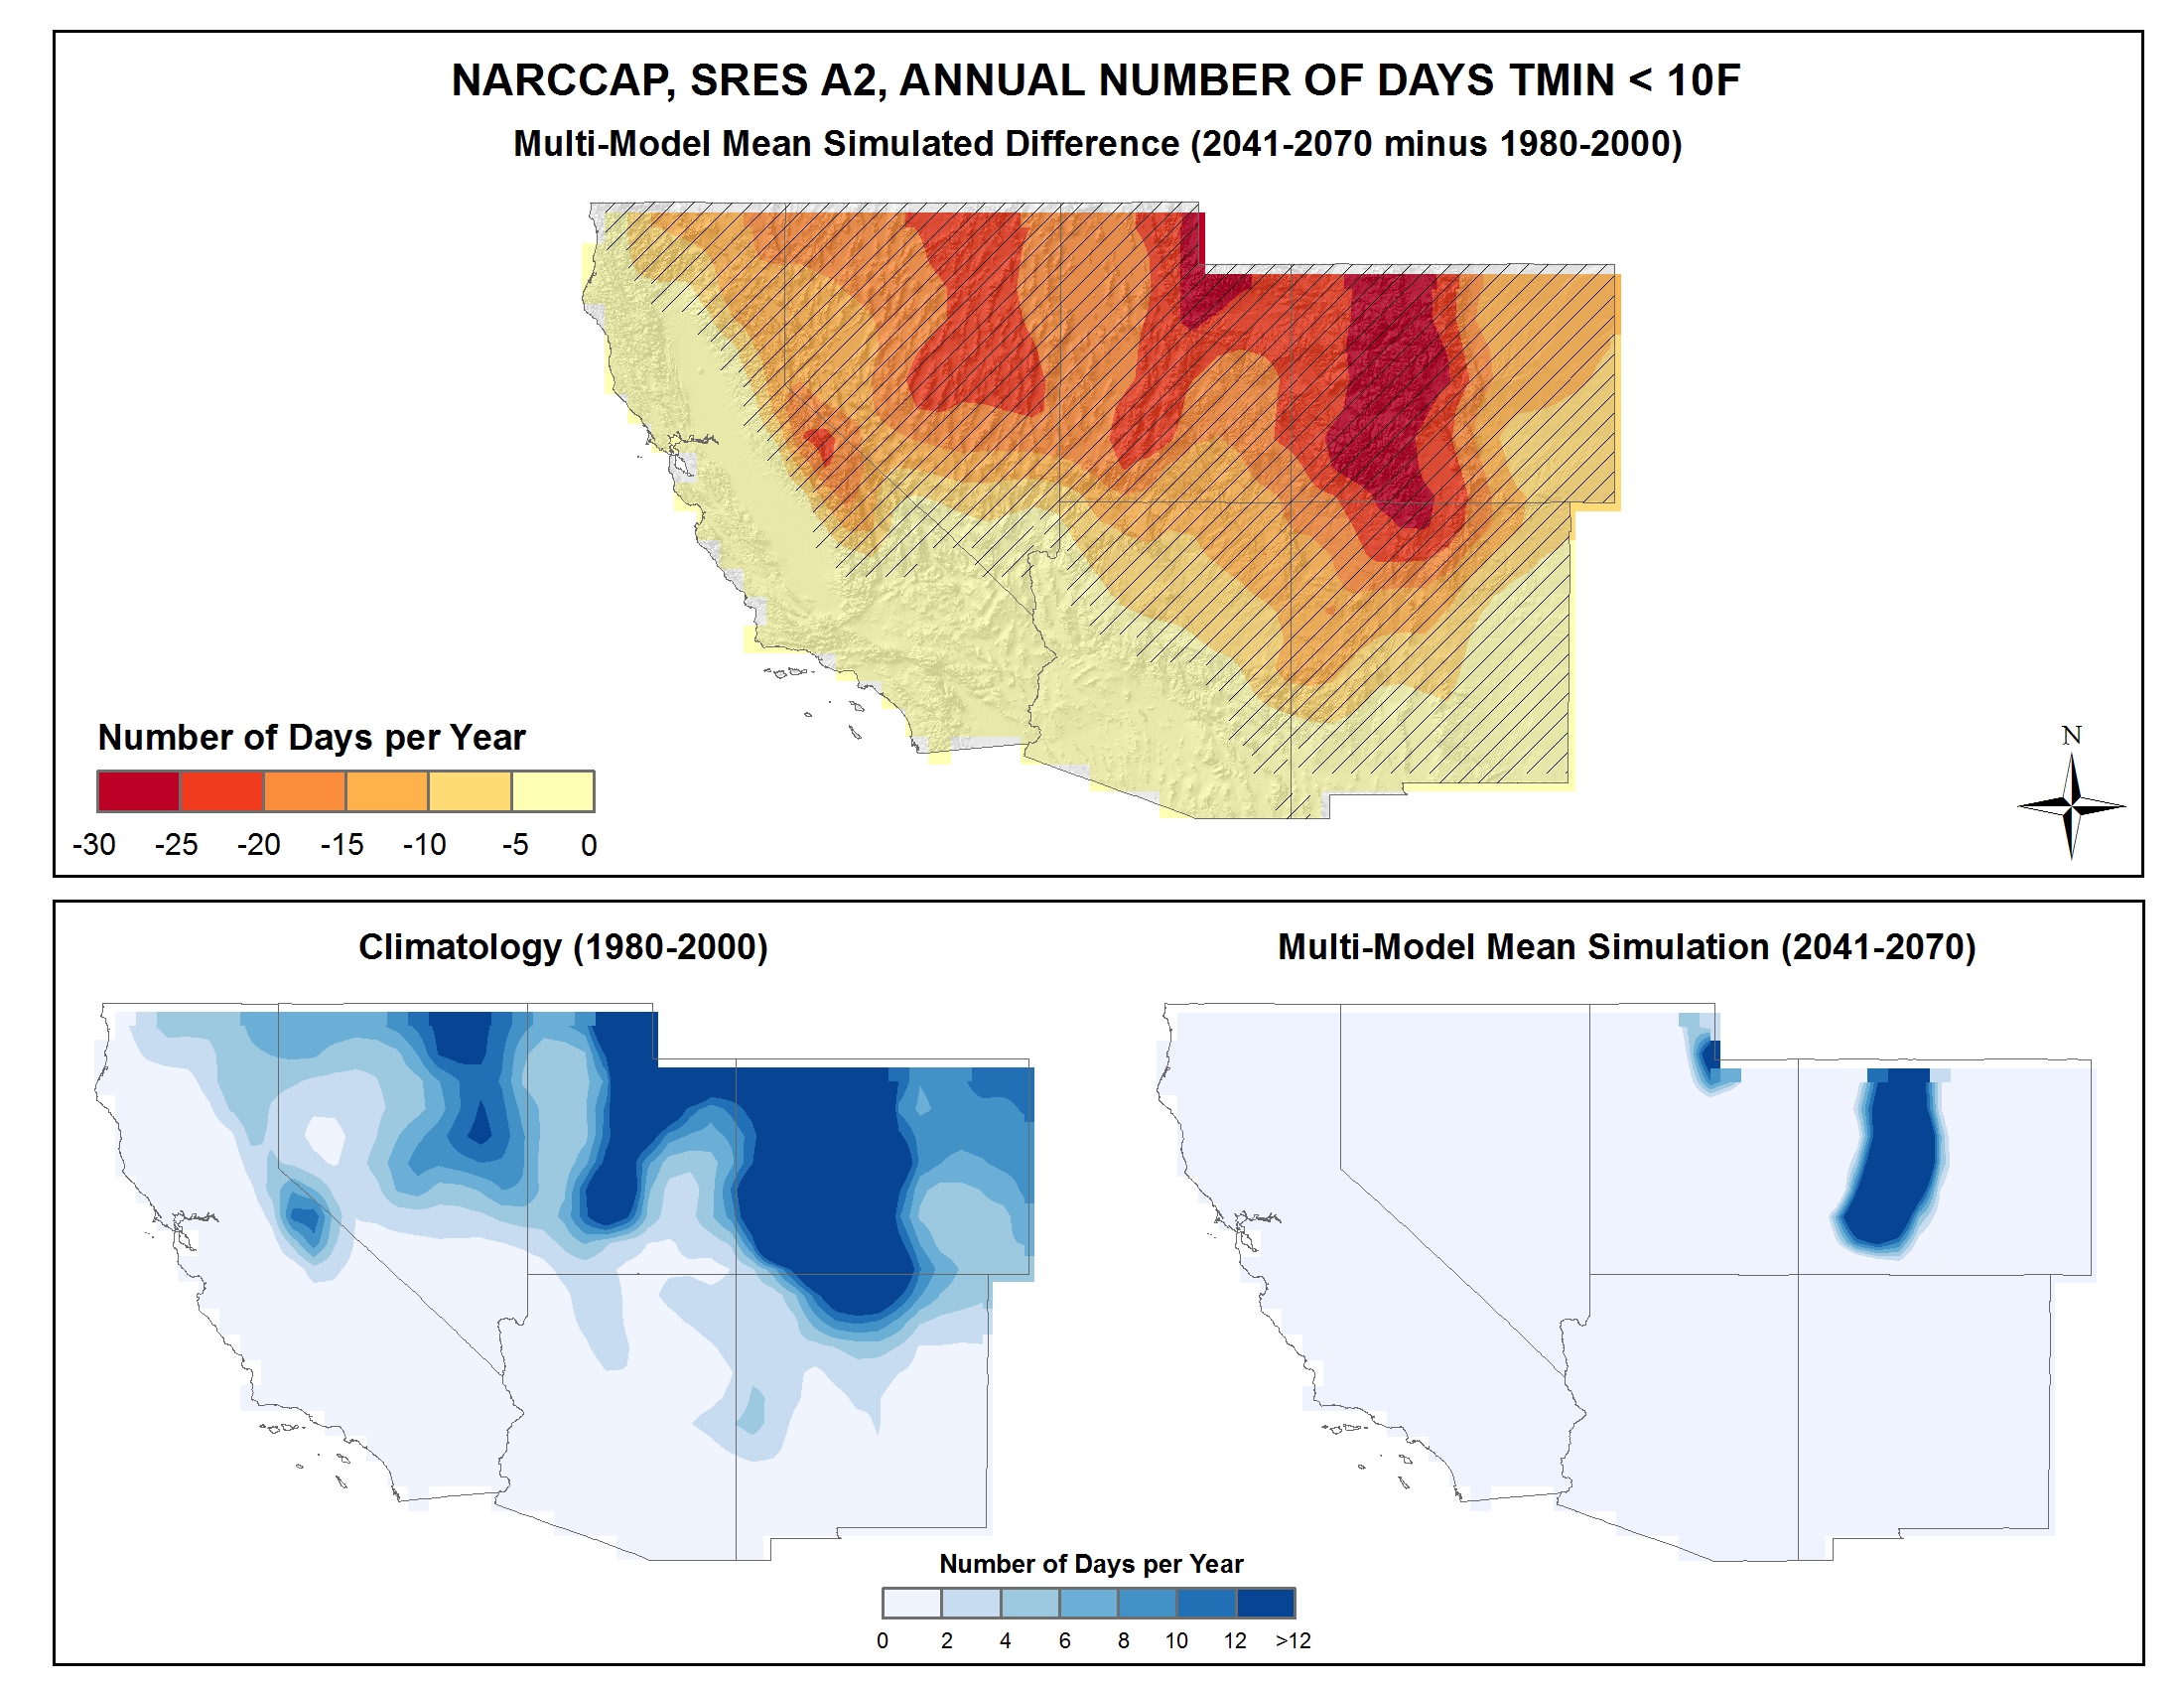
Simulated difference in the mean annual number of days with a minimum temperature less than 10F |
Simulated |
Temperature |
Southwest |
Regional Climate Trends and Scenarios for the U.S. National Climate Assessment. Part 5. Climate of the Southwest U.S. |
NCA 3 |
 |
|
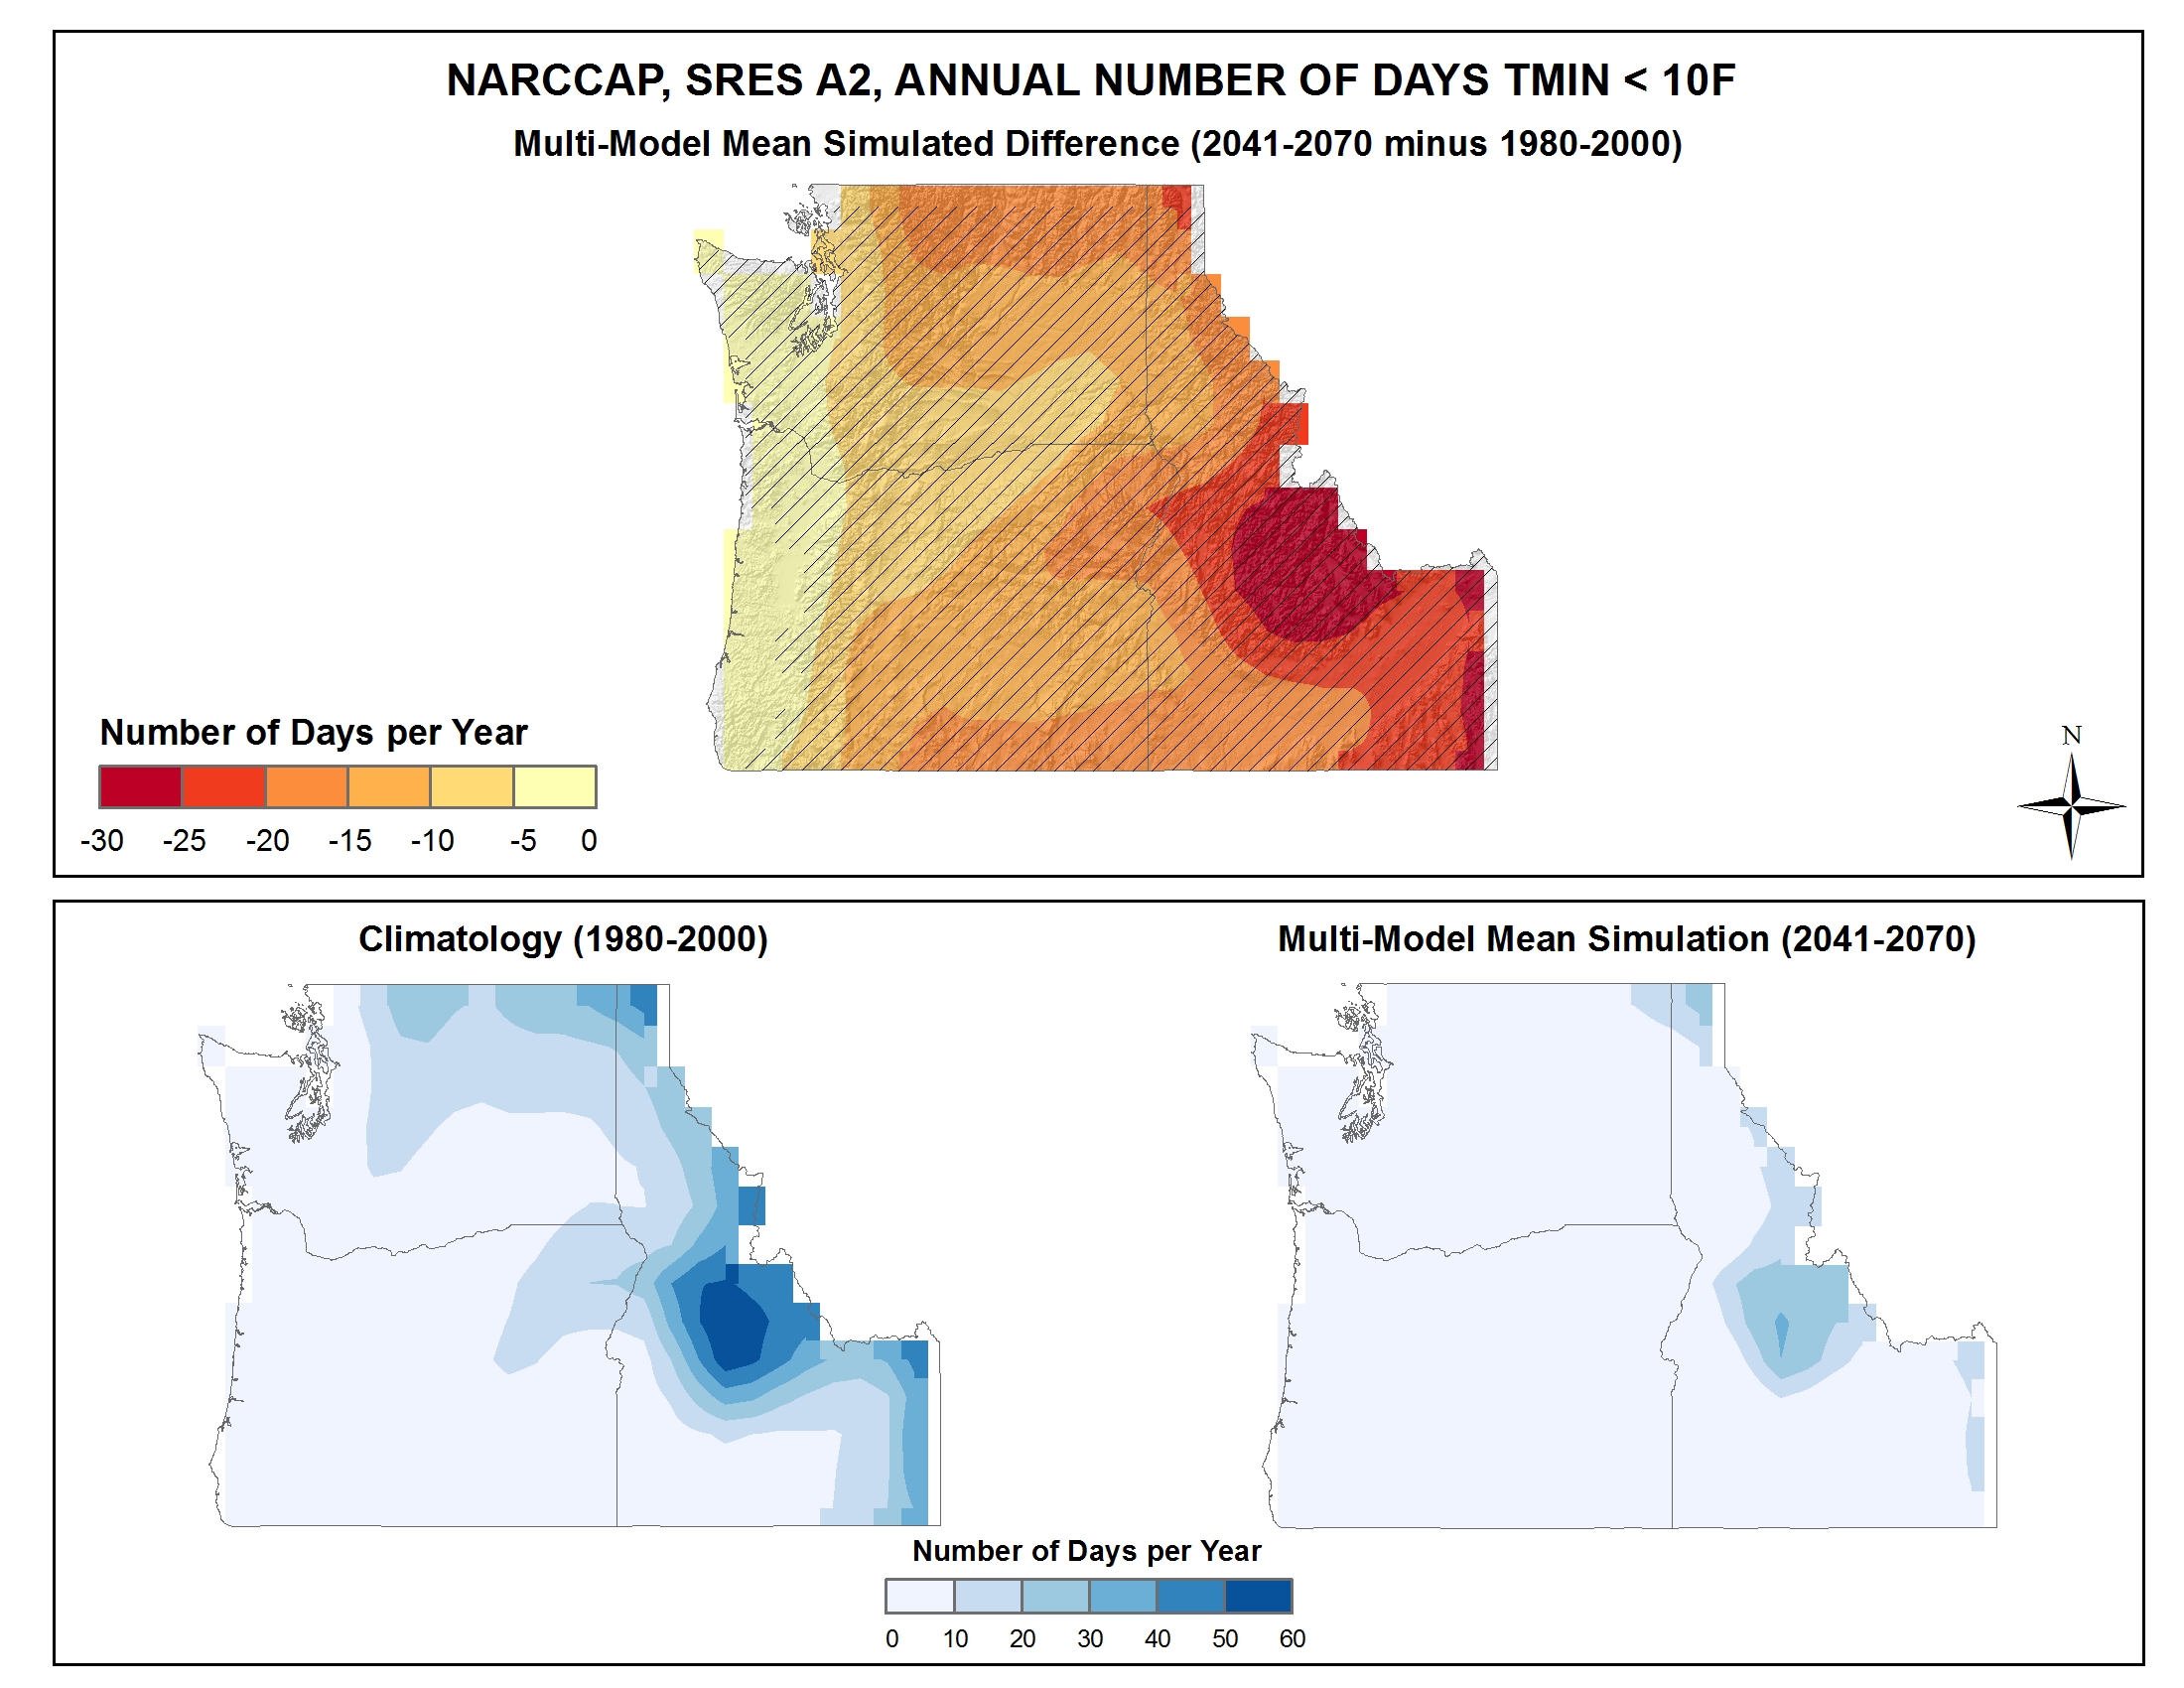
Simulated difference in the mean annual number of days with a minimum temperature less than 10F |
Simulated |
Temperature |
Northwest |
Regional Climate Trends and Scenarios for the U.S. National Climate Assessment. Part 6. Climate of the Northwest U.S. |
NCA 3 |
 |
|
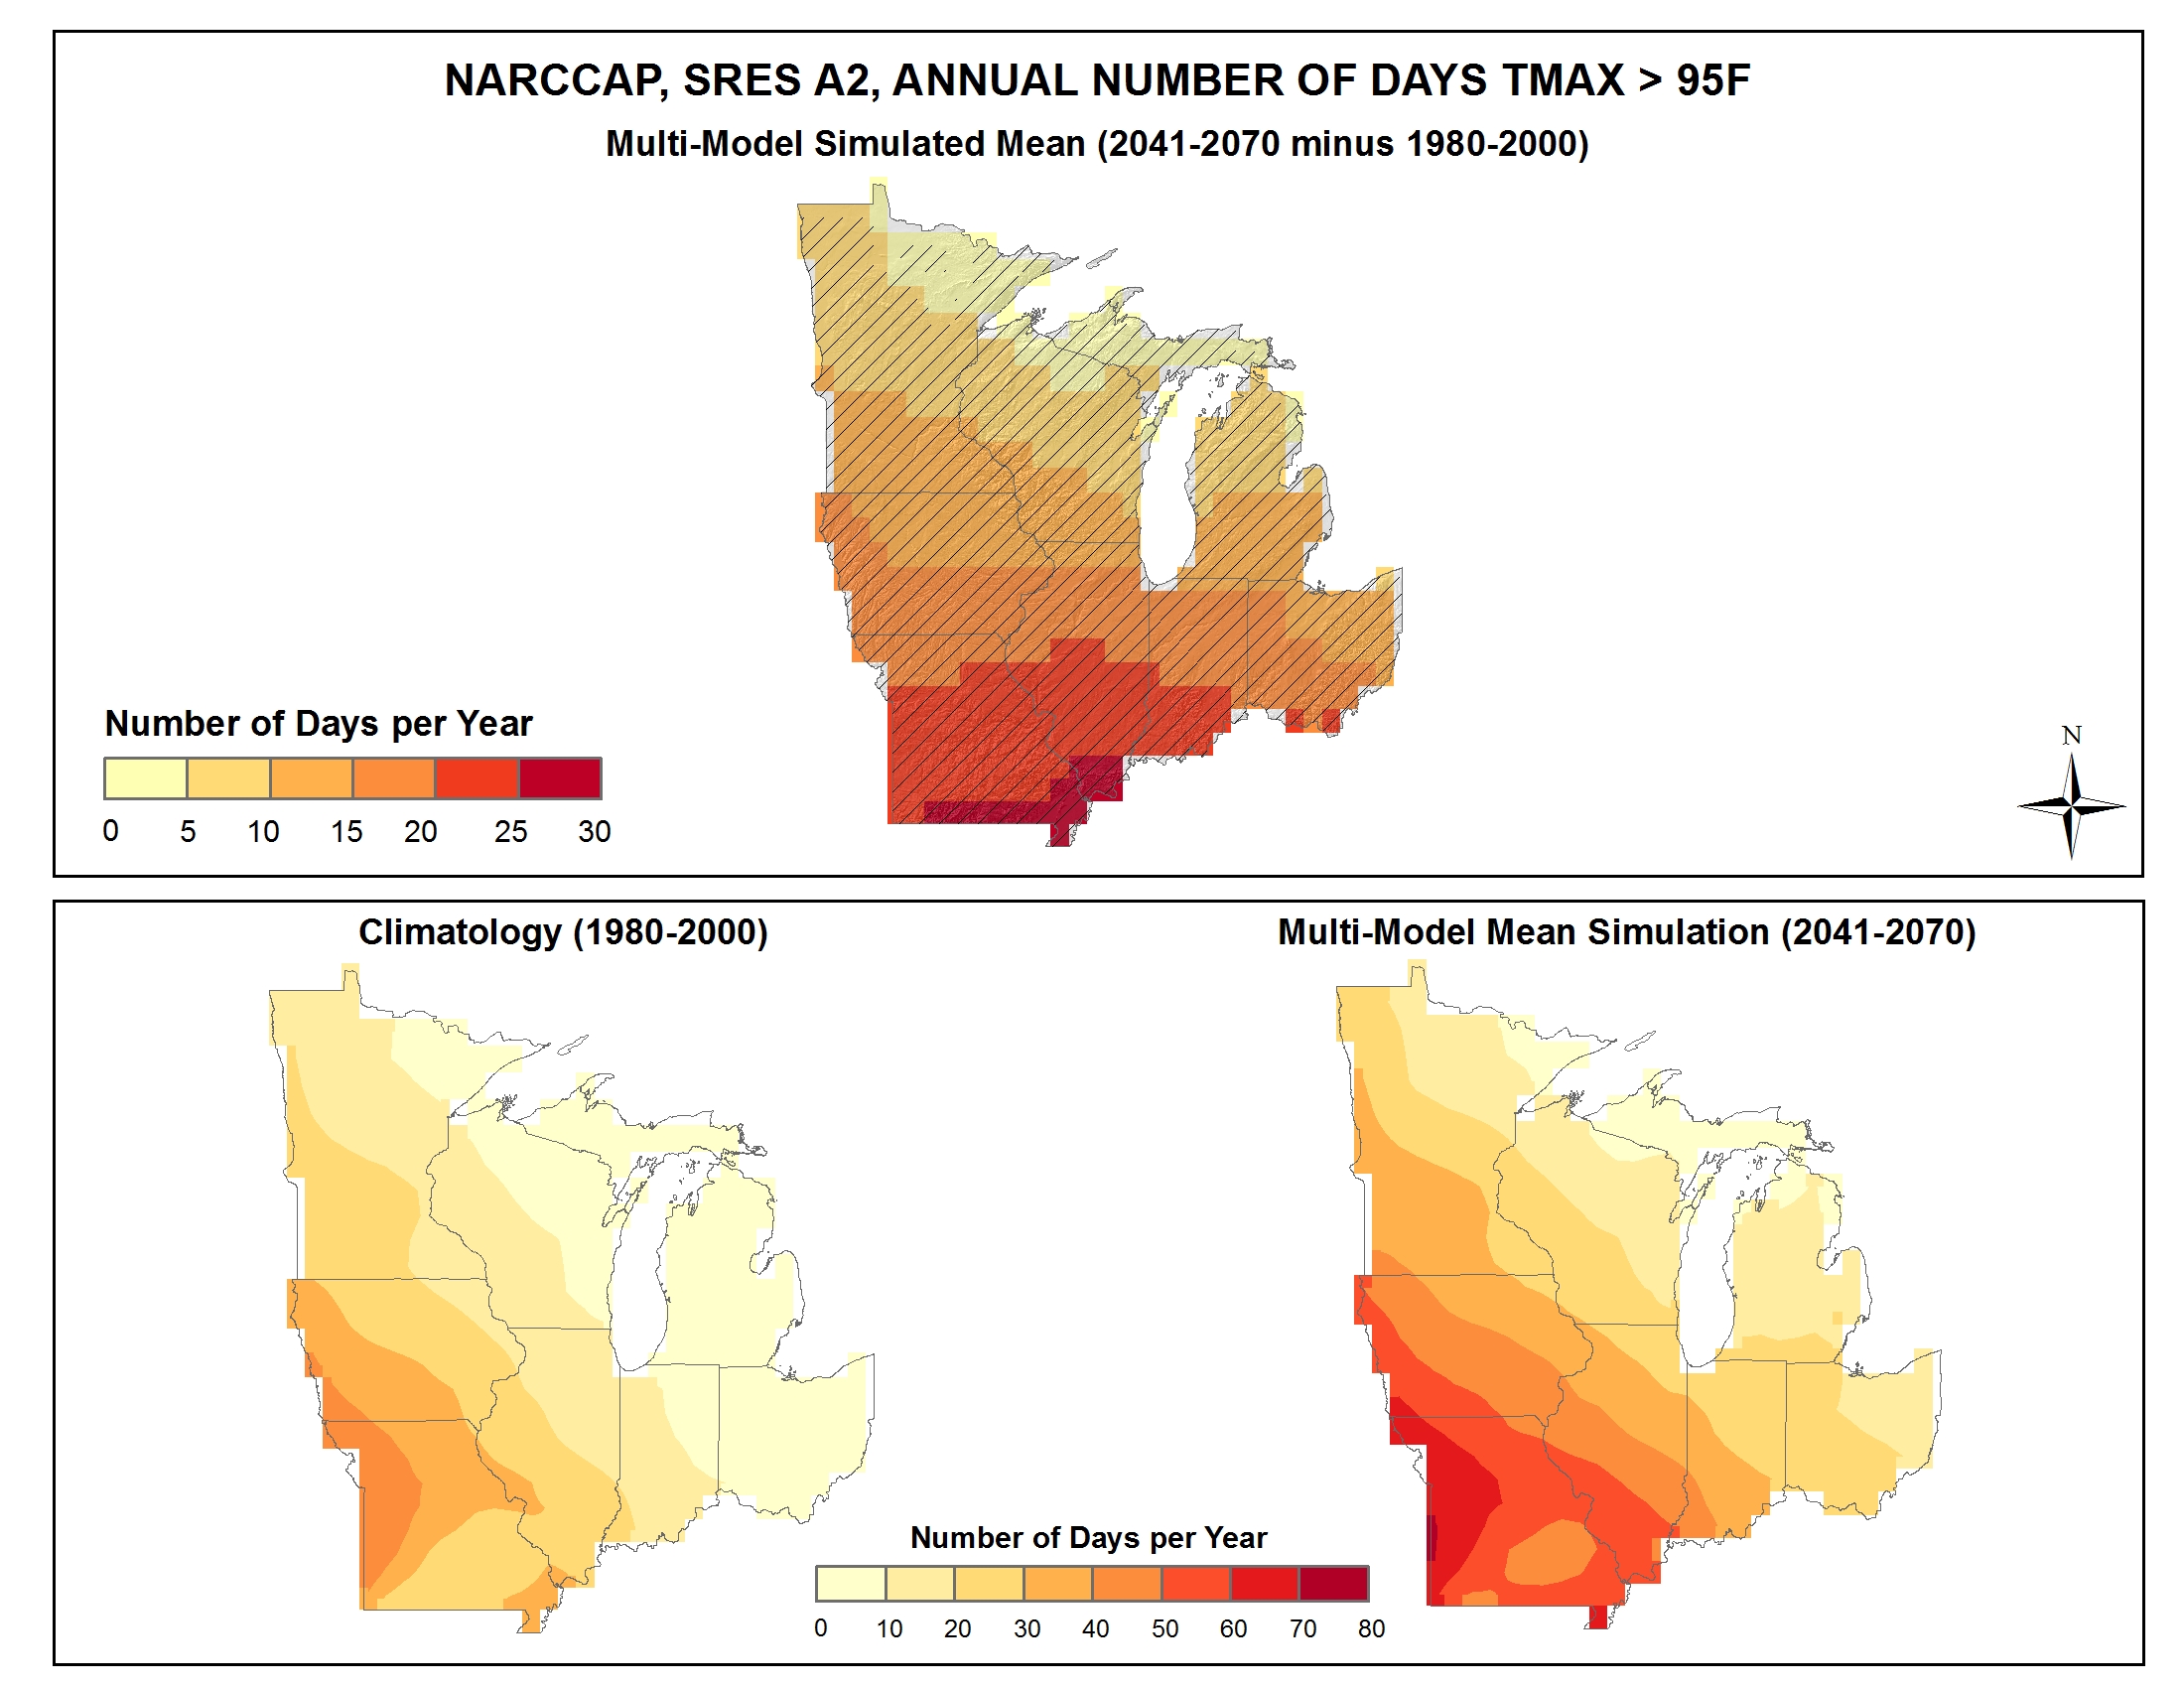
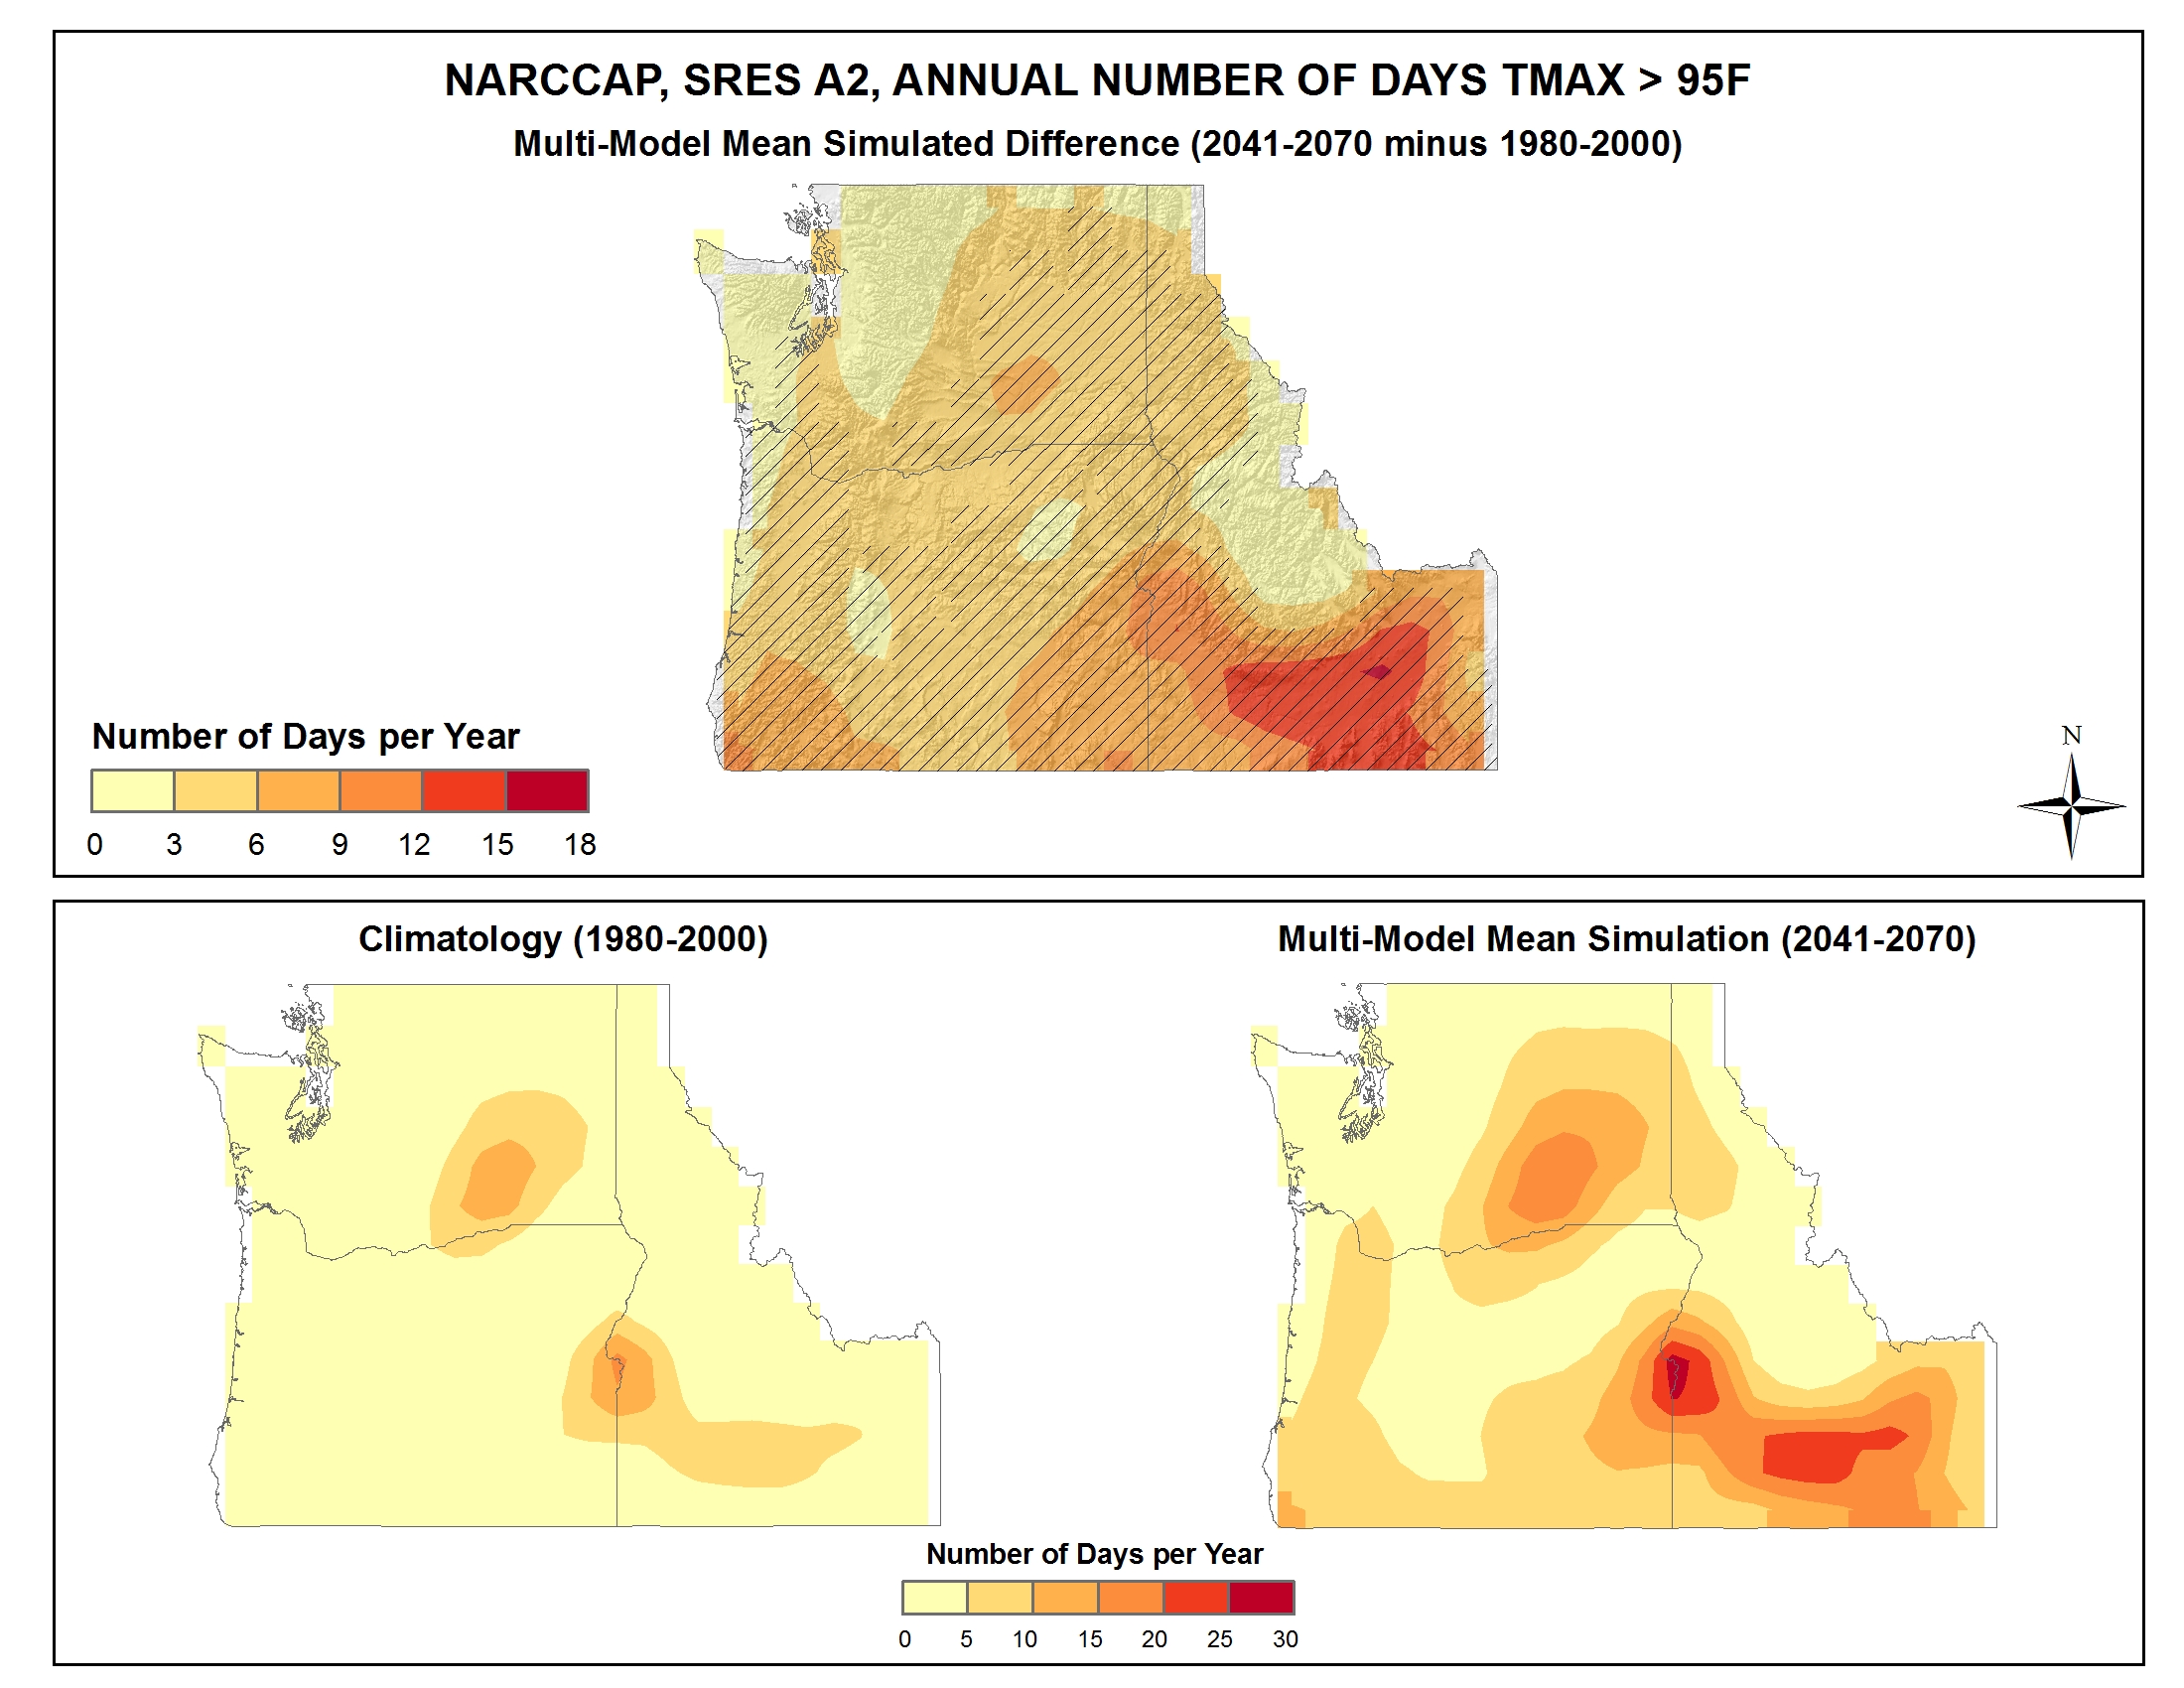
Simulated difference in the mean annual number of days with a maximum temperature greater than 95F |
Simulated |
Temperature |
Midwest |
Regional Climate Trends and Scenarios for the U.S. National Climate Assessment. Part 3. Climate of the Midwest U.S. |
NCA 3 |
 |
|
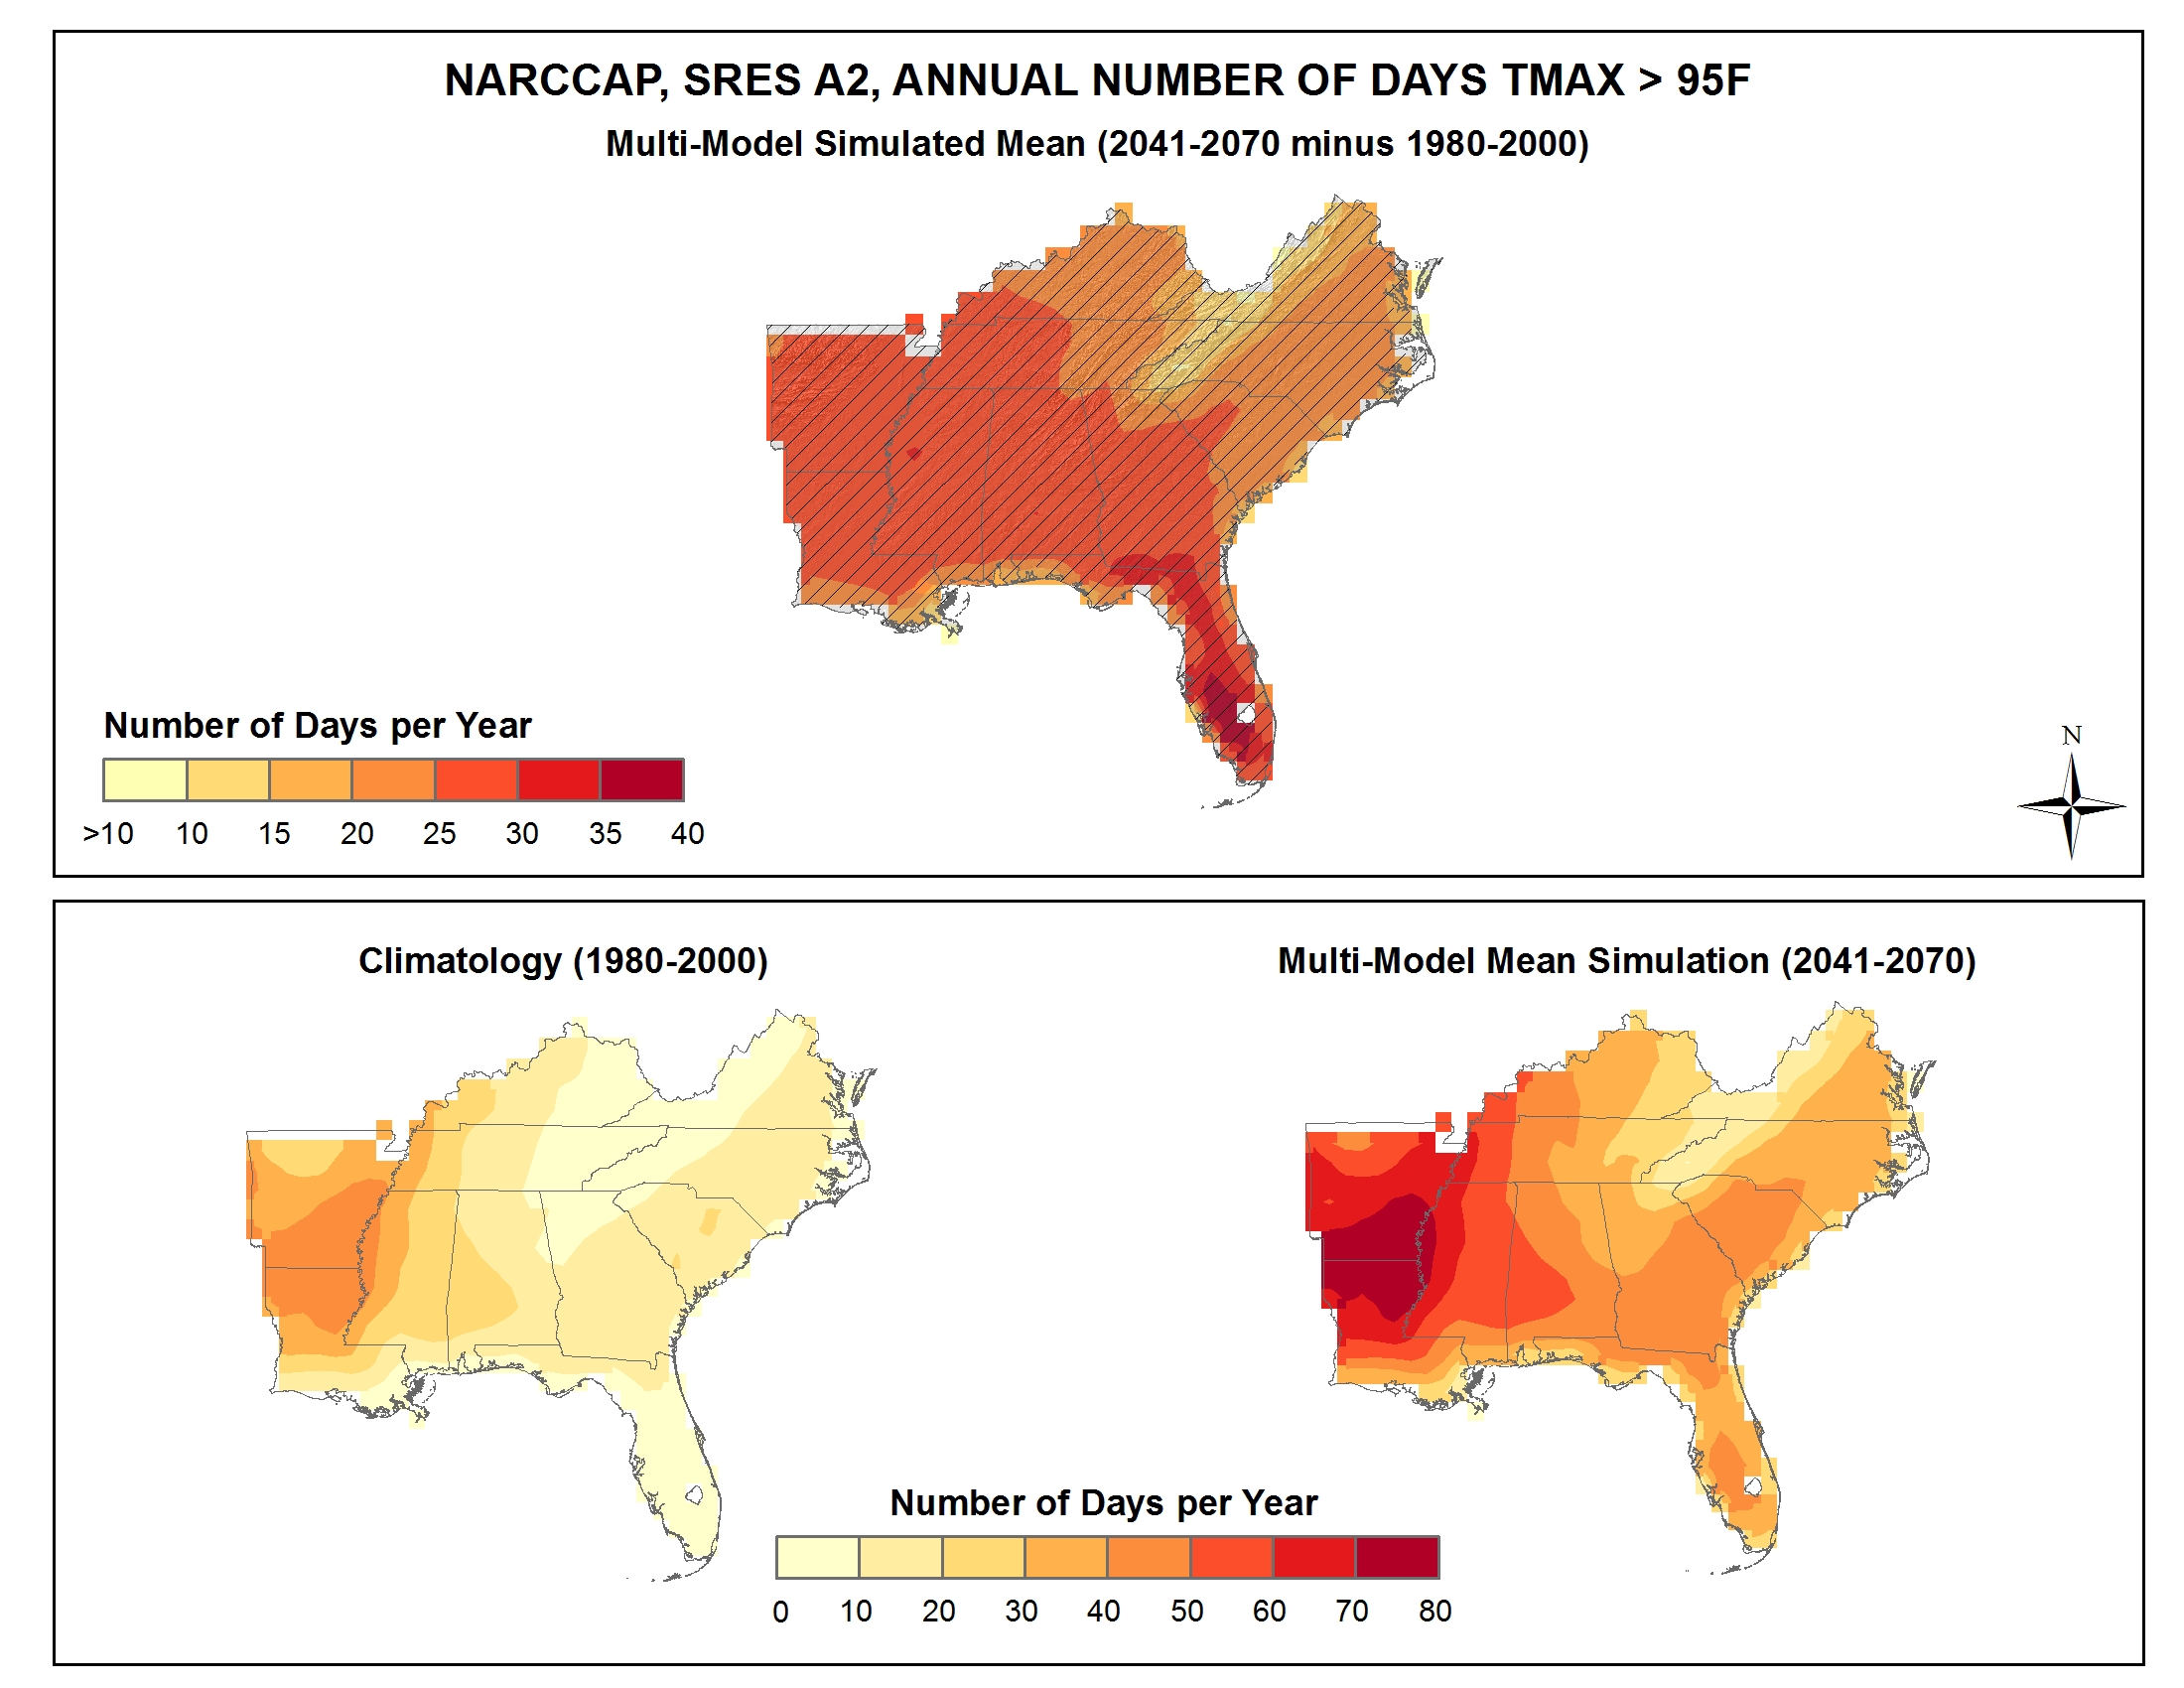
Simulated difference in the mean annual number of days with a maximum temperature greater than 95F |
Simulated |
Temperature |
Southeast and Caribbean |
Regional Climate Trends and Scenarios for the U.S. National Climate Assessment. Part 2. Climate of the Southeast U.S. |
NCA 3 |
 |
|
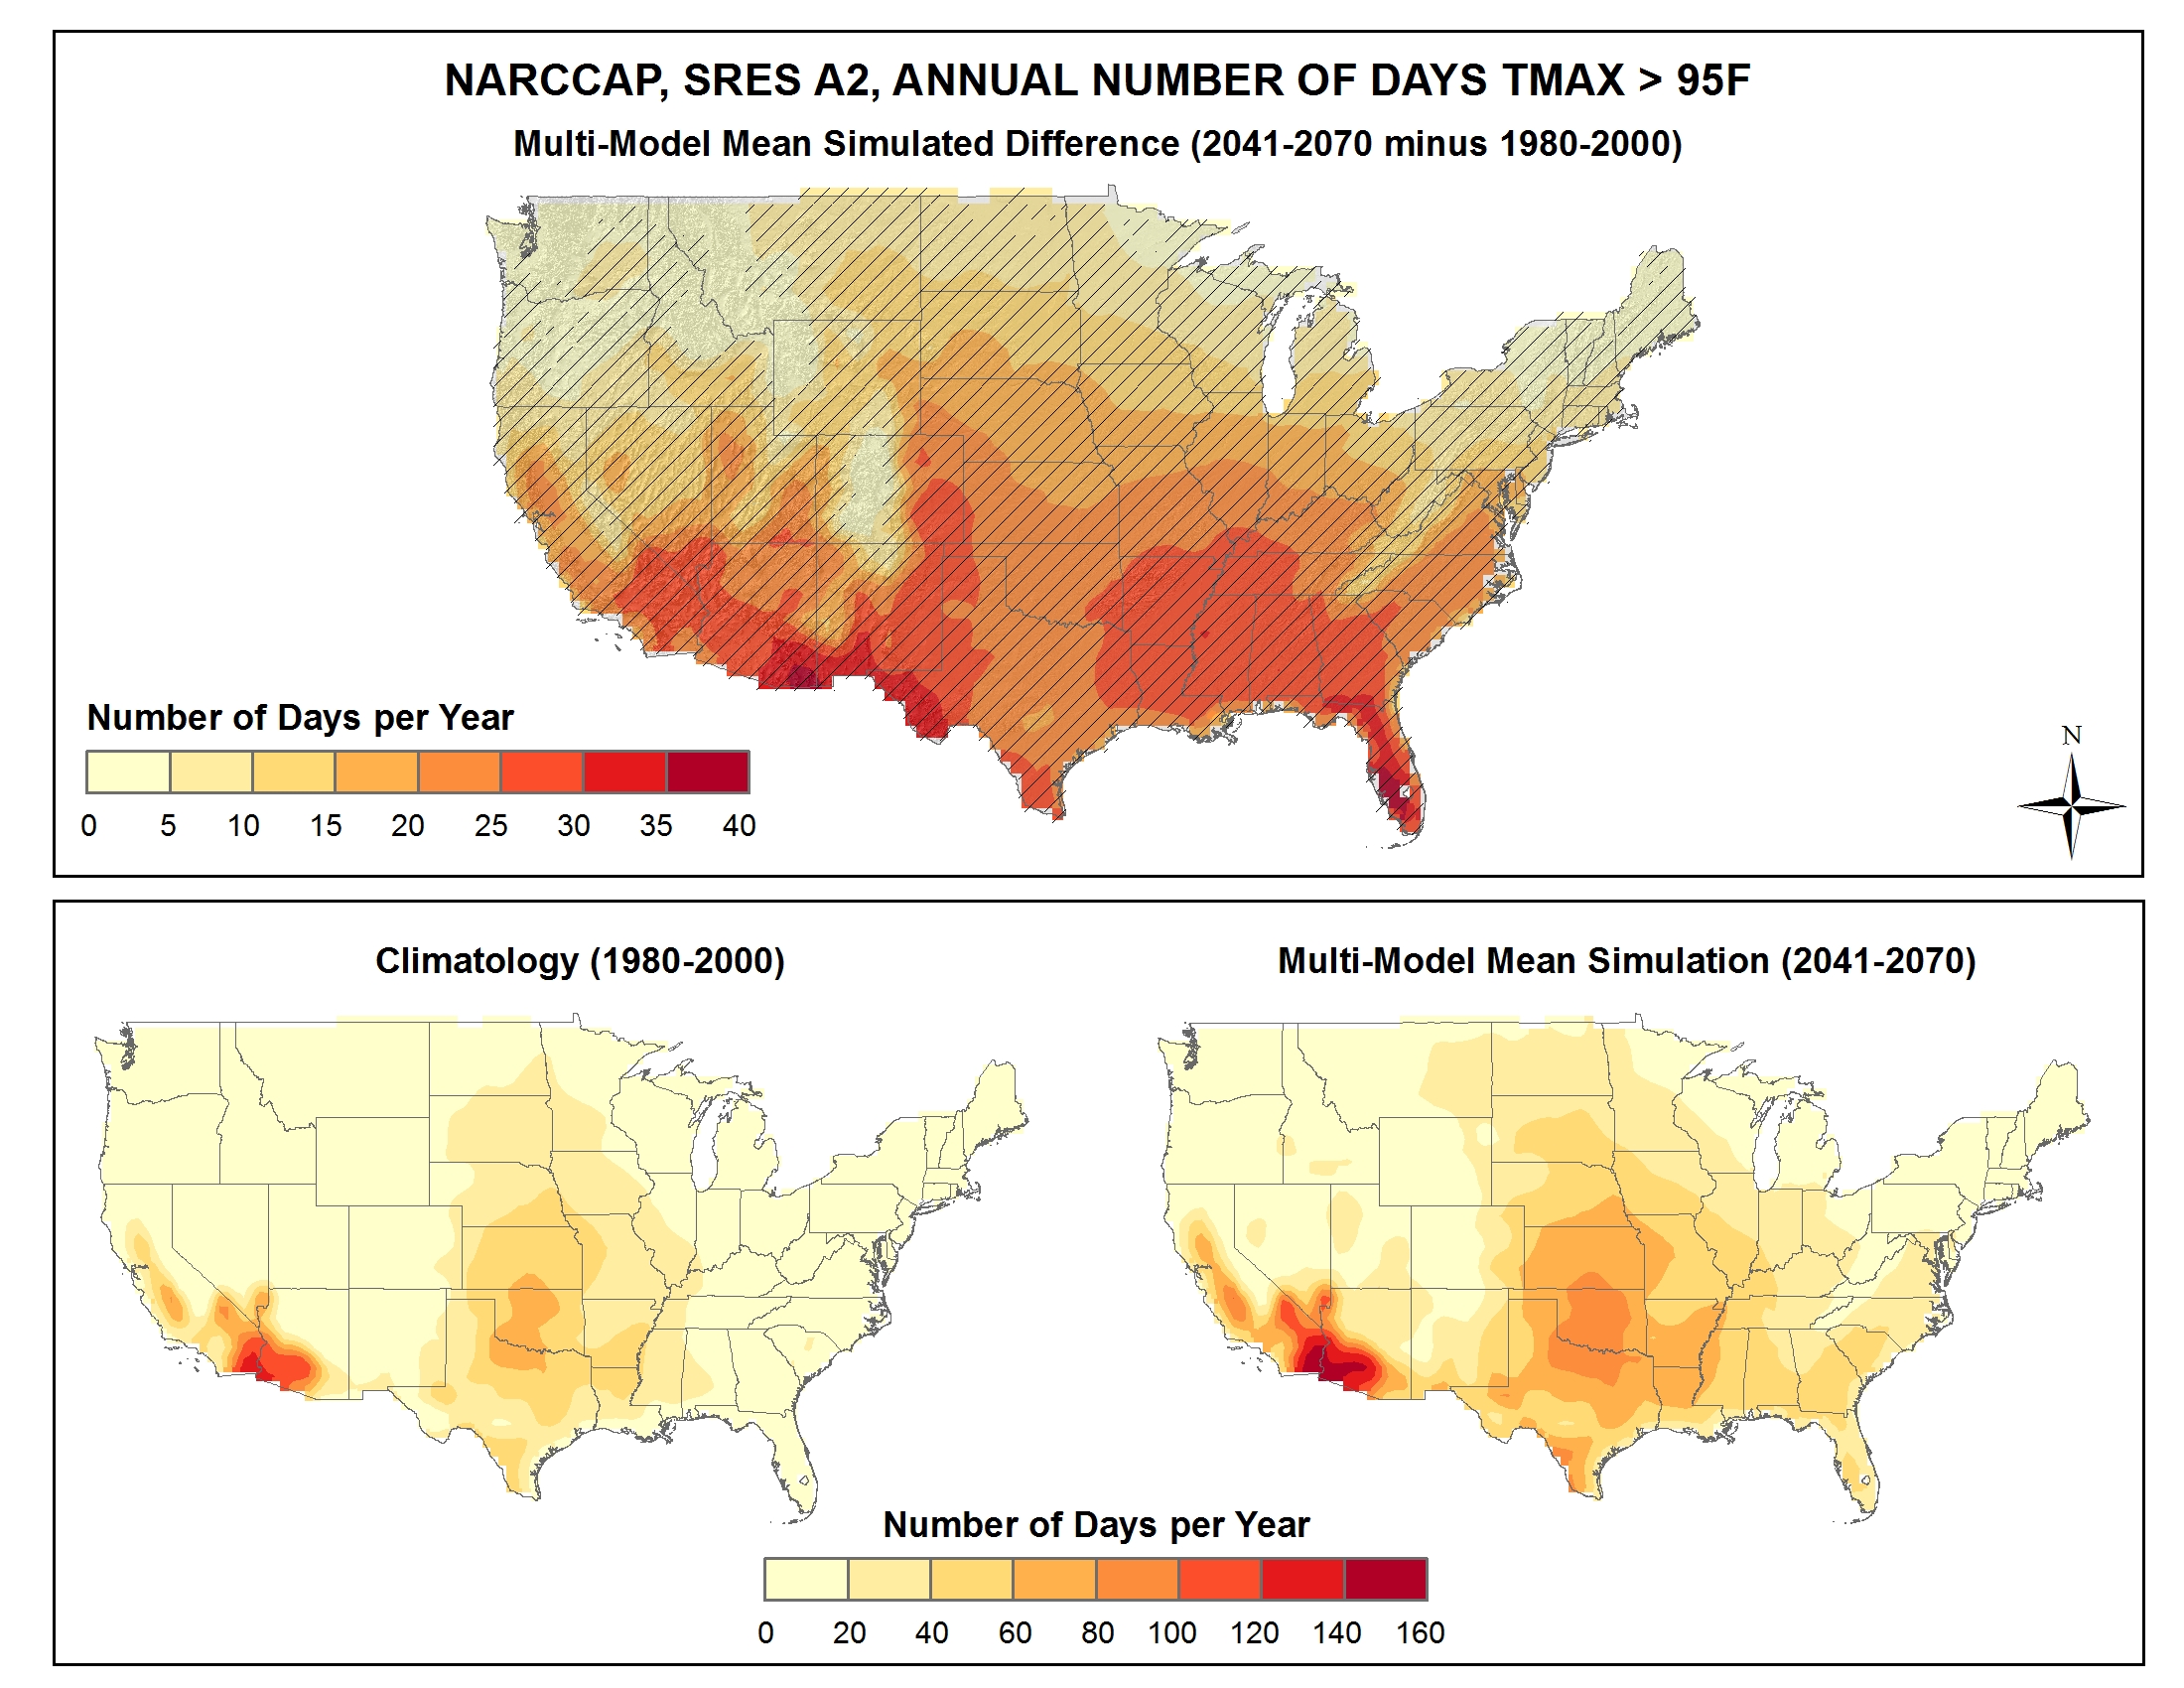
Simulated difference in the mean annual number of days with a maximum temperature greater than 95F |
Simulated |
Temperature |
National |
Regional Climate Trends and Scenarios for the U.S. National Climate Assessment. Part 9. Climate of the Contiguous United States |
NCA 3 |
 |
|
Simulated difference in the mean annual number of days with a maximum temperature greater than 95F |
Simulated |
Temperature |
Great Plains |
Regional Climate Trends and Scenarios for the U.S. National Climate Assessment. Part 4. Climate of the U.S. Great Plains |
NCA 3 |
 |
|
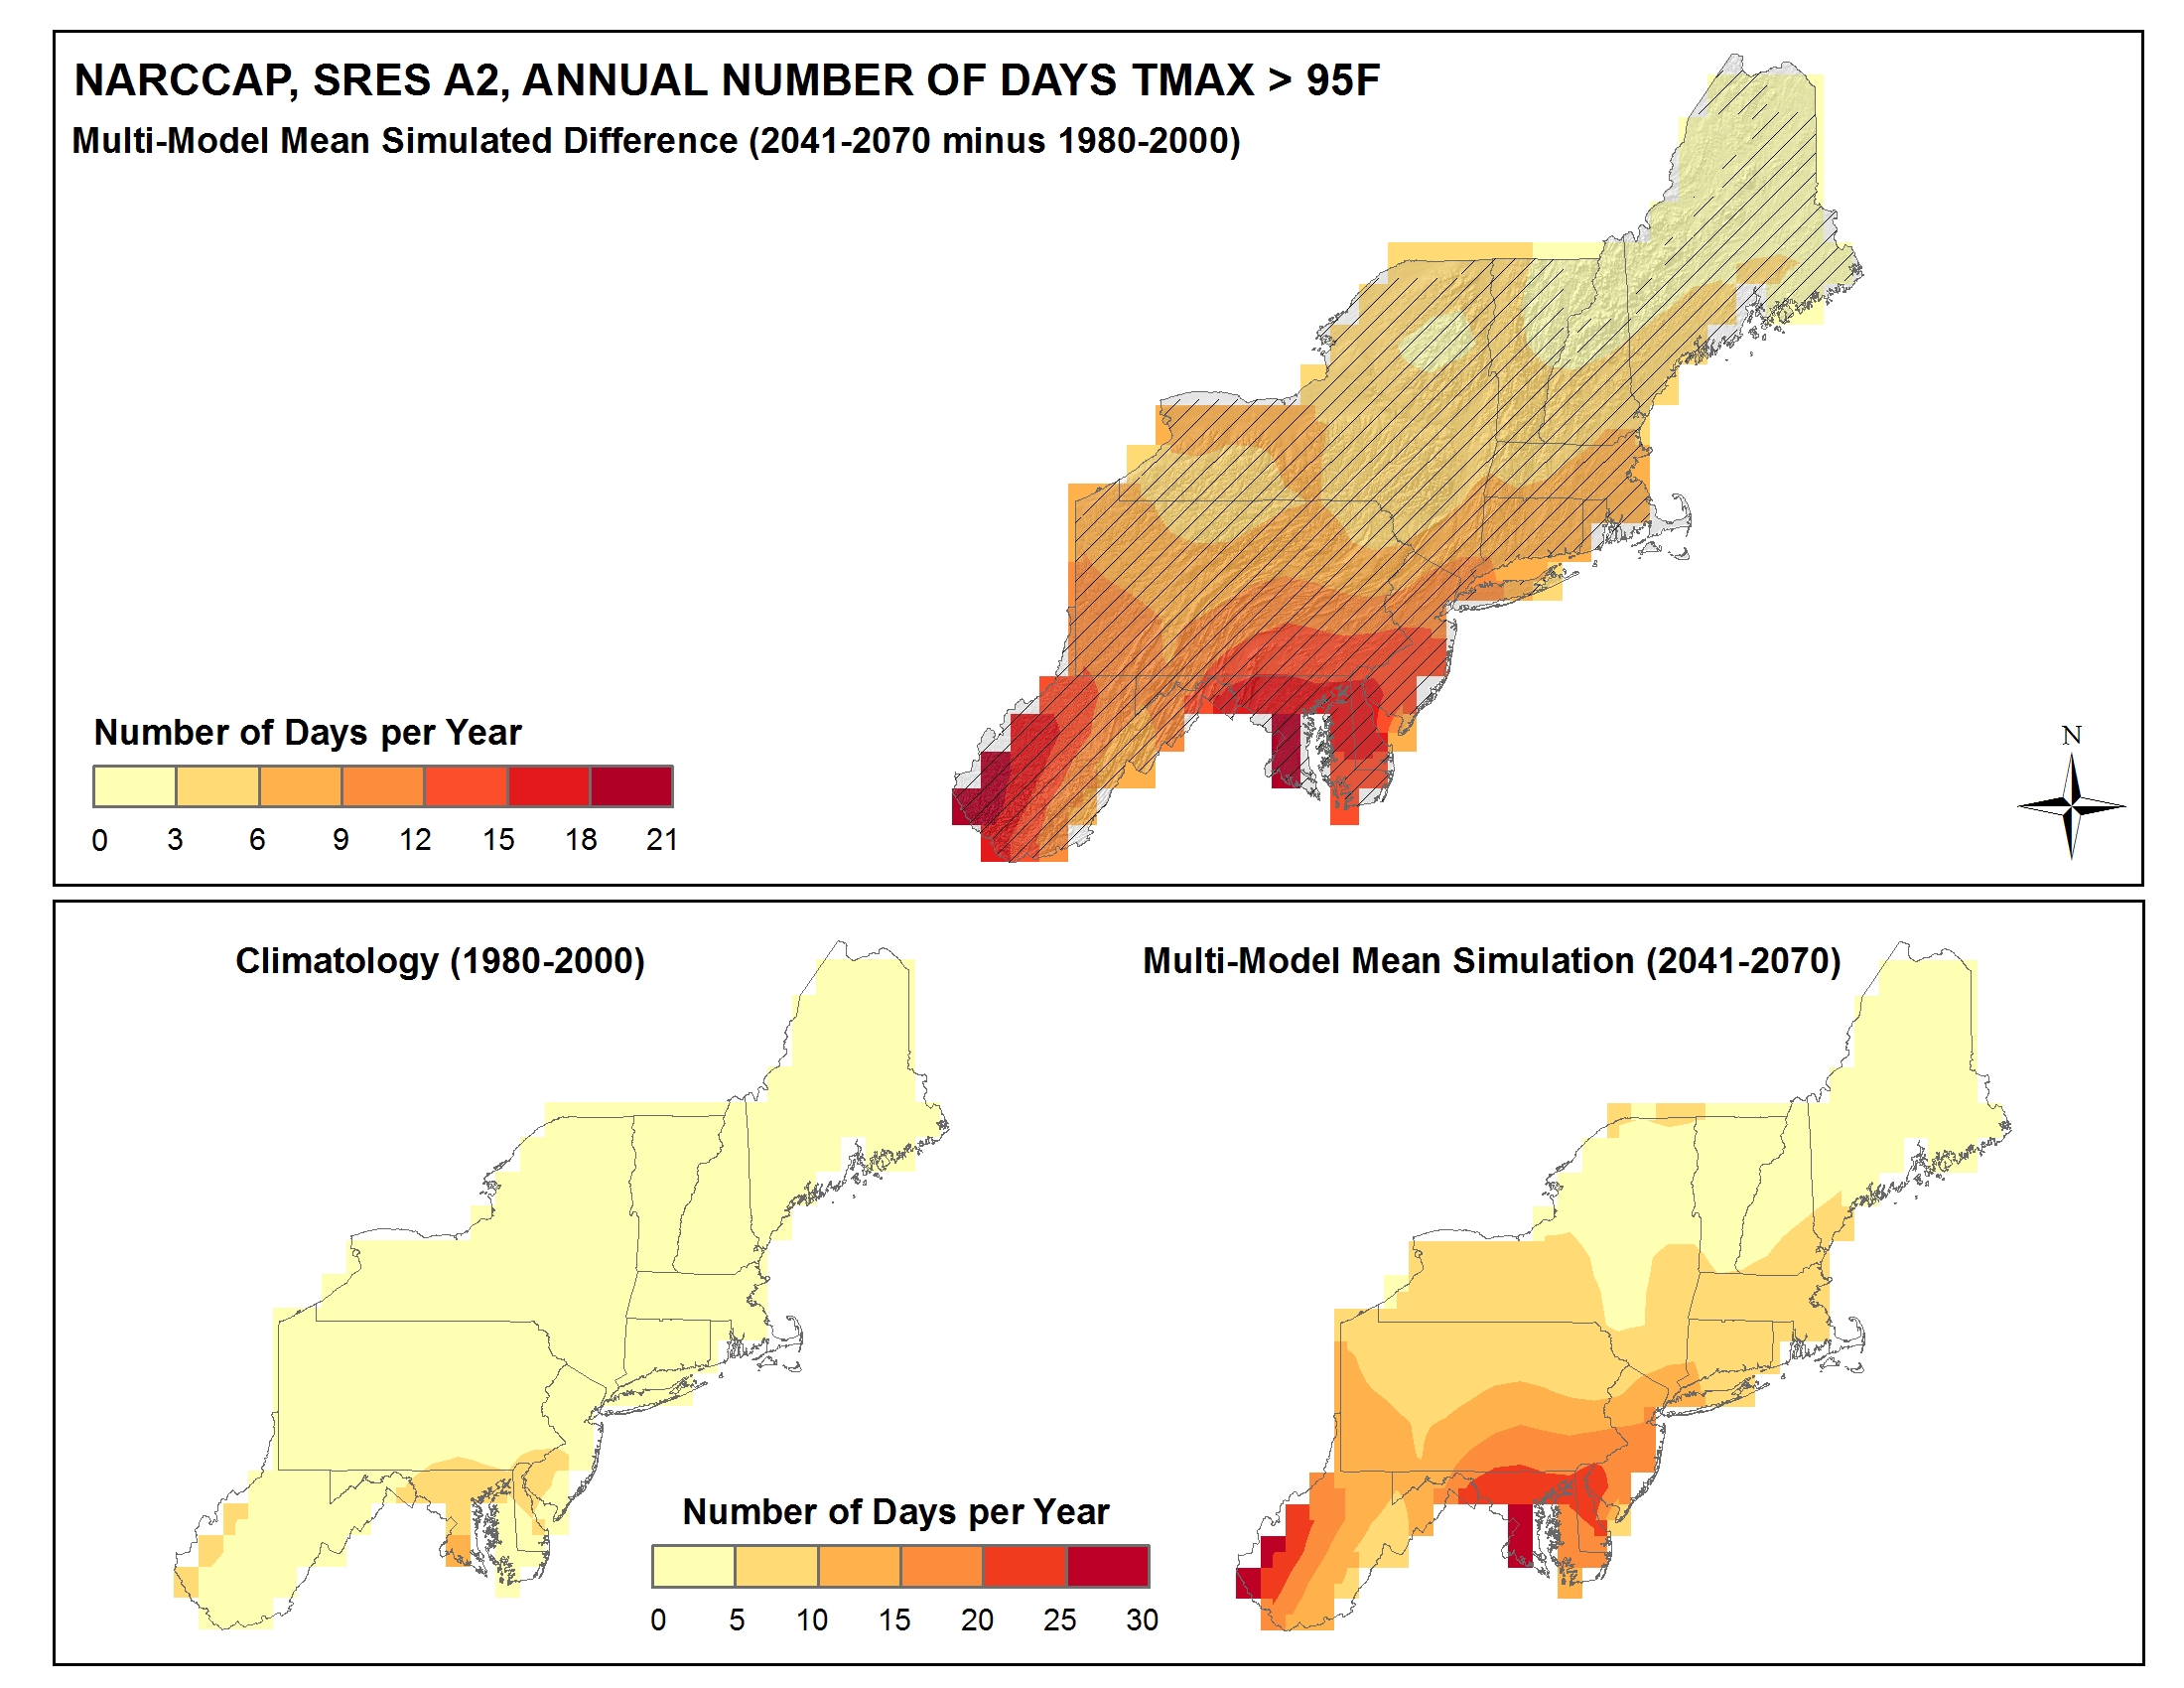
Simulated difference in the mean annual number of days with a maximum temperature greater than 95F |
Simulated |
Temperature |
Northeast |
Regional Climate Trends and Scenarios for the U.S. National Climate Assessment. Part 1. Climate of the Northeast U.S. |
NCA 3 |
 |
|
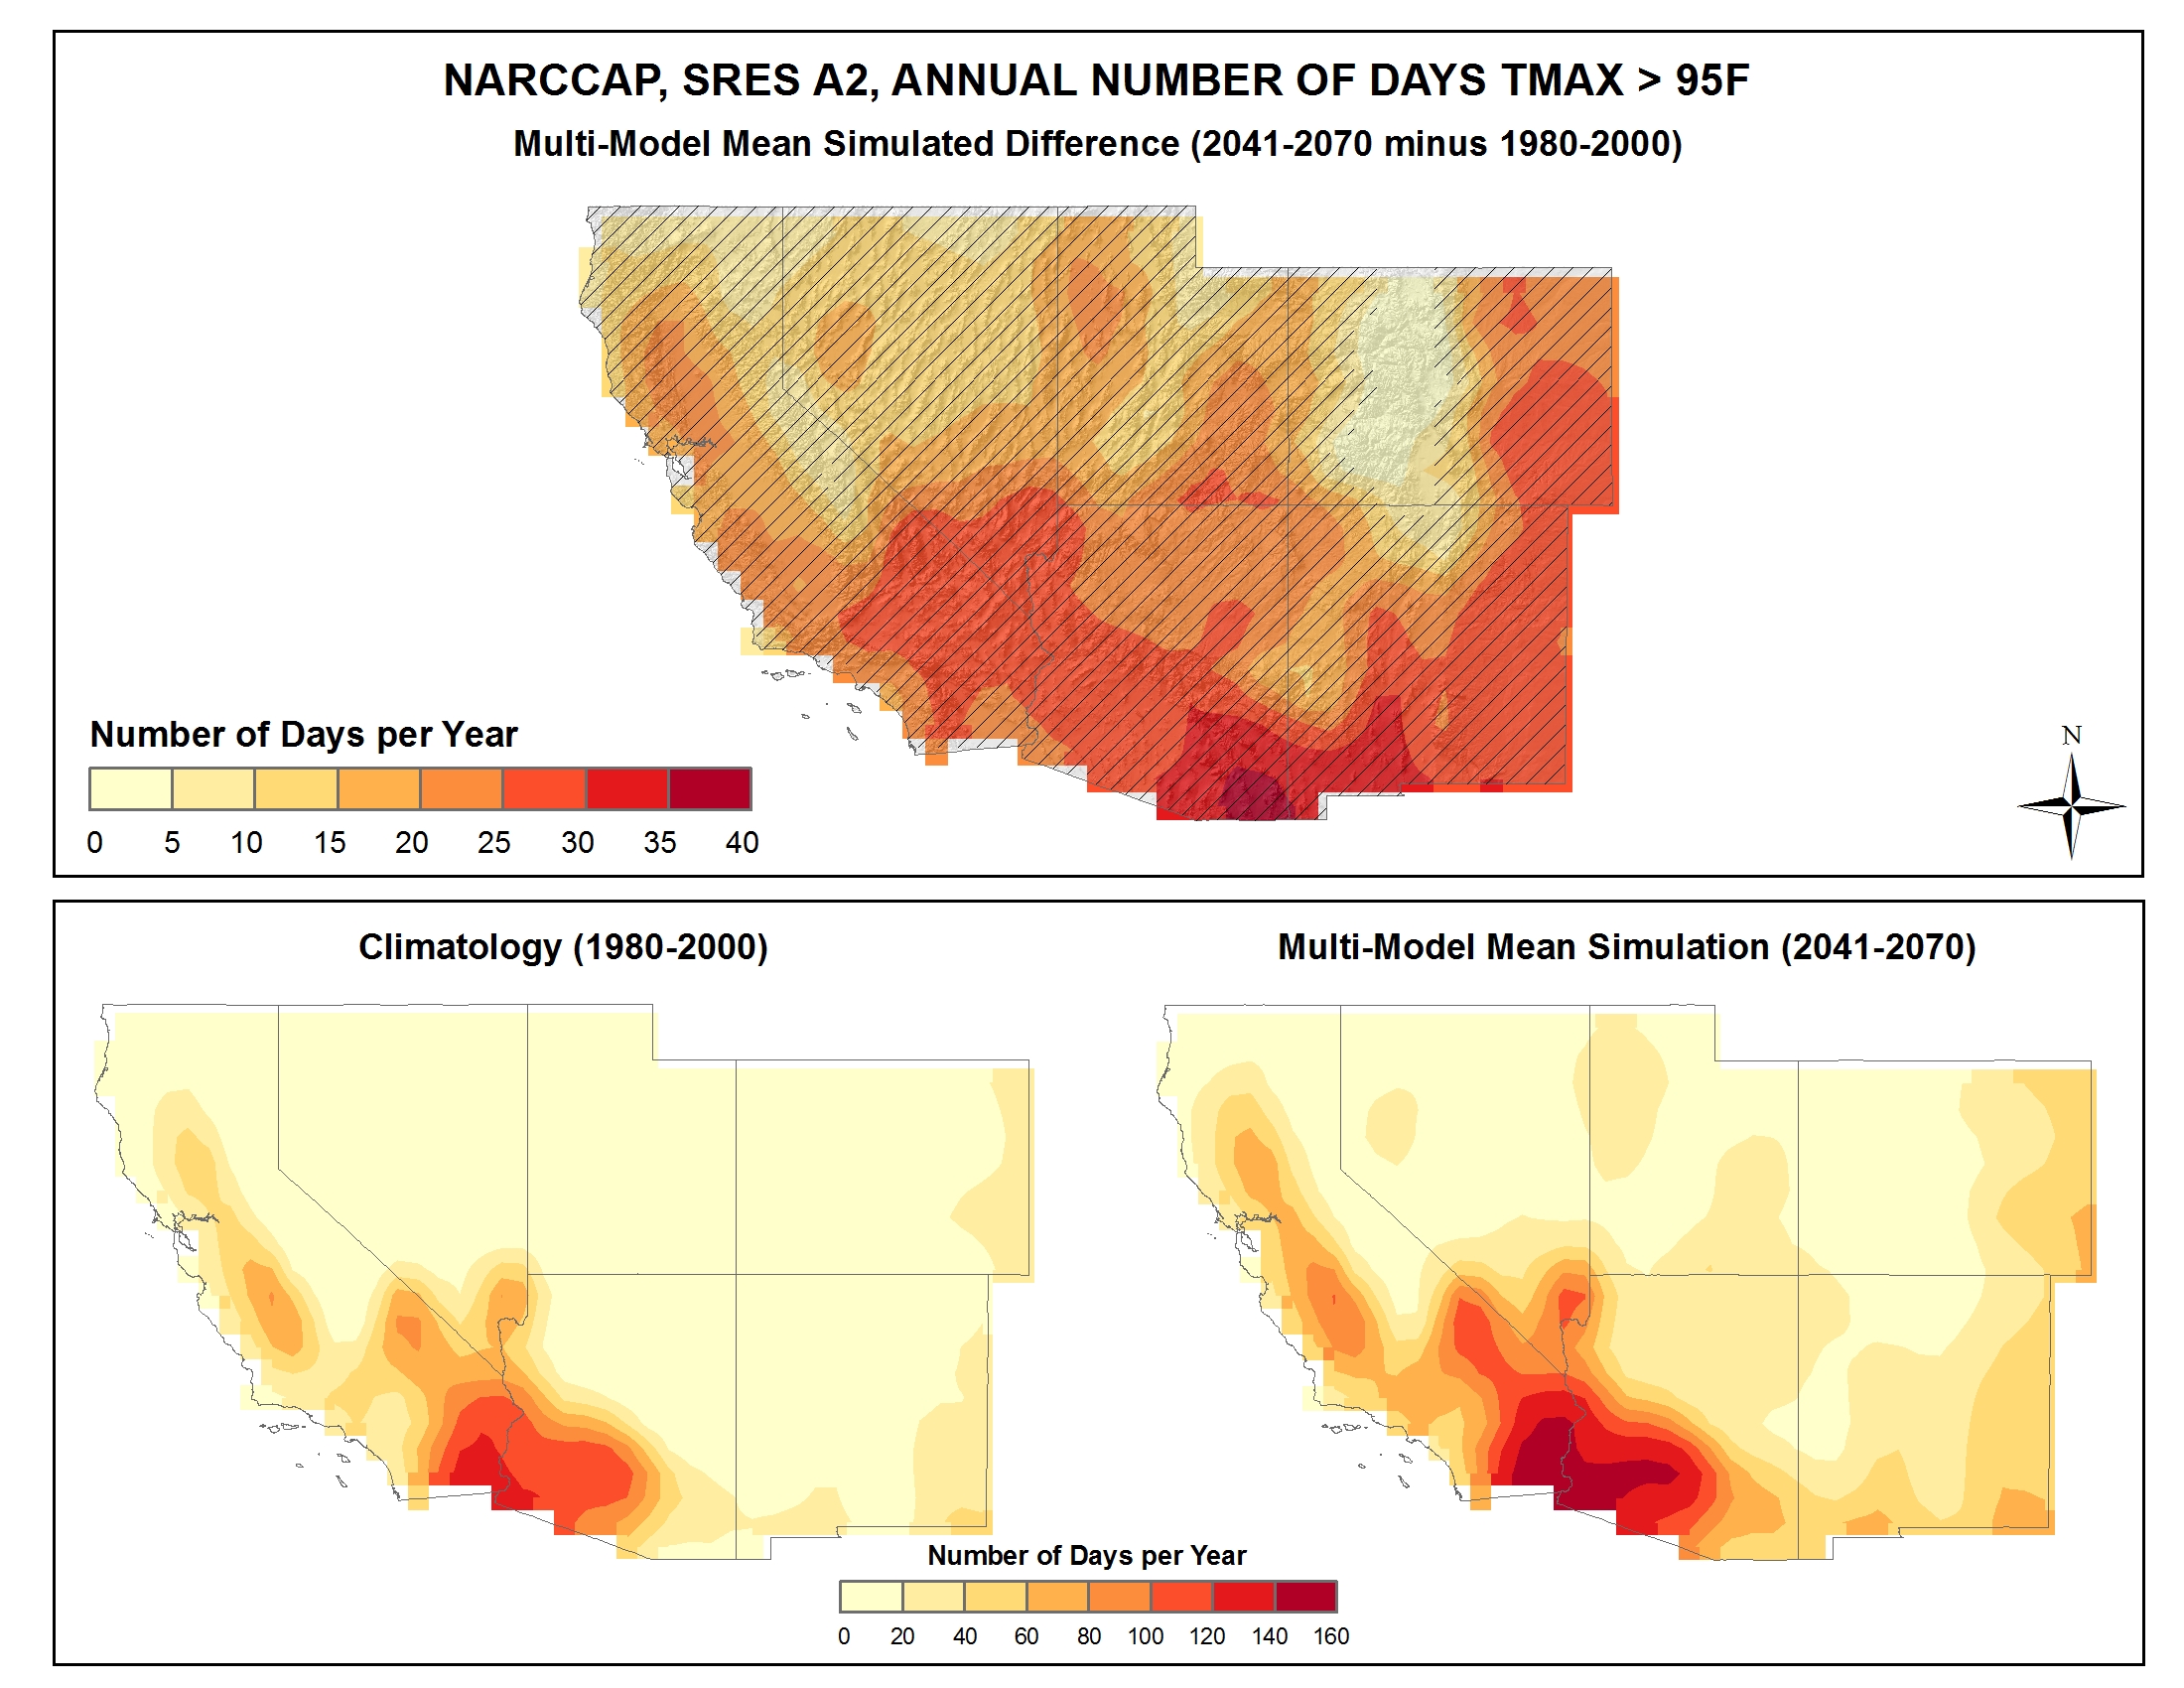
Simulated difference in the mean annual number of days with a maximum temperature greater than 95F |
Simulated |
Temperature |
Southwest |
Regional Climate Trends and Scenarios for the U.S. National Climate Assessment. Part 5. Climate of the Southwest U.S. |
NCA 3 |
 |
|
Simulated difference in the mean annual number of days with a maximum temperature greater than 95F |
Simulated |
Temperature |
Northwest |
Regional Climate Trends and Scenarios for the U.S. National Climate Assessment. Part 6. Climate of the Northwest U.S. |
NCA 3 |
 |
|
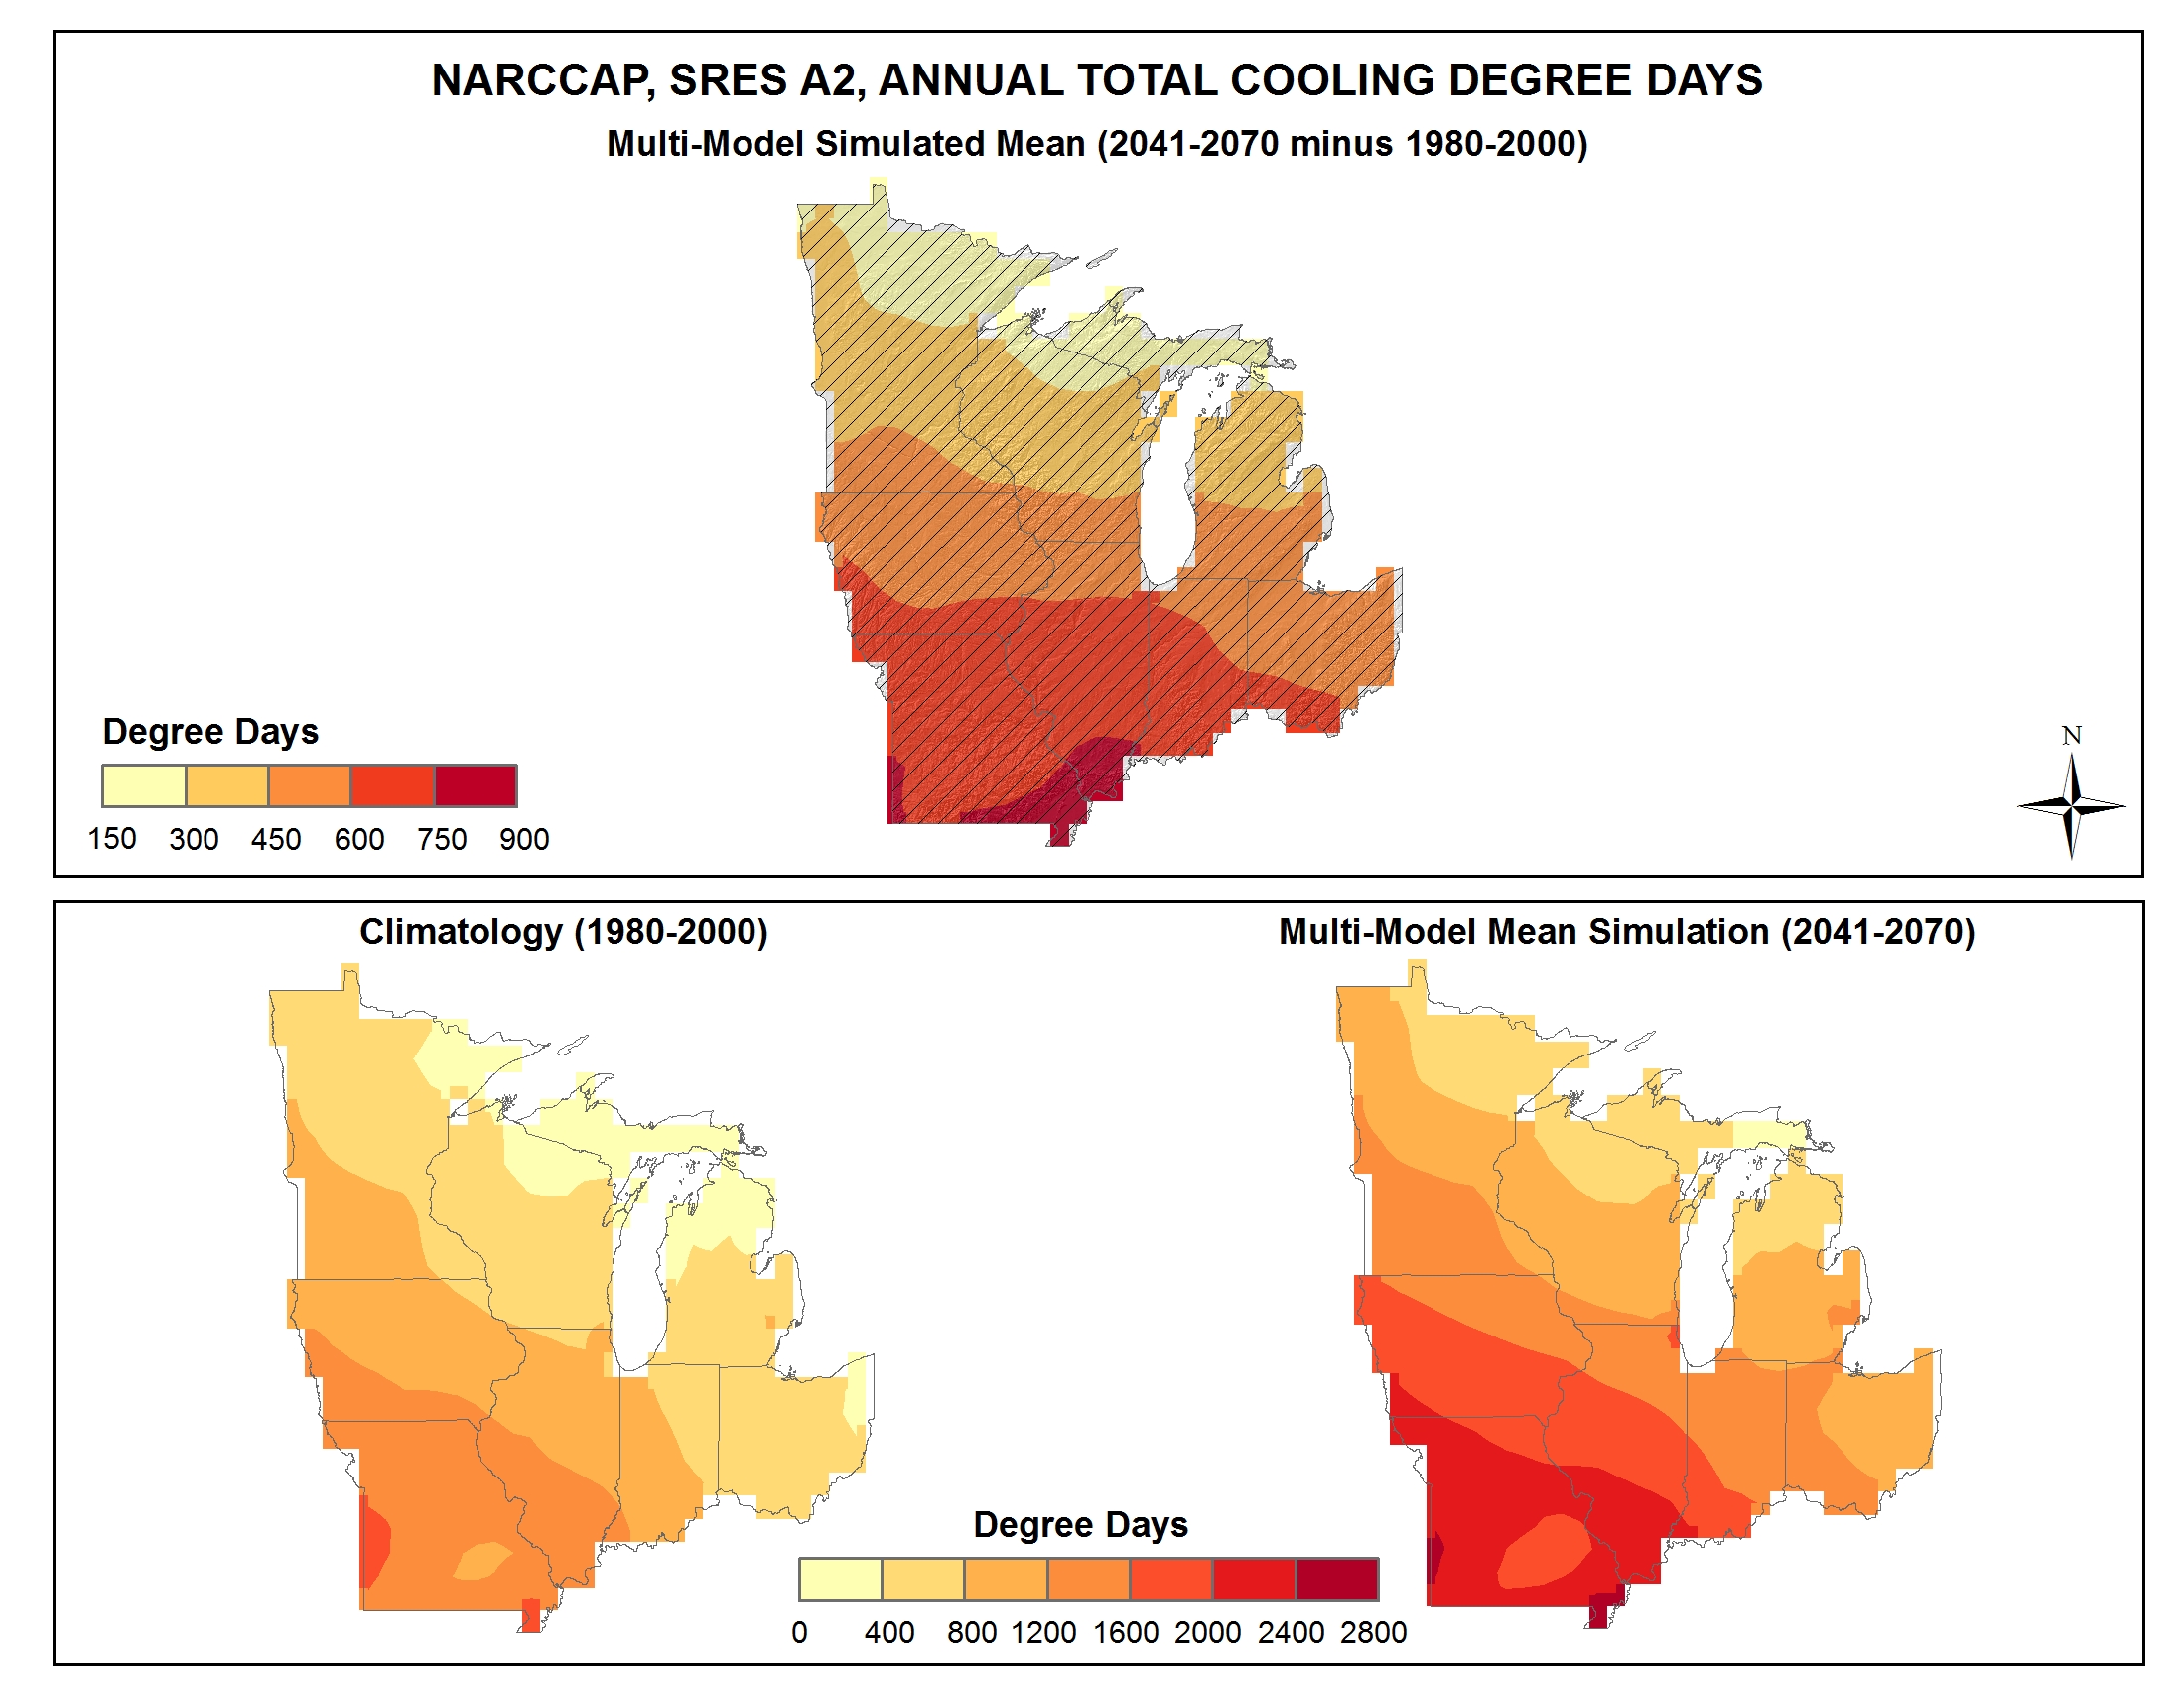
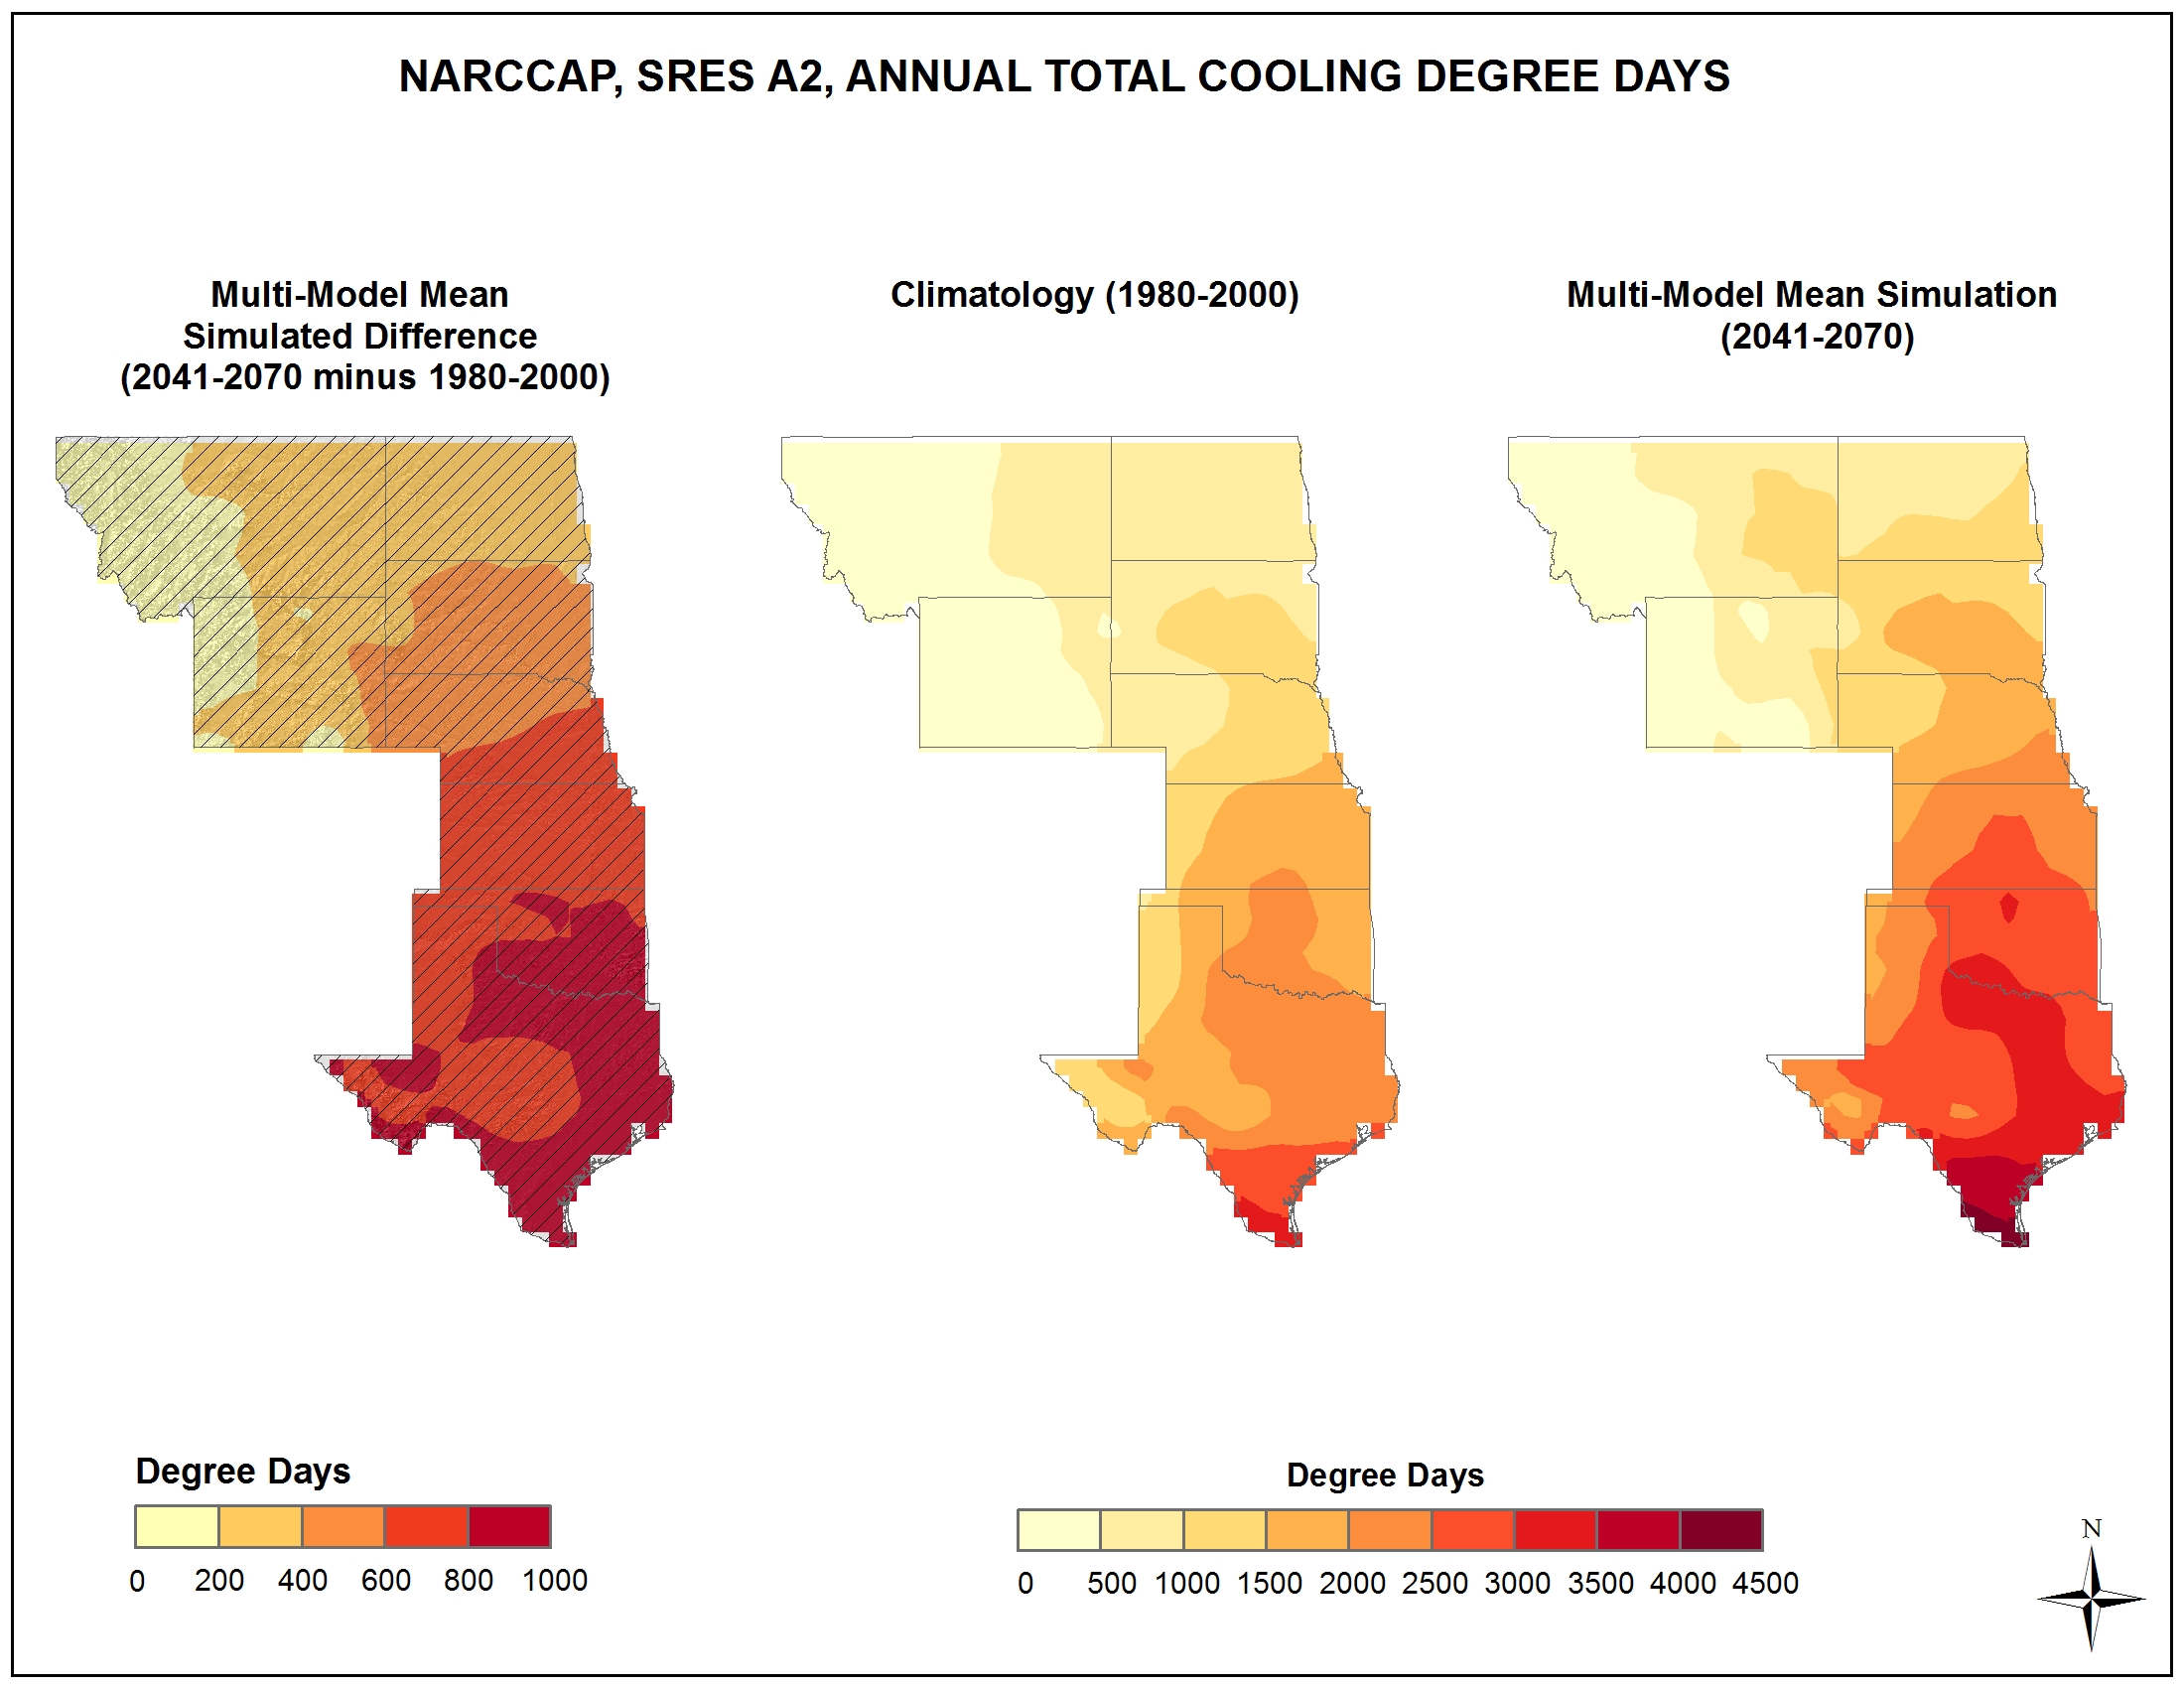
Simulated difference in the mean annual number of cooling degree days |
Simulated |
Temperature |
Midwest |
Regional Climate Trends and Scenarios for the U.S. National Climate Assessment. Part 3. Climate of the Midwest U.S. |
NCA 3 |
 |
|
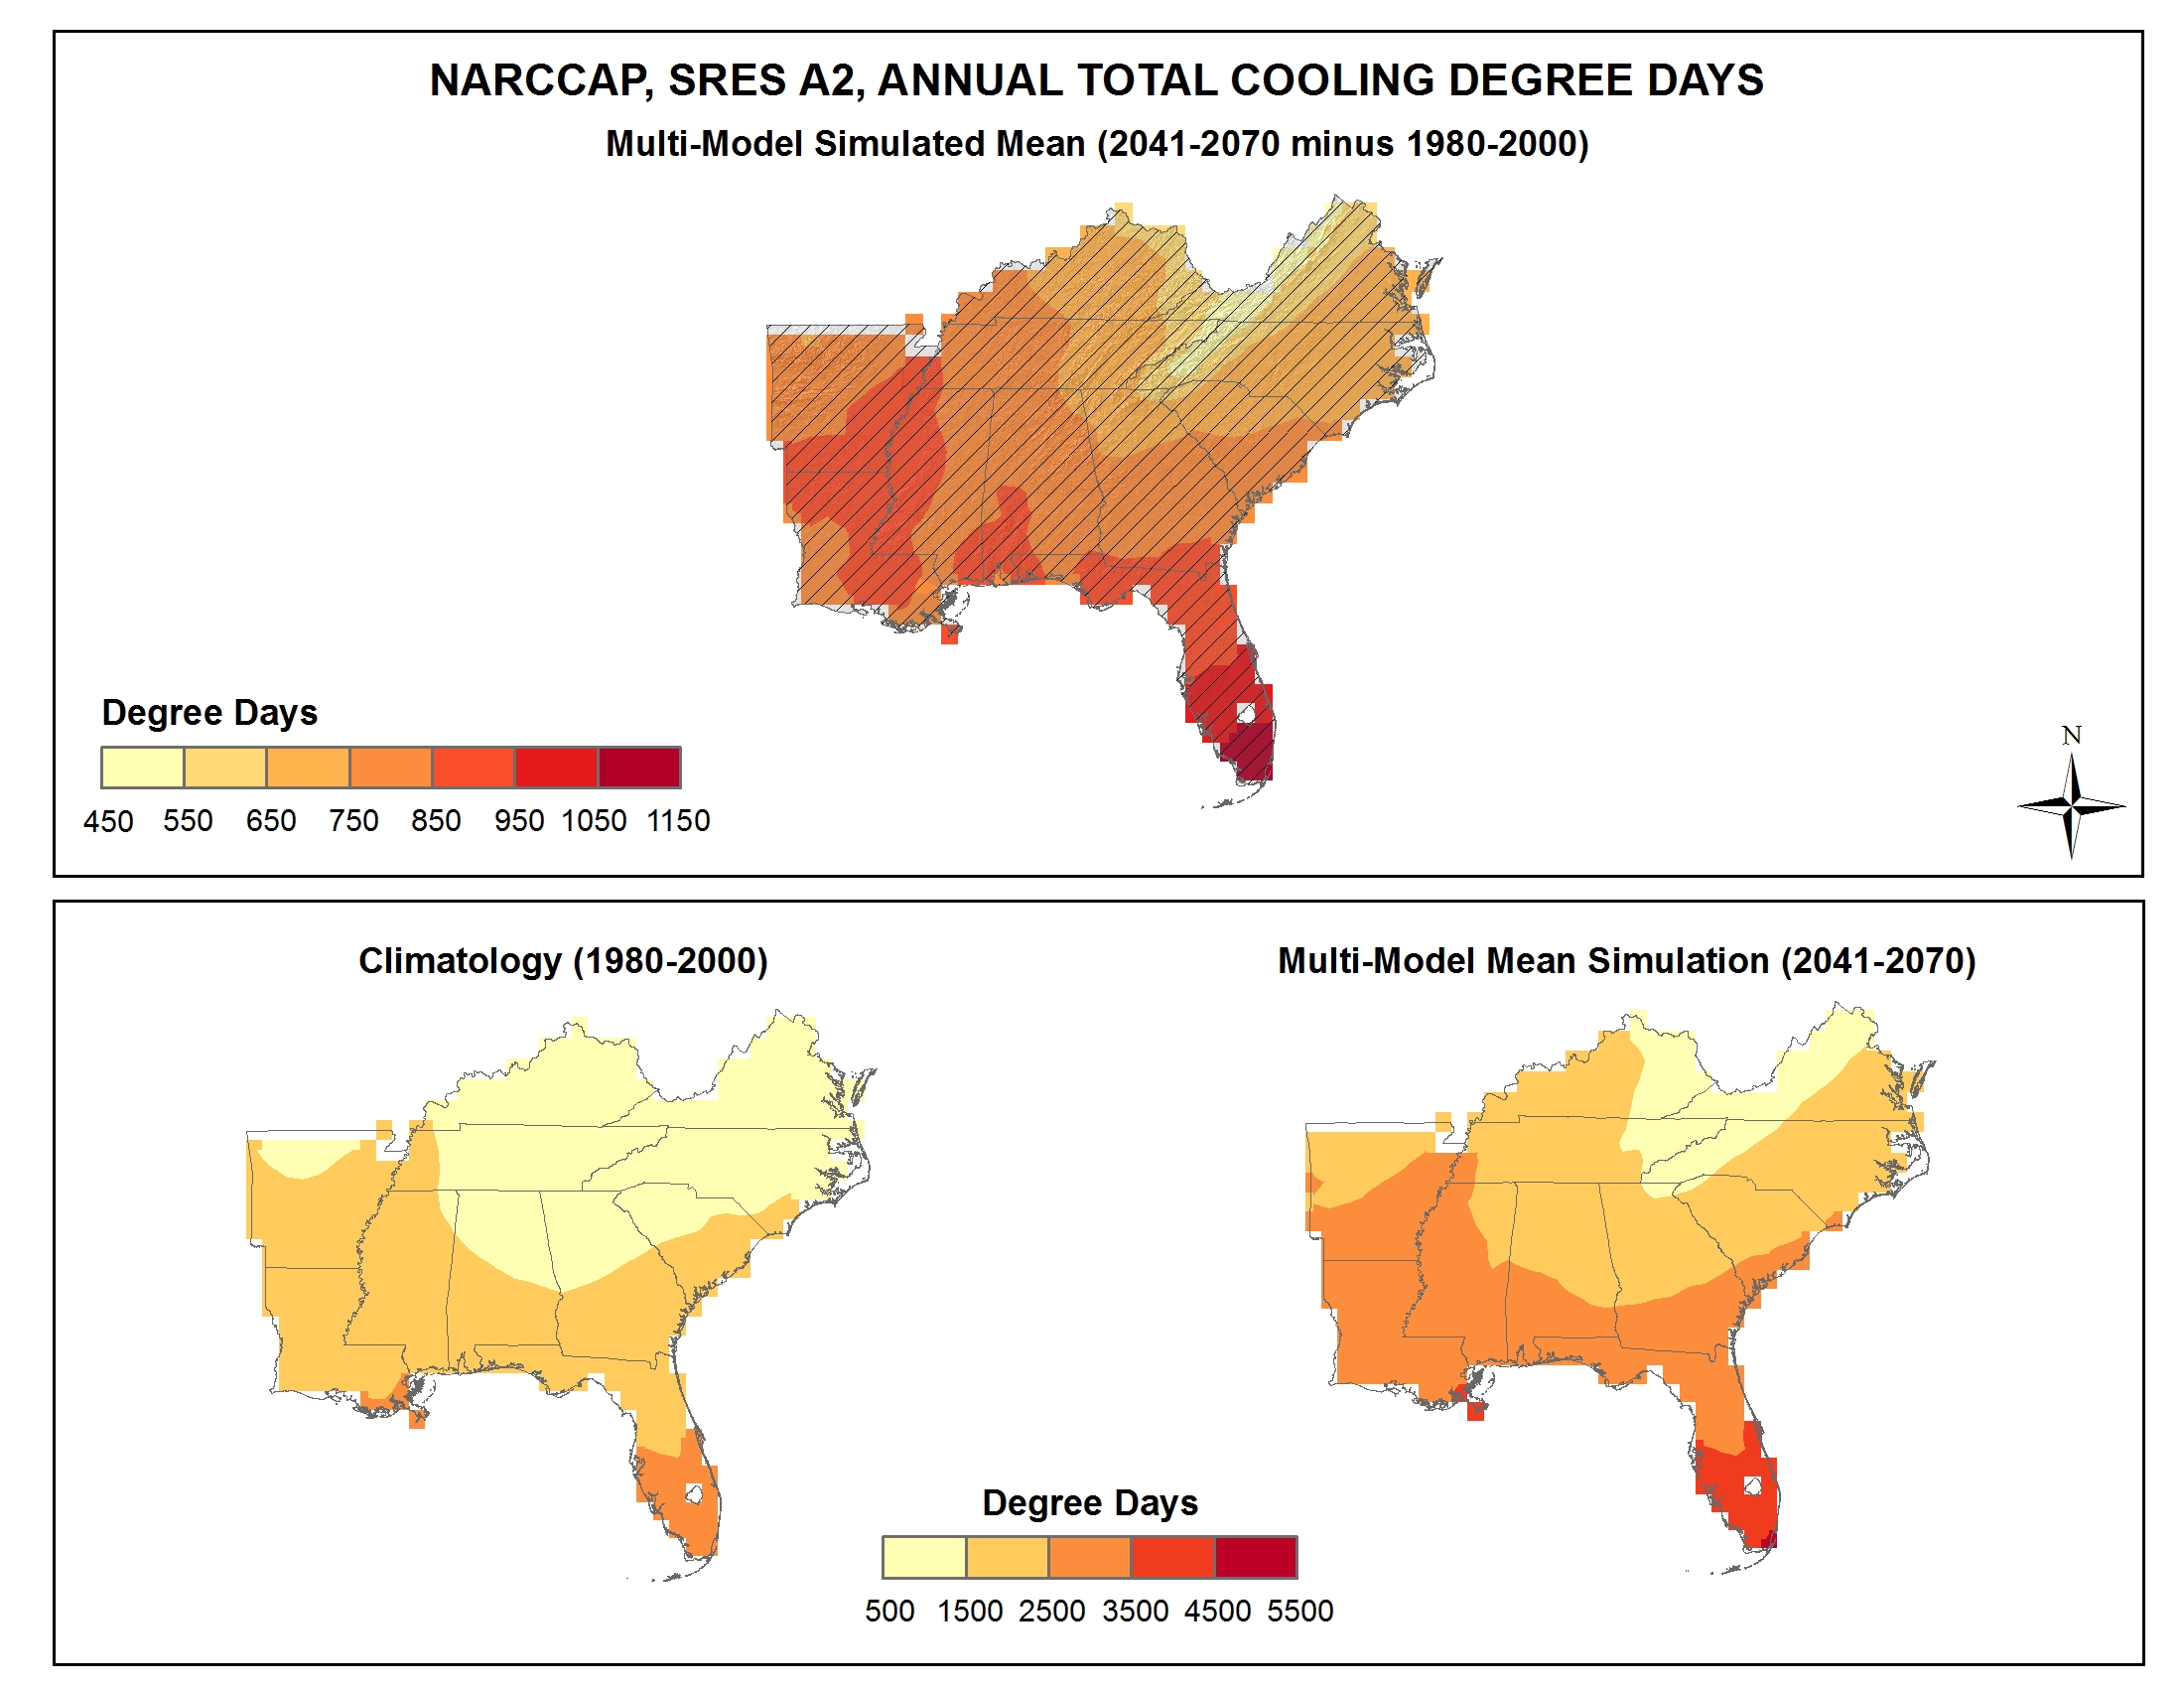
Simulated difference in the mean annual number of cooling degree days |
Simulated |
Temperature |
Southeast and Caribbean |
Regional Climate Trends and Scenarios for the U.S. National Climate Assessment. Part 2. Climate of the Southeast U.S. |
NCA 3 |
 |
|
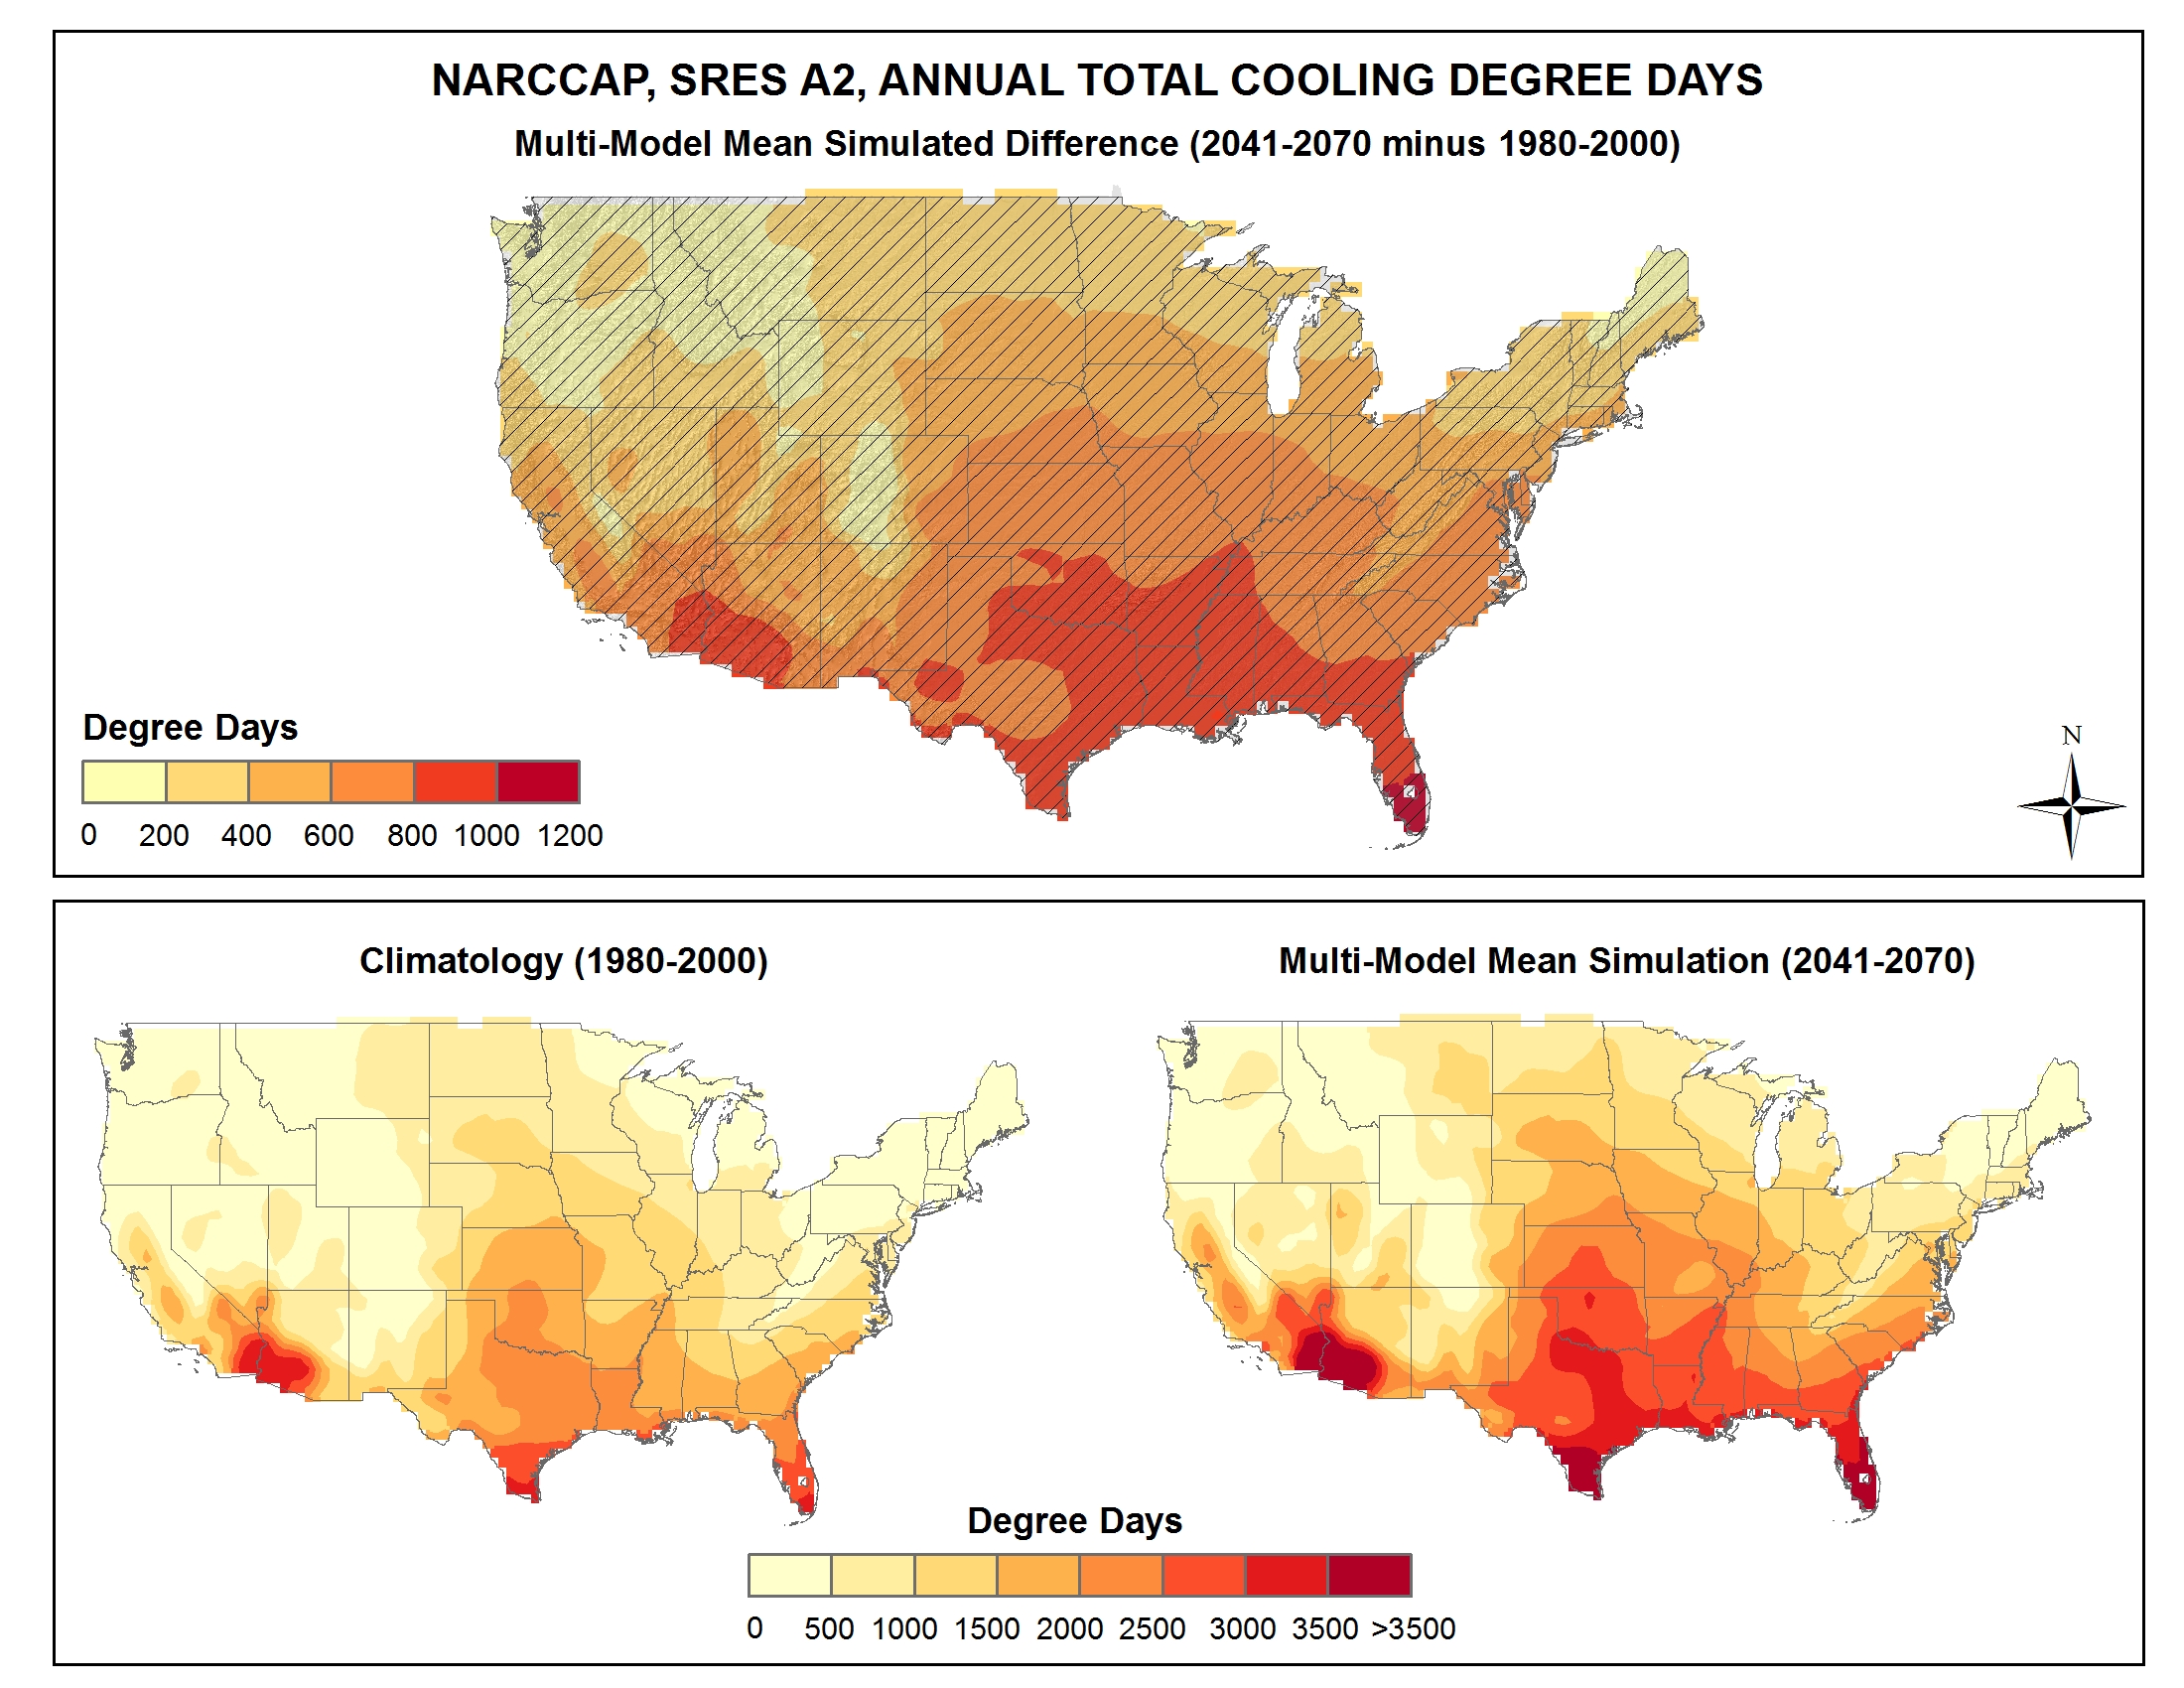
Simulated difference in the mean annual number of cooling degree days |
Simulated |
Temperature |
National |
Regional Climate Trends and Scenarios for the U.S. National Climate Assessment. Part 9. Climate of the Contiguous United States |
NCA 3 |
 |
|
Simulated difference in the mean annual number of cooling degree days |
Simulated |
Temperature |
Great Plains |
Regional Climate Trends and Scenarios for the U.S. National Climate Assessment. Part 4. Climate of the U.S. Great Plains |
NCA 3 |
 |
|
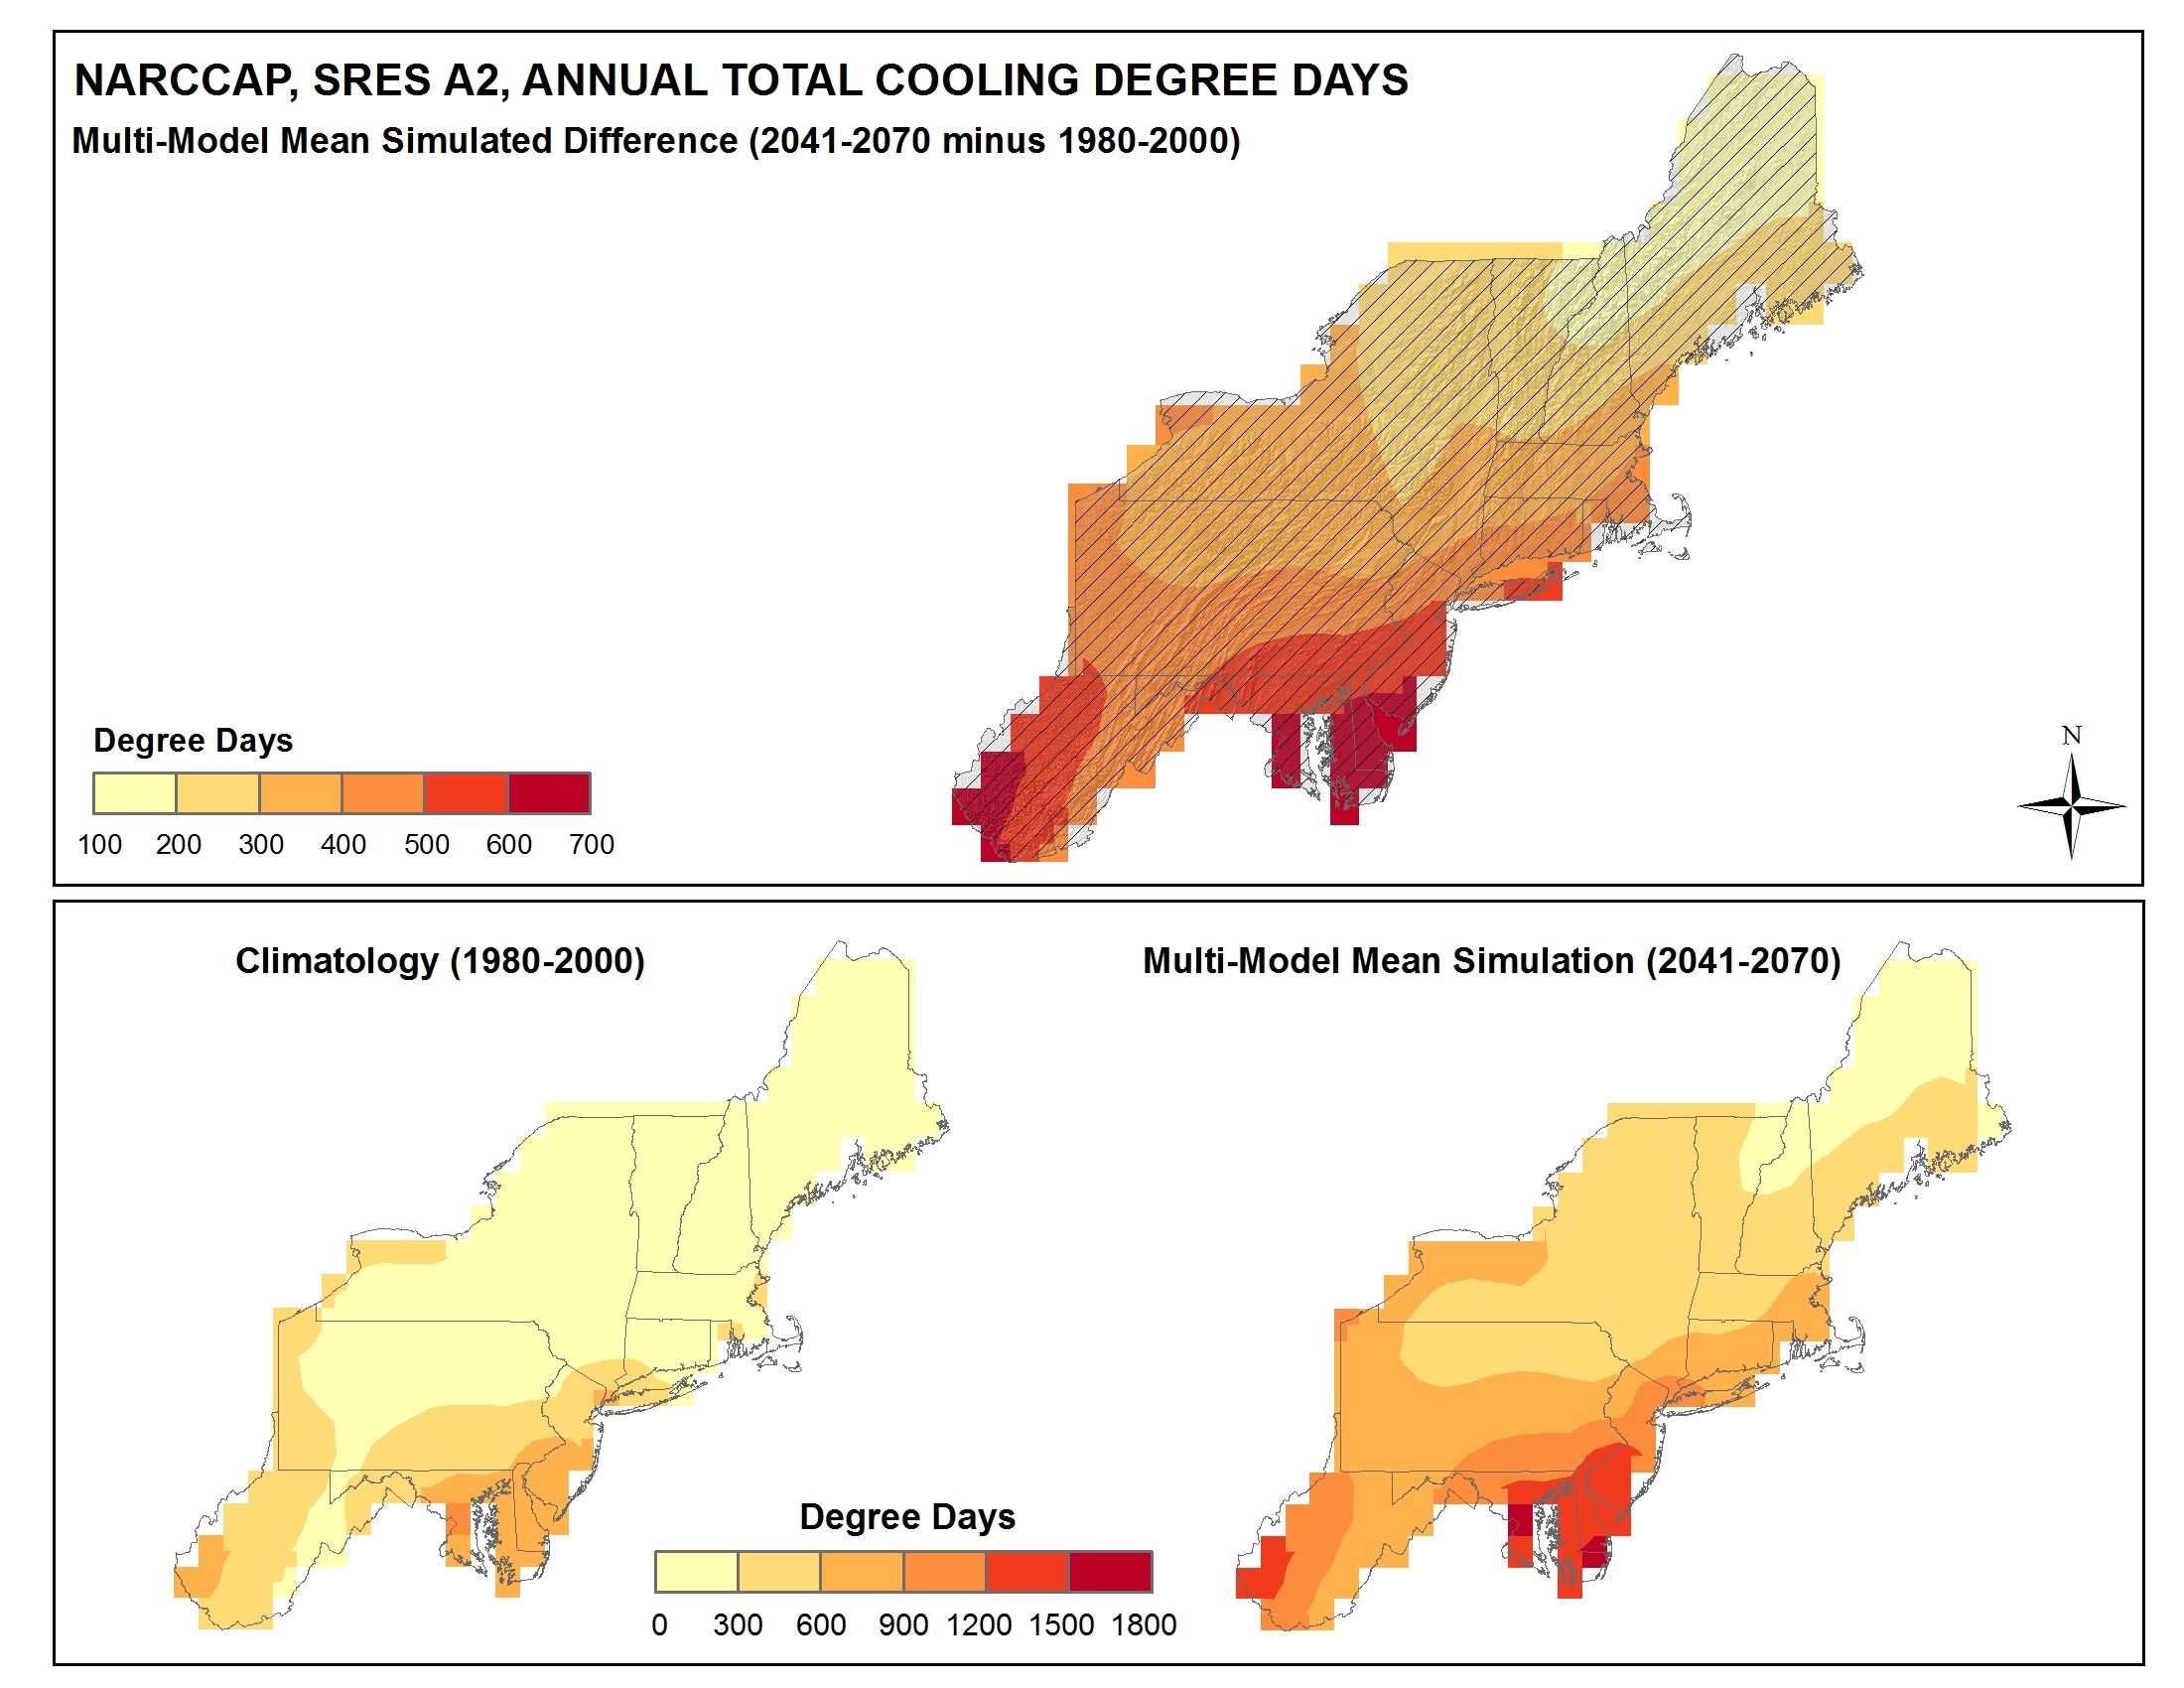
Simulated difference in the mean annual number of cooling degree days |
Simulated |
Temperature |
Northeast |
Regional Climate Trends and Scenarios for the U.S. National Climate Assessment. Part 1. Climate of the Northeast U.S. |
NCA 3 |
 |
|
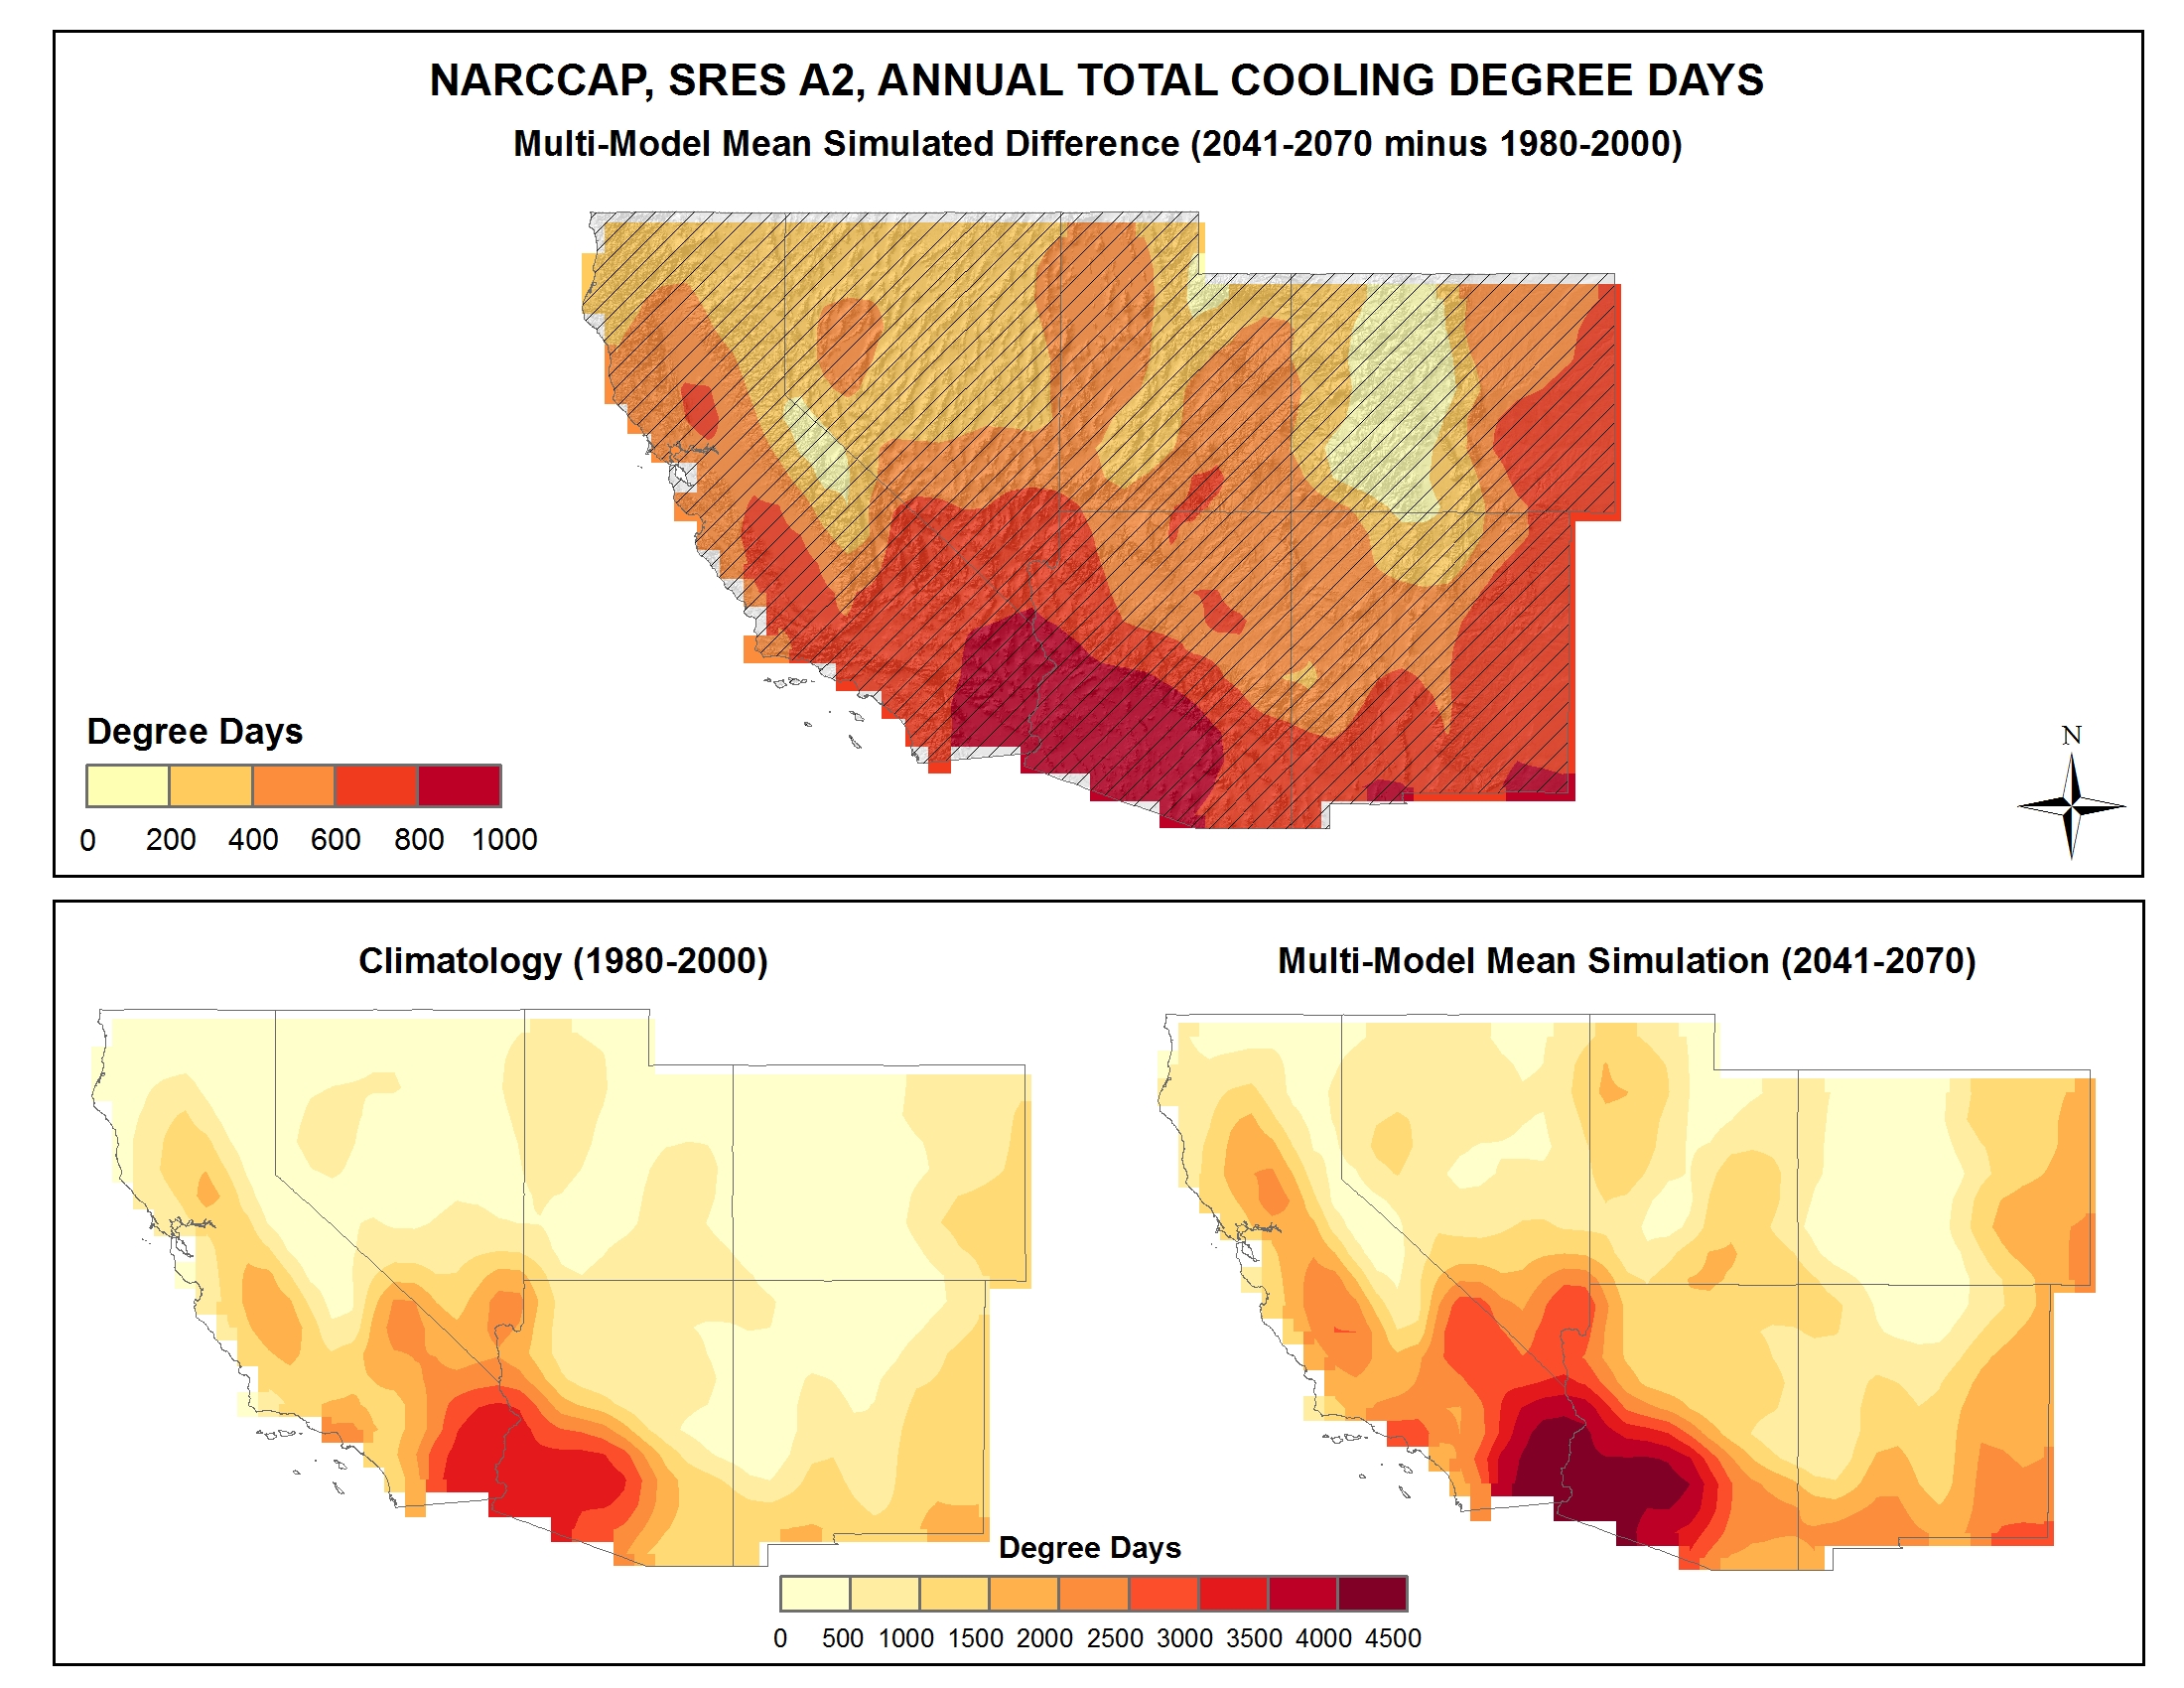
Simulated difference in the mean annual number of cooling degree days |
Simulated |
Temperature |
Southwest |
Regional Climate Trends and Scenarios for the U.S. National Climate Assessment. Part 5. Climate of the Southwest U.S. |
NCA 3 |
 |
|
Simulated difference in the mean annual number of cooling degree days |
Simulated |
Temperature |
Northwest |
Regional Climate Trends and Scenarios for the U.S. National Climate Assessment. Part 6. Climate of the Northwest U.S. |
NCA 3 |
 |
|
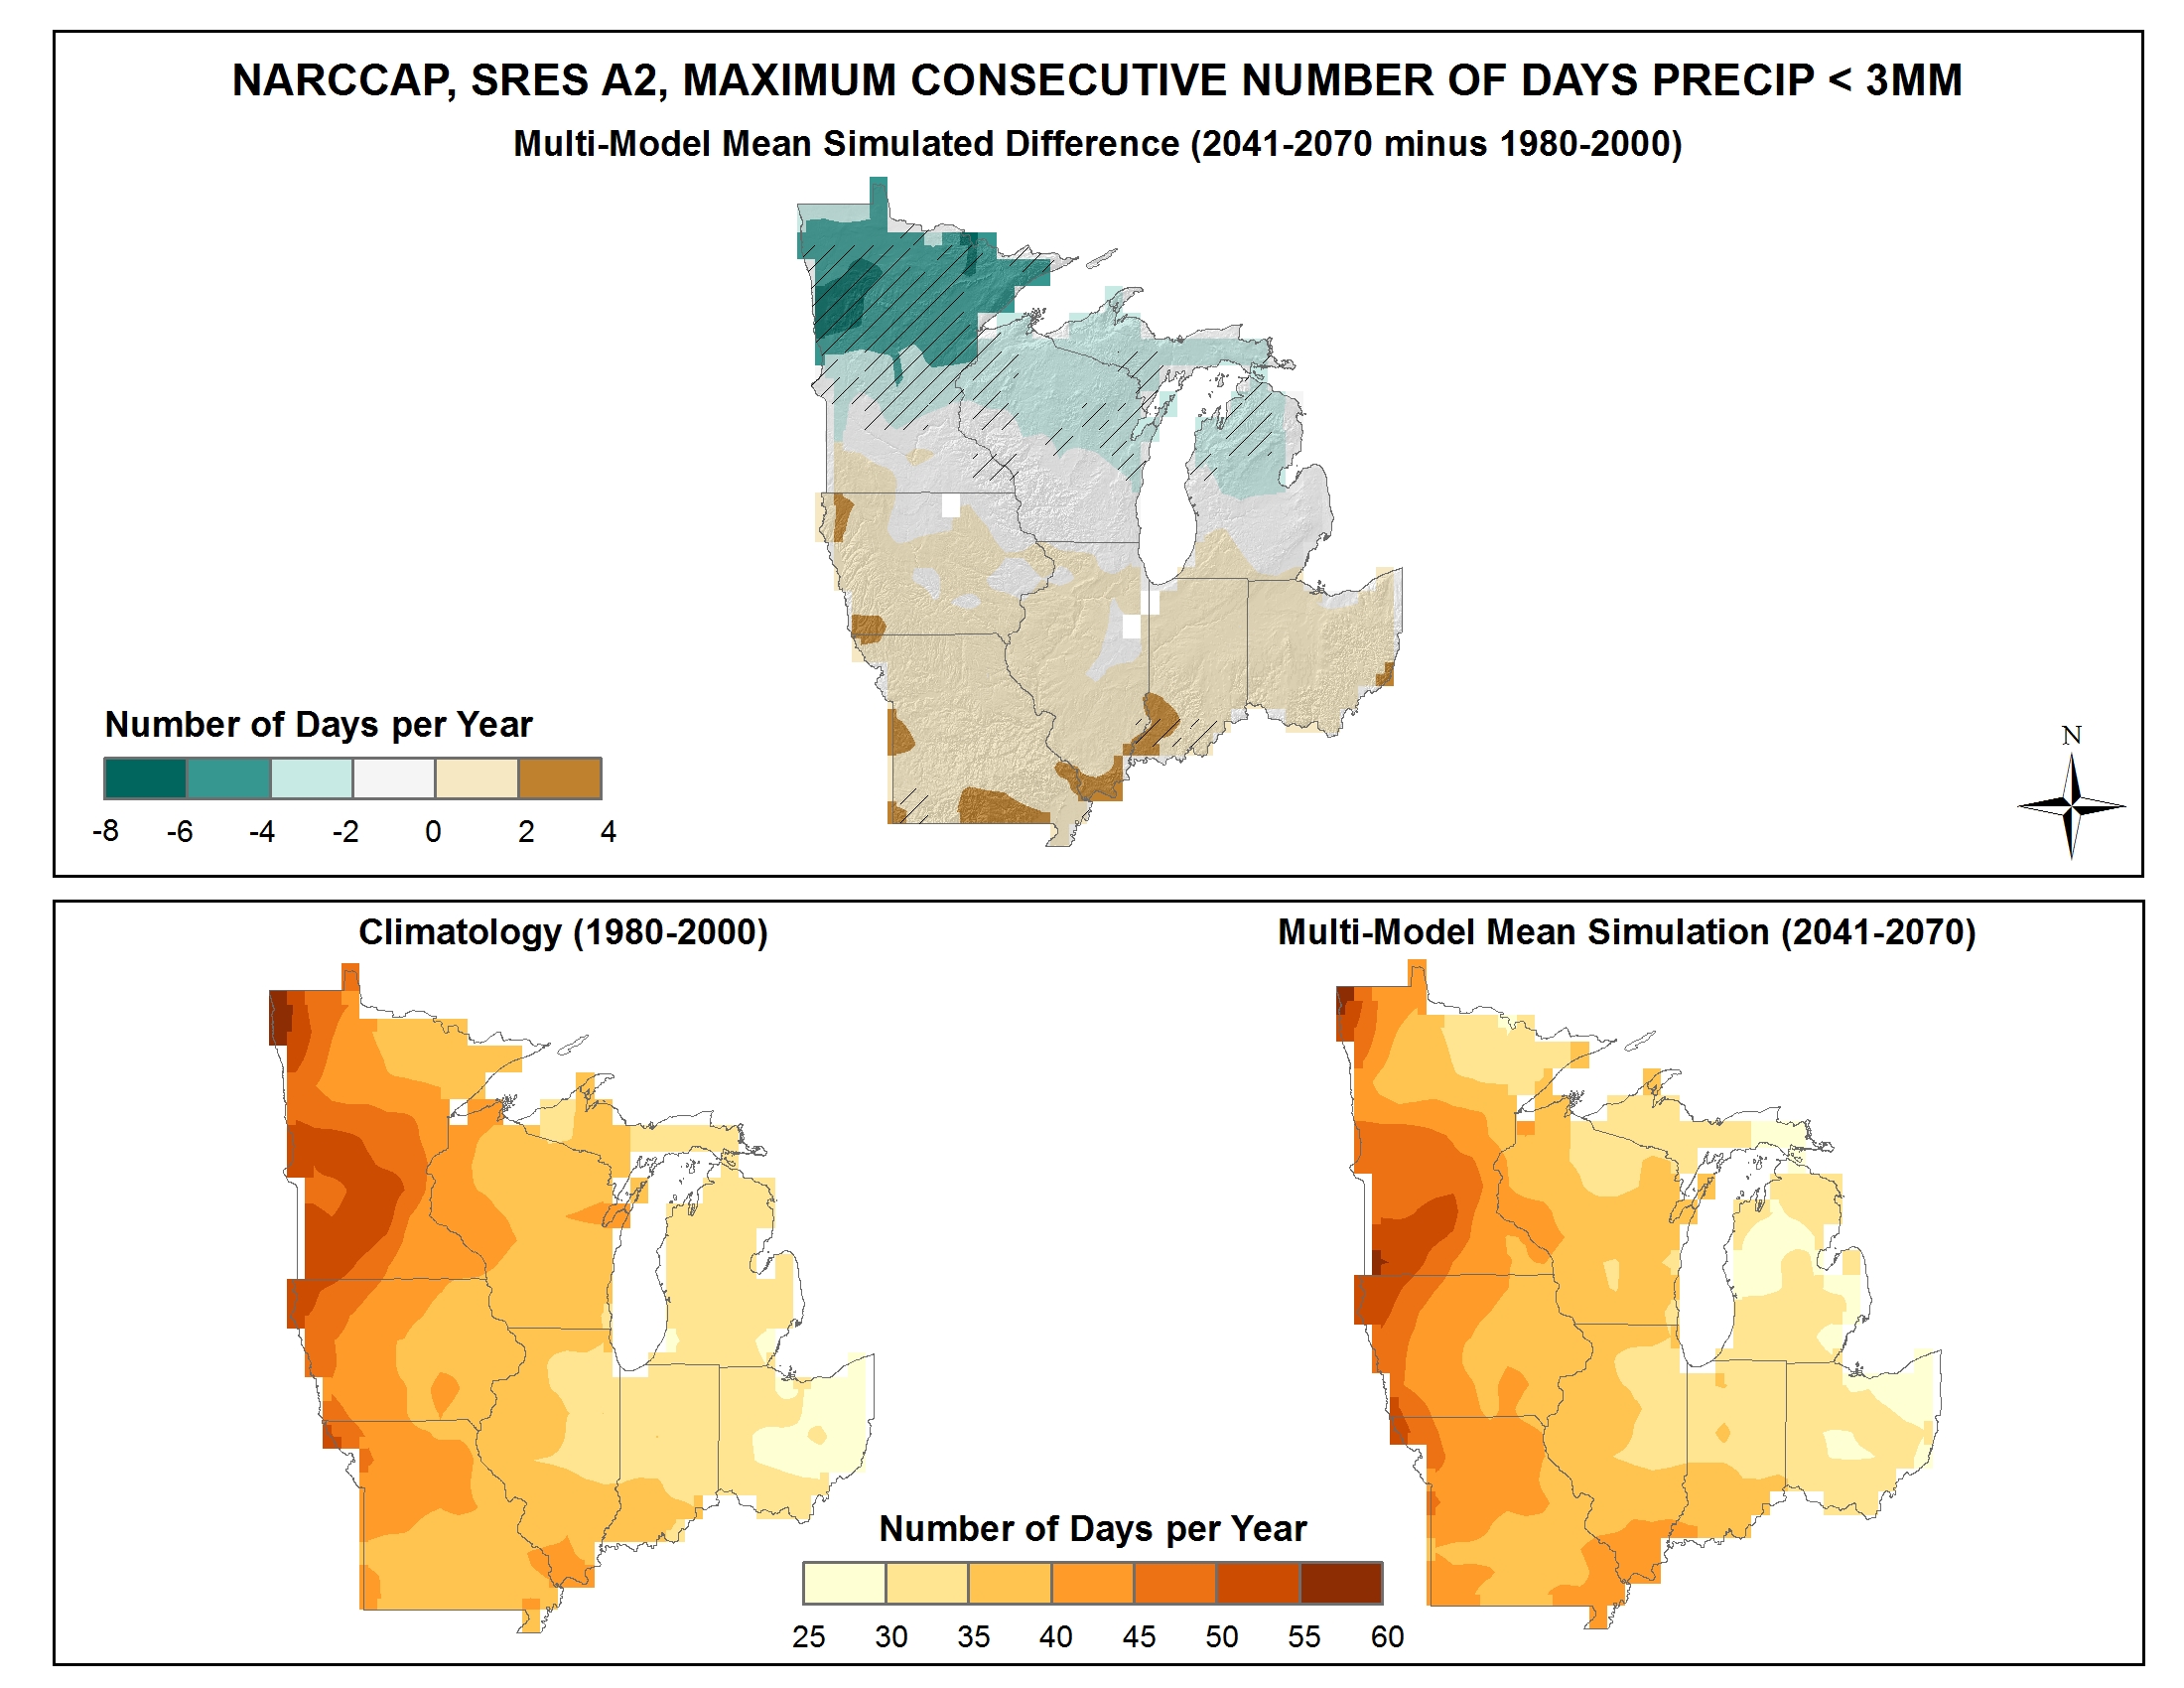
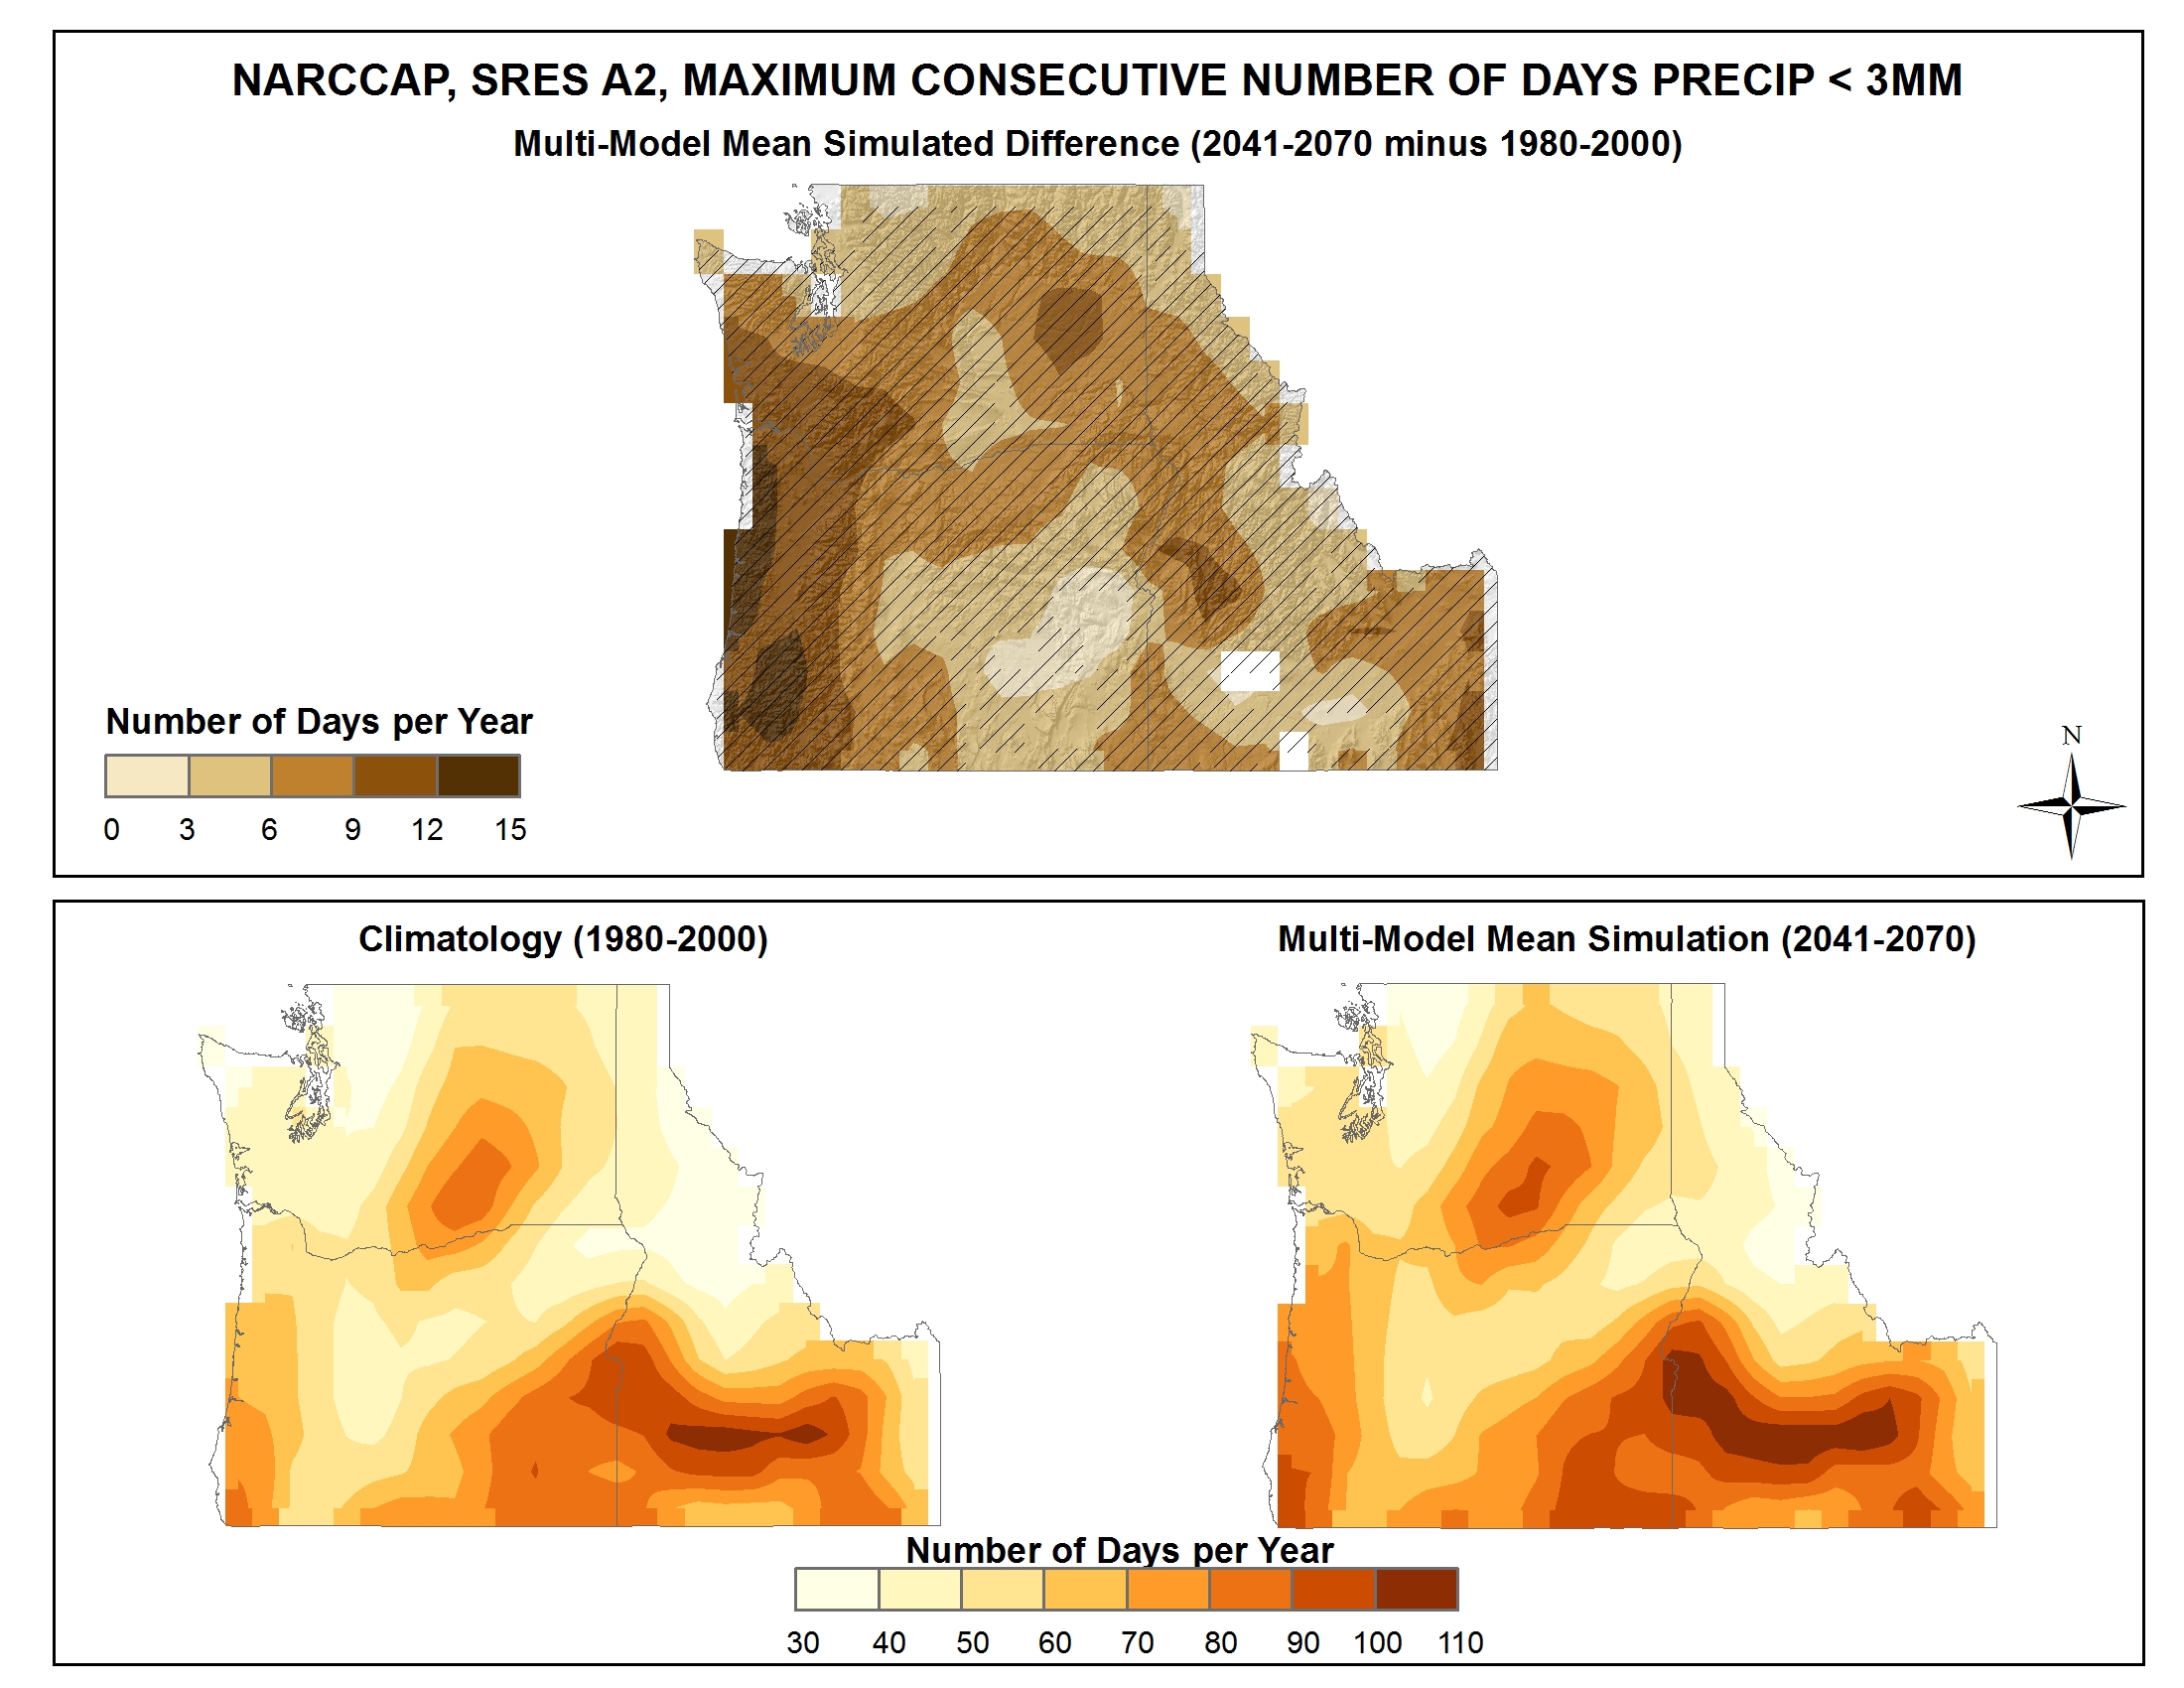
Simulated difference in the mean annual maximum number of consecutive days with precipitation of less than 0.1 inches |
Simulated |
Precipitation |
Midwest |
Regional Climate Trends and Scenarios for the U.S. National Climate Assessment. Part 3. Climate of the Midwest U.S. |
NCA 3 |
 |
|
Simulated difference in the mean annual maximum number of consecutive days with precipitation of less than 0.1 inches |
Simulated |
Precipitation |
Southeast and Caribbean |
Regional Climate Trends and Scenarios for the U.S. National Climate Assessment. Part 2. Climate of the Southeast U.S. |
NCA 3 |
 |
|
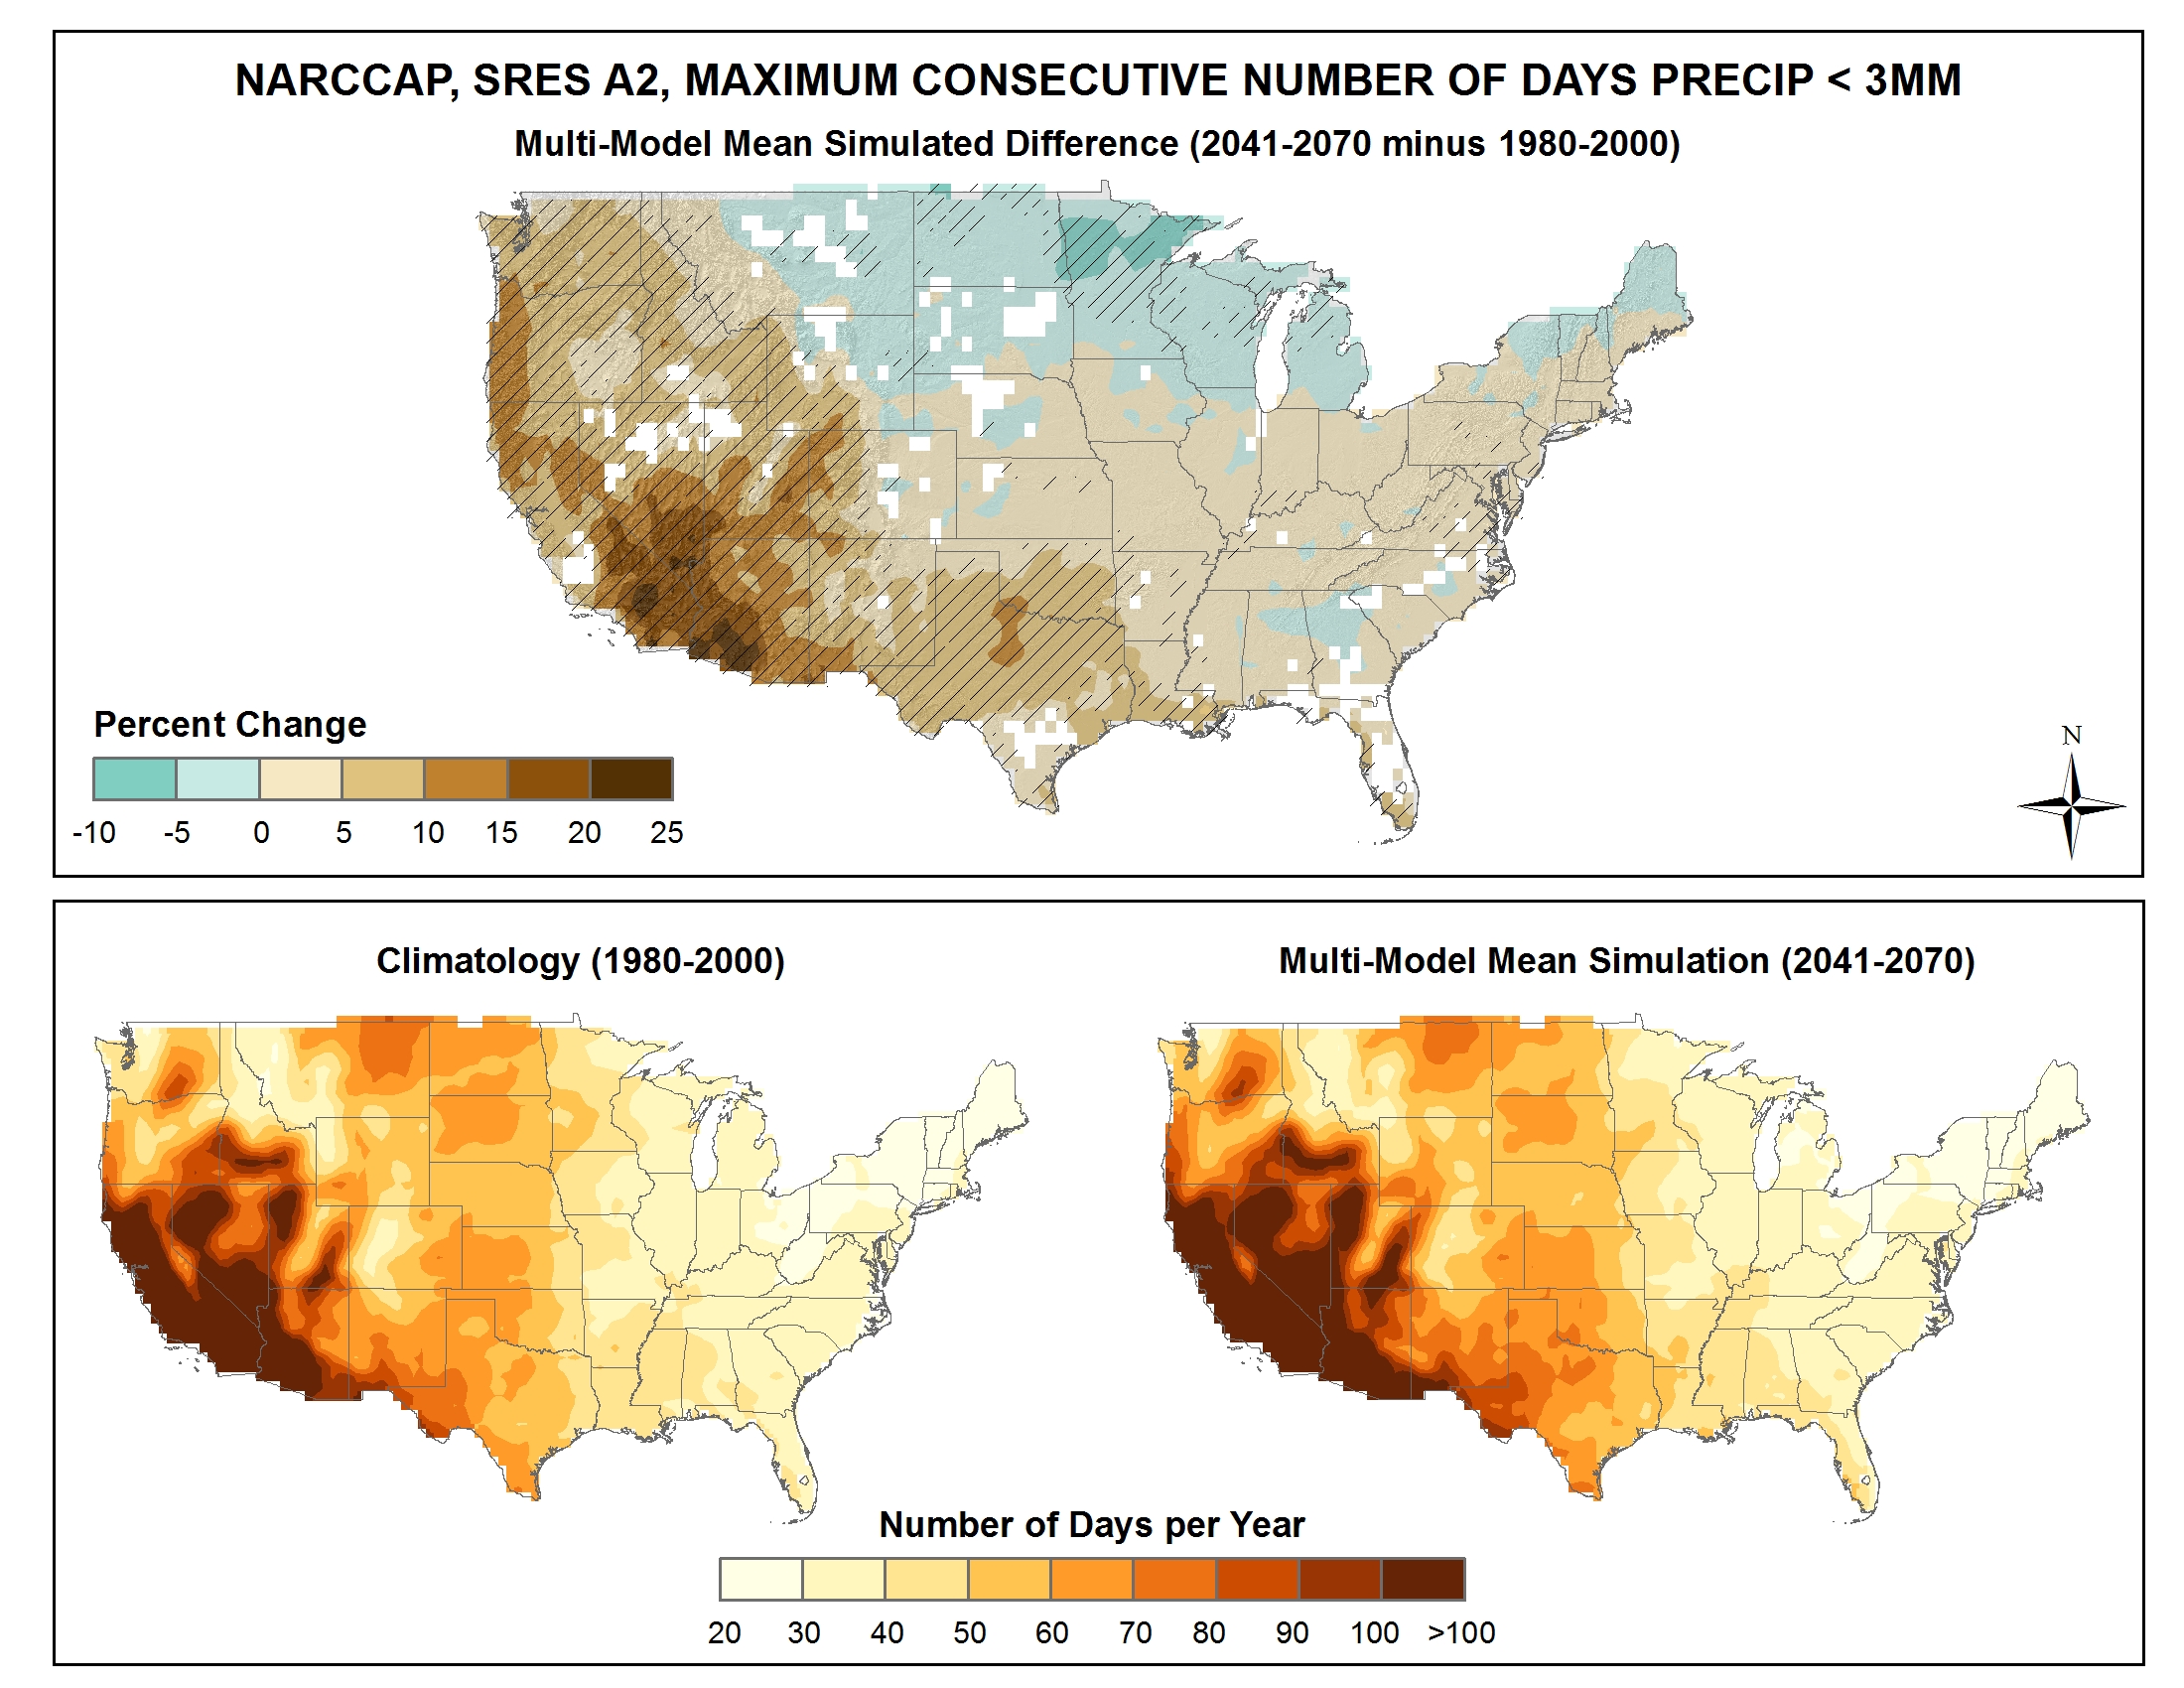
Simulated difference in the mean annual maximum number of consecutive days with precipitation of less than 0.1 inches |
Simulated |
Precipitation |
National |
Regional Climate Trends and Scenarios for the U.S. National Climate Assessment. Part 9. Climate of the Contiguous United States |
NCA 3 |
 |
|
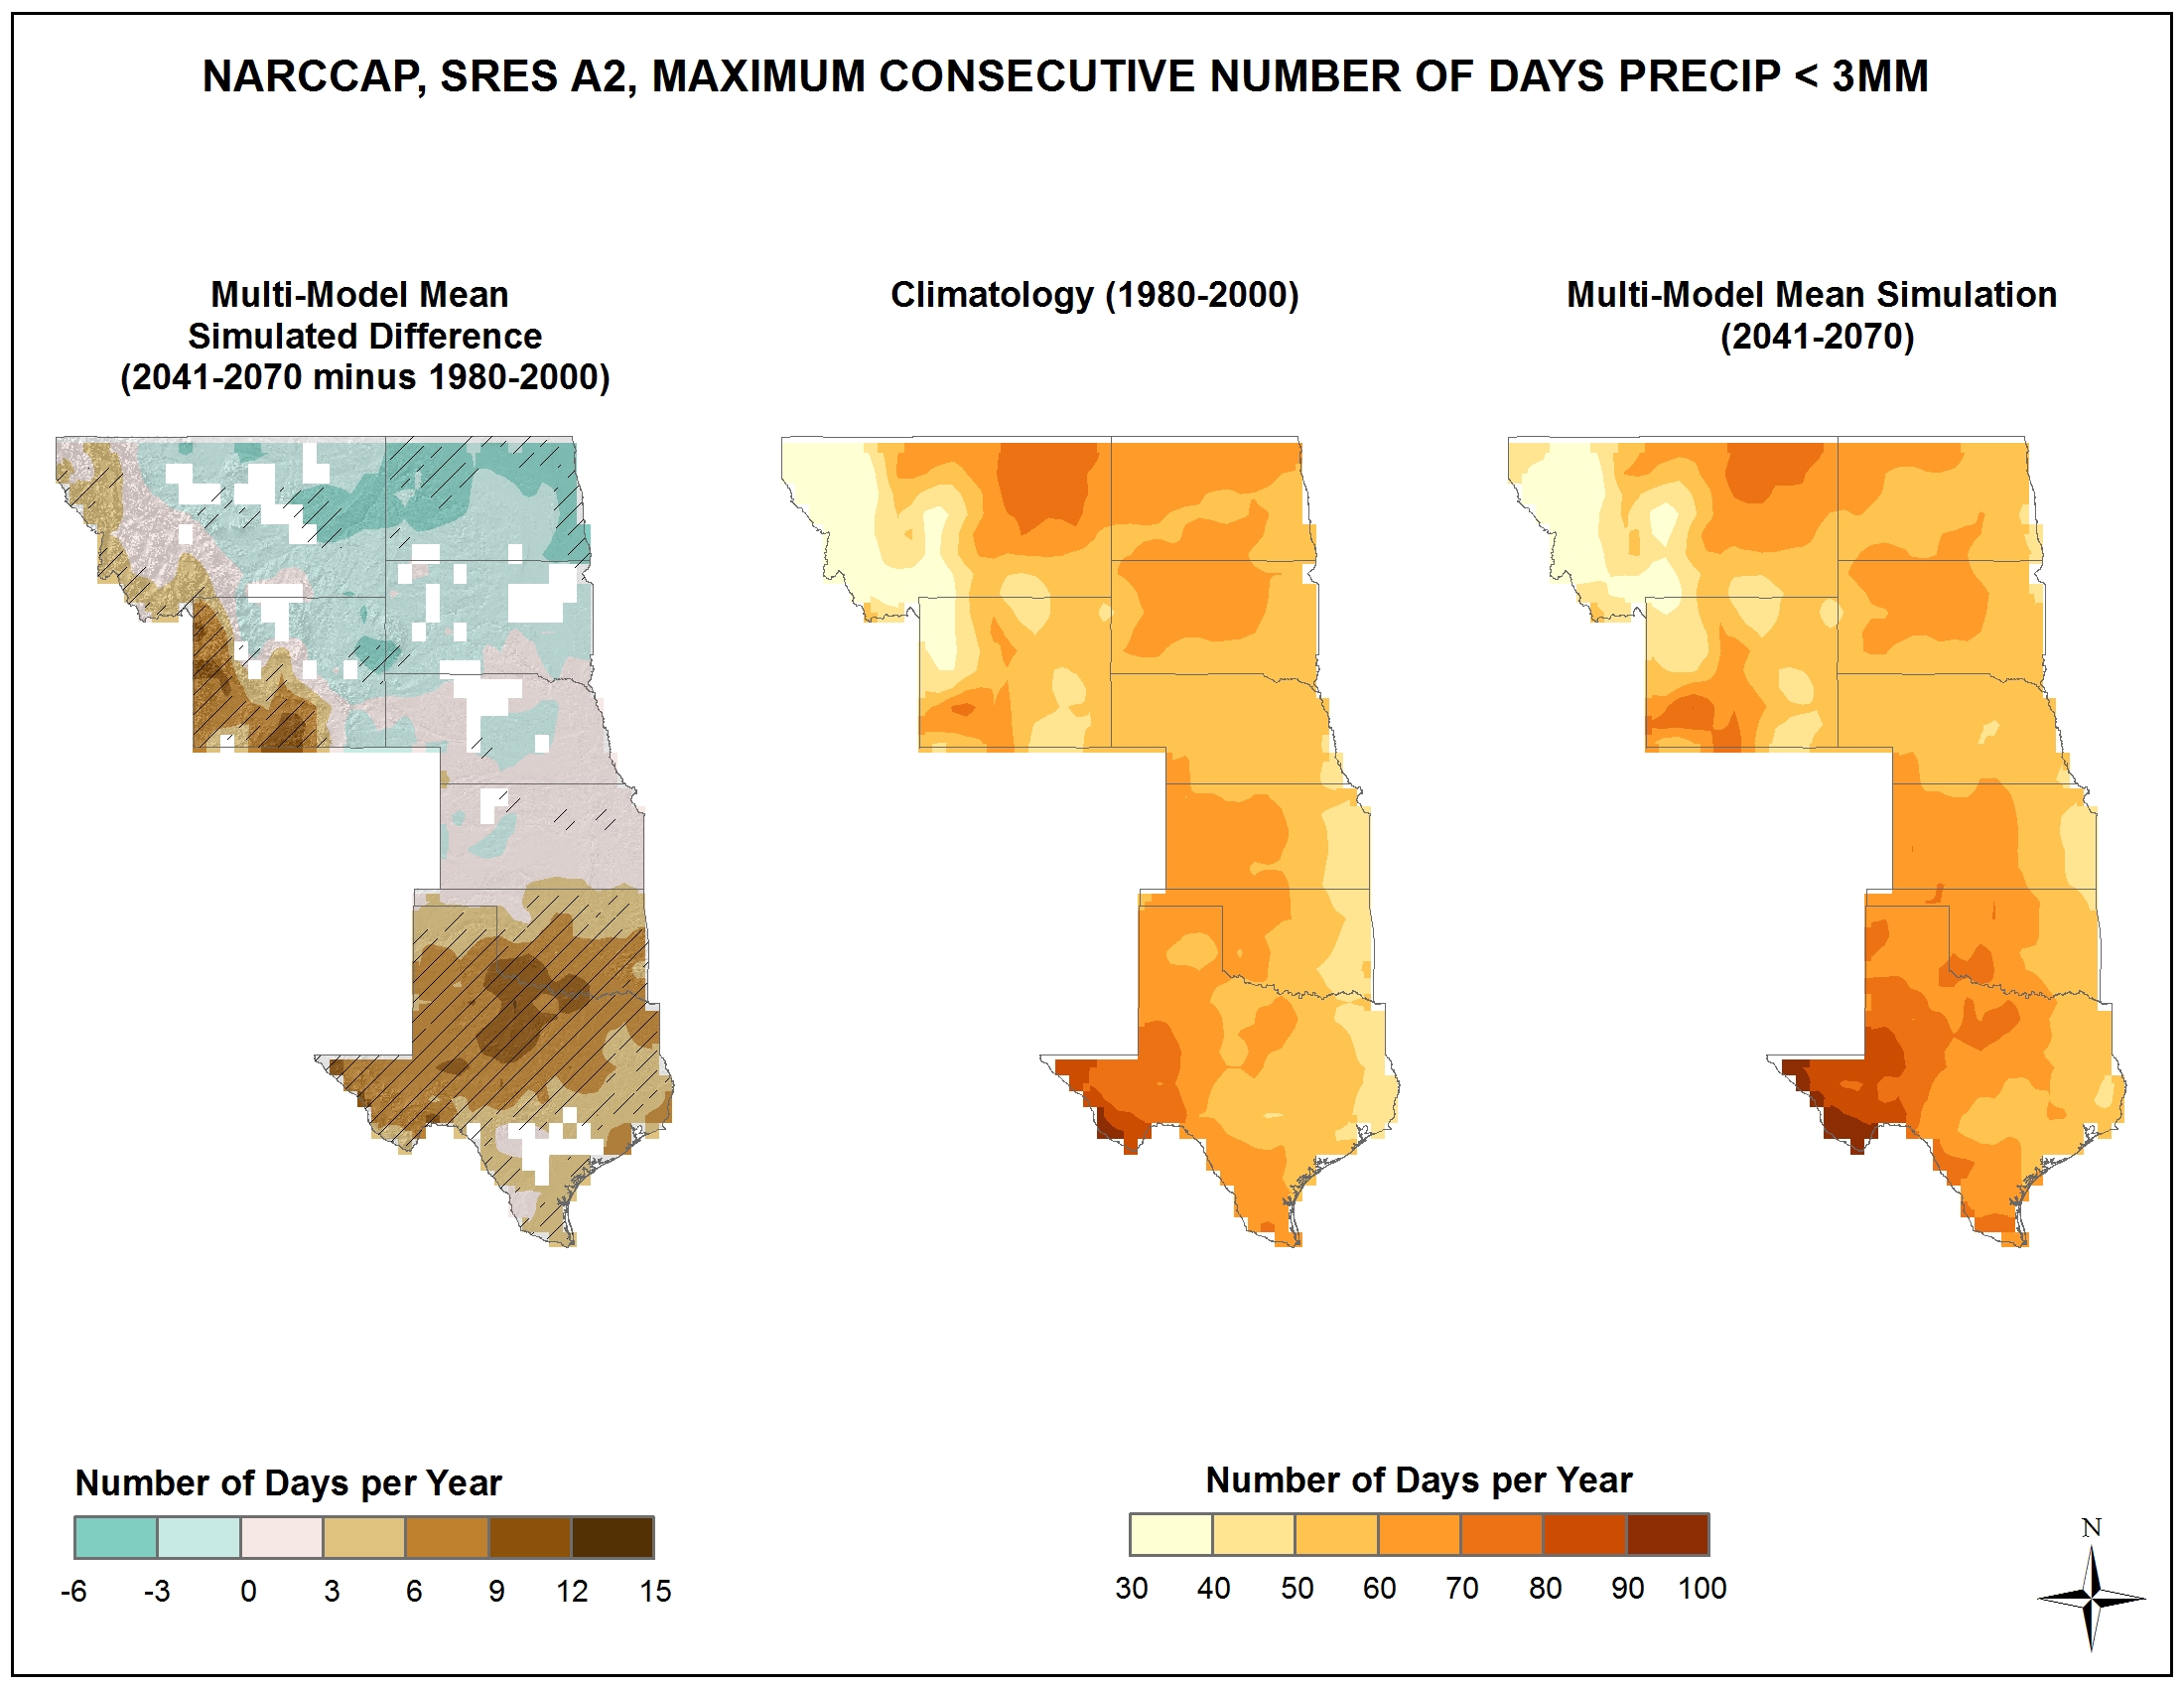
Simulated difference in the mean annual maximum number of consecutive days with precipitation of less than 0.1 inches |
Simulated |
Precipitation |
Great Plains |
Regional Climate Trends and Scenarios for the U.S. National Climate Assessment. Part 4. Climate of the U.S. Great Plains |
NCA 3 |
 |
|
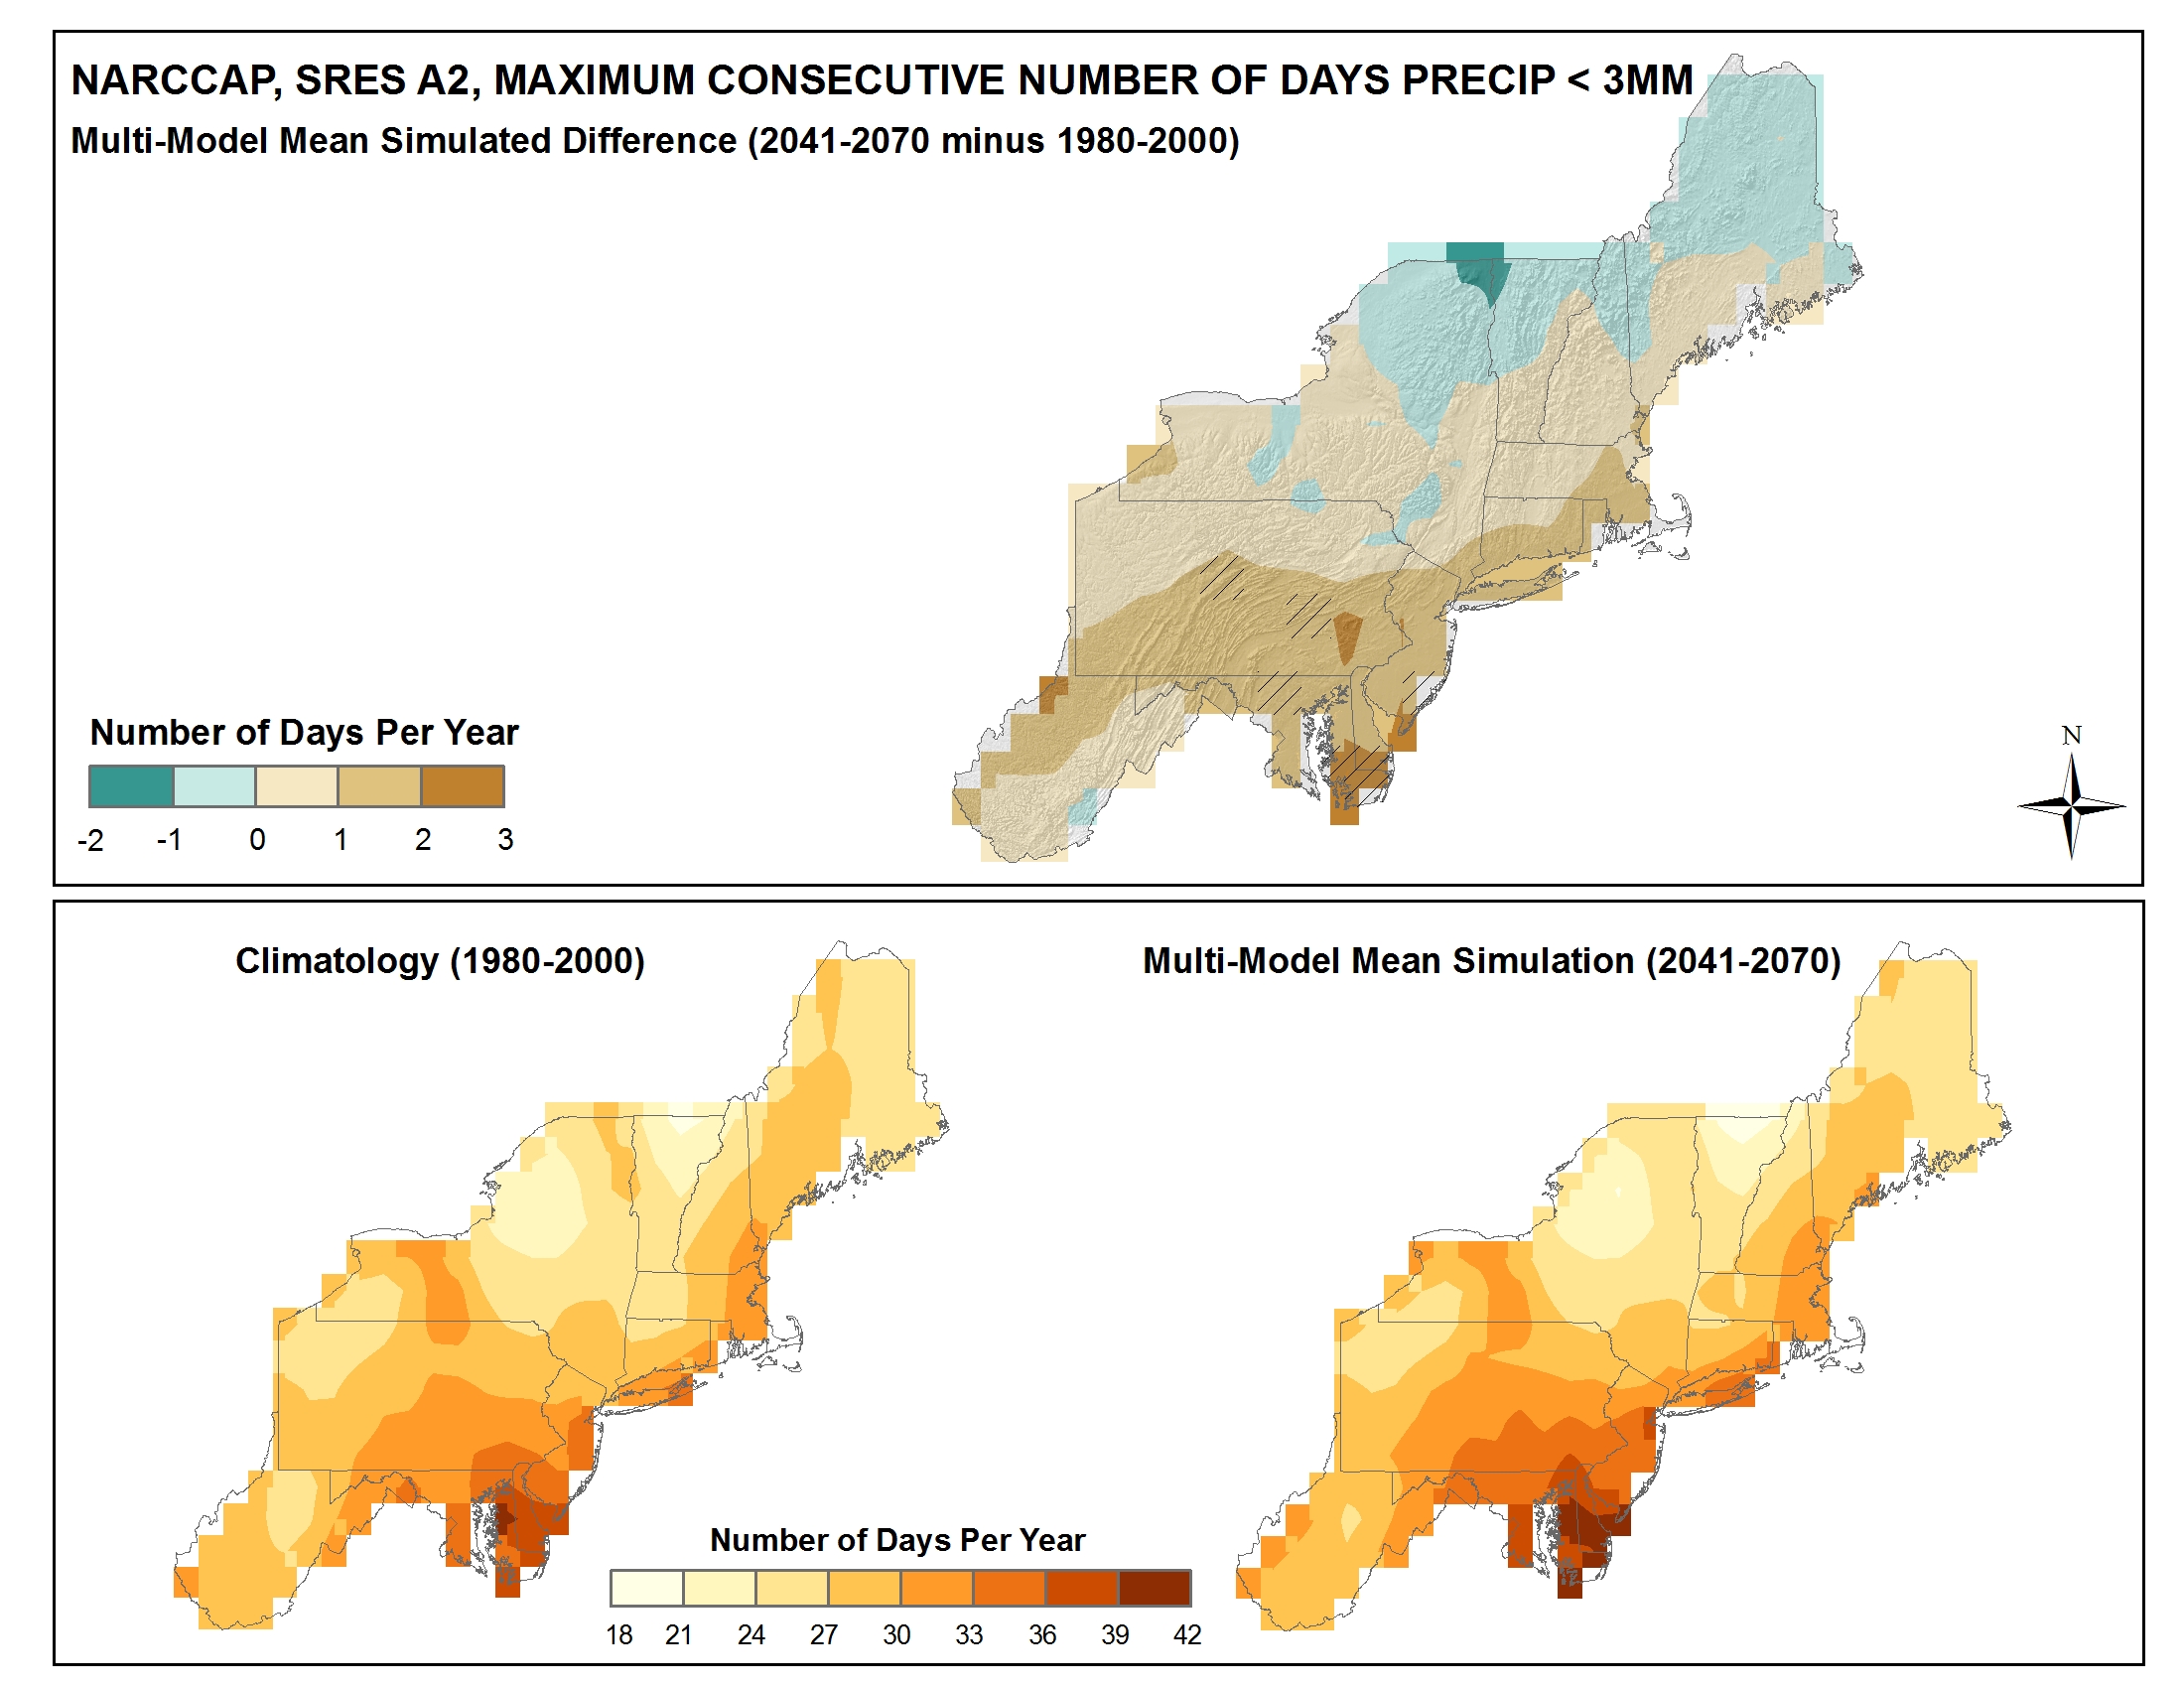
Simulated difference in the mean annual maximum number of consecutive days with precipitation of less than 0.1 inches |
Simulated |
Precipitation |
Northeast |
Regional Climate Trends and Scenarios for the U.S. National Climate Assessment. Part 1. Climate of the Northeast U.S. |
NCA 3 |
 |
|
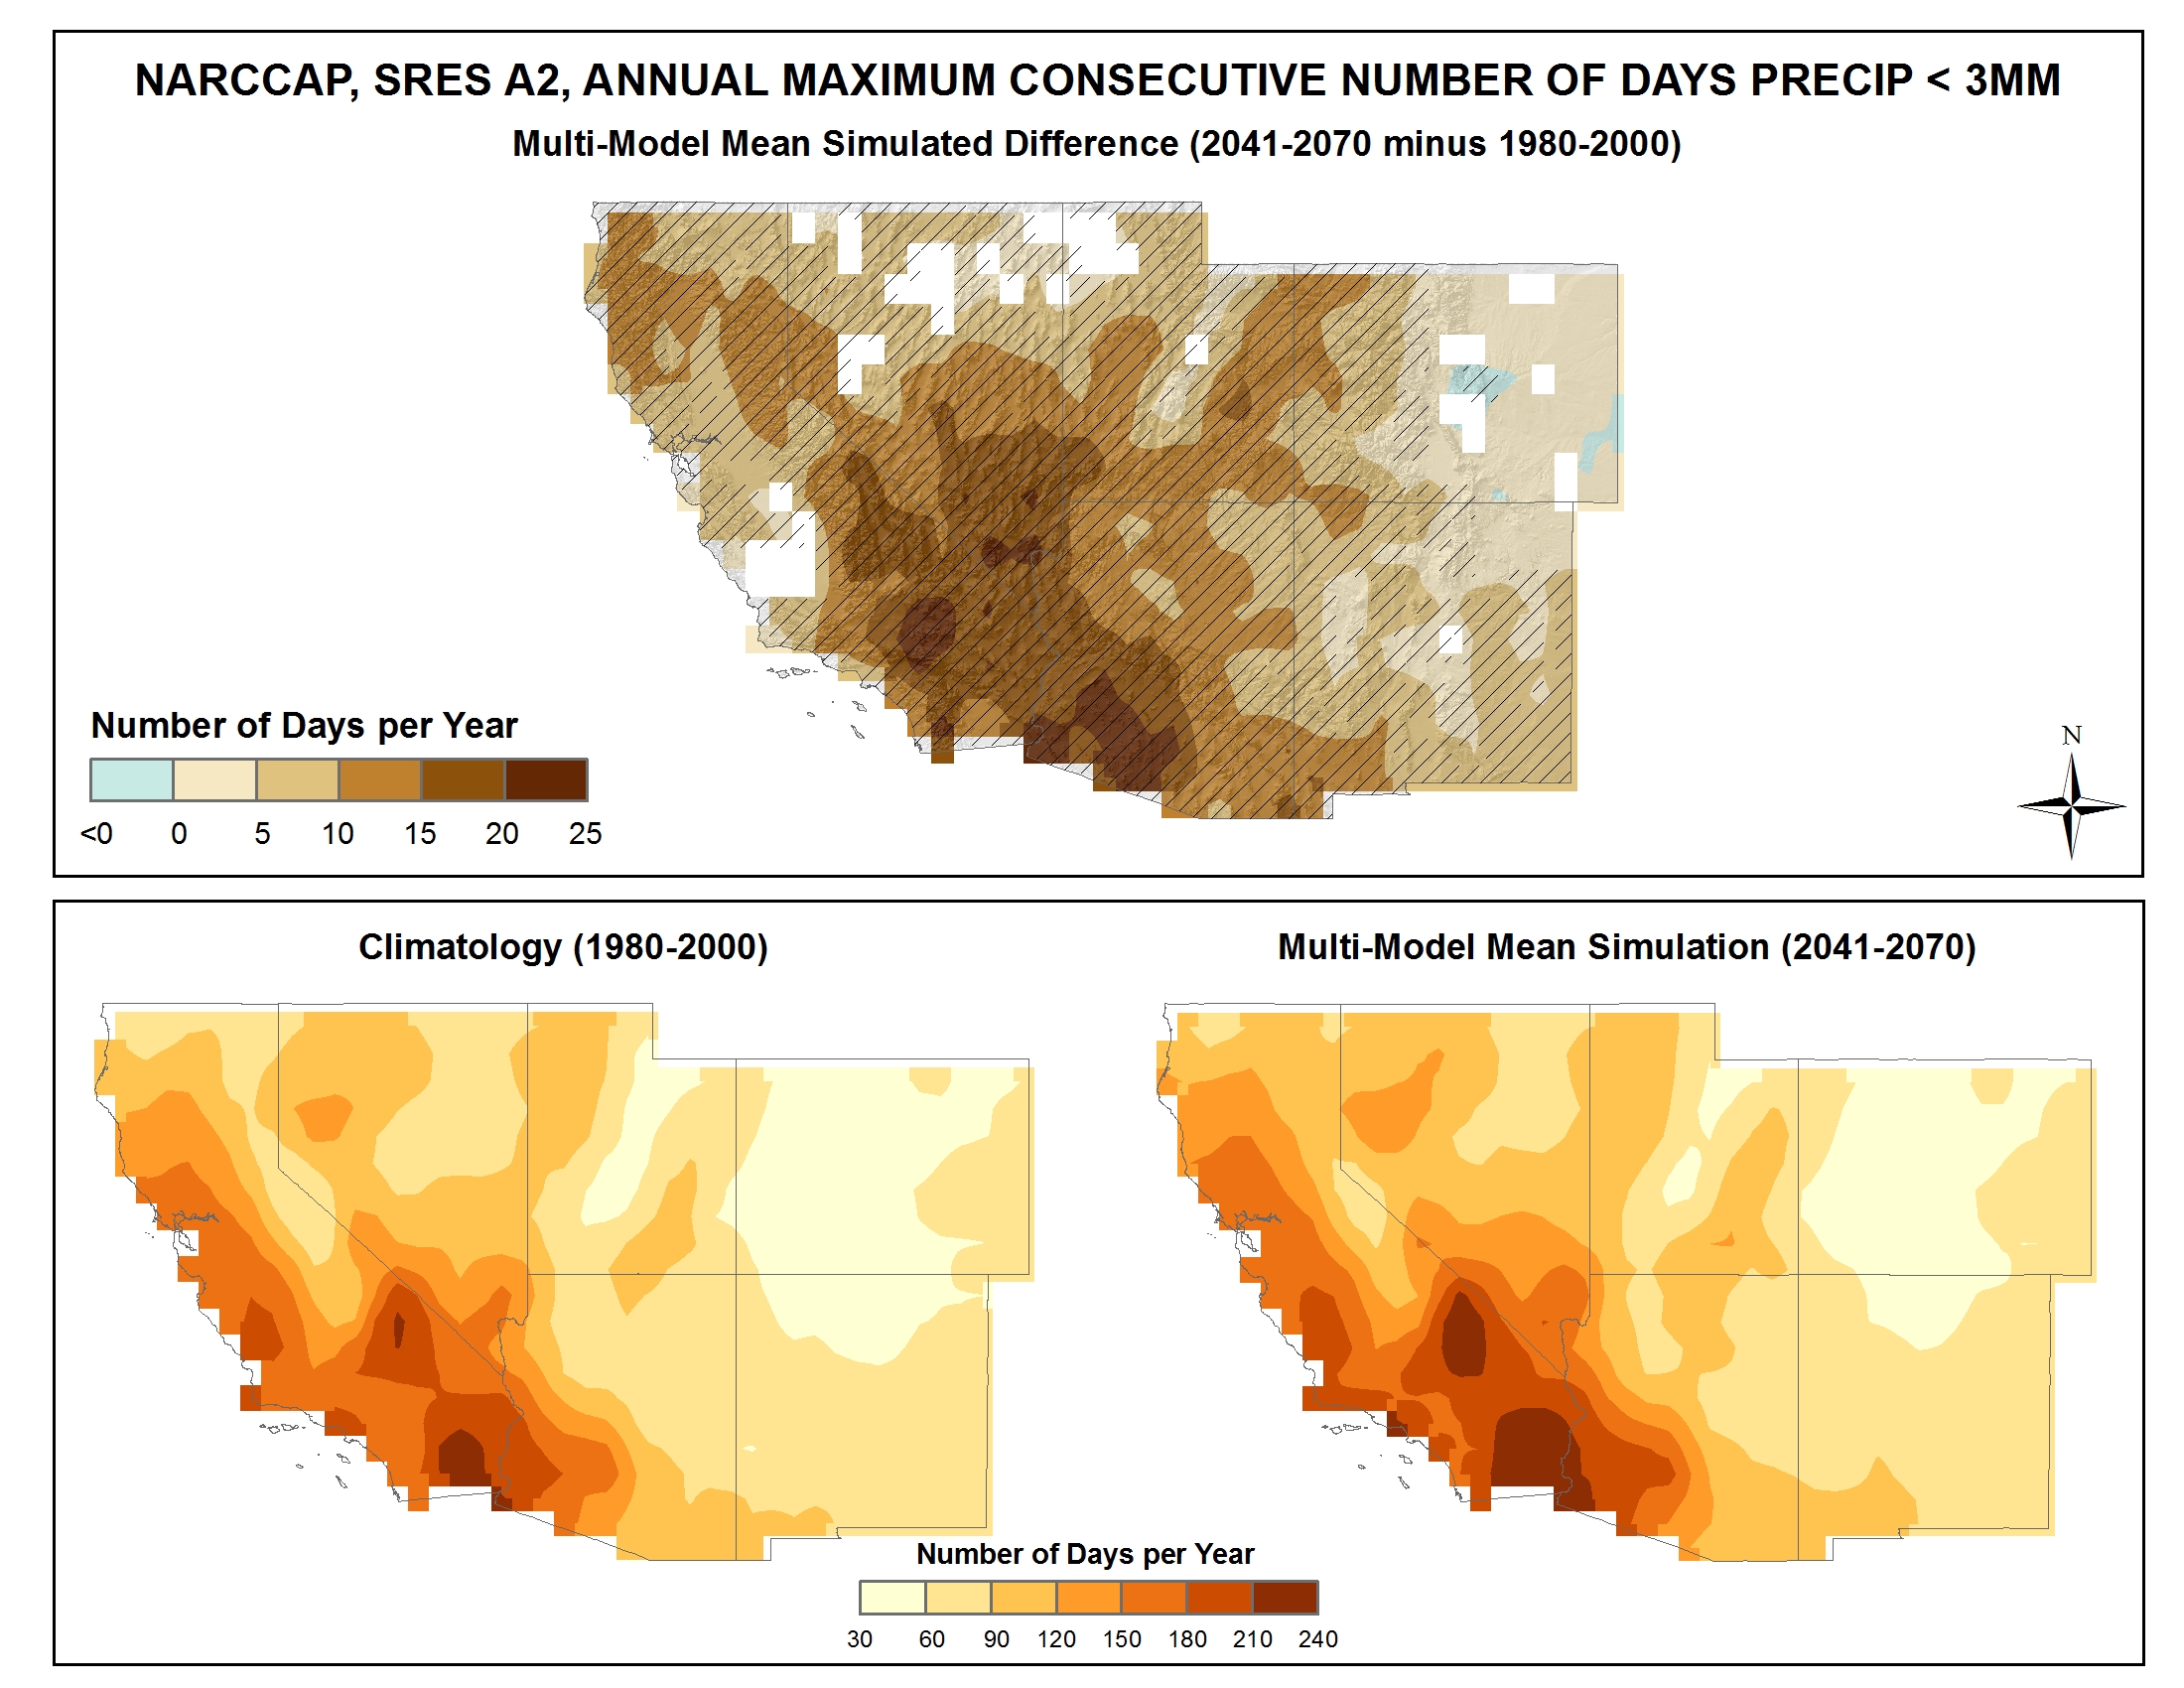
Simulated difference in the mean annual maximum number of consecutive days with precipitation of less than 0.1 inches |
Simulated |
Precipitation |
Southwest |
Regional Climate Trends and Scenarios for the U.S. National Climate Assessment. Part 5. Climate of the Southwest U.S. |
NCA 3 |
 |
|
Simulated difference in the mean annual maximum number of consecutive days with precipitation of less than 0.1 inches |
Simulated |
Precipitation |
Northwest |
Regional Climate Trends and Scenarios for the U.S. National Climate Assessment. Part 6. Climate of the Northwest U.S. |
NCA 3 |
 |
|
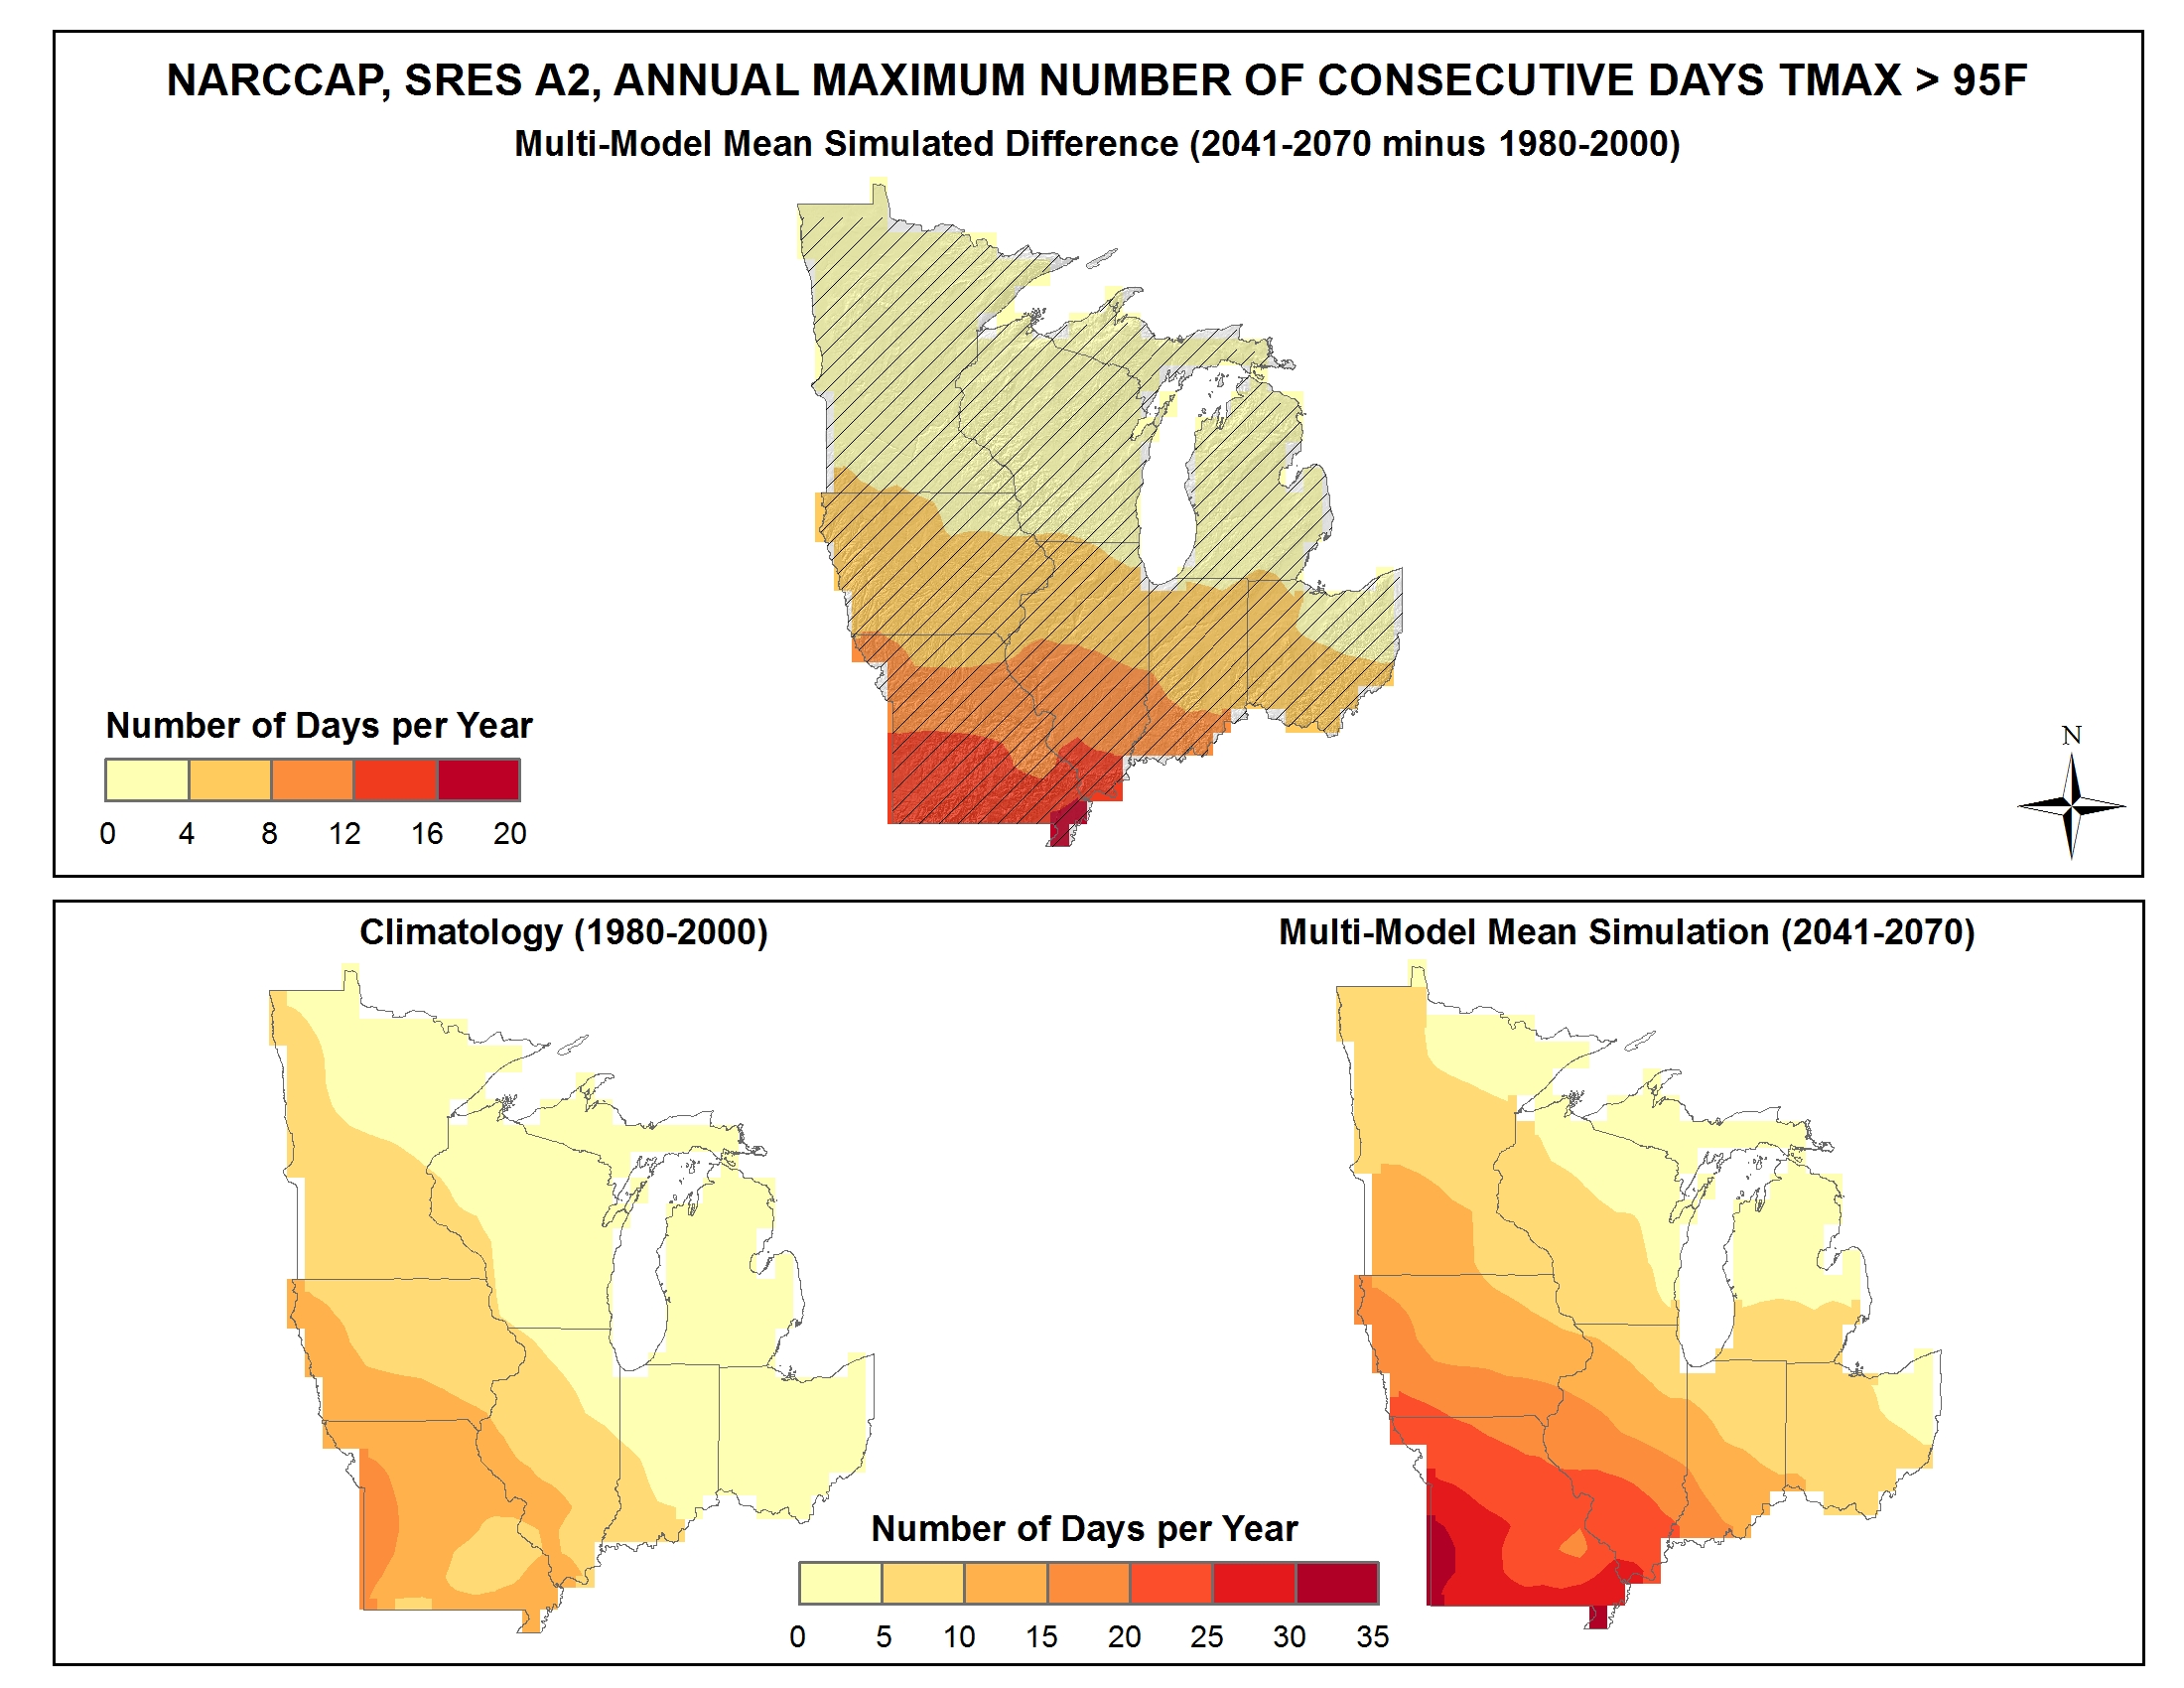
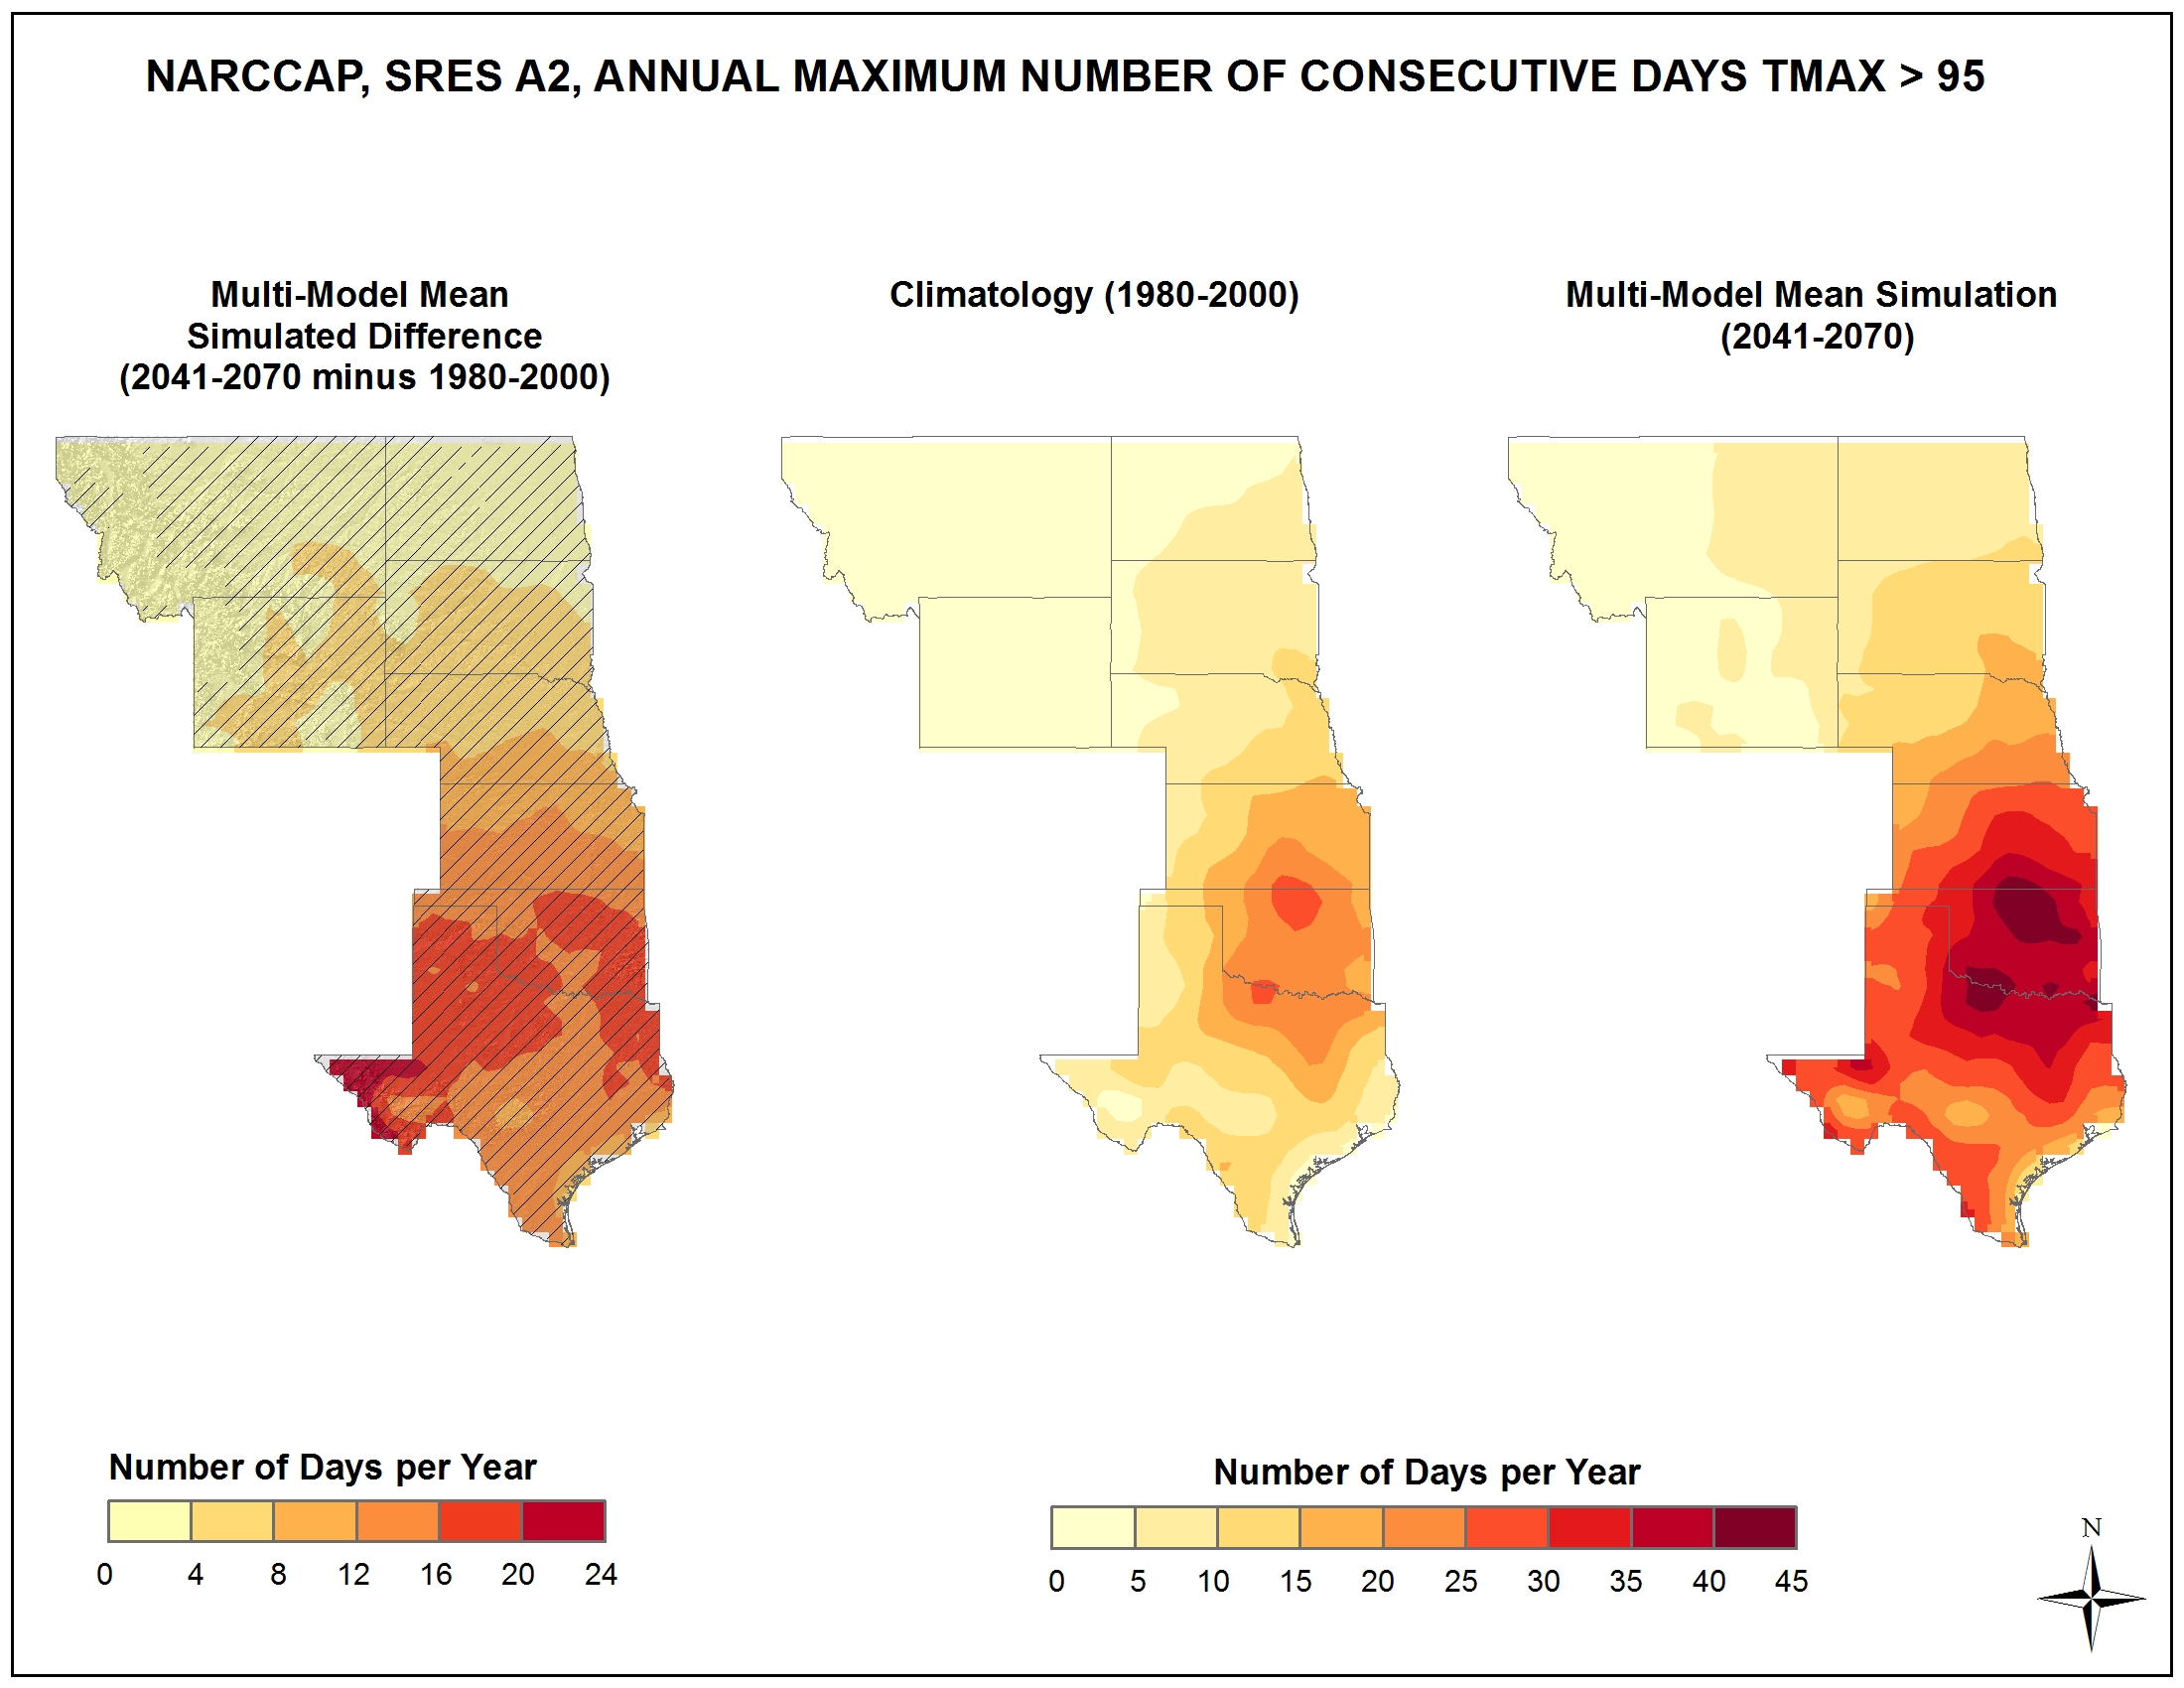
Simulated difference in the mean annual maximum number of consecutive days with a maximum temperature greater than 95F |
Simulated |
Temperature |
Midwest |
Regional Climate Trends and Scenarios for the U.S. National Climate Assessment. Part 3. Climate of the Midwest U.S. |
NCA 3 |
 |
|
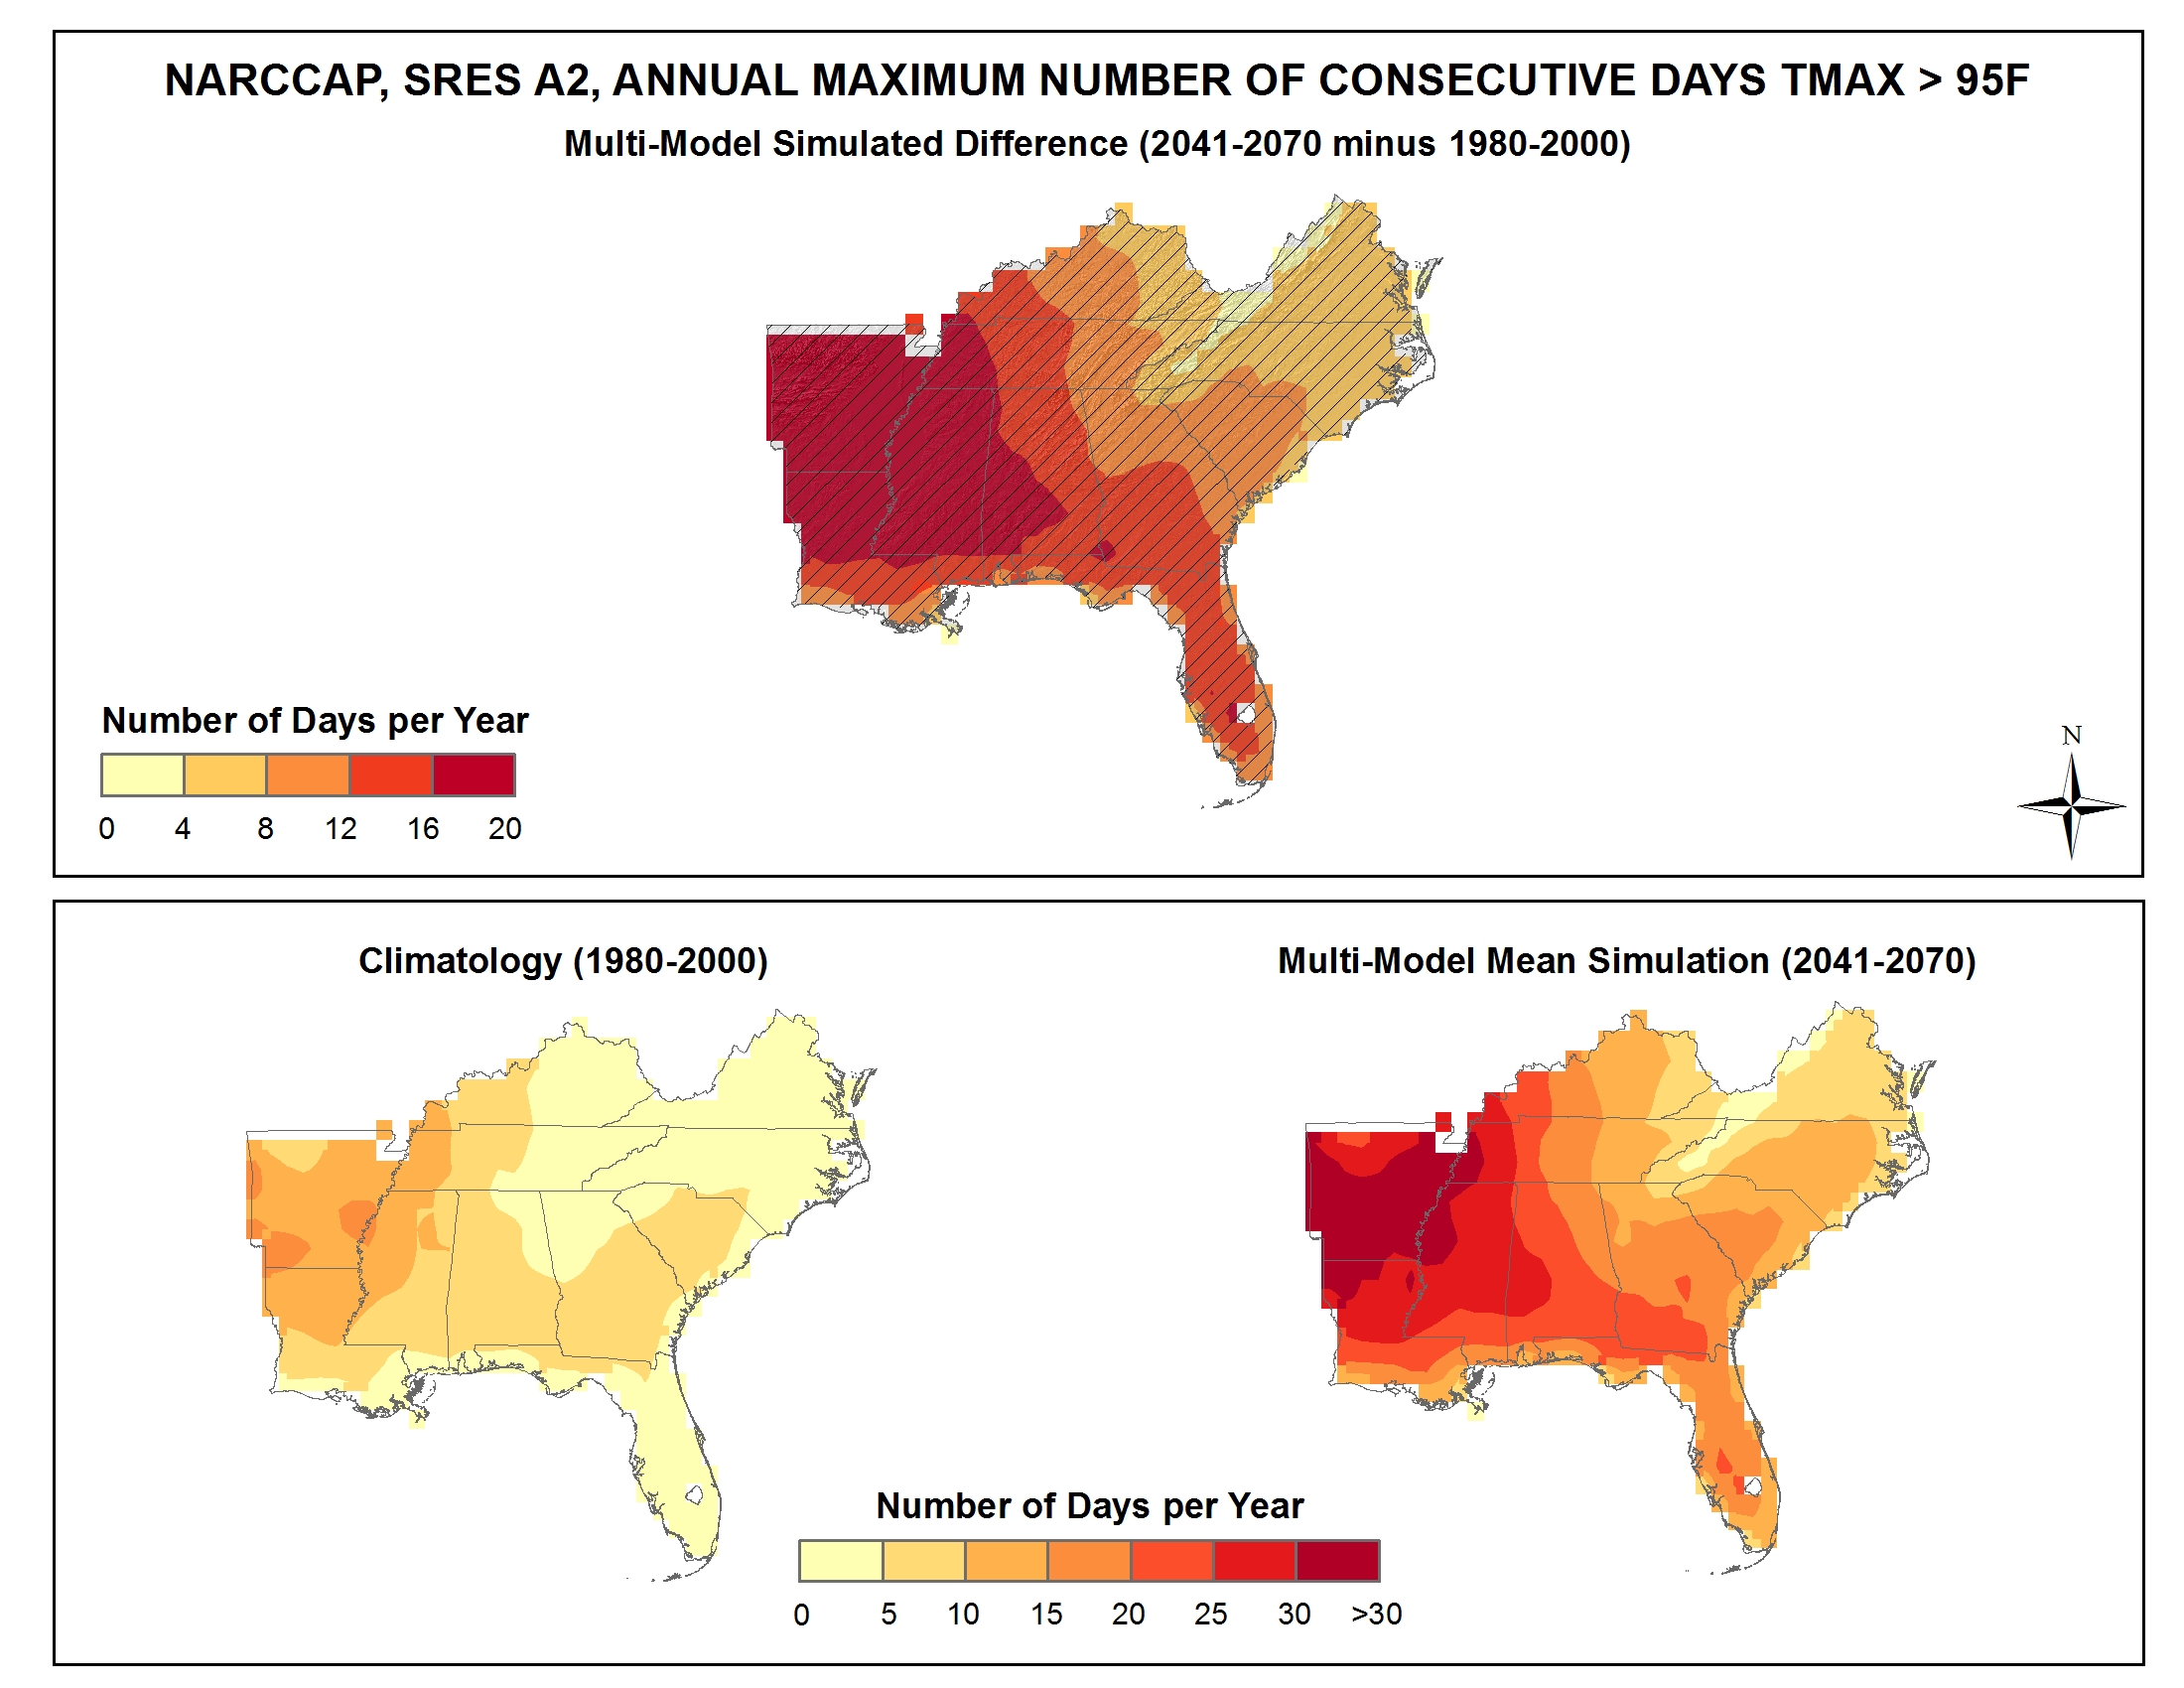
Simulated difference in the mean annual maximum number of consecutive days with a maximum temperature greater than 95F |
Simulated |
Temperature |
Southeast and Caribbean |
Regional Climate Trends and Scenarios for the U.S. National Climate Assessment. Part 2. Climate of the Southeast U.S. |
NCA 3 |
 |
|
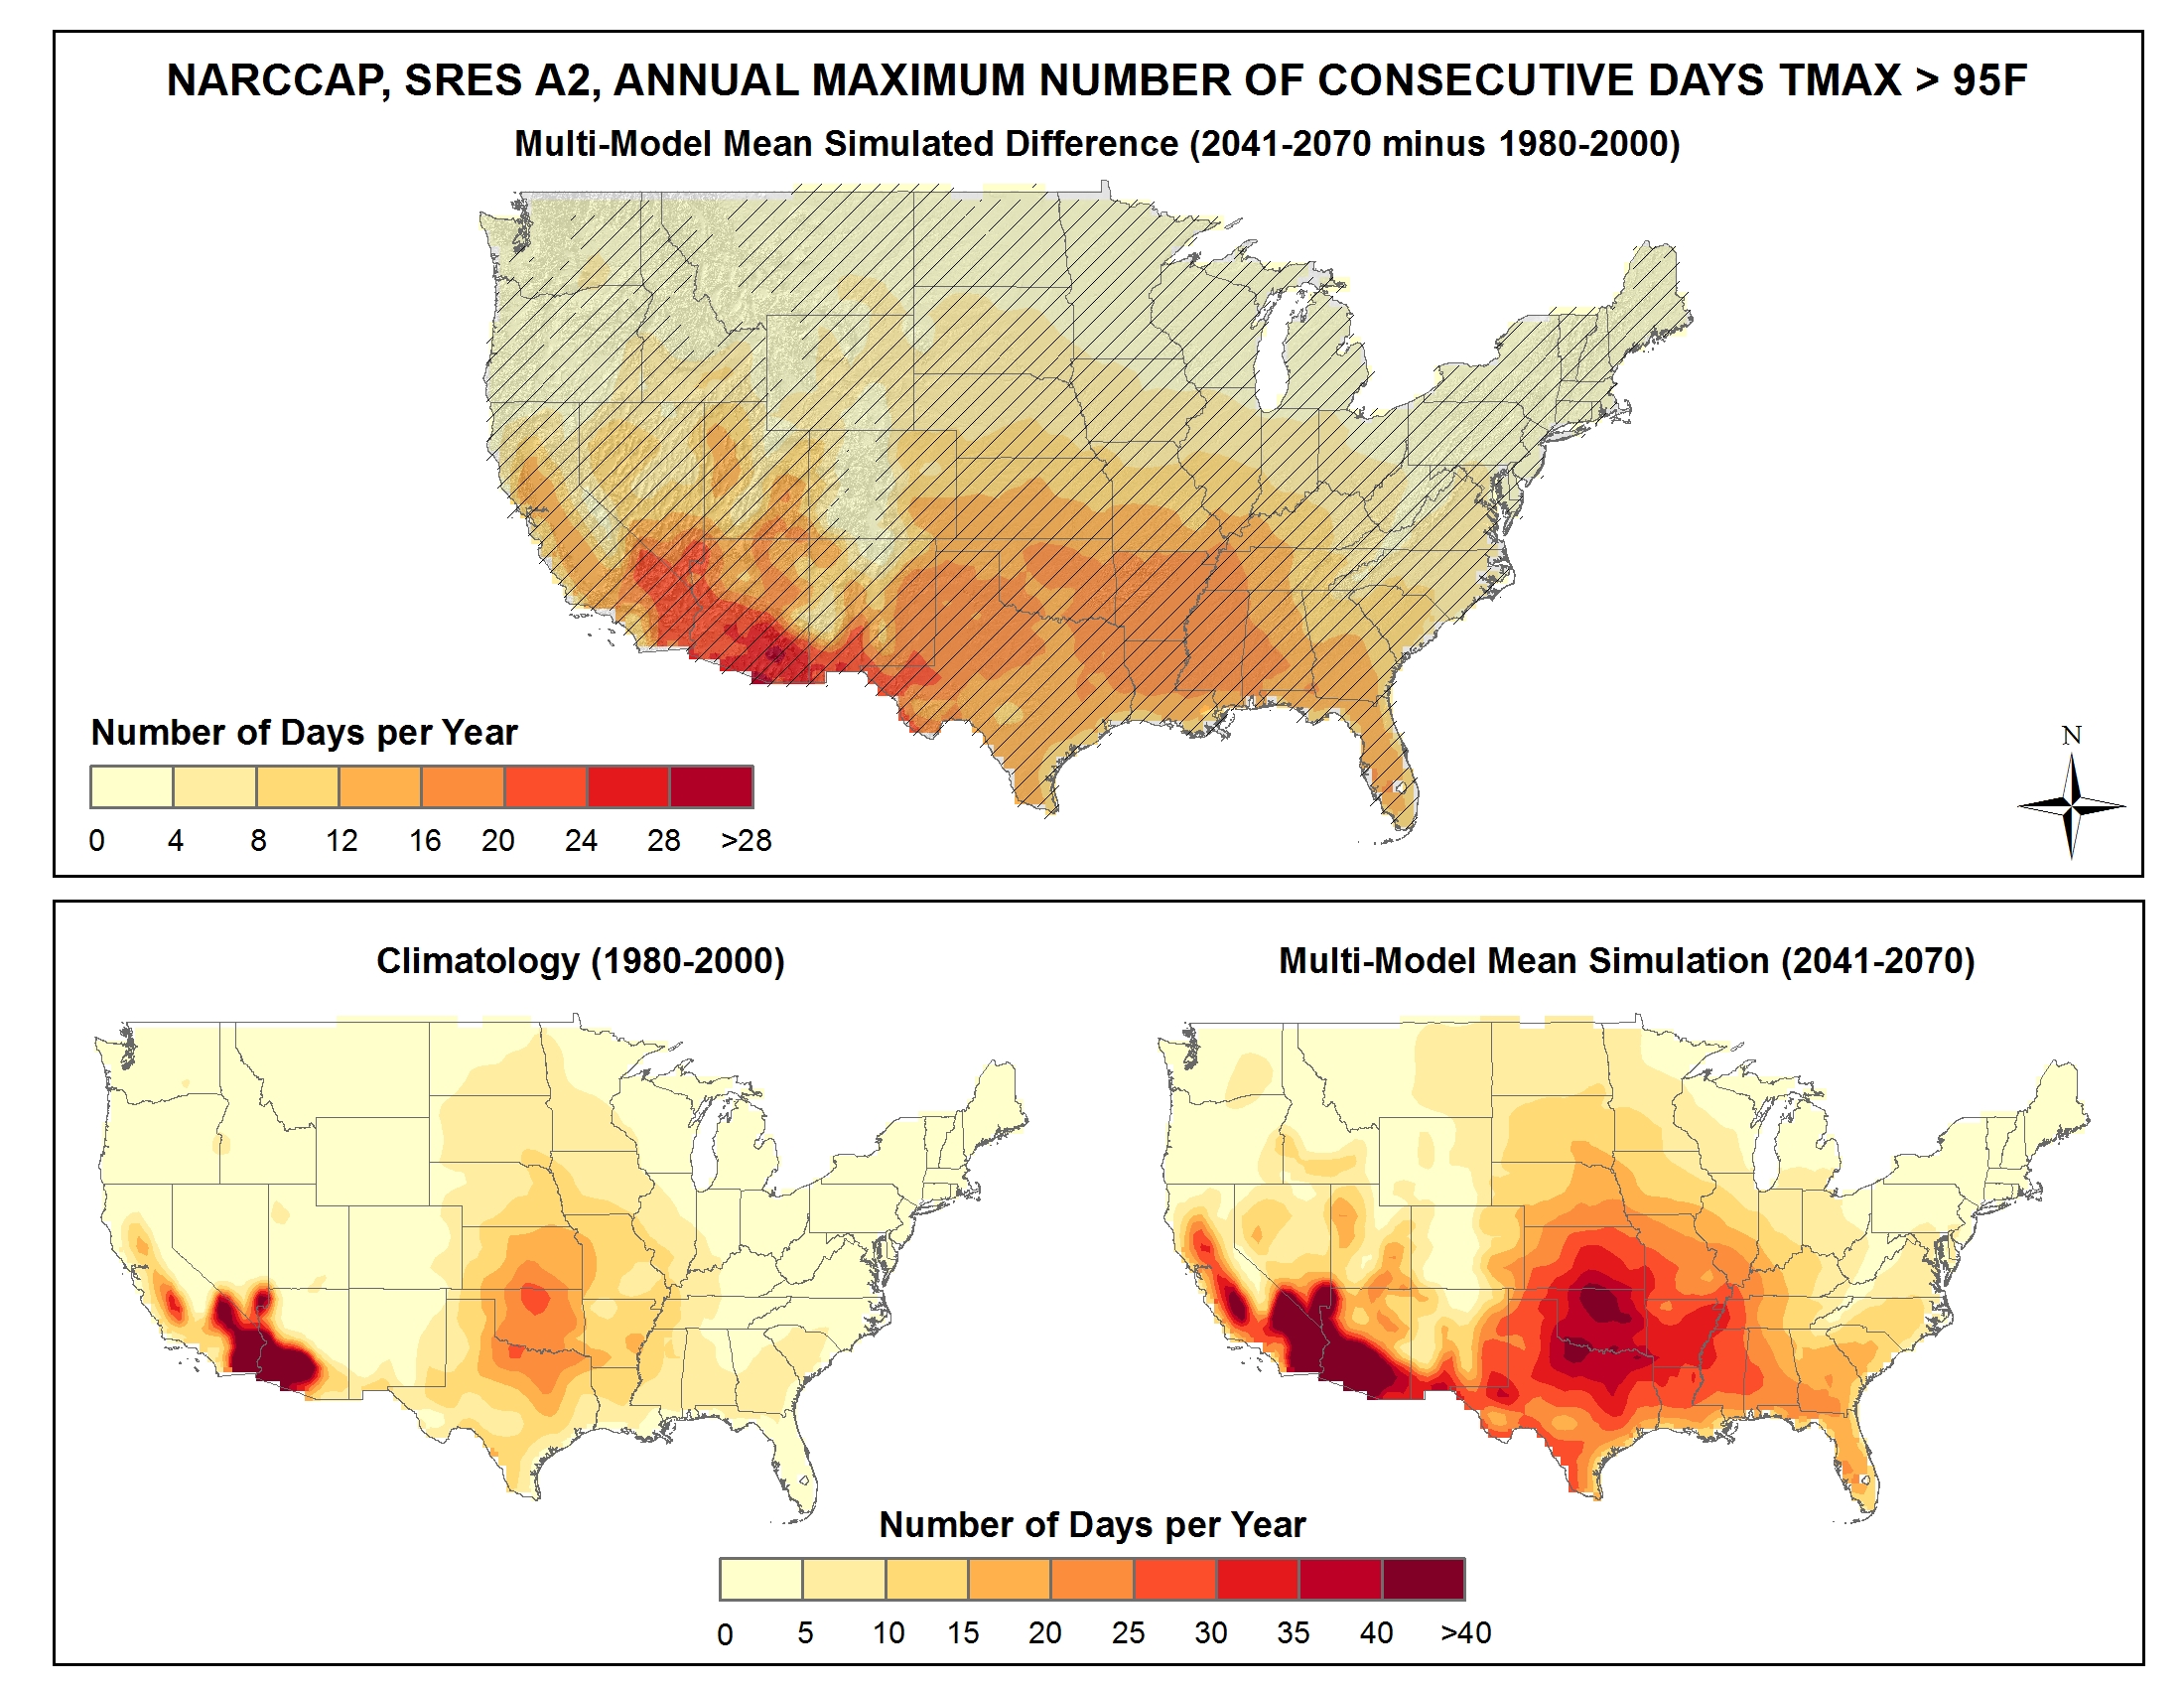
Simulated difference in the mean annual maximum number of consecutive days with a maximum temperature greater than 95F |
Simulated |
Temperature |
National |
Regional Climate Trends and Scenarios for the U.S. National Climate Assessment. Part 9. Climate of the Contiguous United States |
NCA 3 |
 |
|
Simulated difference in the mean annual maximum number of consecutive days with a maximum temperature greater than 95F |
Simulated |
Temperature |
Great Plains |
Regional Climate Trends and Scenarios for the U.S. National Climate Assessment. Part 4. Climate of the U.S. Great Plains |
NCA 3 |
 |
|
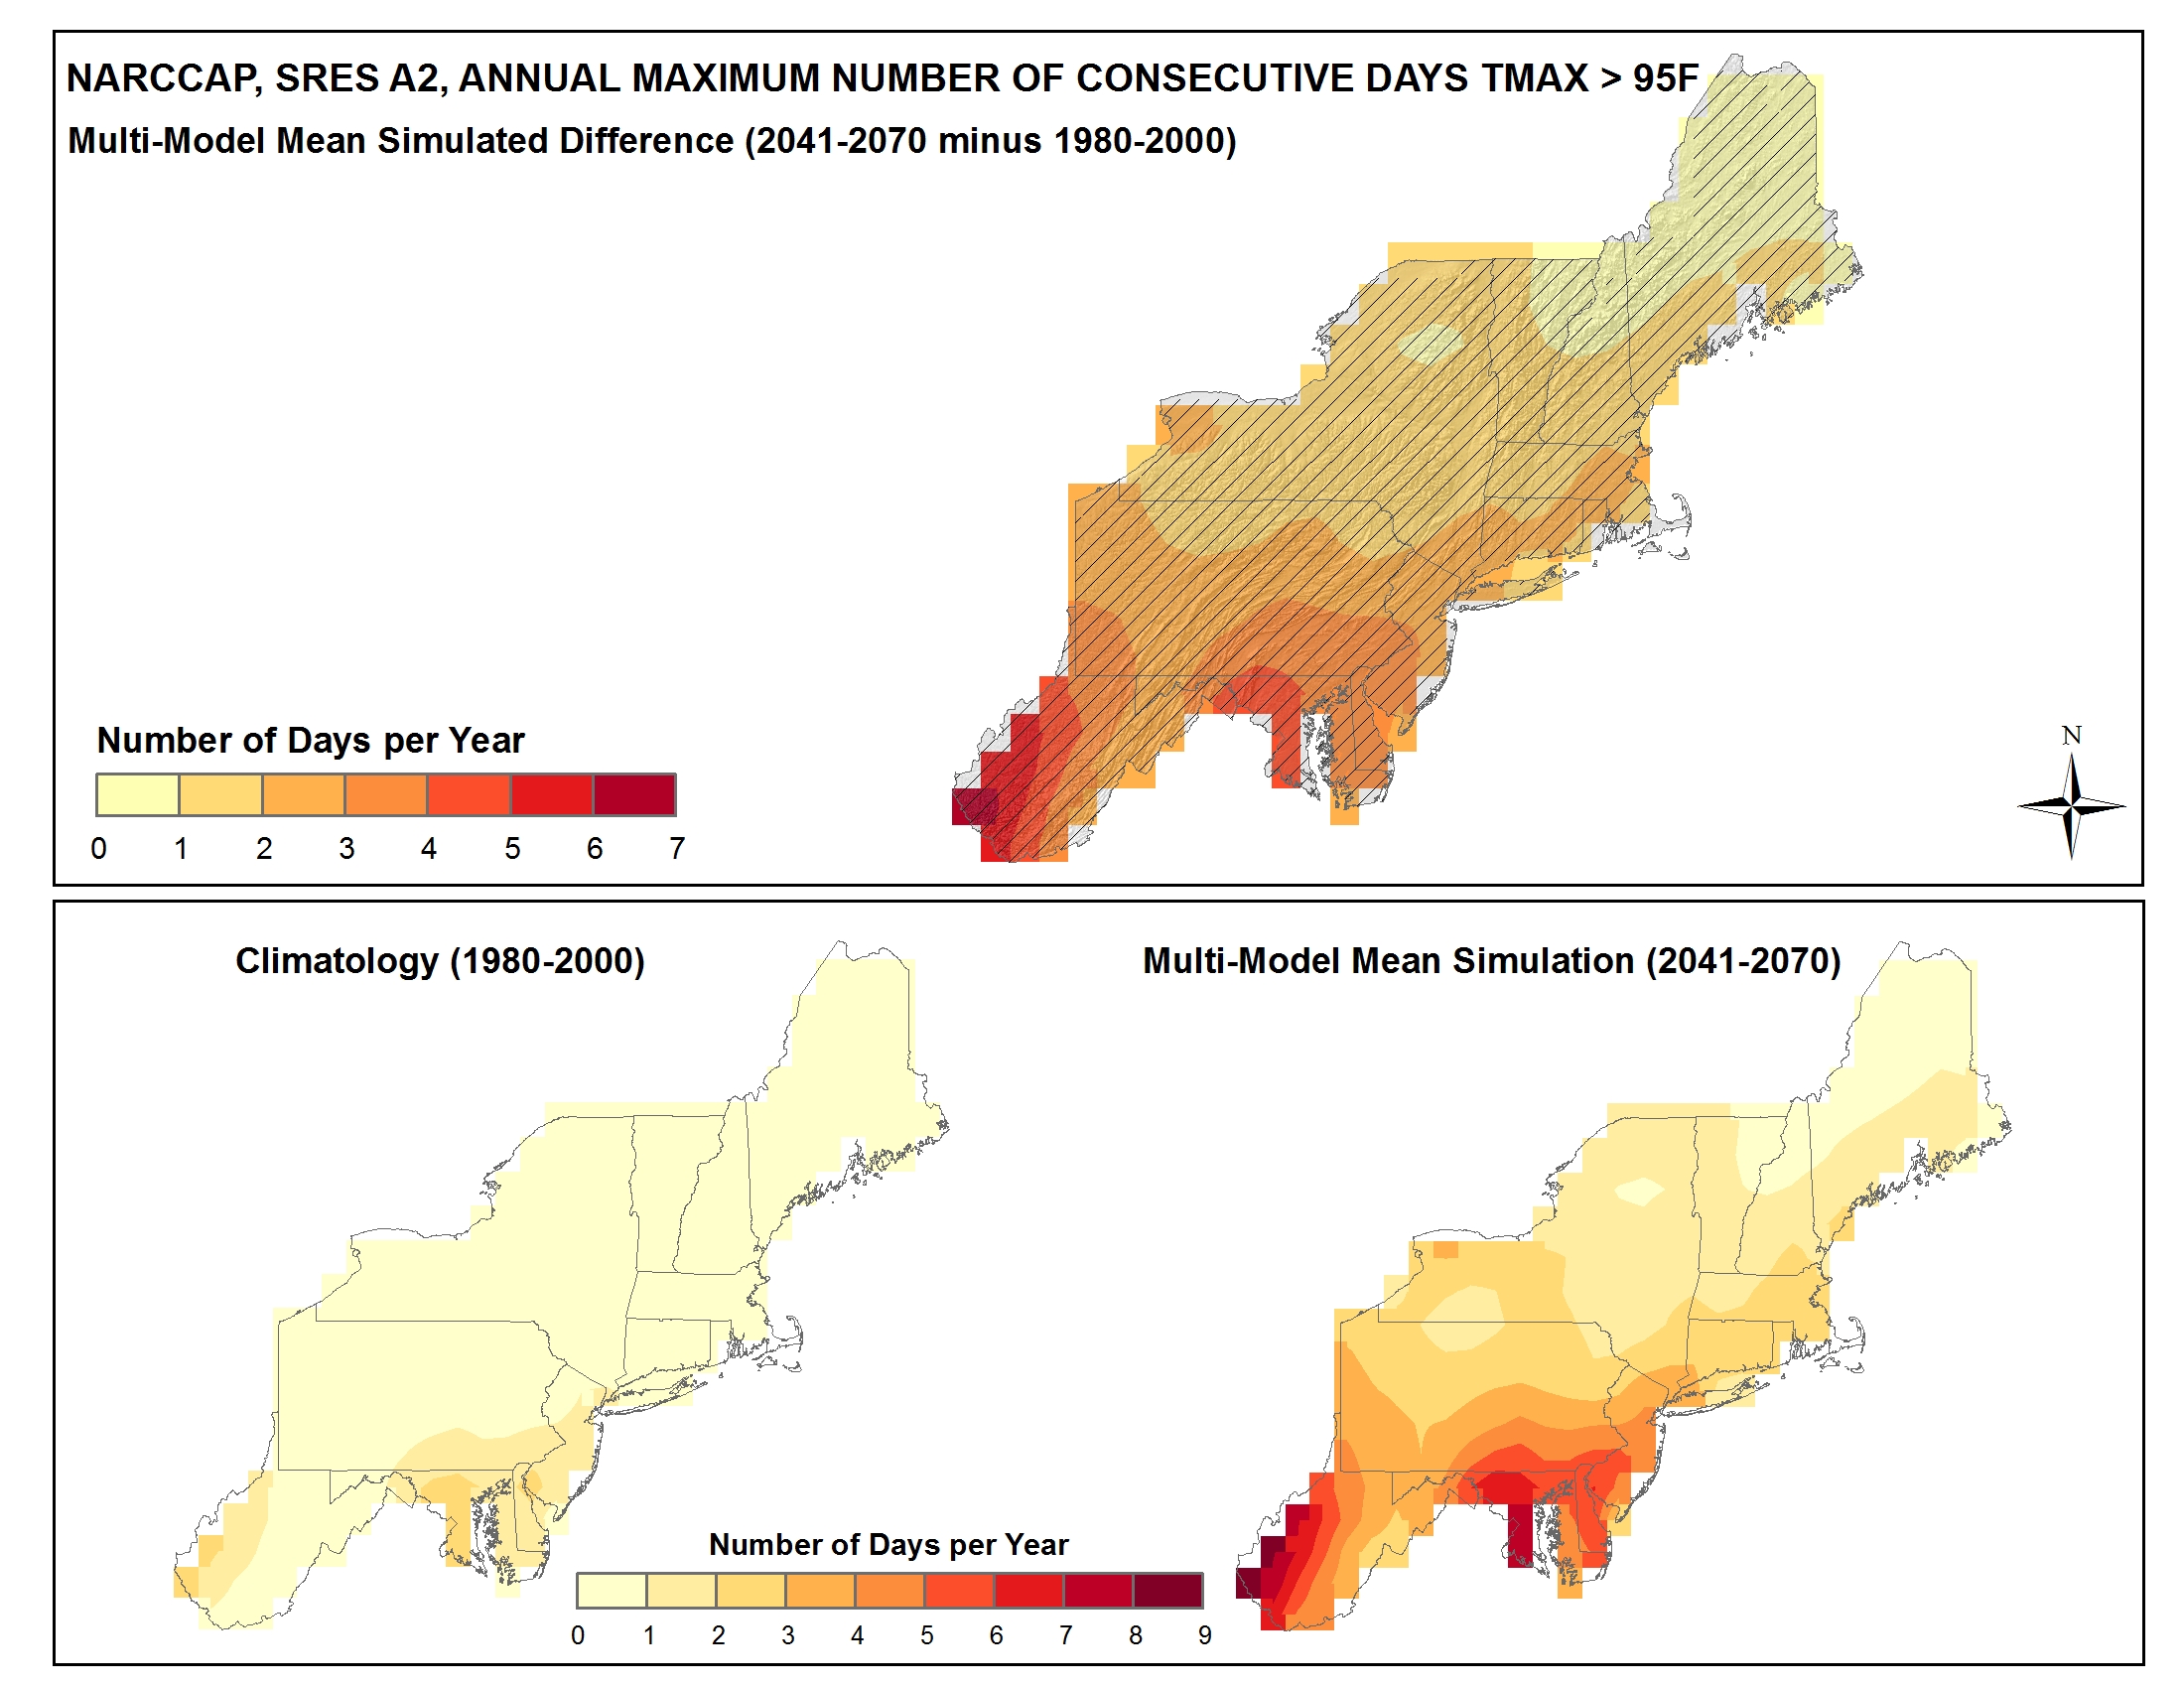
Simulated difference in the mean annual maximum number of consecutive days with a maximum temperature greater than 95F |
Simulated |
Temperature |
Northeast |
Regional Climate Trends and Scenarios for the U.S. National Climate Assessment. Part 1. Climate of the Northeast U.S. |
NCA 3 |
 |
|
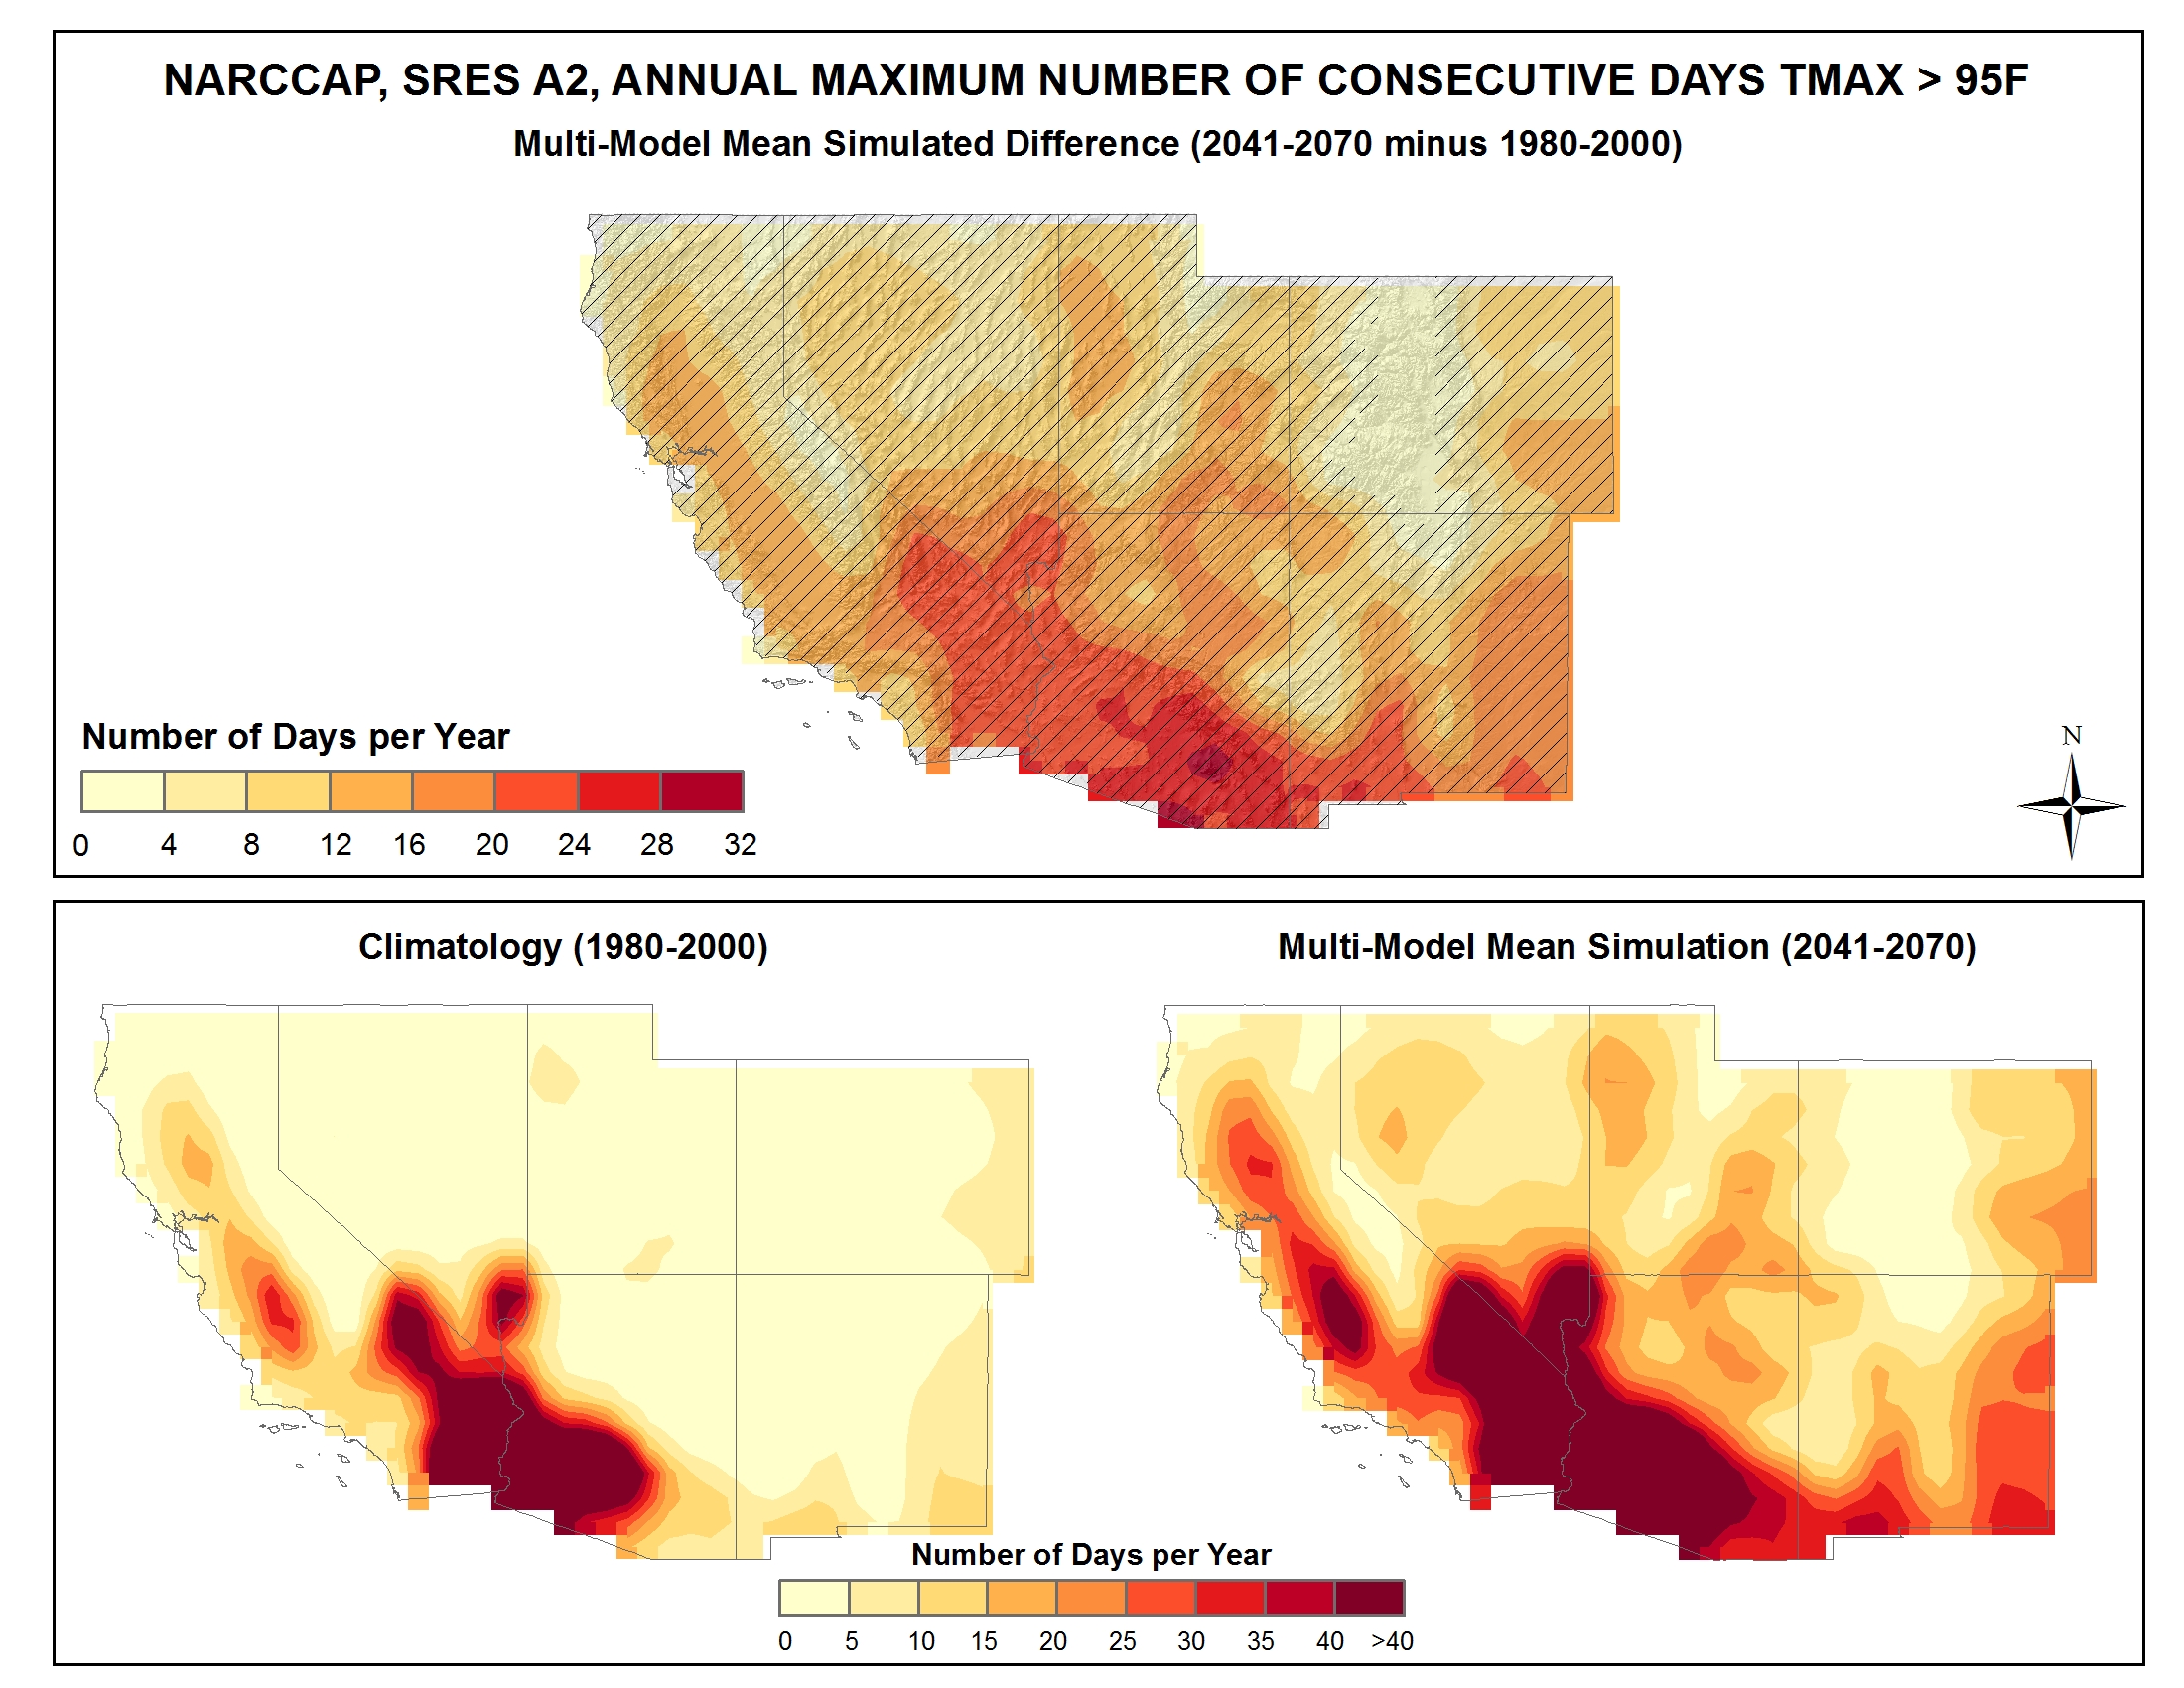
Simulated difference in the mean annual maximum number of consecutive days with a maximum temperature greater than 95F |
Simulated |
Temperature |
Southwest |
Regional Climate Trends and Scenarios for the U.S. National Climate Assessment. Part 5. Climate of the Southwest U.S. |
NCA 3 |
 |
|
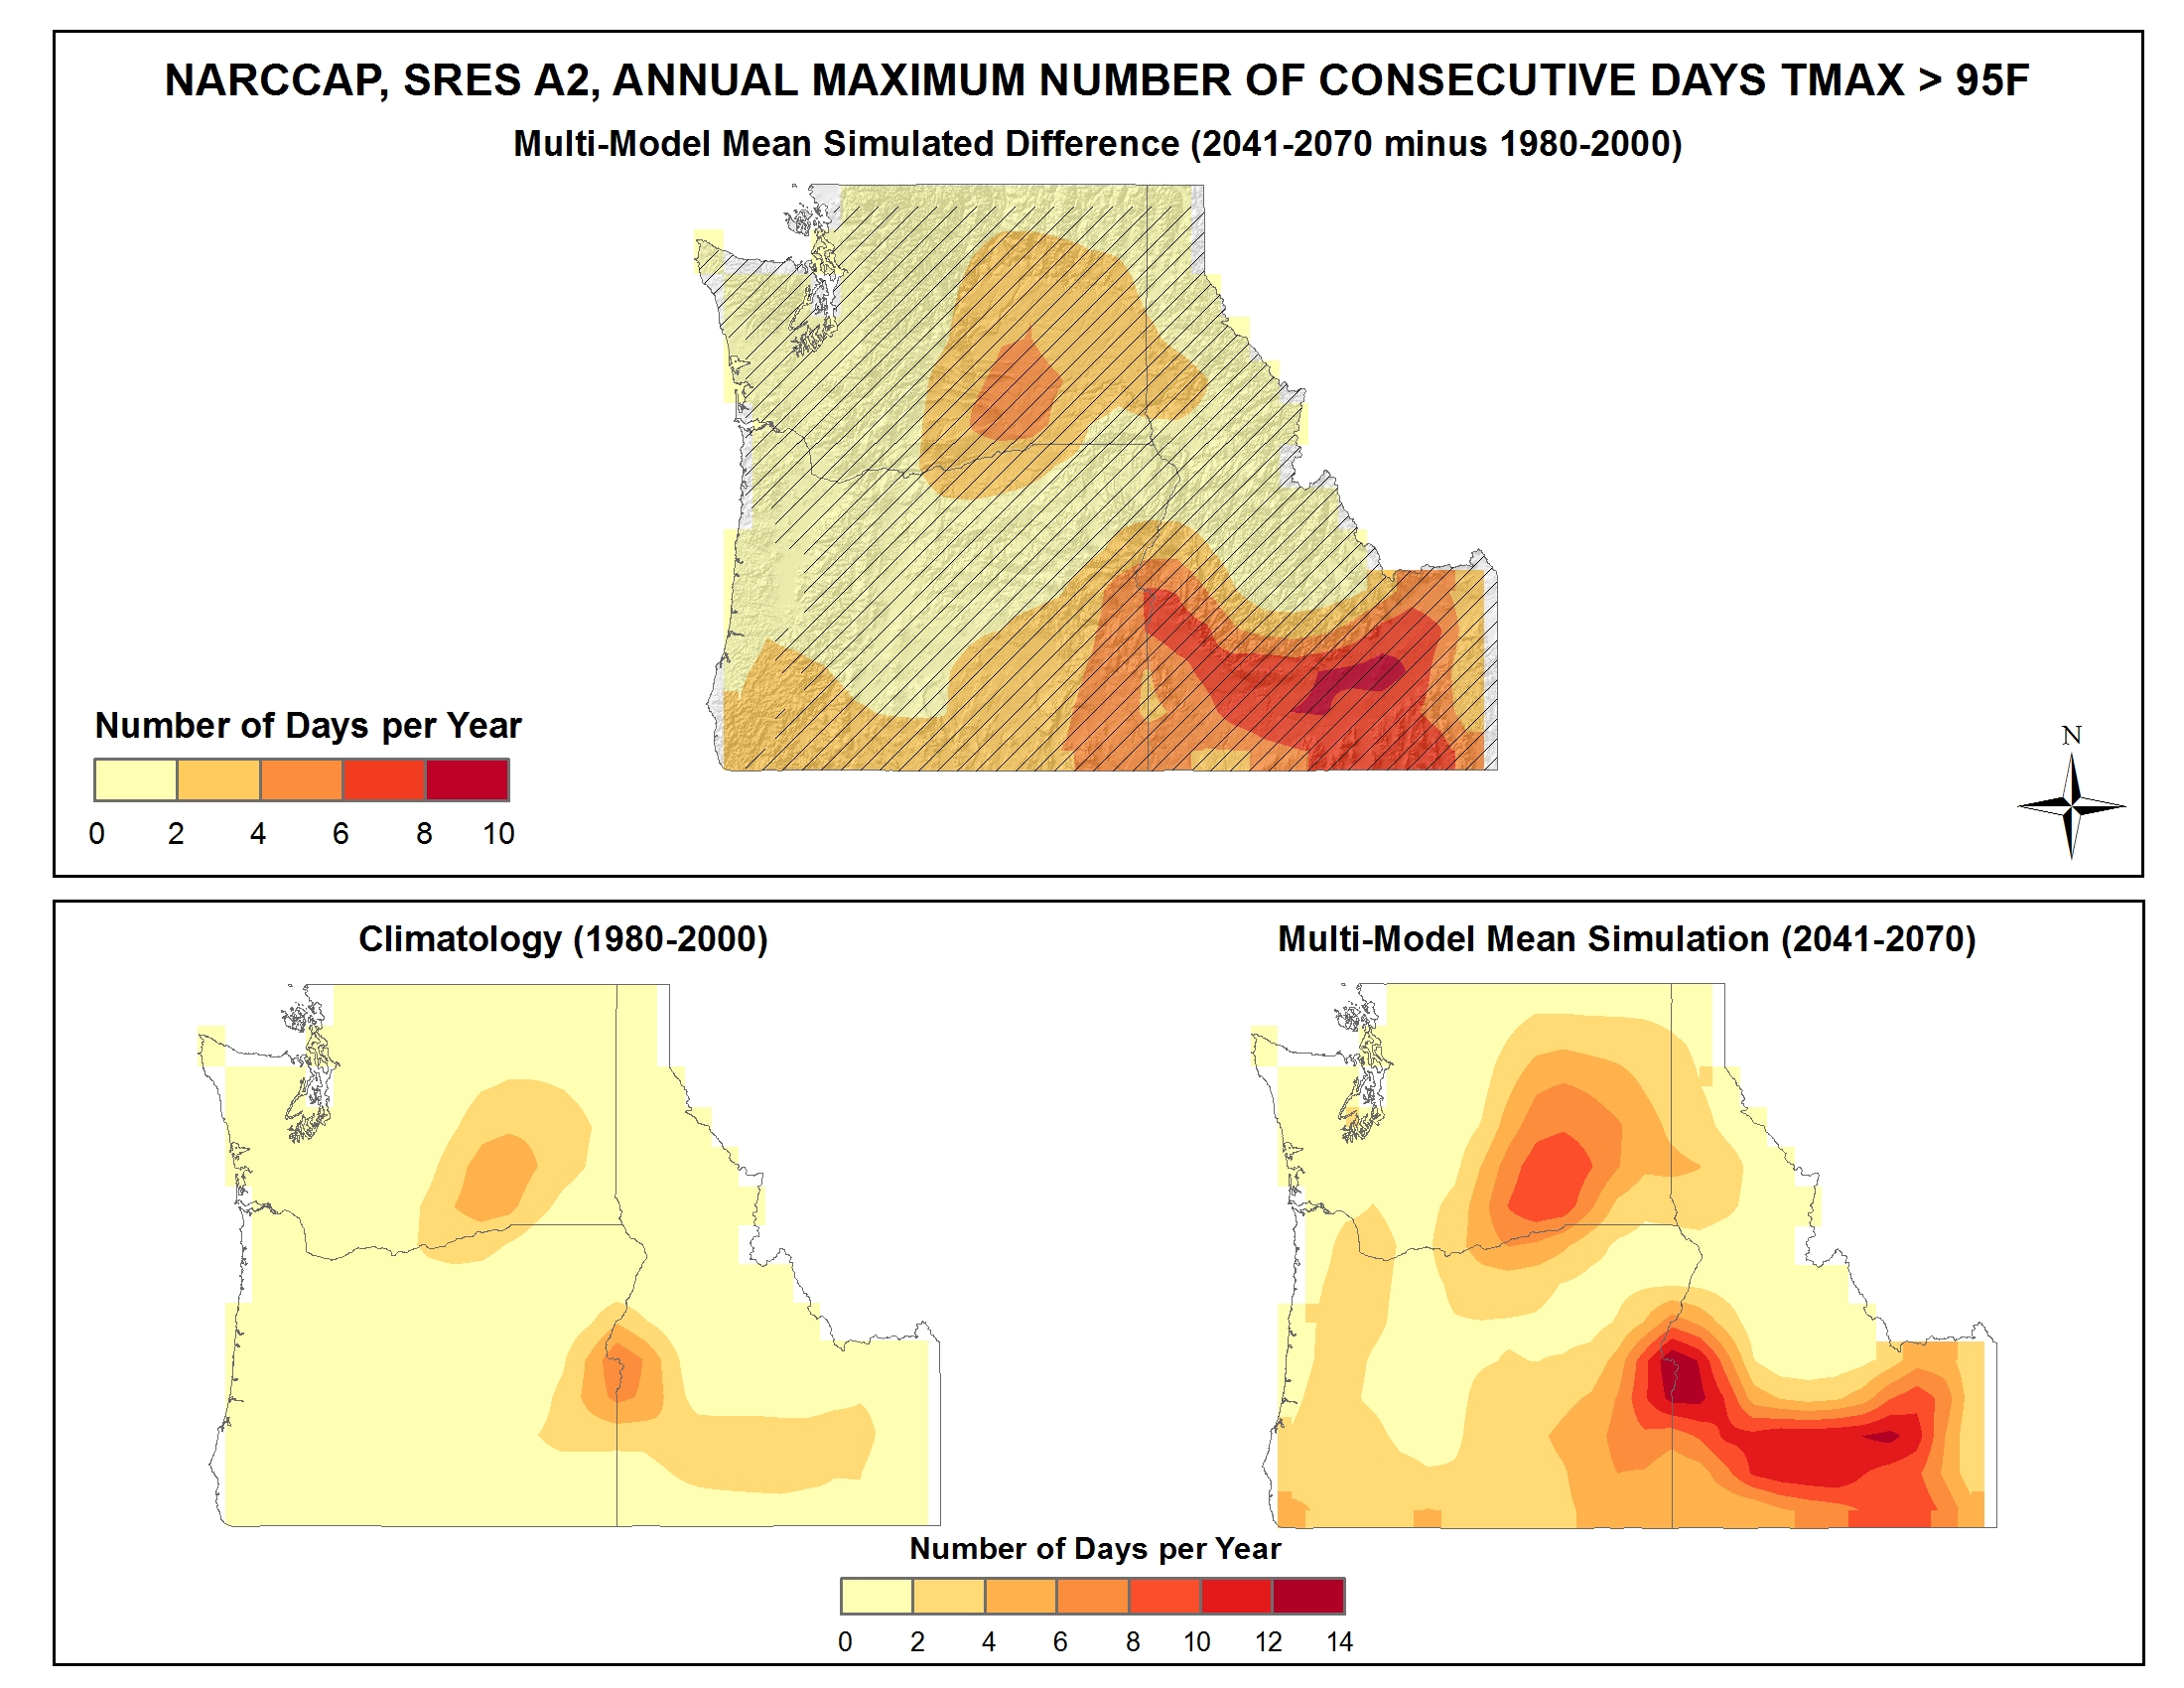
Simulated difference in the mean annual maximum number of consecutive days with a maximum temperature greater than 95F |
Simulated |
Temperature |
Northwest |
Regional Climate Trends and Scenarios for the U.S. National Climate Assessment. Part 6. Climate of the Northwest U.S. |
NCA 3 |
 |
|
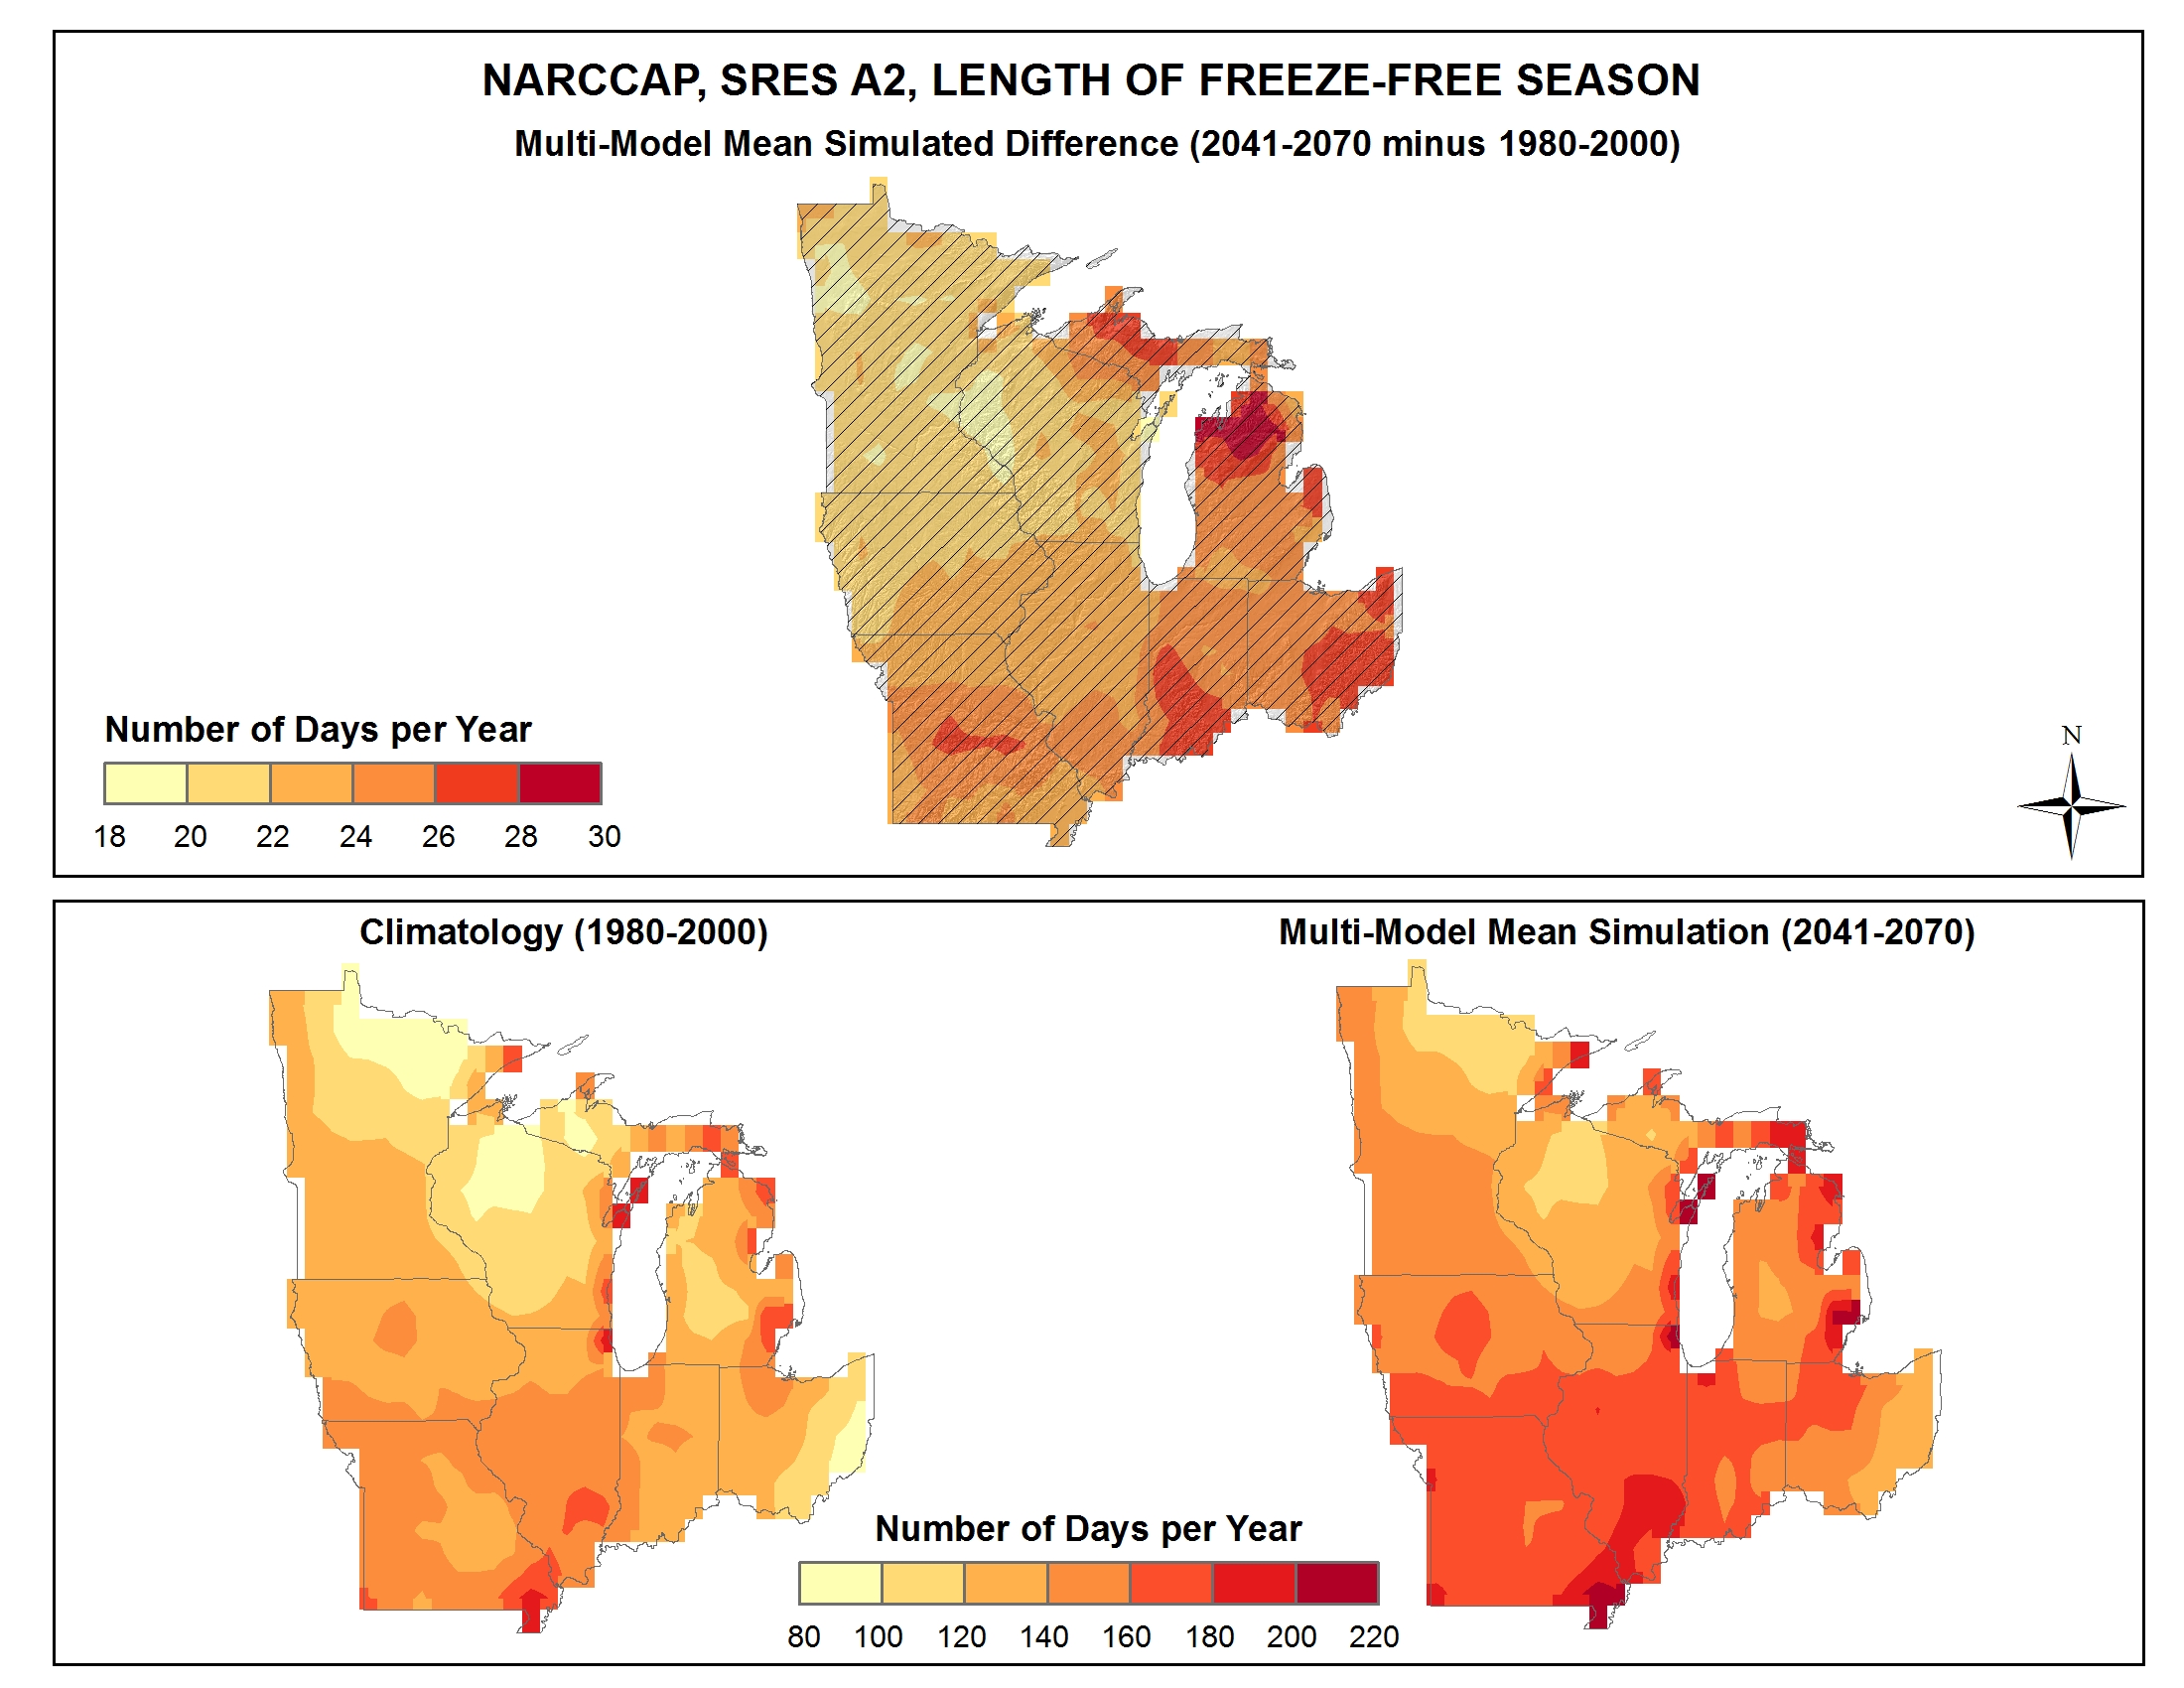
Simulated difference in the mean annual length of the freeze-free season |
Simulated |
Temperature |
Midwest |
Regional Climate Trends and Scenarios for the U.S. National Climate Assessment. Part 3. Climate of the Midwest U.S. |
NCA 3 |
 |
|
Simulated difference in the mean annual length of the freeze-free season |
Simulated |
Temperature |
Southeast and Caribbean |
Regional Climate Trends and Scenarios for the U.S. National Climate Assessment. Part 2. Climate of the Southeast U.S. |
NCA 3 |
 |
|
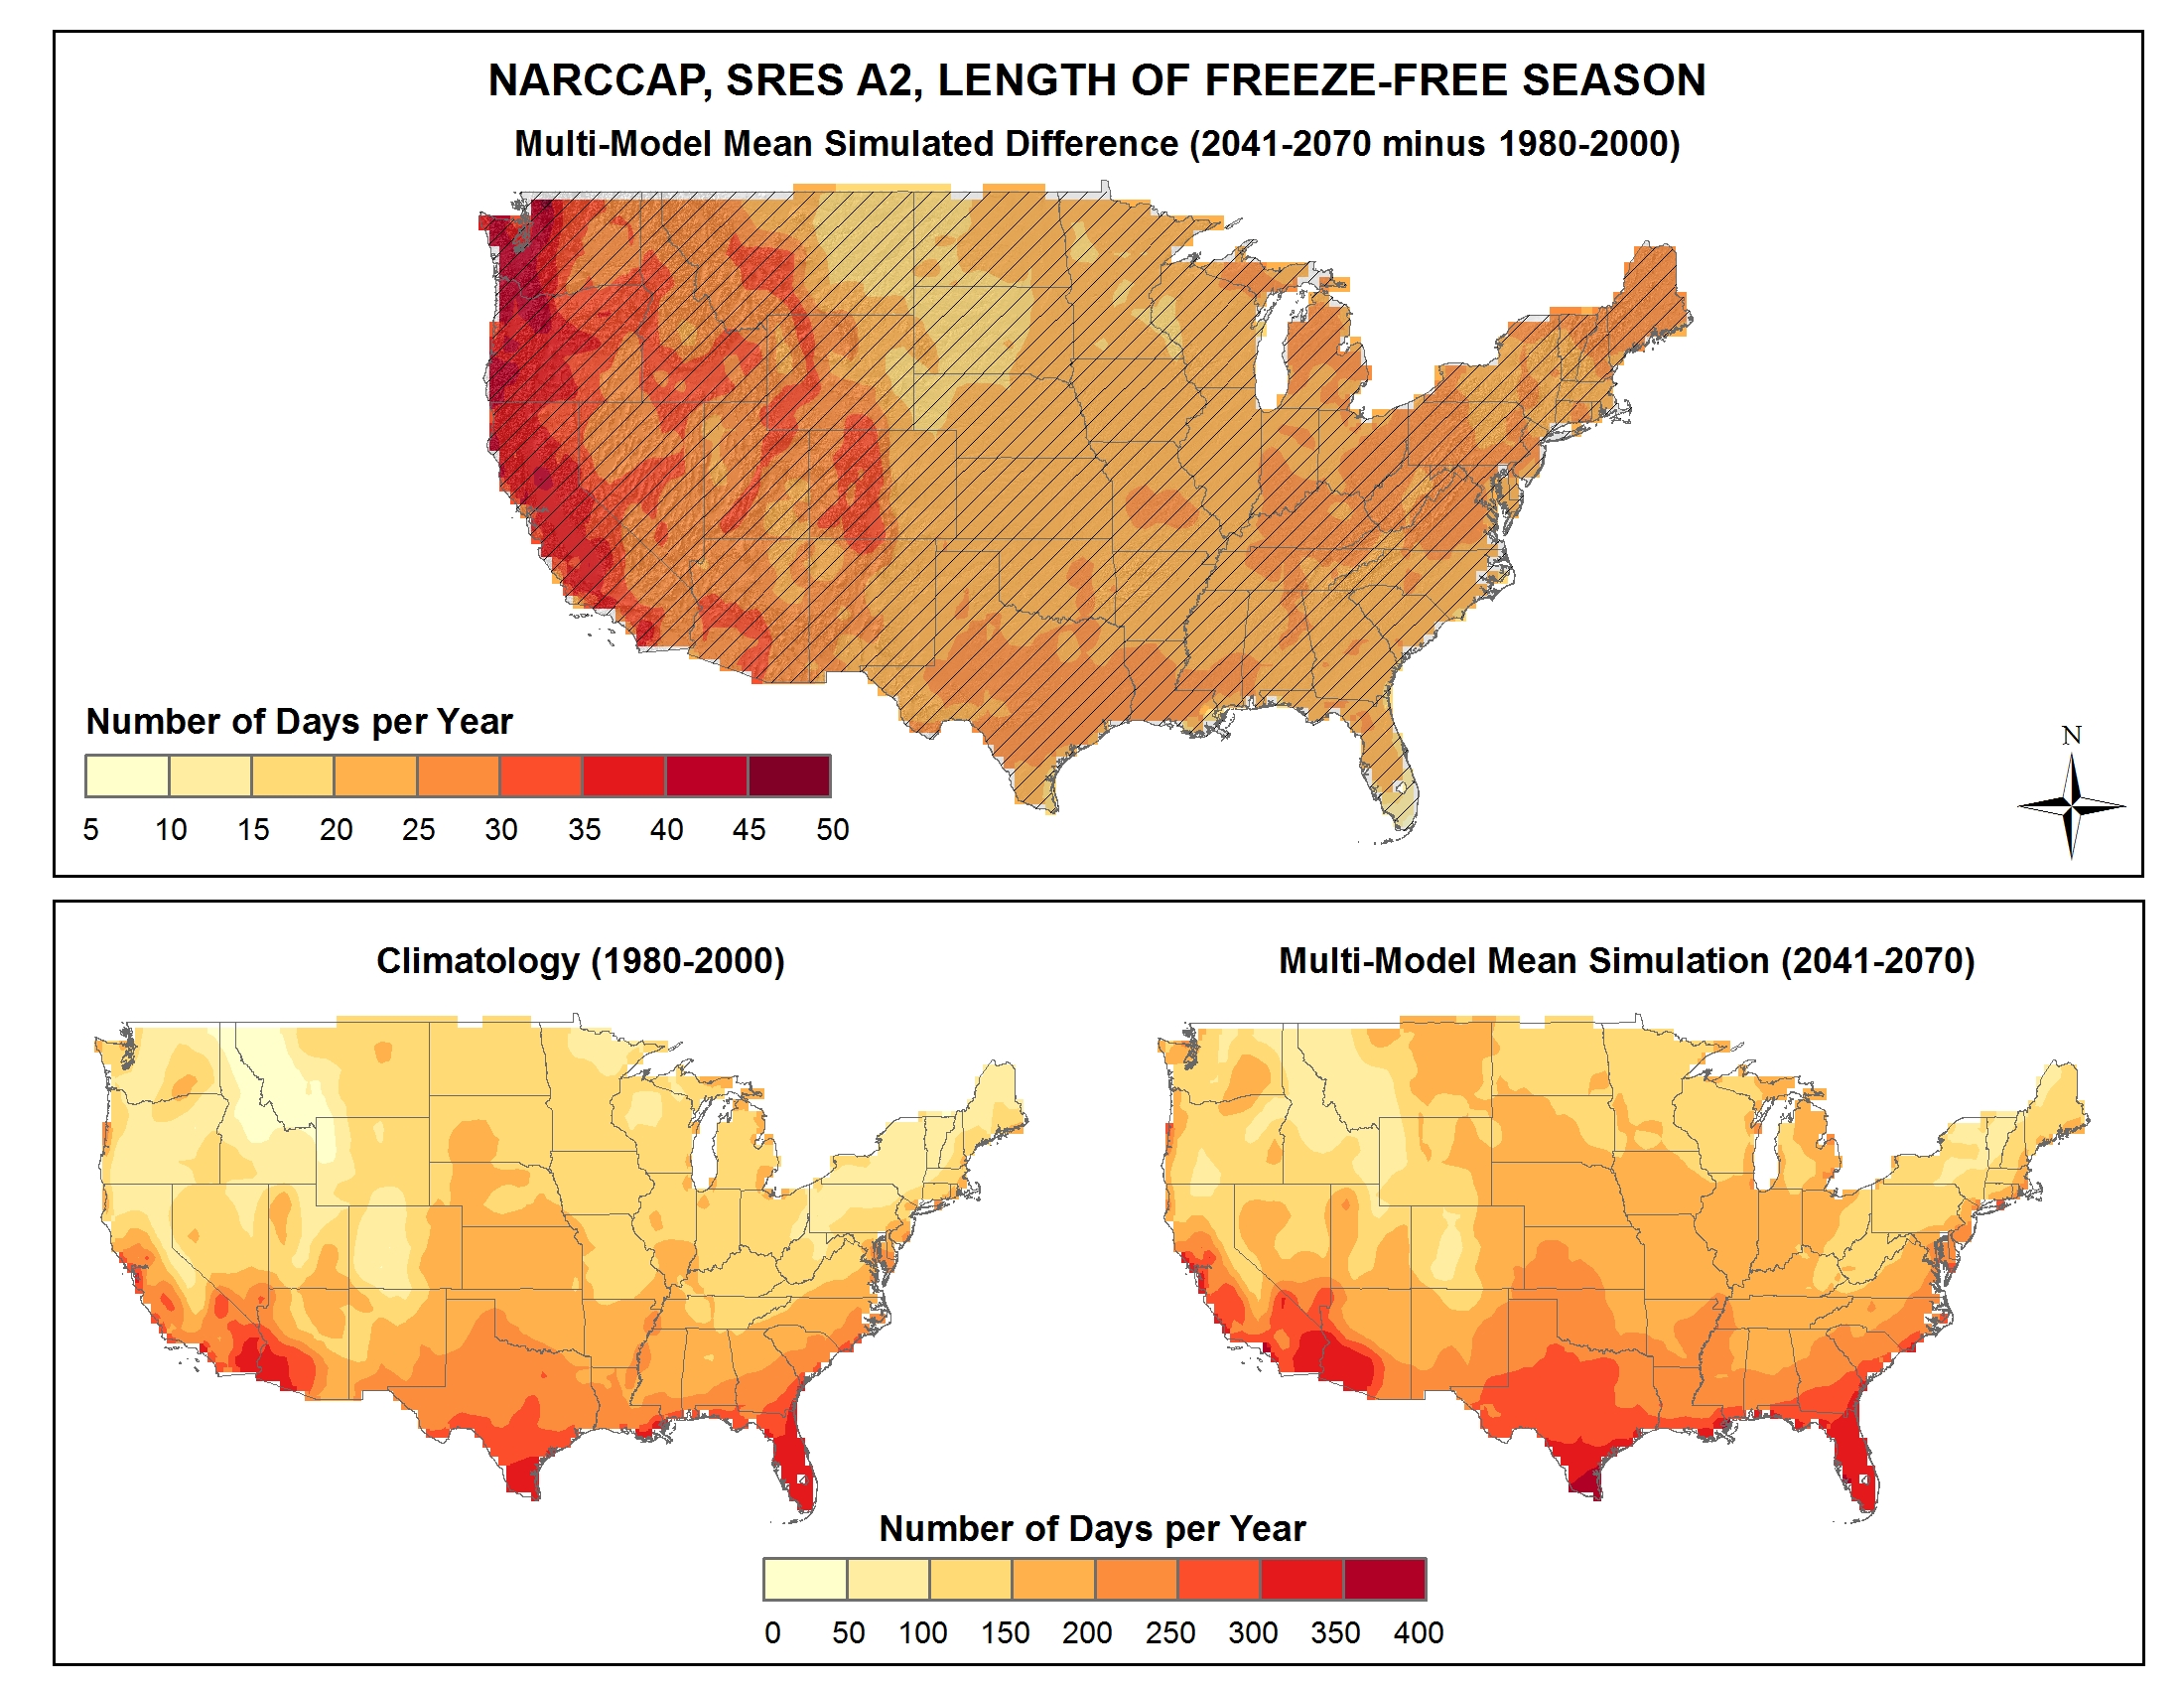
Simulated difference in the mean annual length of the freeze-free season |
Simulated |
Temperature |
National |
Regional Climate Trends and Scenarios for the U.S. National Climate Assessment. Part 9. Climate of the Contiguous United States |
NCA 3 |
 |
|
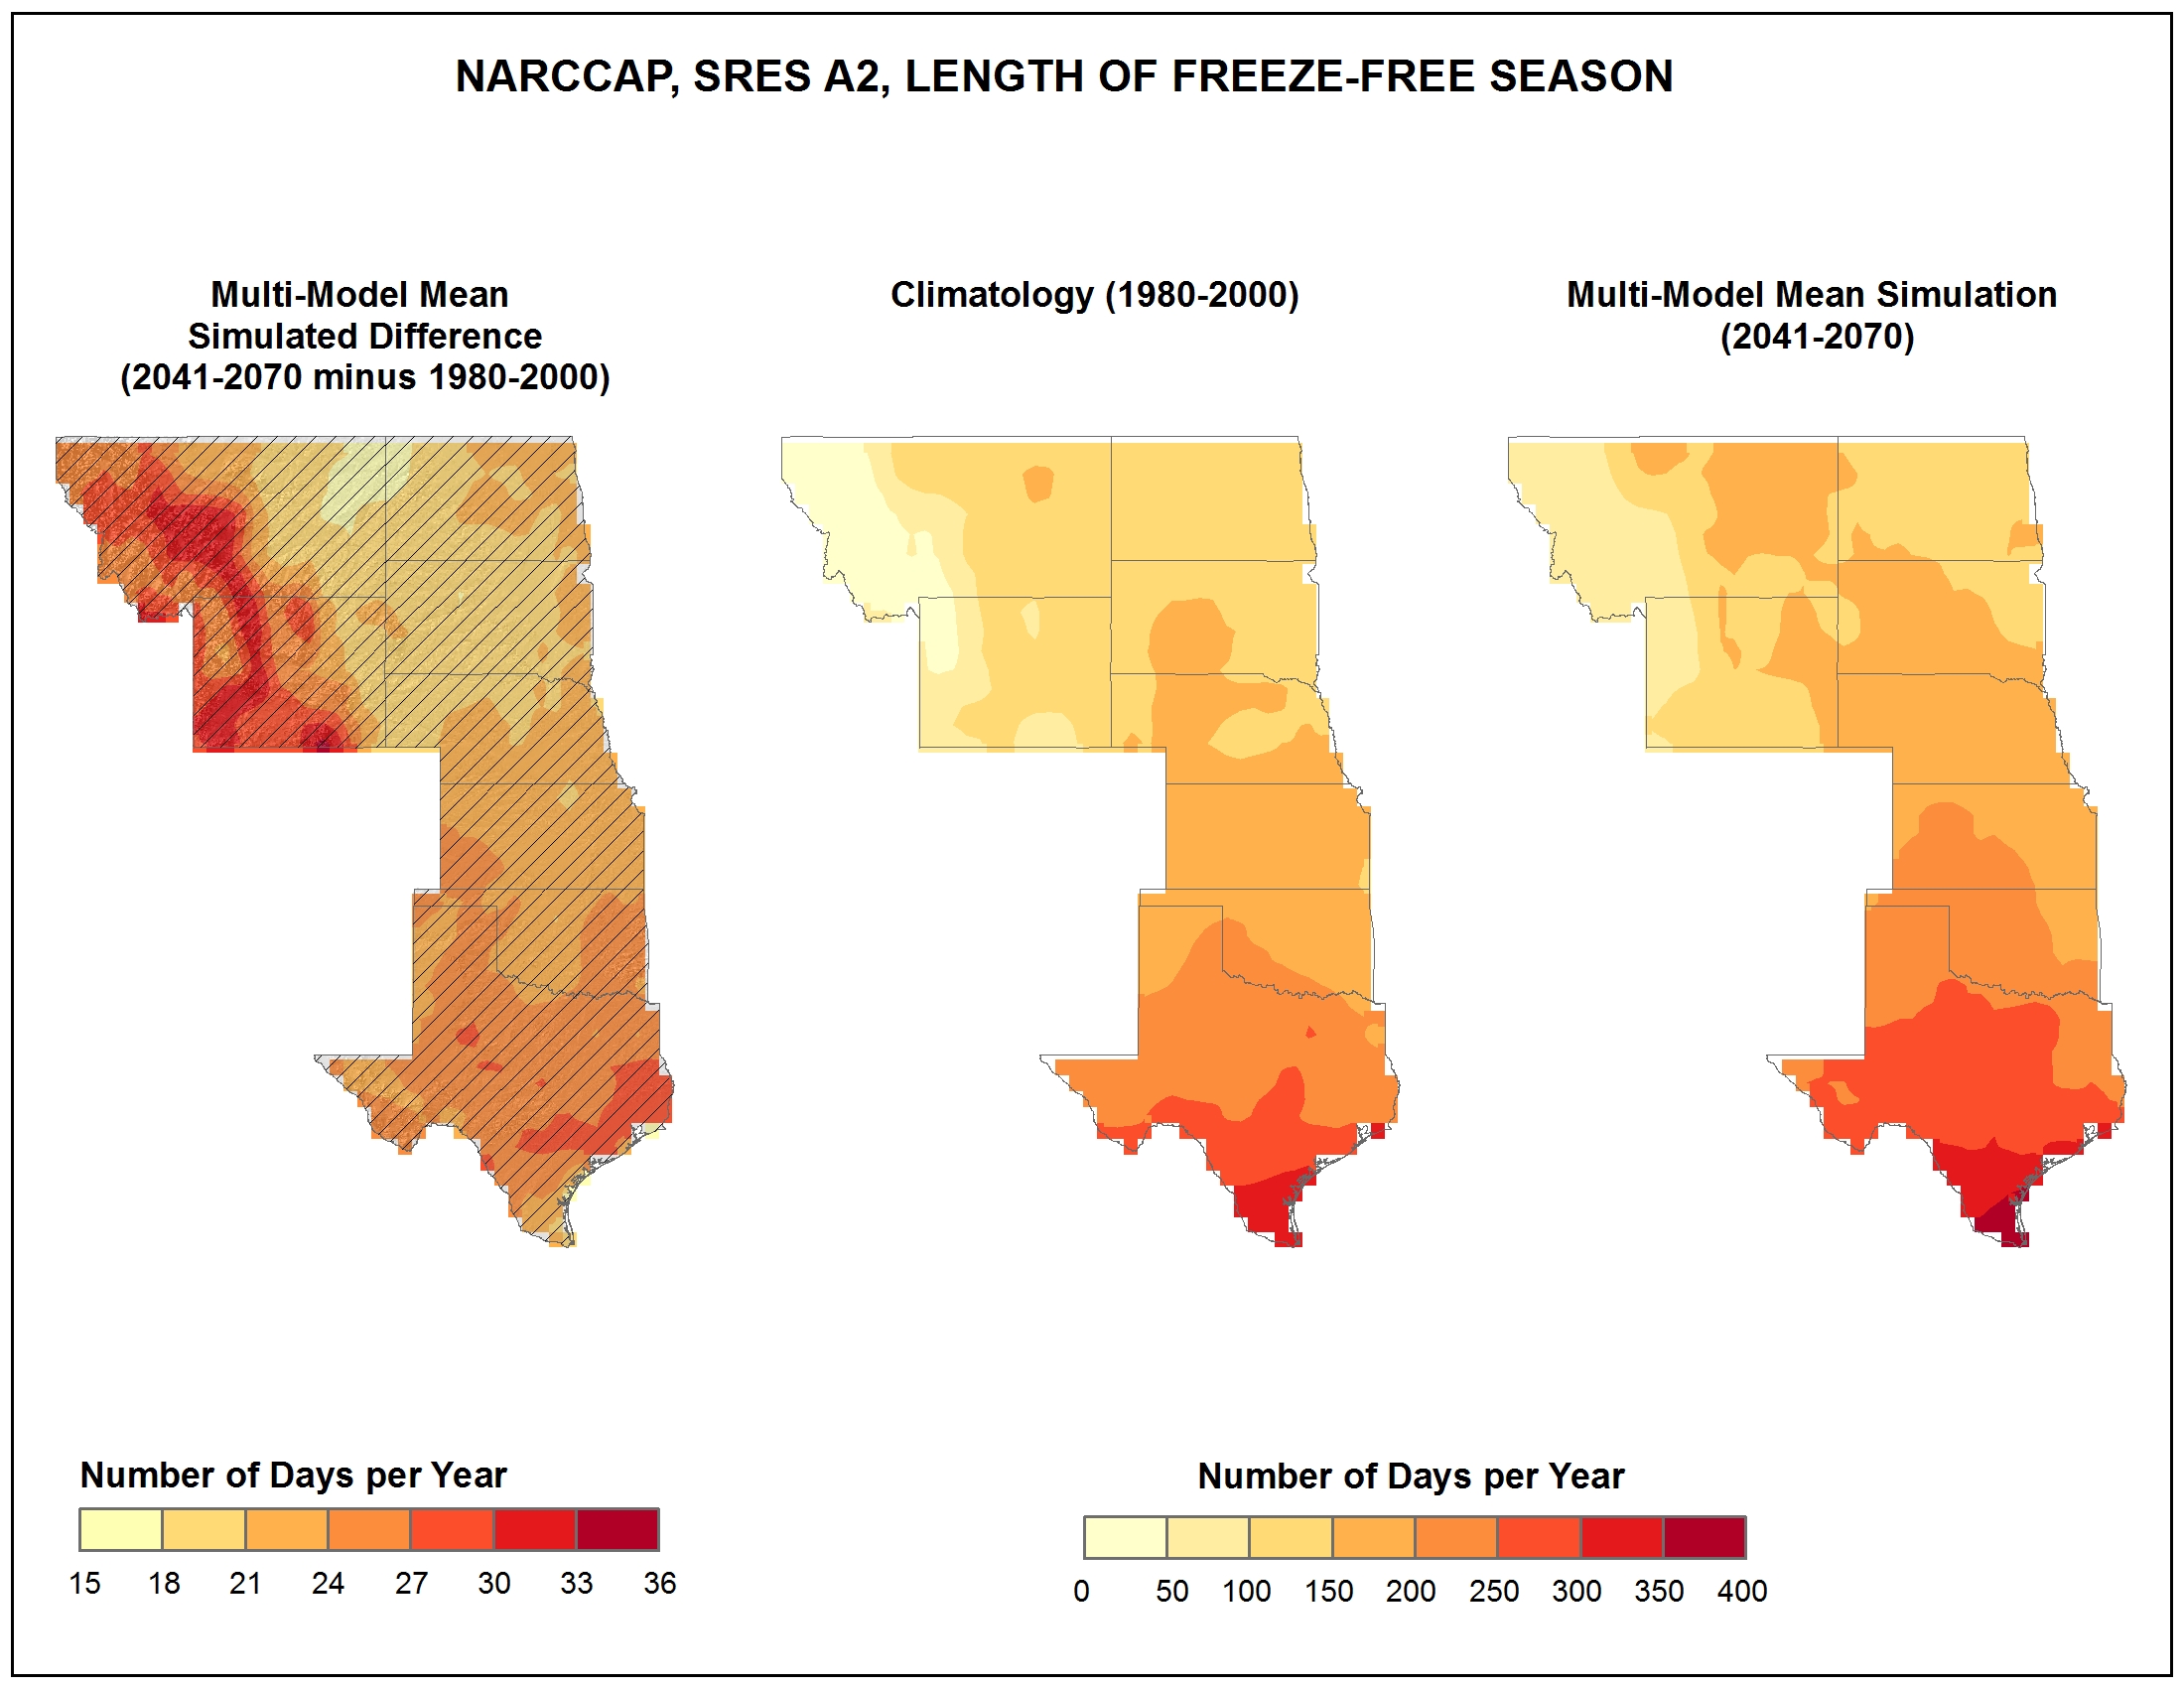
Simulated difference in the mean annual length of the freeze-free season |
Simulated |
Temperature |
Great Plains |
Regional Climate Trends and Scenarios for the U.S. National Climate Assessment. Part 4. Climate of the U.S. Great Plains |
NCA 3 |
 |
|
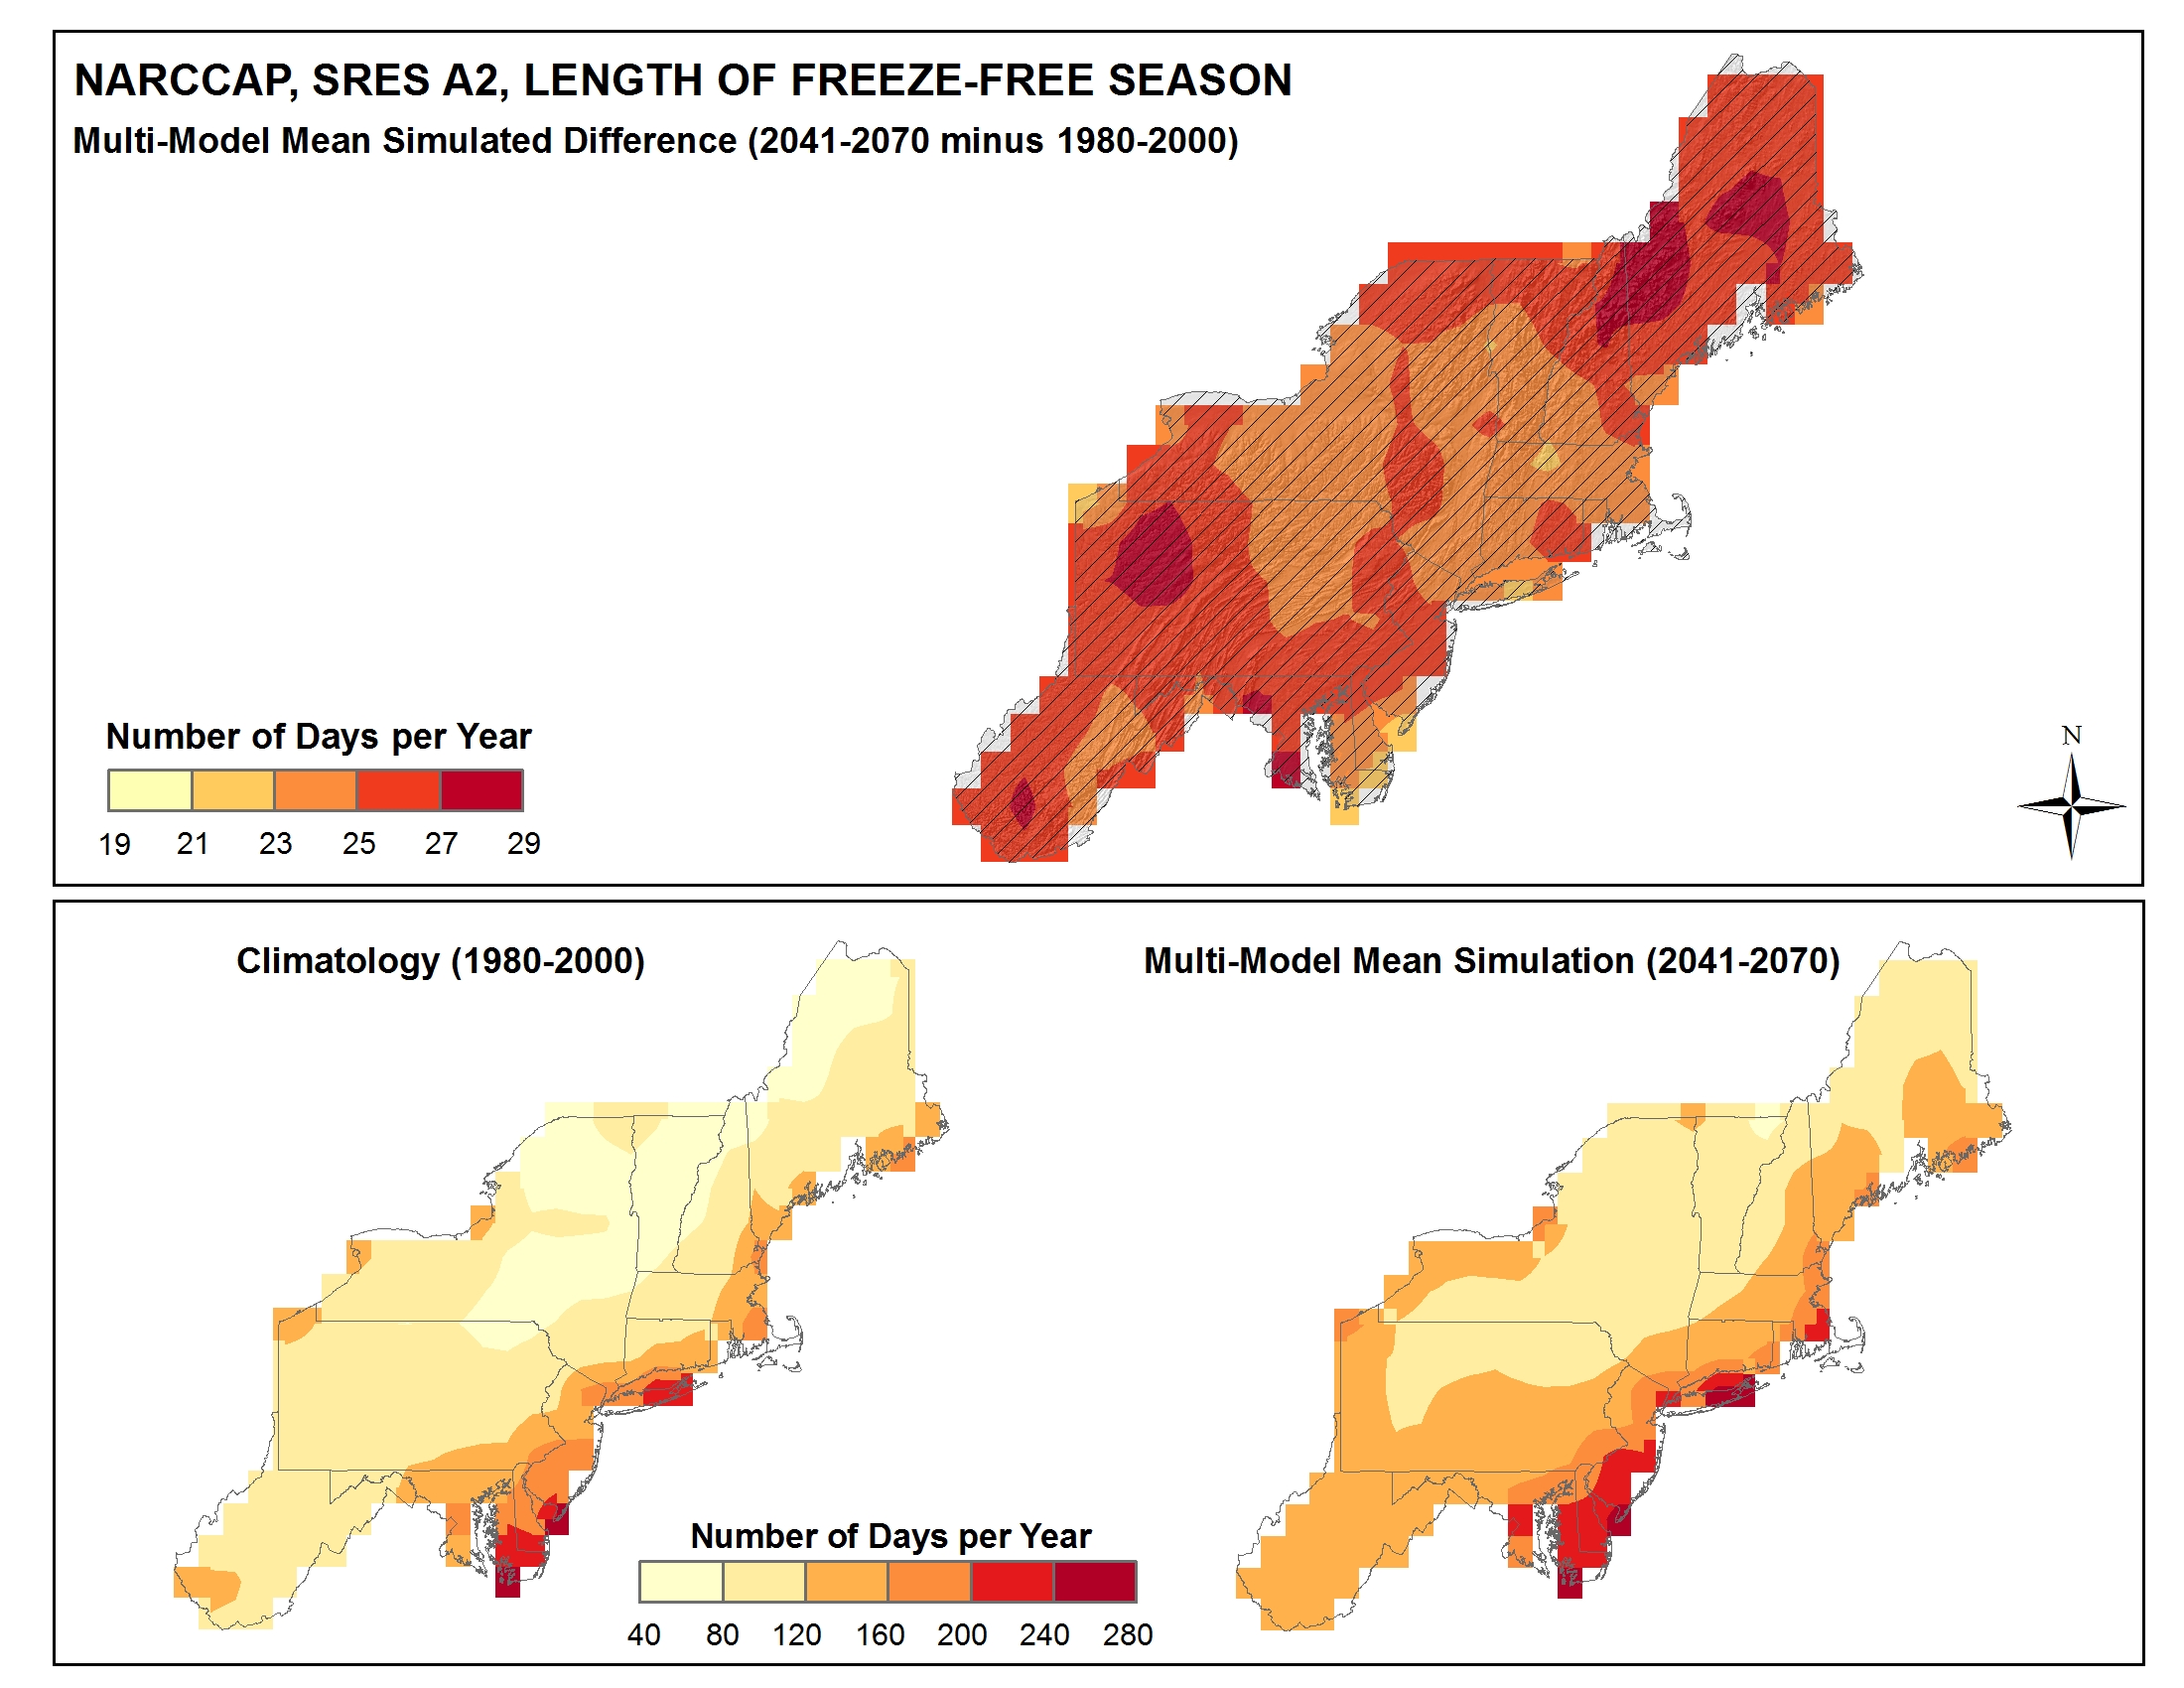
Simulated difference in the mean annual length of the freeze-free season |
Simulated |
Temperature |
Northeast |
Regional Climate Trends and Scenarios for the U.S. National Climate Assessment. Part 1. Climate of the Northeast U.S. |
NCA 3 |
 |
|
Simulated difference in the mean annual length of the freeze-free season |
Simulated |
Temperature |
Southwest |
Regional Climate Trends and Scenarios for the U.S. National Climate Assessment. Part 5. Climate of the Southwest U.S. |
NCA 3 |
 |
|
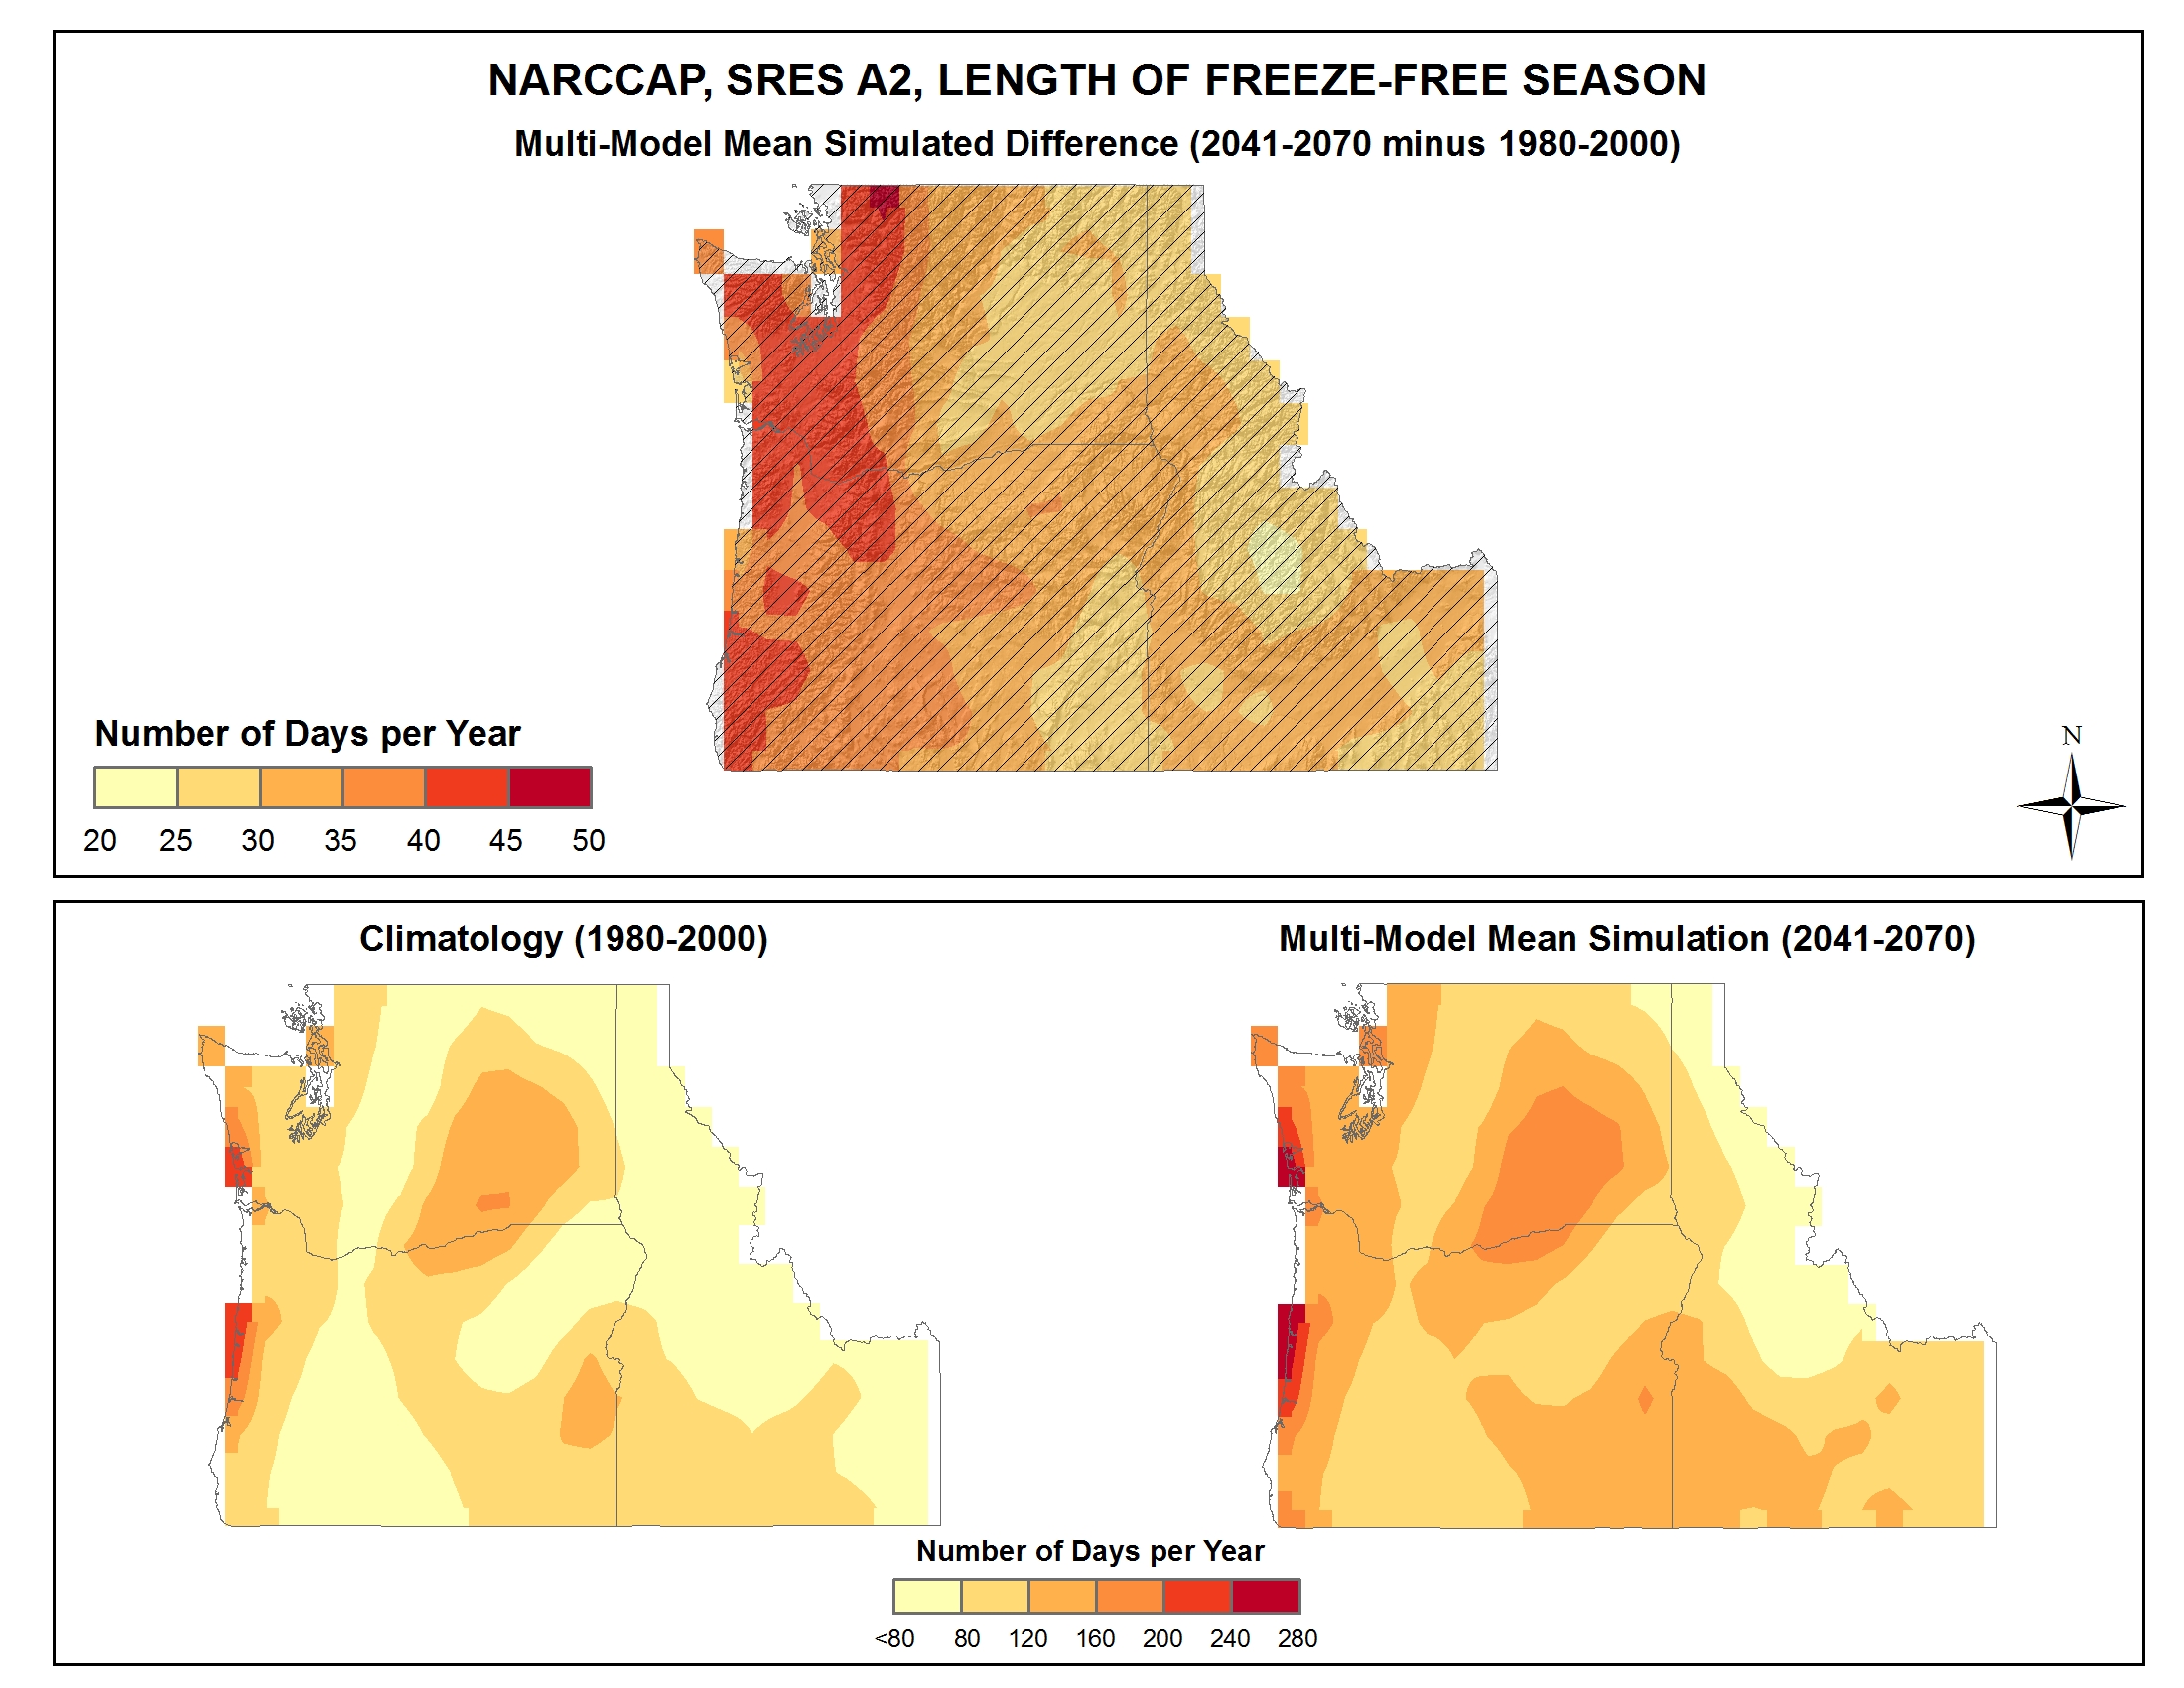
Simulated difference in the mean annual length of the freeze-free season |
Simulated |
Temperature |
Northwest |
Regional Climate Trends and Scenarios for the U.S. National Climate Assessment. Part 6. Climate of the Northwest U.S. |
NCA 3 |
 |
|
Simulated difference in mean annual temperature |
Simulated |
Temperature |
Southeast and Caribbean |
Regional Climate Trends and Scenarios for the U.S. National Climate Assessment. Part 2. Climate of the Southeast U.S. |
NCA 3 |
 |
|
Simulated difference in mean annual temperature |
Simulated |
Temperature |
National |
Regional Climate Trends and Scenarios for the U.S. National Climate Assessment. Part 9. Climate of the Contiguous United States |
NCA 3 |
 |
|
Simulated difference in mean annual temperature |
Simulated |
Temperature |
Alaska and Arctic |
Regional Climate Trends and Scenarios for the U.S. National Climate Assessment. Part 7. Climate of Alaska |
NCA 3 |
 |
|
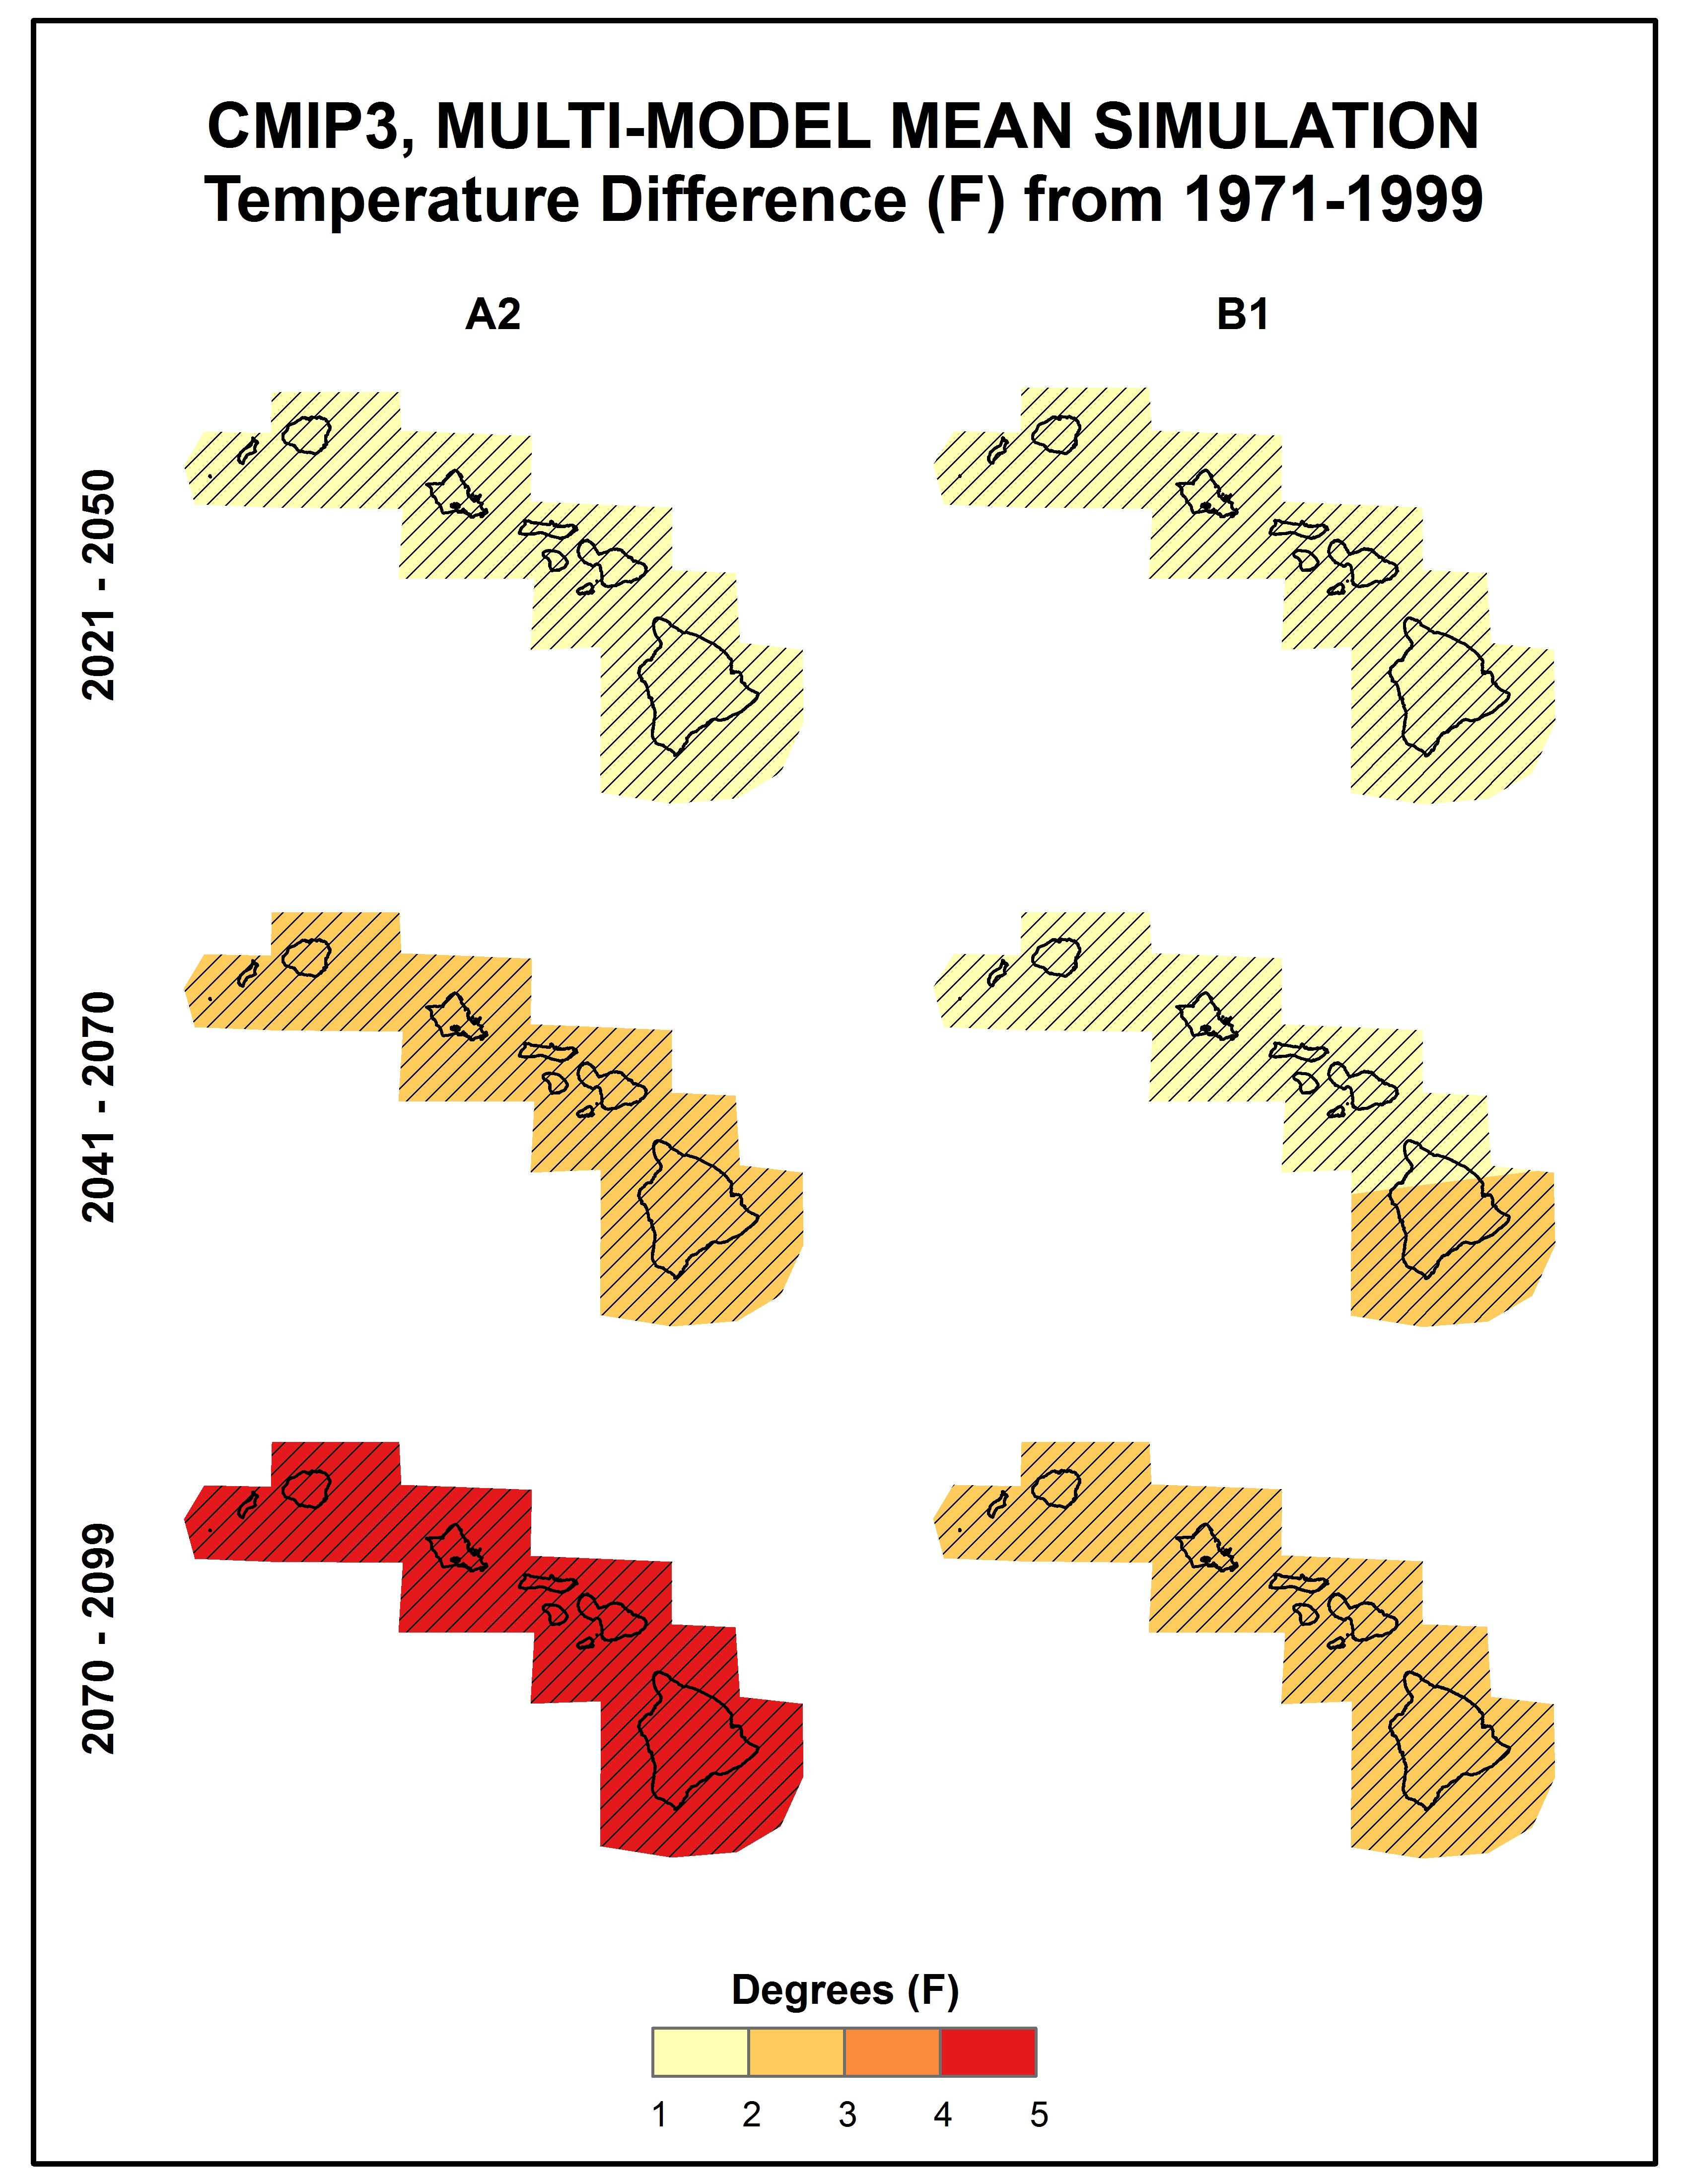
Simulated difference in mean annual temperature |
Simulated |
Temperature |
Hawaii and Pacific Islands |
Regional Climate Trends and Scenarios for the U.S. National Climate Assessment. Part 8. Climate of the Pacific Islands |
NCA 3 |
 |
|
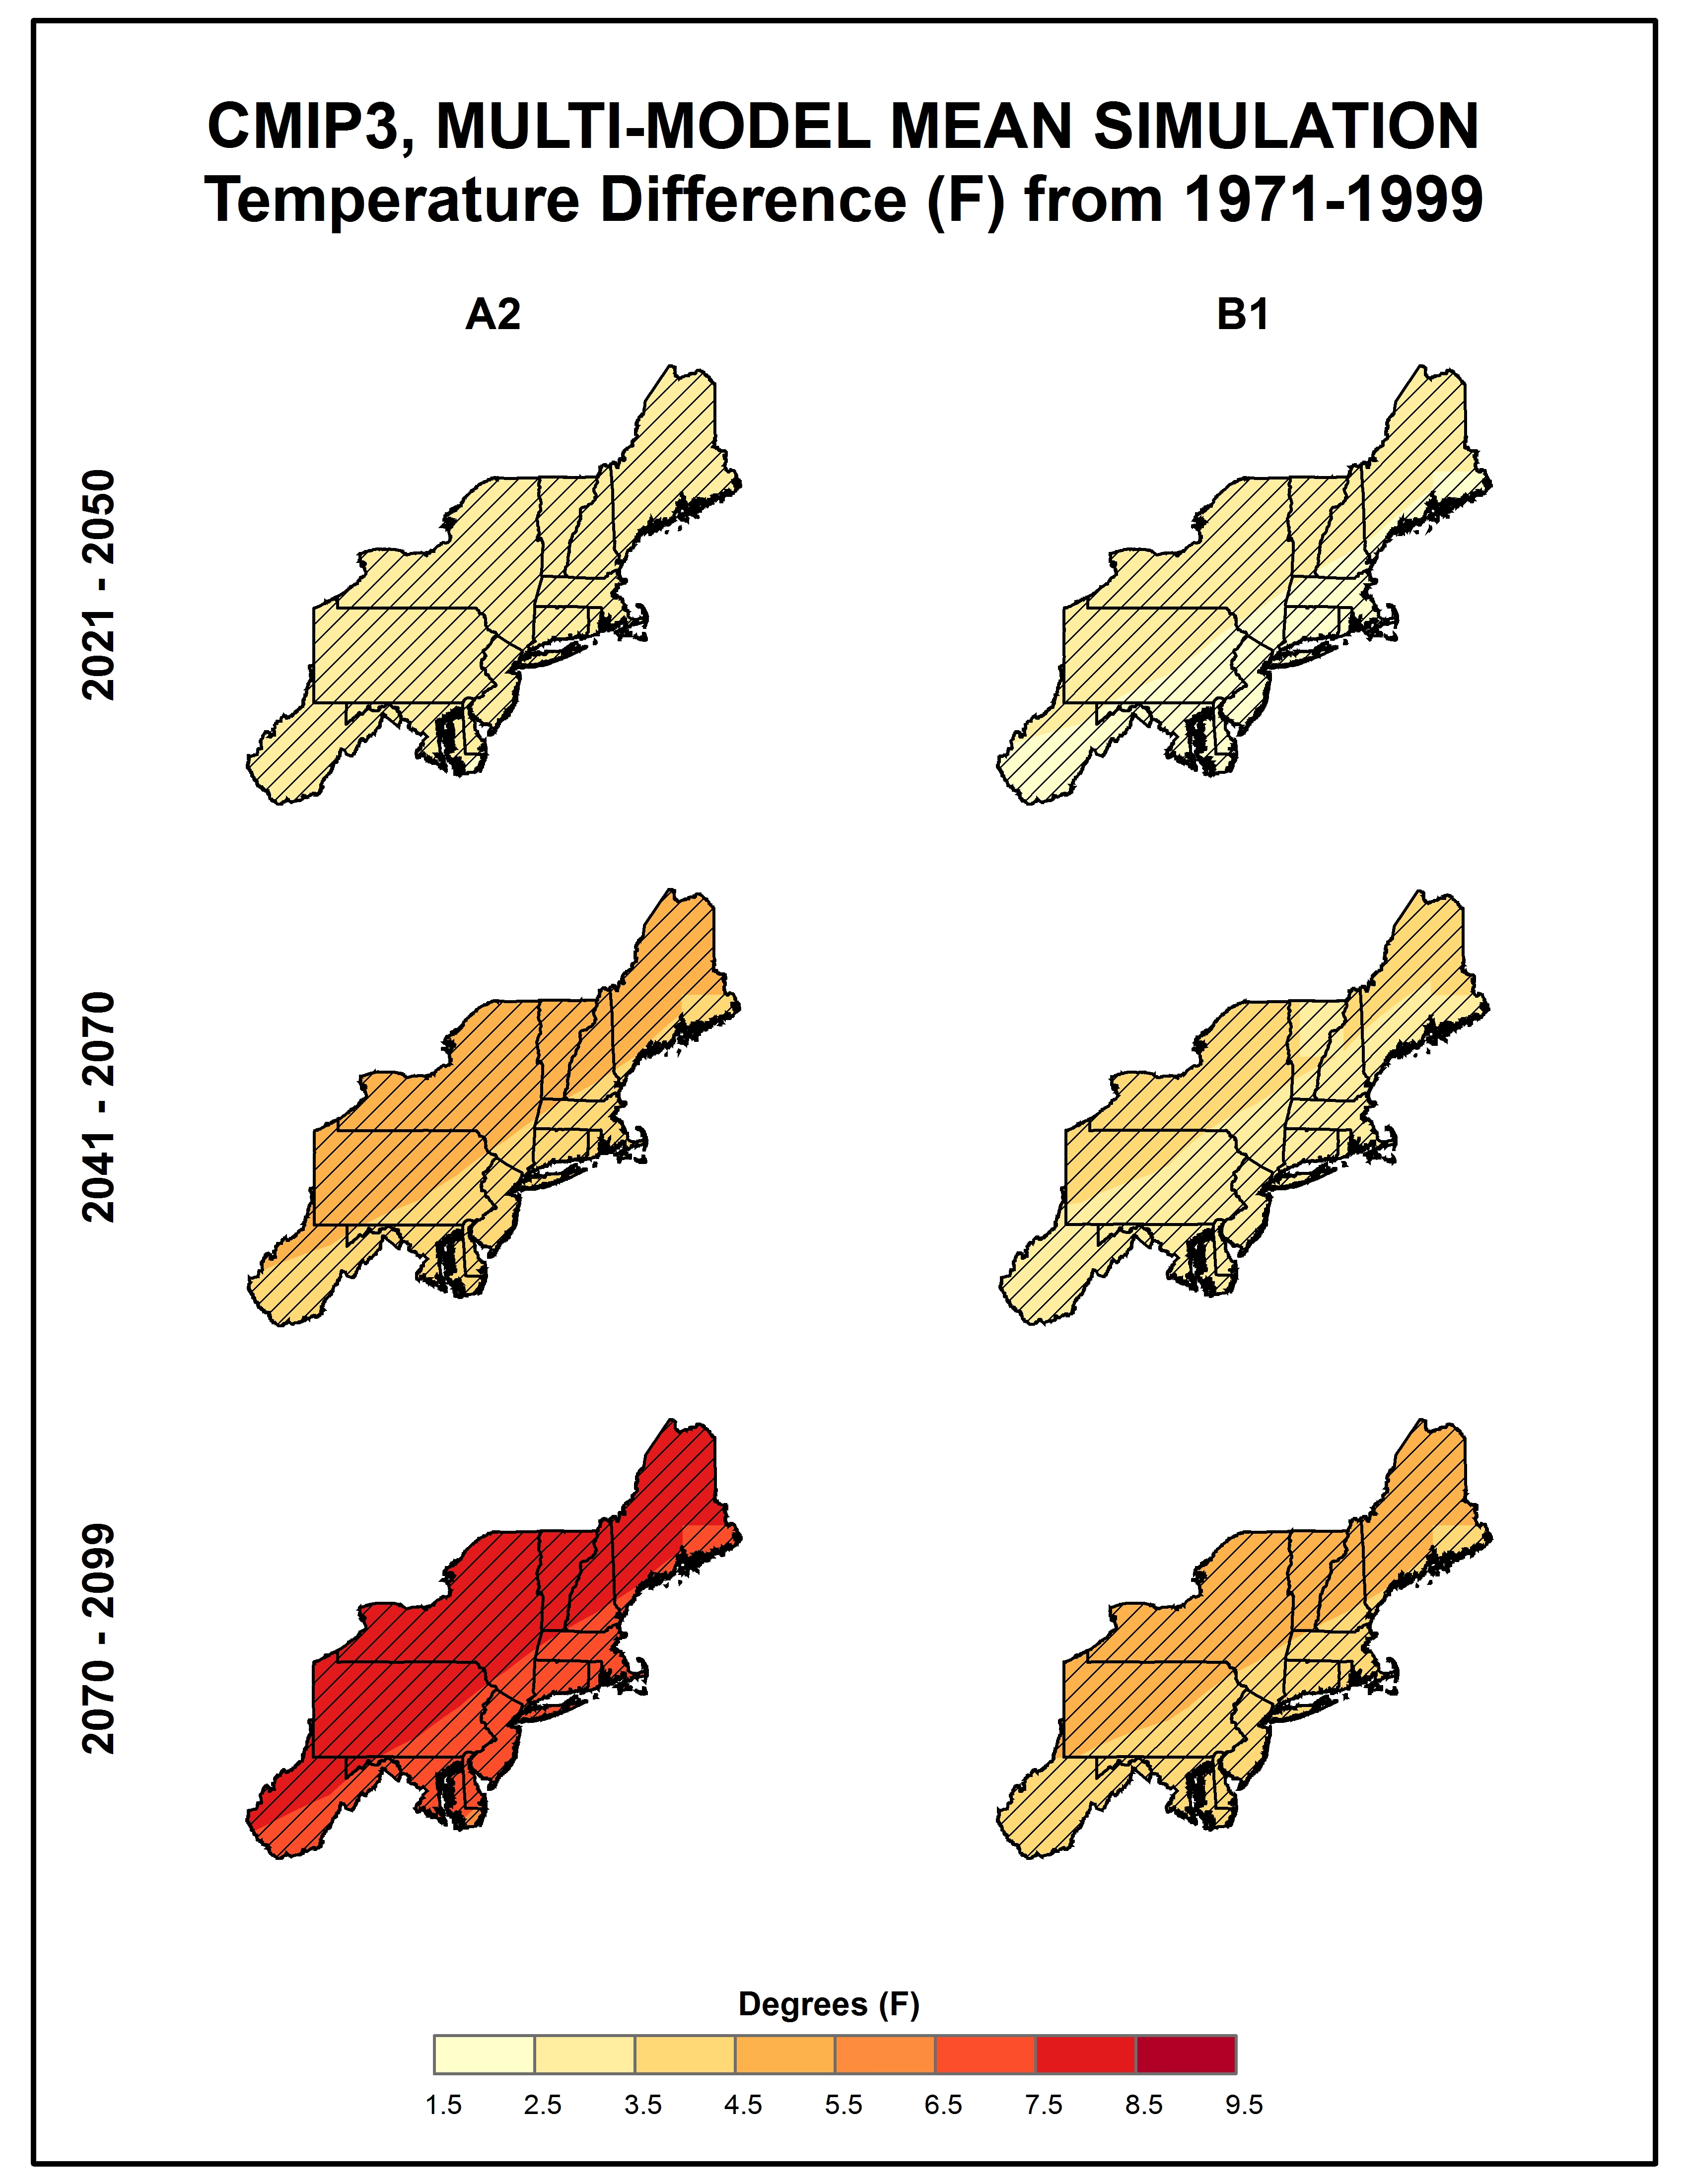
Simulated difference in mean annual temperature |
Simulated |
Temperature |
Northeast |
Regional Climate Trends and Scenarios for the U.S. National Climate Assessment. Part 1. Climate of the Northeast U.S. |
NCA 3 |
 |
|
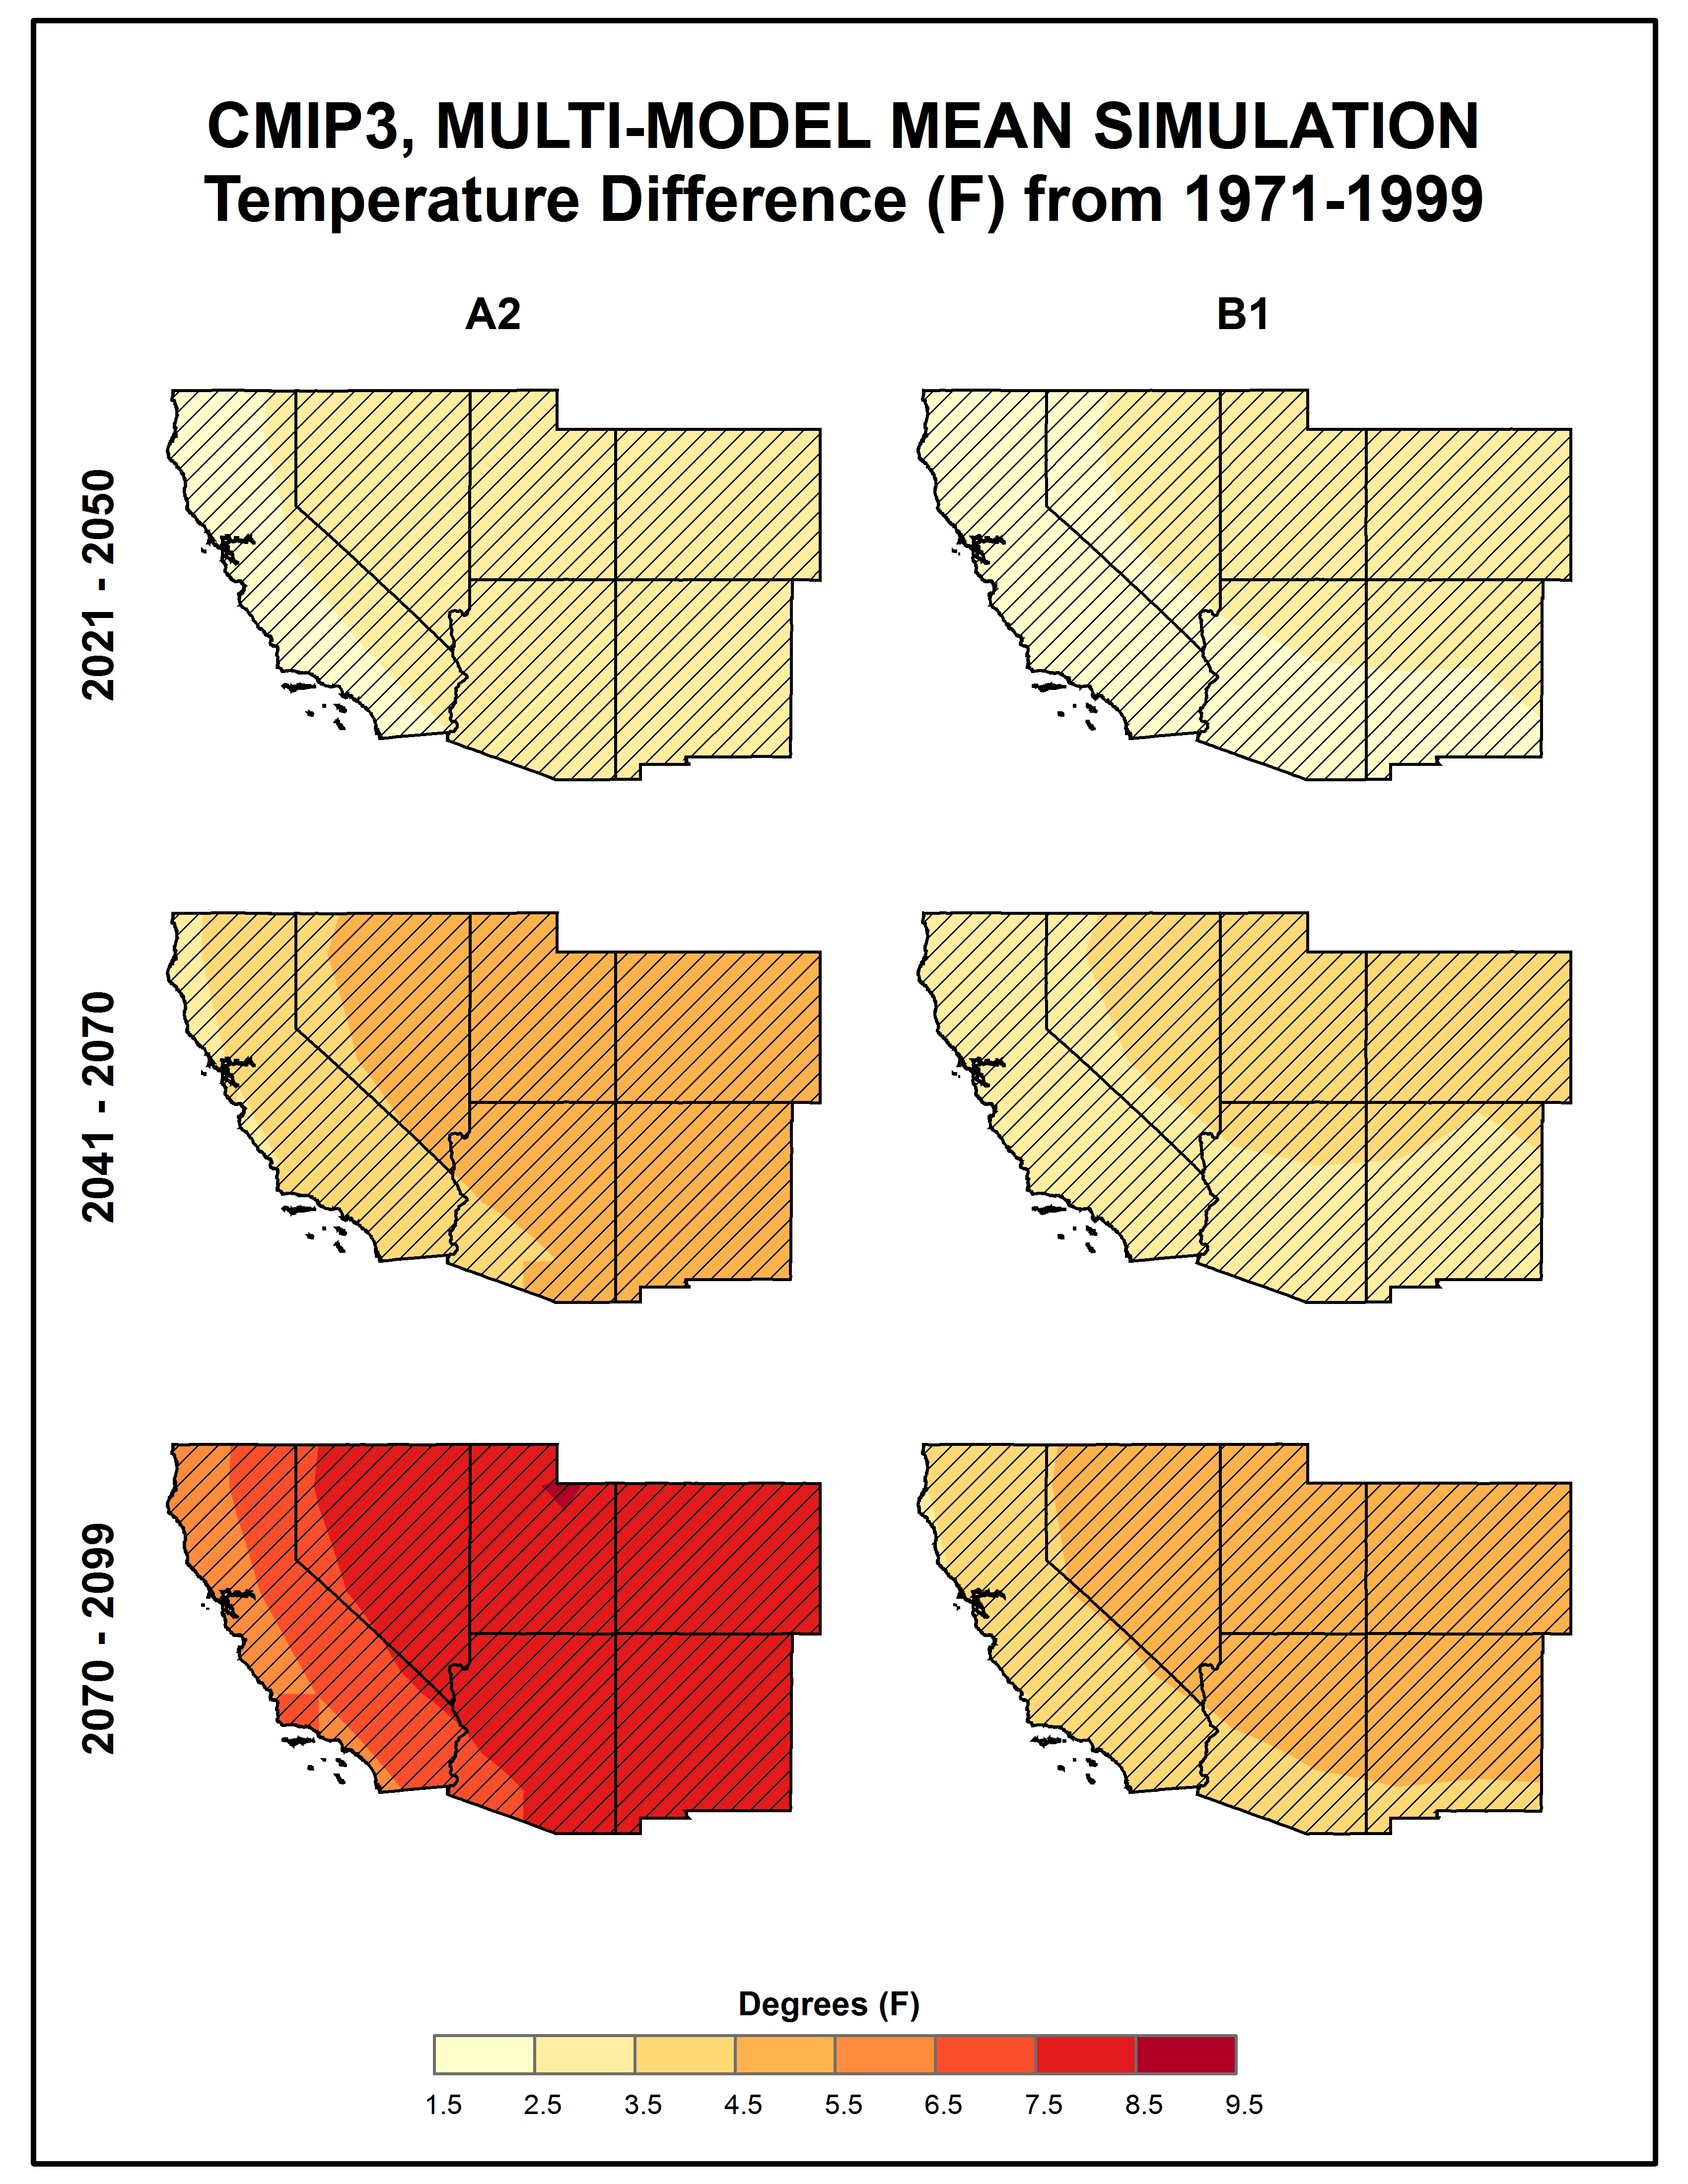
Simulated difference in mean annual temperature |
Simulated |
Temperature |
Southwest |
Regional Climate Trends and Scenarios for the U.S. National Climate Assessment. Part 5. Climate of the Southwest U.S. |
NCA 3 |
 |
|
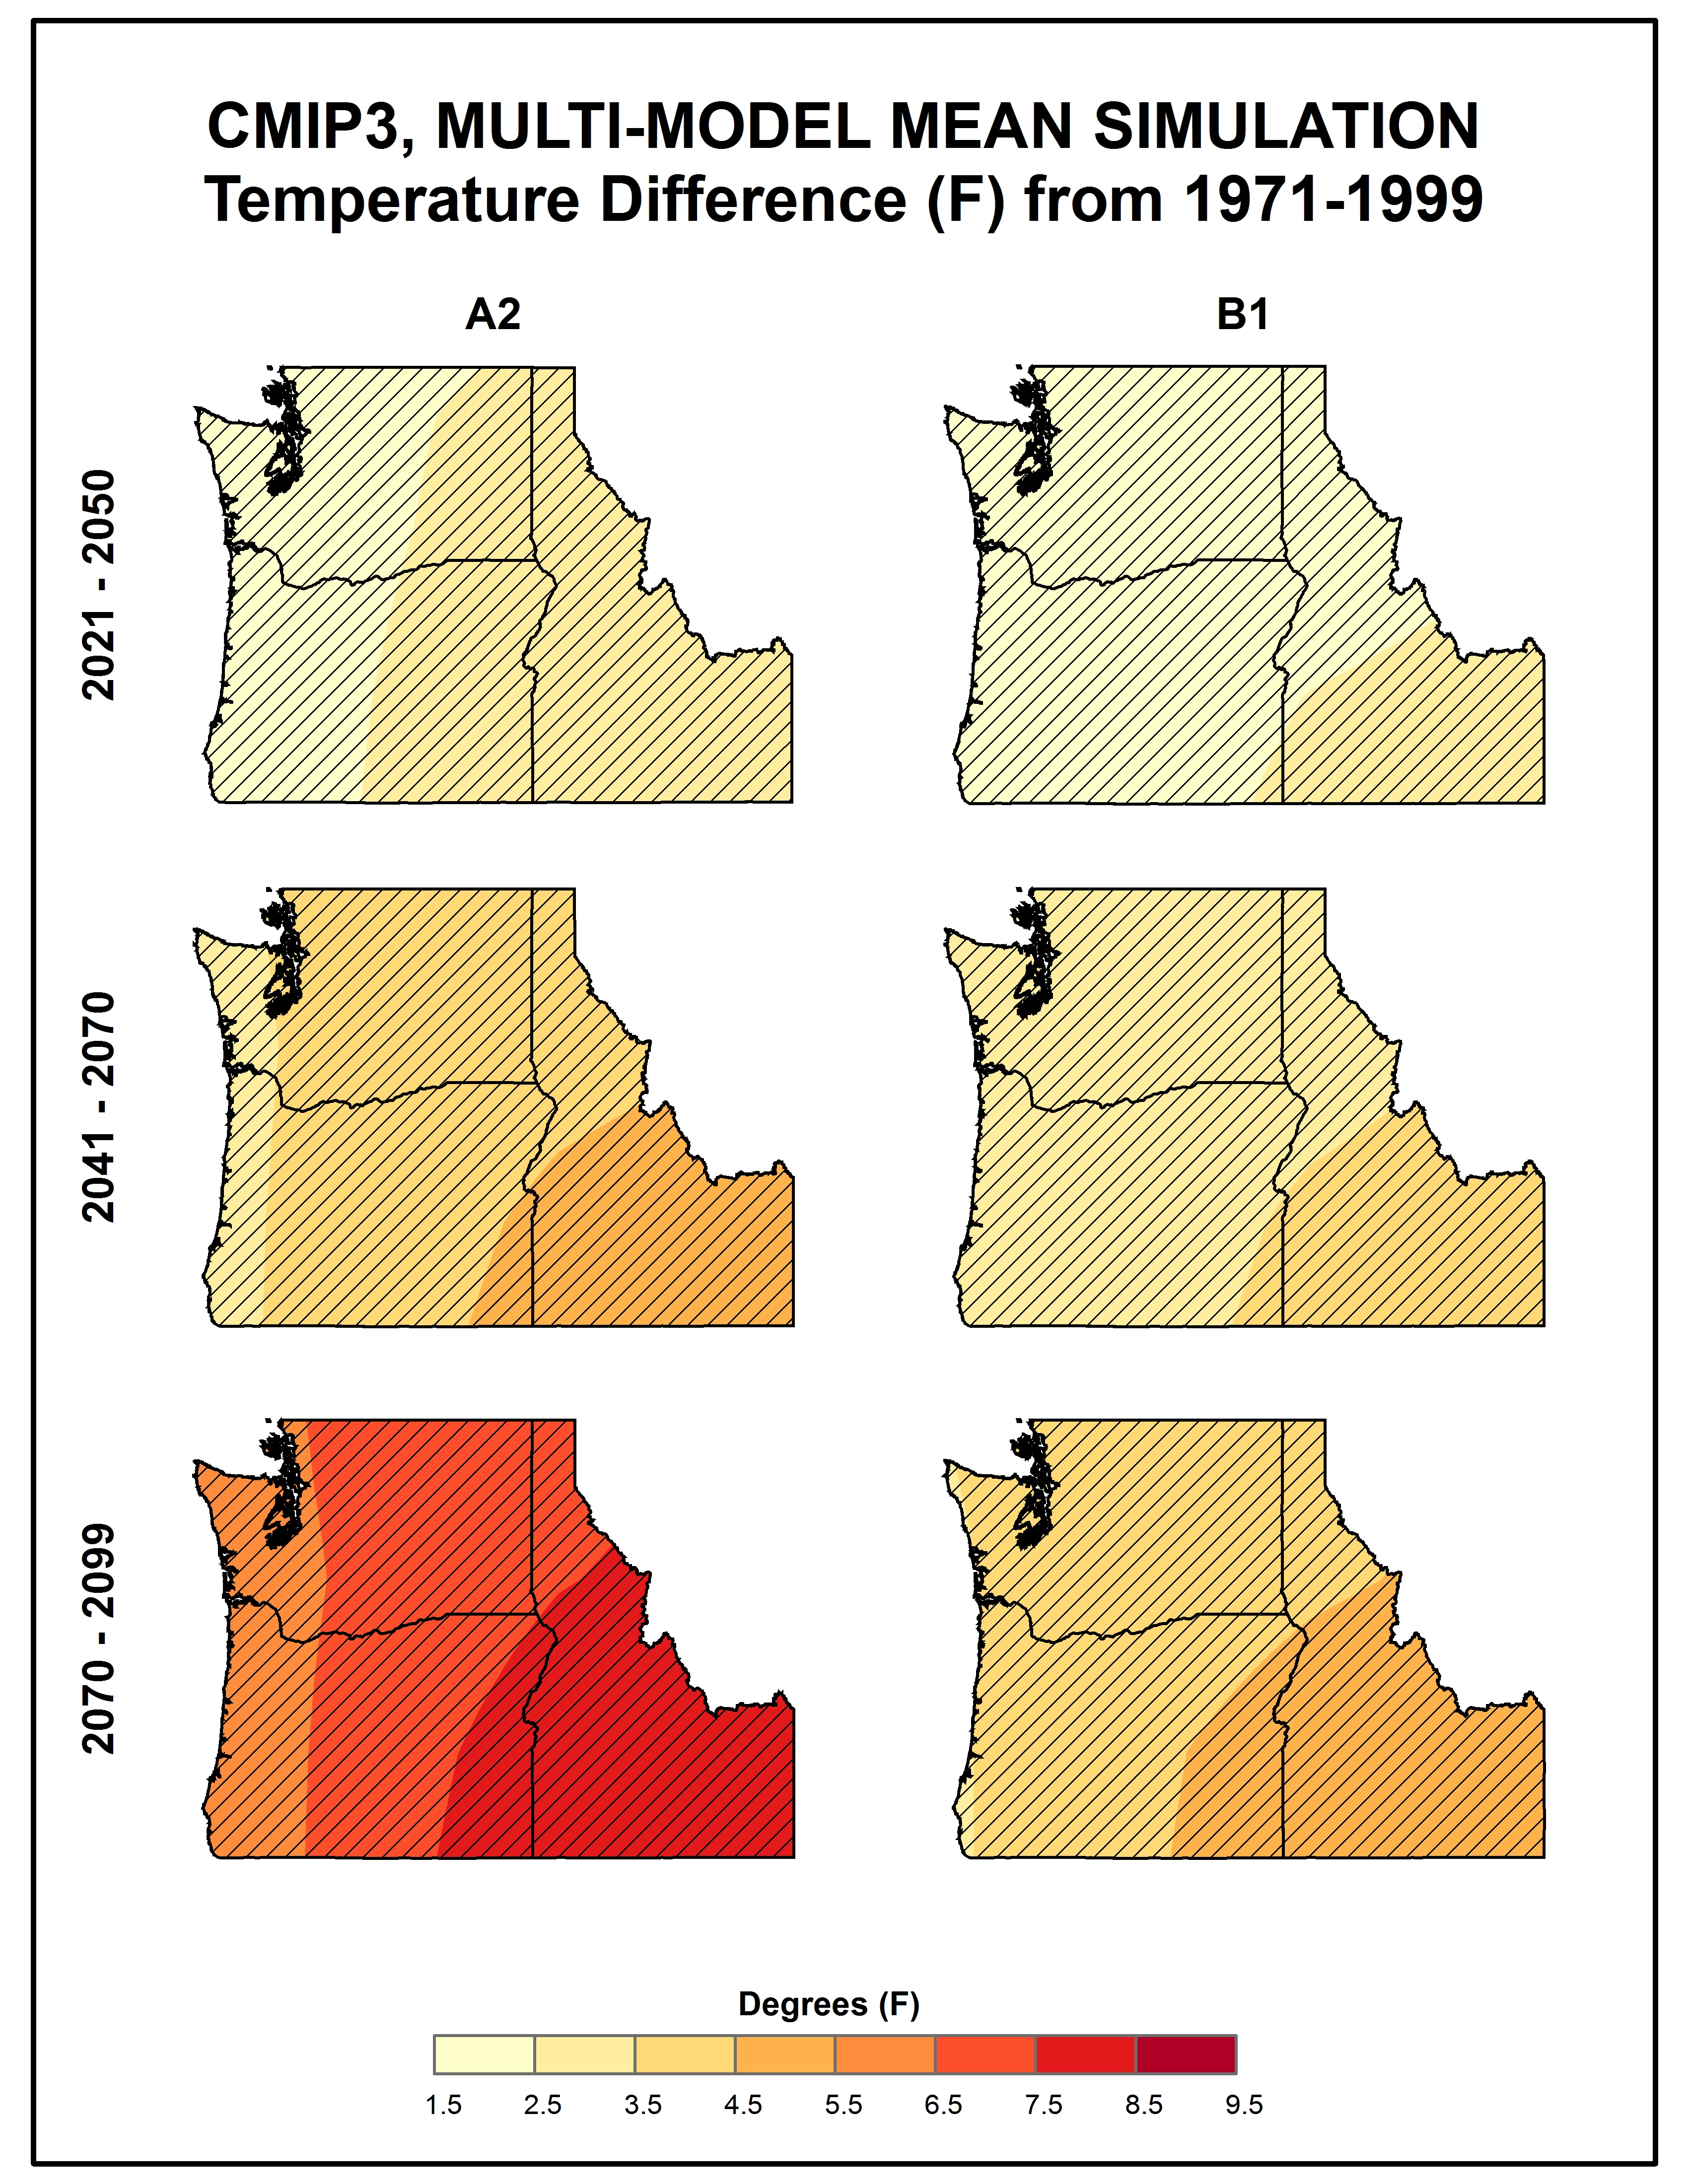
Simulated difference in mean annual temperature |
Simulated |
Temperature |
Northwest |
Regional Climate Trends and Scenarios for the U.S. National Climate Assessment. Part 6. Climate of the Northwest U.S. |
NCA 3 |
 |
|
Simulated difference in mean annual temperature |
Simulated |
Temperature |
Midwest |
Regional Climate Trends and Scenarios for the U.S. National Climate Assessment. Part 3. Climate of the Midwest U.S. |
NCA 3 |
 |
|
Simulated difference in mean annual precipitation |
Simulated |
Precipitation |
Midwest |
Regional Climate Trends and Scenarios for the U.S. National Climate Assessment. Part 3. Climate of the Midwest U.S. |
NCA 3 |
 |
|
Simulated difference in mean annual precipitation |
Simulated |
Precipitation |
Southeast and Caribbean |
Regional Climate Trends and Scenarios for the U.S. National Climate Assessment. Part 2. Climate of the Southeast U.S. |
NCA 3 |
 |
|
Simulated difference in mean annual precipitation |
Simulated |
Precipitation |
National |
Regional Climate Trends and Scenarios for the U.S. National Climate Assessment. Part 9. Climate of the Contiguous United States |
NCA 3 |
 |
|
Simulated difference in mean annual precipitation |
Simulated |
Precipitation |
Great Plains |
Regional Climate Trends and Scenarios for the U.S. National Climate Assessment. Part 4. Climate of the U.S. Great Plains |
NCA 3 |
 |
|
Simulated difference in mean annual precipitation |
Simulated |
Precipitation |
Alaska and Arctic |
Regional Climate Trends and Scenarios for the U.S. National Climate Assessment. Part 7. Climate of Alaska |
NCA 3 |
 |
|
Simulated difference in mean annual precipitation |
Simulated |
Precipitation |
Hawaii and Pacific Islands |
Regional Climate Trends and Scenarios for the U.S. National Climate Assessment. Part 8. Climate of the Pacific Islands |
NCA 3 |
 |
|
Simulated difference in mean annual precipitation |
Simulated |
Precipitation |
Northeast |
Regional Climate Trends and Scenarios for the U.S. National Climate Assessment. Part 1. Climate of the Northeast U.S. |
NCA 3 |
 |
|
Simulated difference in mean annual precipitation |
Simulated |
Precipitation |
Southwest |
Regional Climate Trends and Scenarios for the U.S. National Climate Assessment. Part 5. Climate of the Southwest U.S. |
NCA 3 |
 |
|
Simulated difference in mean annual precipitation |
Simulated |
Precipitation |
Northwest |
Regional Climate Trends and Scenarios for the U.S. National Climate Assessment. Part 6. Climate of the Northwest U.S. |
NCA 3 |
 |
|
Simulated difference in annual and seasonal mean temperature |
Simulated |
Temperature |
Southeast and Caribbean |
Regional Climate Trends and Scenarios for the U.S. National Climate Assessment. Part 2. Climate of the Southeast U.S. |
NCA 3 |
 |
|
Simulated difference in annual and seasonal mean temperature |
Simulated |
Temperature |
National |
Regional Climate Trends and Scenarios for the U.S. National Climate Assessment. Part 9. Climate of the Contiguous United States |
NCA 3 |
 |
|
Simulated difference in annual and seasonal mean temperature |
Simulated |
Temperature |
Great Plains |
Regional Climate Trends and Scenarios for the U.S. National Climate Assessment. Part 4. Climate of the U.S. Great Plains |
NCA 3 |
 |
|
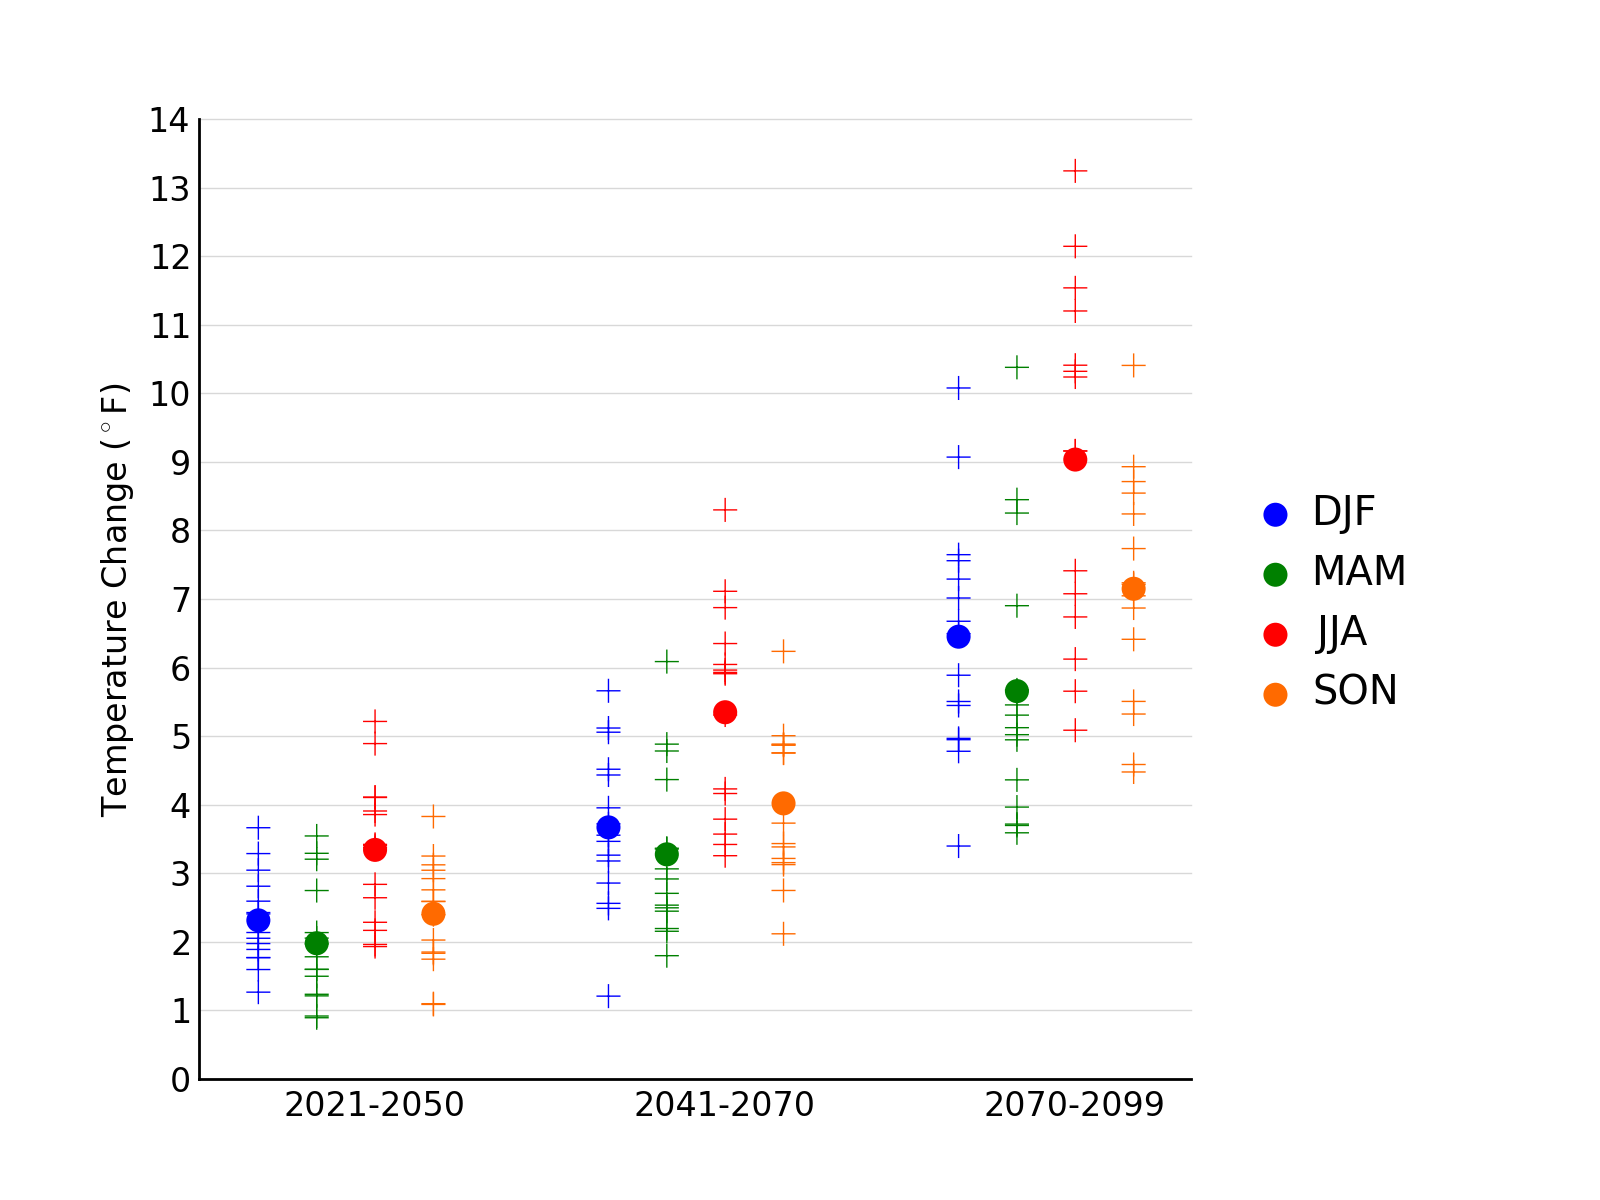
Simulated difference in annual and seasonal mean temperature |
Simulated |
Temperature |
Northeast |
Regional Climate Trends and Scenarios for the U.S. National Climate Assessment. Part 1. Climate of the Northeast U.S. |
NCA 3 |
 |
|
Simulated difference in annual and seasonal mean temperature |
Simulated |
Temperature |
Southwest |
Regional Climate Trends and Scenarios for the U.S. National Climate Assessment. Part 5. Climate of the Southwest U.S. |
NCA 3 |
 |
|
Simulated difference in annual and seasonal mean temperature |
Simulated |
Temperature |
Northwest |
Regional Climate Trends and Scenarios for the U.S. National Climate Assessment. Part 6. Climate of the Northwest U.S. |
NCA 3 |
 |
|
Simulated difference in annual and seasonal mean temperature |
Simulated |
Temperature |
Midwest |
Regional Climate Trends and Scenarios for the U.S. National Climate Assessment. Part 3. Climate of the Midwest U.S. |
NCA 3 |
 |
|
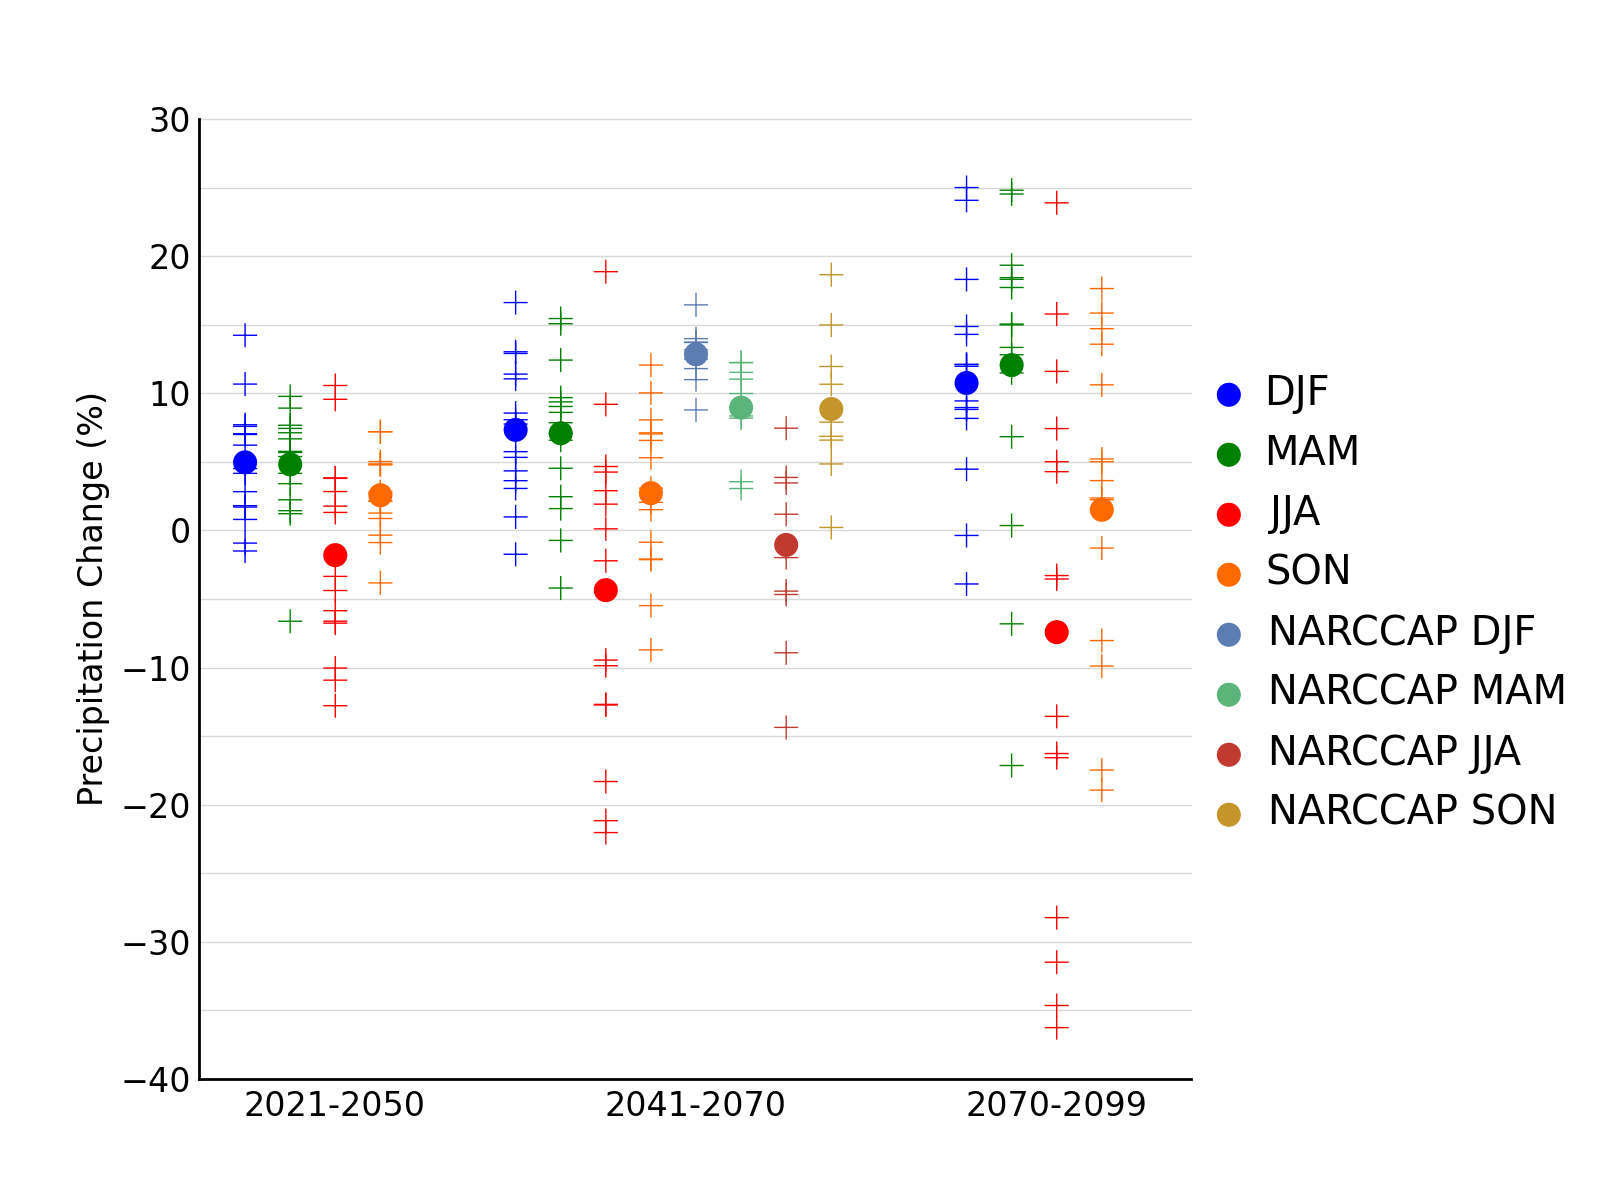
Simulated difference in annual and seasonal mean precipitation |
Simulated |
Precipitation |
Midwest |
Regional Climate Trends and Scenarios for the U.S. National Climate Assessment. Part 3. Climate of the Midwest U.S. |
NCA 3 |
 |
|
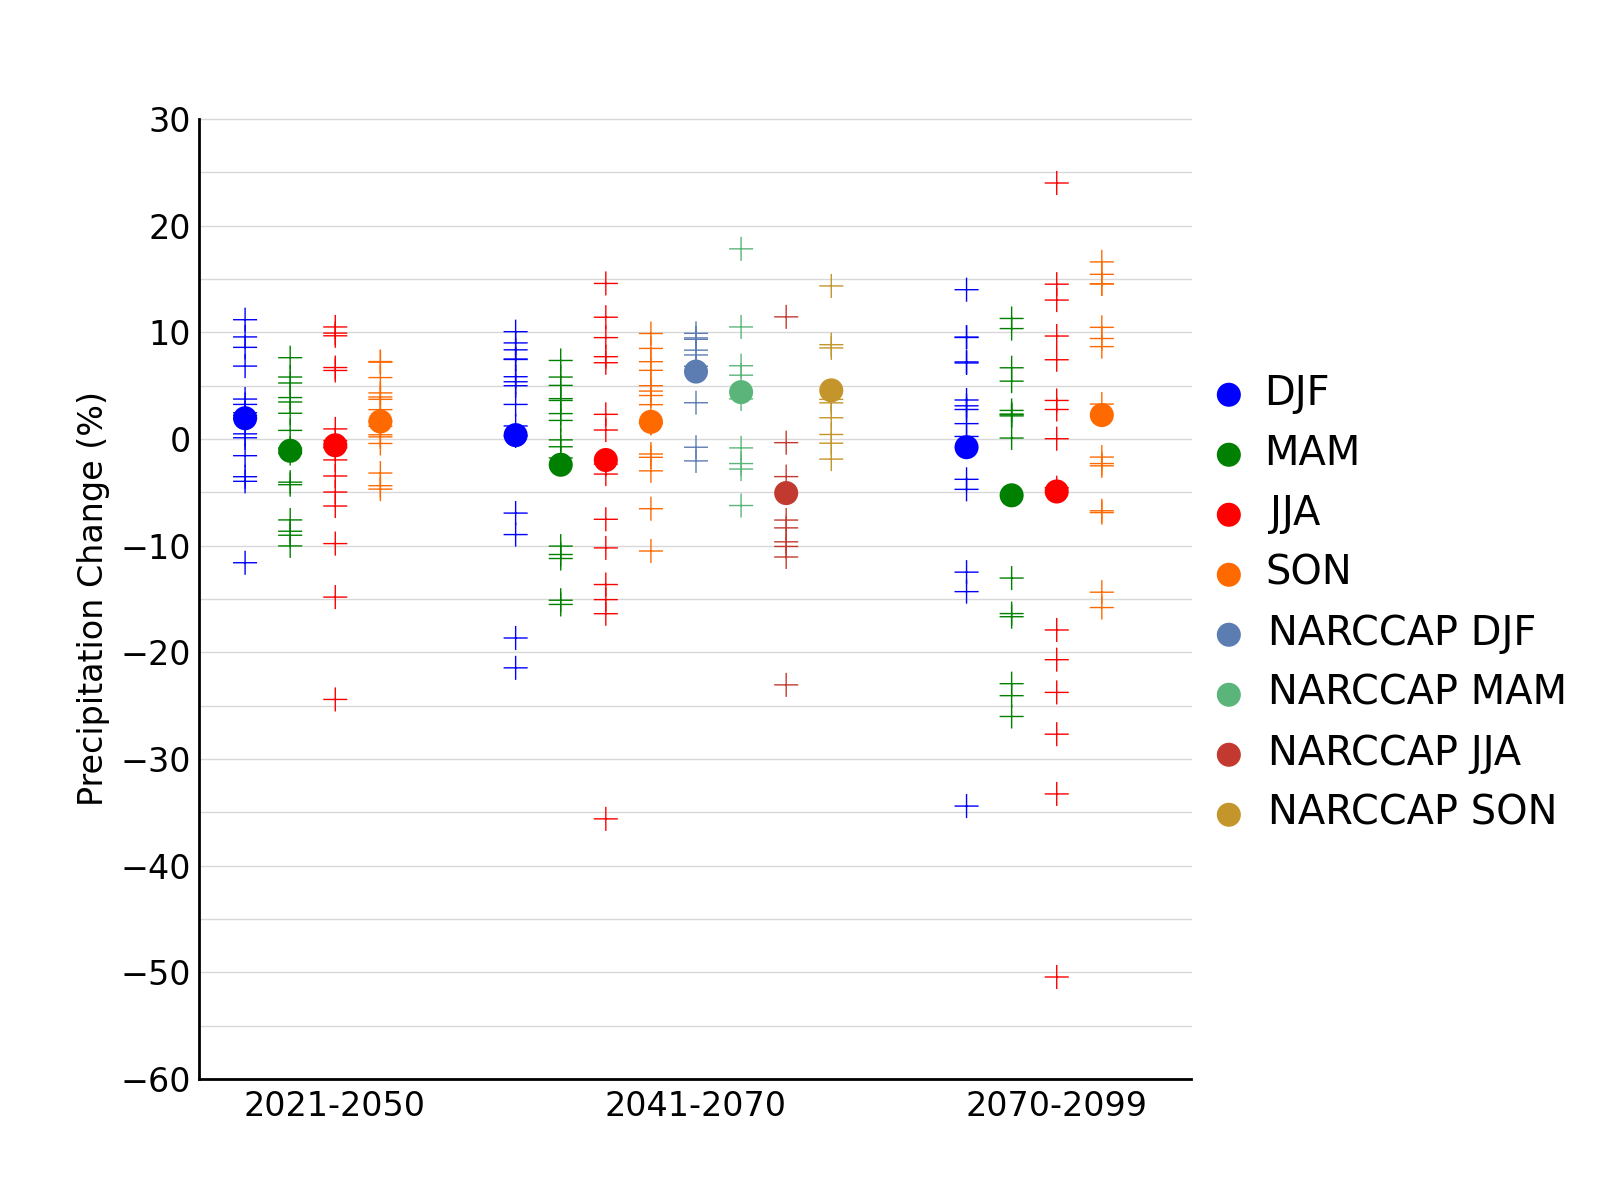
Simulated difference in annual and seasonal mean precipitation |
Simulated |
Precipitation |
Southeast and Caribbean |
Regional Climate Trends and Scenarios for the U.S. National Climate Assessment. Part 2. Climate of the Southeast U.S. |
NCA 3 |
 |
|
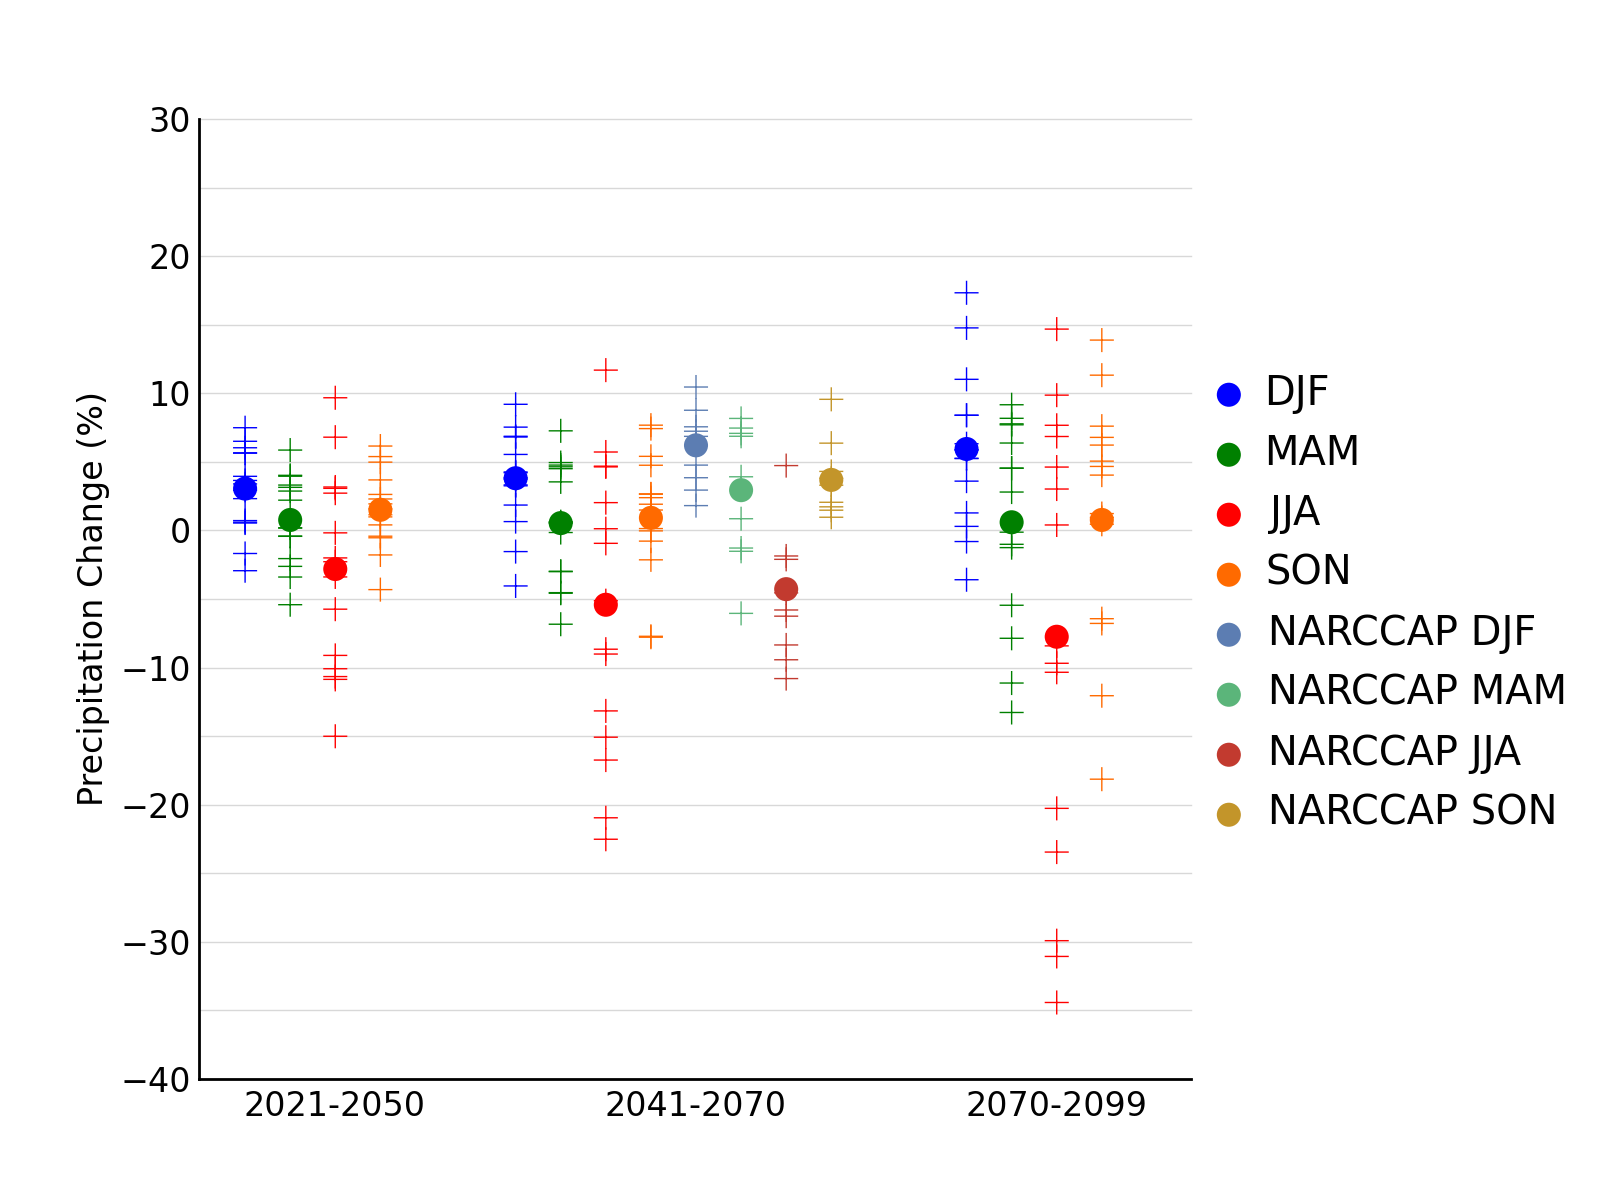
Simulated difference in annual and seasonal mean precipitation |
Simulated |
Precipitation |
National |
Regional Climate Trends and Scenarios for the U.S. National Climate Assessment. Part 9. Climate of the Contiguous United States |
NCA 3 |
 |
|
Simulated difference in annual and seasonal mean precipitation |
Simulated |
Precipitation |
Great Plains |
Regional Climate Trends and Scenarios for the U.S. National Climate Assessment. Part 4. Climate of the U.S. Great Plains |
NCA 3 |
 |
|
Simulated difference in annual and seasonal mean precipitation |
Simulated |
Precipitation |
Northeast |
Regional Climate Trends and Scenarios for the U.S. National Climate Assessment. Part 1. Climate of the Northeast U.S. |
NCA 3 |
 |
|
Simulated difference in annual and seasonal mean precipitation |
Simulated |
Precipitation |
Southwest |
Regional Climate Trends and Scenarios for the U.S. National Climate Assessment. Part 5. Climate of the Southwest U.S. |
NCA 3 |
 |
|
Simulated difference in annual and seasonal mean precipitation |
Simulated |
Precipitation |
Northwest |
Regional Climate Trends and Scenarios for the U.S. National Climate Assessment. Part 6. Climate of the Northwest U.S. |
NCA 3 |
 |
|
Simulated decadal mean change in annual temperature |
Simulated |
Temperature |
Midwest |
Regional Climate Trends and Scenarios for the U.S. National Climate Assessment. Part 3. Climate of the Midwest U.S. |
NCA 3 |
 |
|
Simulated decadal mean change in annual temperature |
Simulated |
Temperature |
Southeast and Caribbean |
Regional Climate Trends and Scenarios for the U.S. National Climate Assessment. Part 2. Climate of the Southeast U.S. |
NCA 3 |
 |
|
Simulated decadal mean change in annual temperature |
Simulated |
Temperature |
National |
Regional Climate Trends and Scenarios for the U.S. National Climate Assessment. Part 9. Climate of the Contiguous United States |
NCA 3 |
 |
|
Simulated decadal mean change in annual temperature |
Simulated |
Temperature |
Great Plains |
Regional Climate Trends and Scenarios for the U.S. National Climate Assessment. Part 4. Climate of the U.S. Great Plains |
NCA 3 |
 |
|
Simulated decadal mean change in annual temperature |
Simulated |
Temperature |
Northeast |
Regional Climate Trends and Scenarios for the U.S. National Climate Assessment. Part 1. Climate of the Northeast U.S. |
NCA 3 |
 |
|
Simulated decadal mean change in annual temperature |
Simulated |
Temperature |
Southwest |
Regional Climate Trends and Scenarios for the U.S. National Climate Assessment. Part 5. Climate of the Southwest U.S. |
NCA 3 |
 |
|
Simulated decadal mean change in annual temperature |
Simulated |
Temperature |
Northwest |
Regional Climate Trends and Scenarios for the U.S. National Climate Assessment. Part 6. Climate of the Northwest U.S. |
NCA 3 |
 |
|
Simulated decadal mean change in annual precipitation |
Simulated |
Precipitation |
Midwest |
Regional Climate Trends and Scenarios for the U.S. National Climate Assessment. Part 3. Climate of the Midwest U.S. |
NCA 3 |
 |
|
Simulated decadal mean change in annual precipitation |
Simulated |
Precipitation |
Southeast and Caribbean |
Regional Climate Trends and Scenarios for the U.S. National Climate Assessment. Part 2. Climate of the Southeast U.S. |
NCA 3 |
 |
|
Simulated decadal mean change in annual precipitation |
Simulated |
Precipitation |
National |
Regional Climate Trends and Scenarios for the U.S. National Climate Assessment. Part 9. Climate of the Contiguous United States |
NCA 3 |
 |
|
Simulated decadal mean change in annual precipitation |
Simulated |
Precipitation |
Great Plains |
Regional Climate Trends and Scenarios for the U.S. National Climate Assessment. Part 4. Climate of the U.S. Great Plains |
NCA 3 |
 |
|
Simulated decadal mean change in annual precipitation |
Simulated |
Precipitation |
Northeast |
Regional Climate Trends and Scenarios for the U.S. National Climate Assessment. Part 1. Climate of the Northeast U.S. |
NCA 3 |
 |
|
Simulated decadal mean change in annual precipitation |
Simulated |
Precipitation |
Southwest |
Regional Climate Trends and Scenarios for the U.S. National Climate Assessment. Part 5. Climate of the Southwest U.S. |
NCA 3 |
 |
|
Simulated decadal mean change in annual precipitation |
Simulated |
Precipitation |
Northwest |
Regional Climate Trends and Scenarios for the U.S. National Climate Assessment. Part 6. Climate of the Northwest U.S. |
NCA 3 |
 |
|
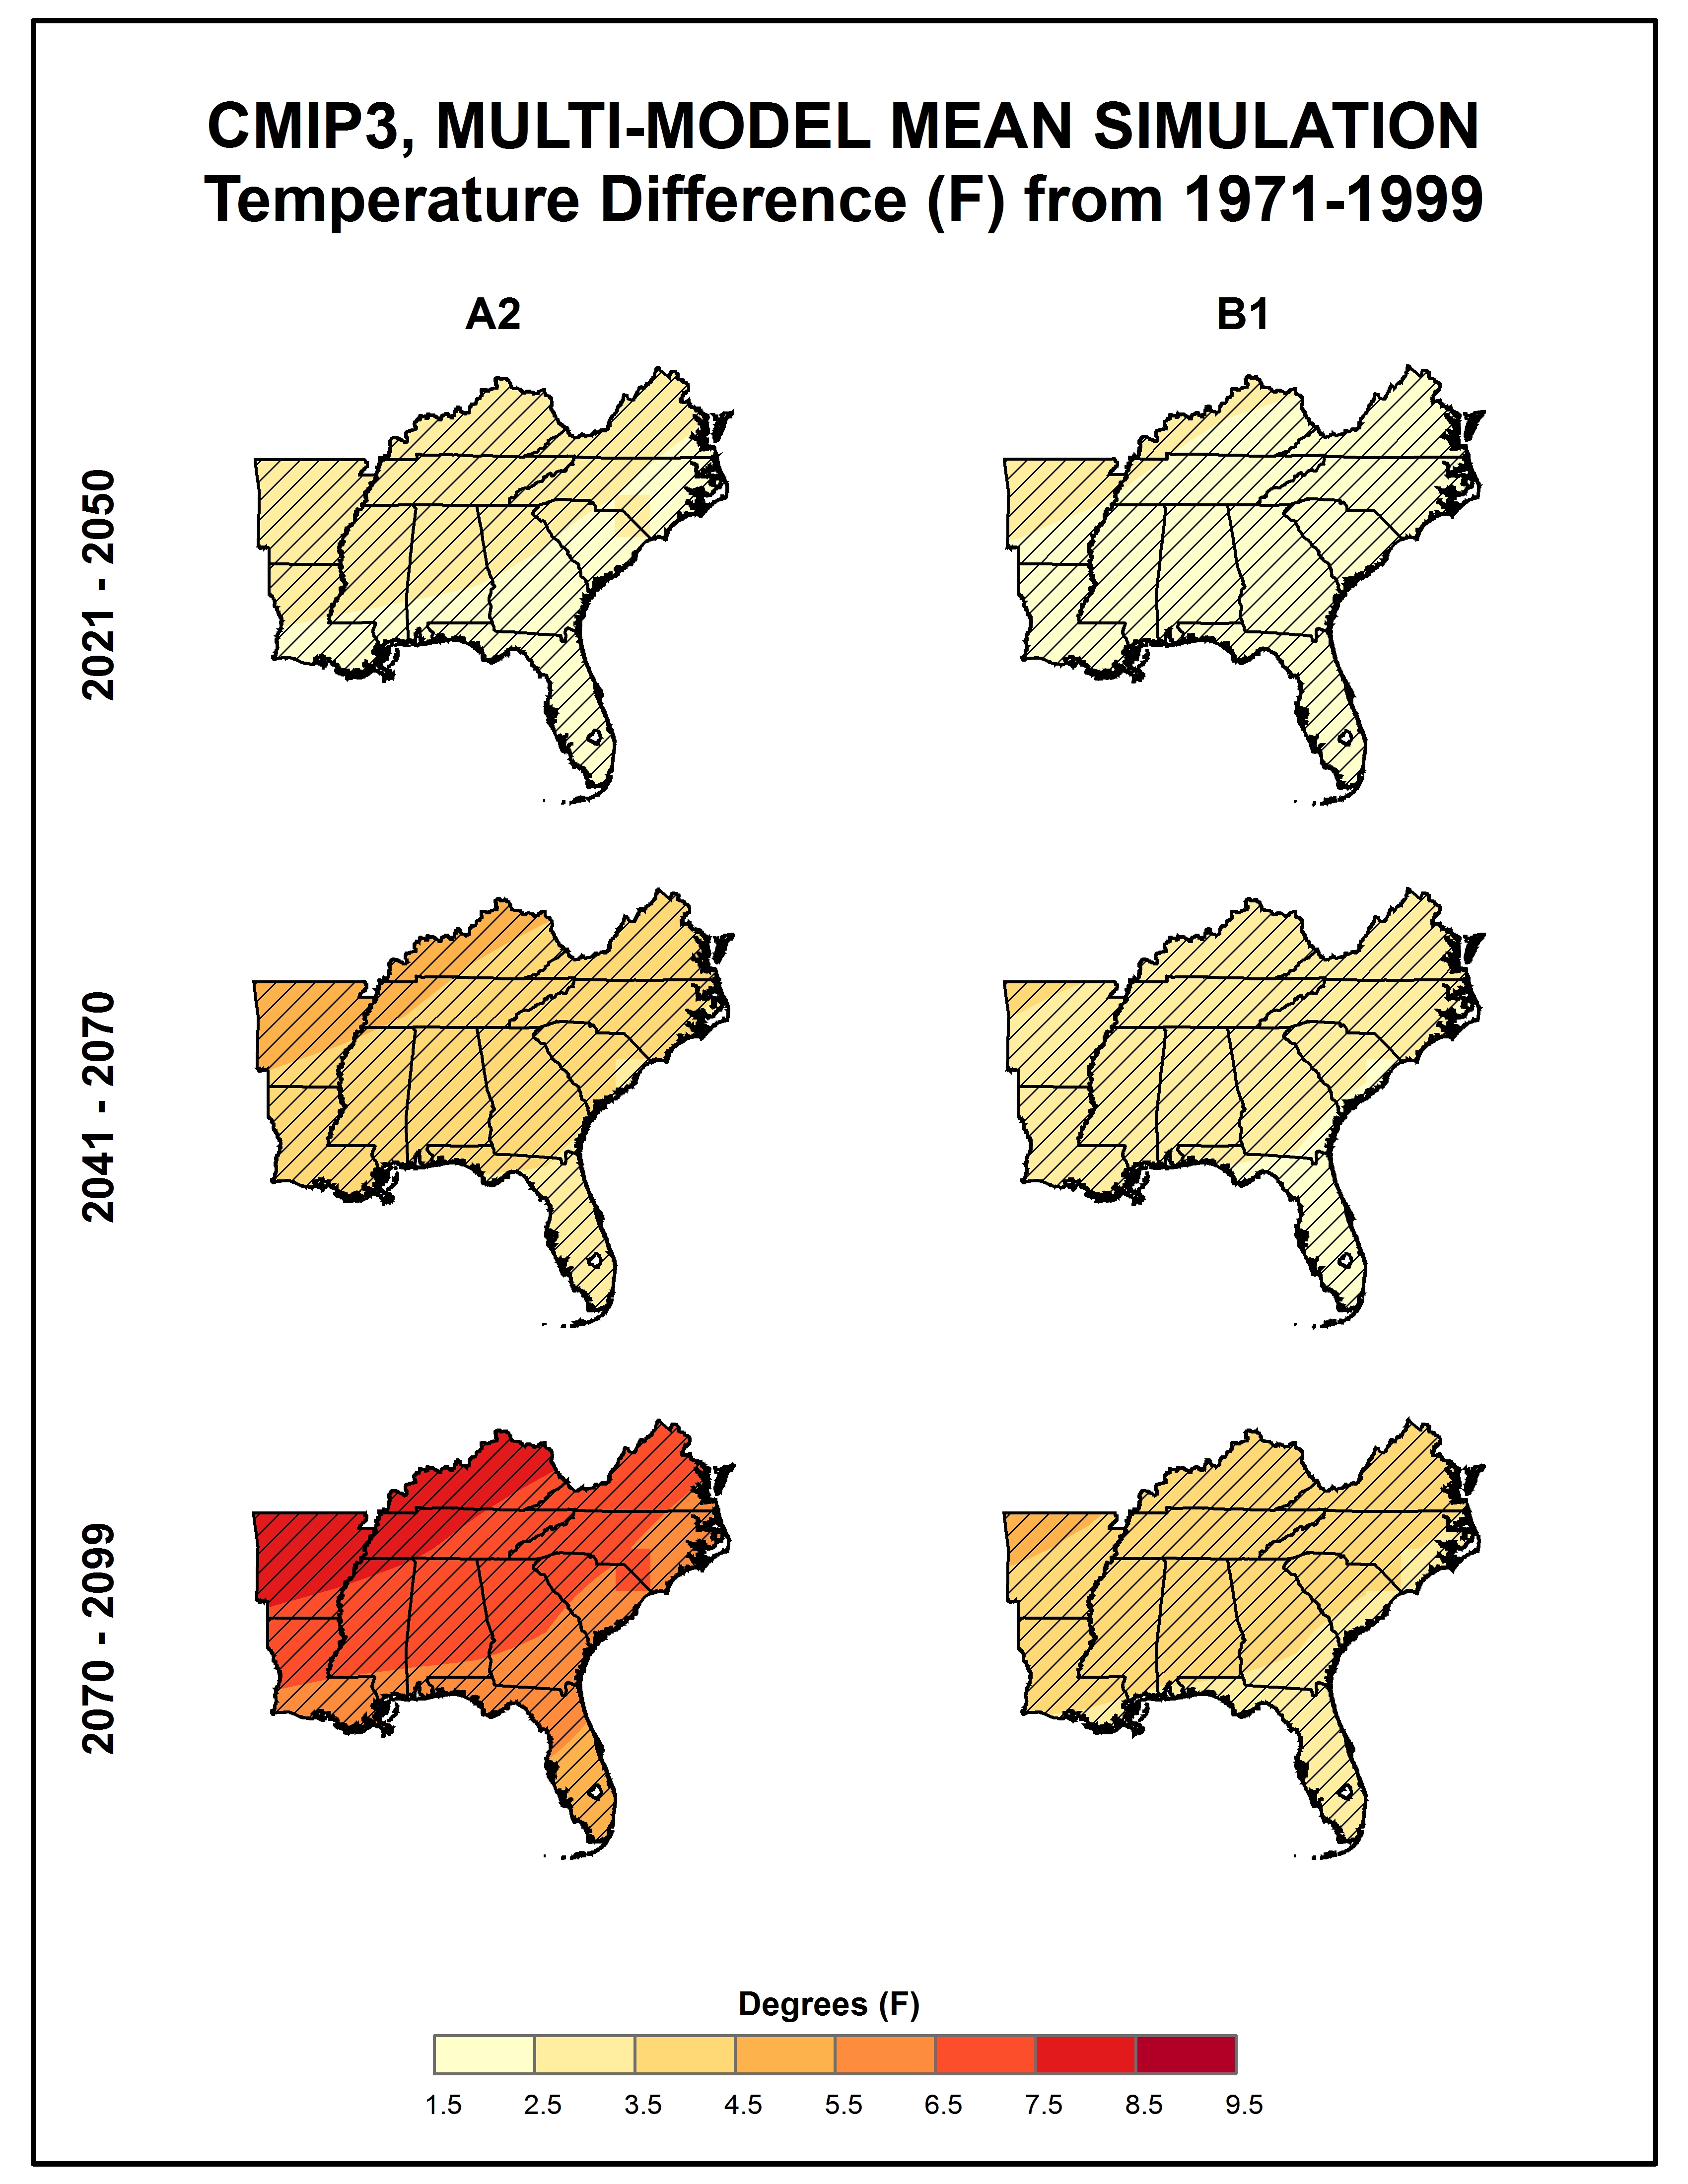
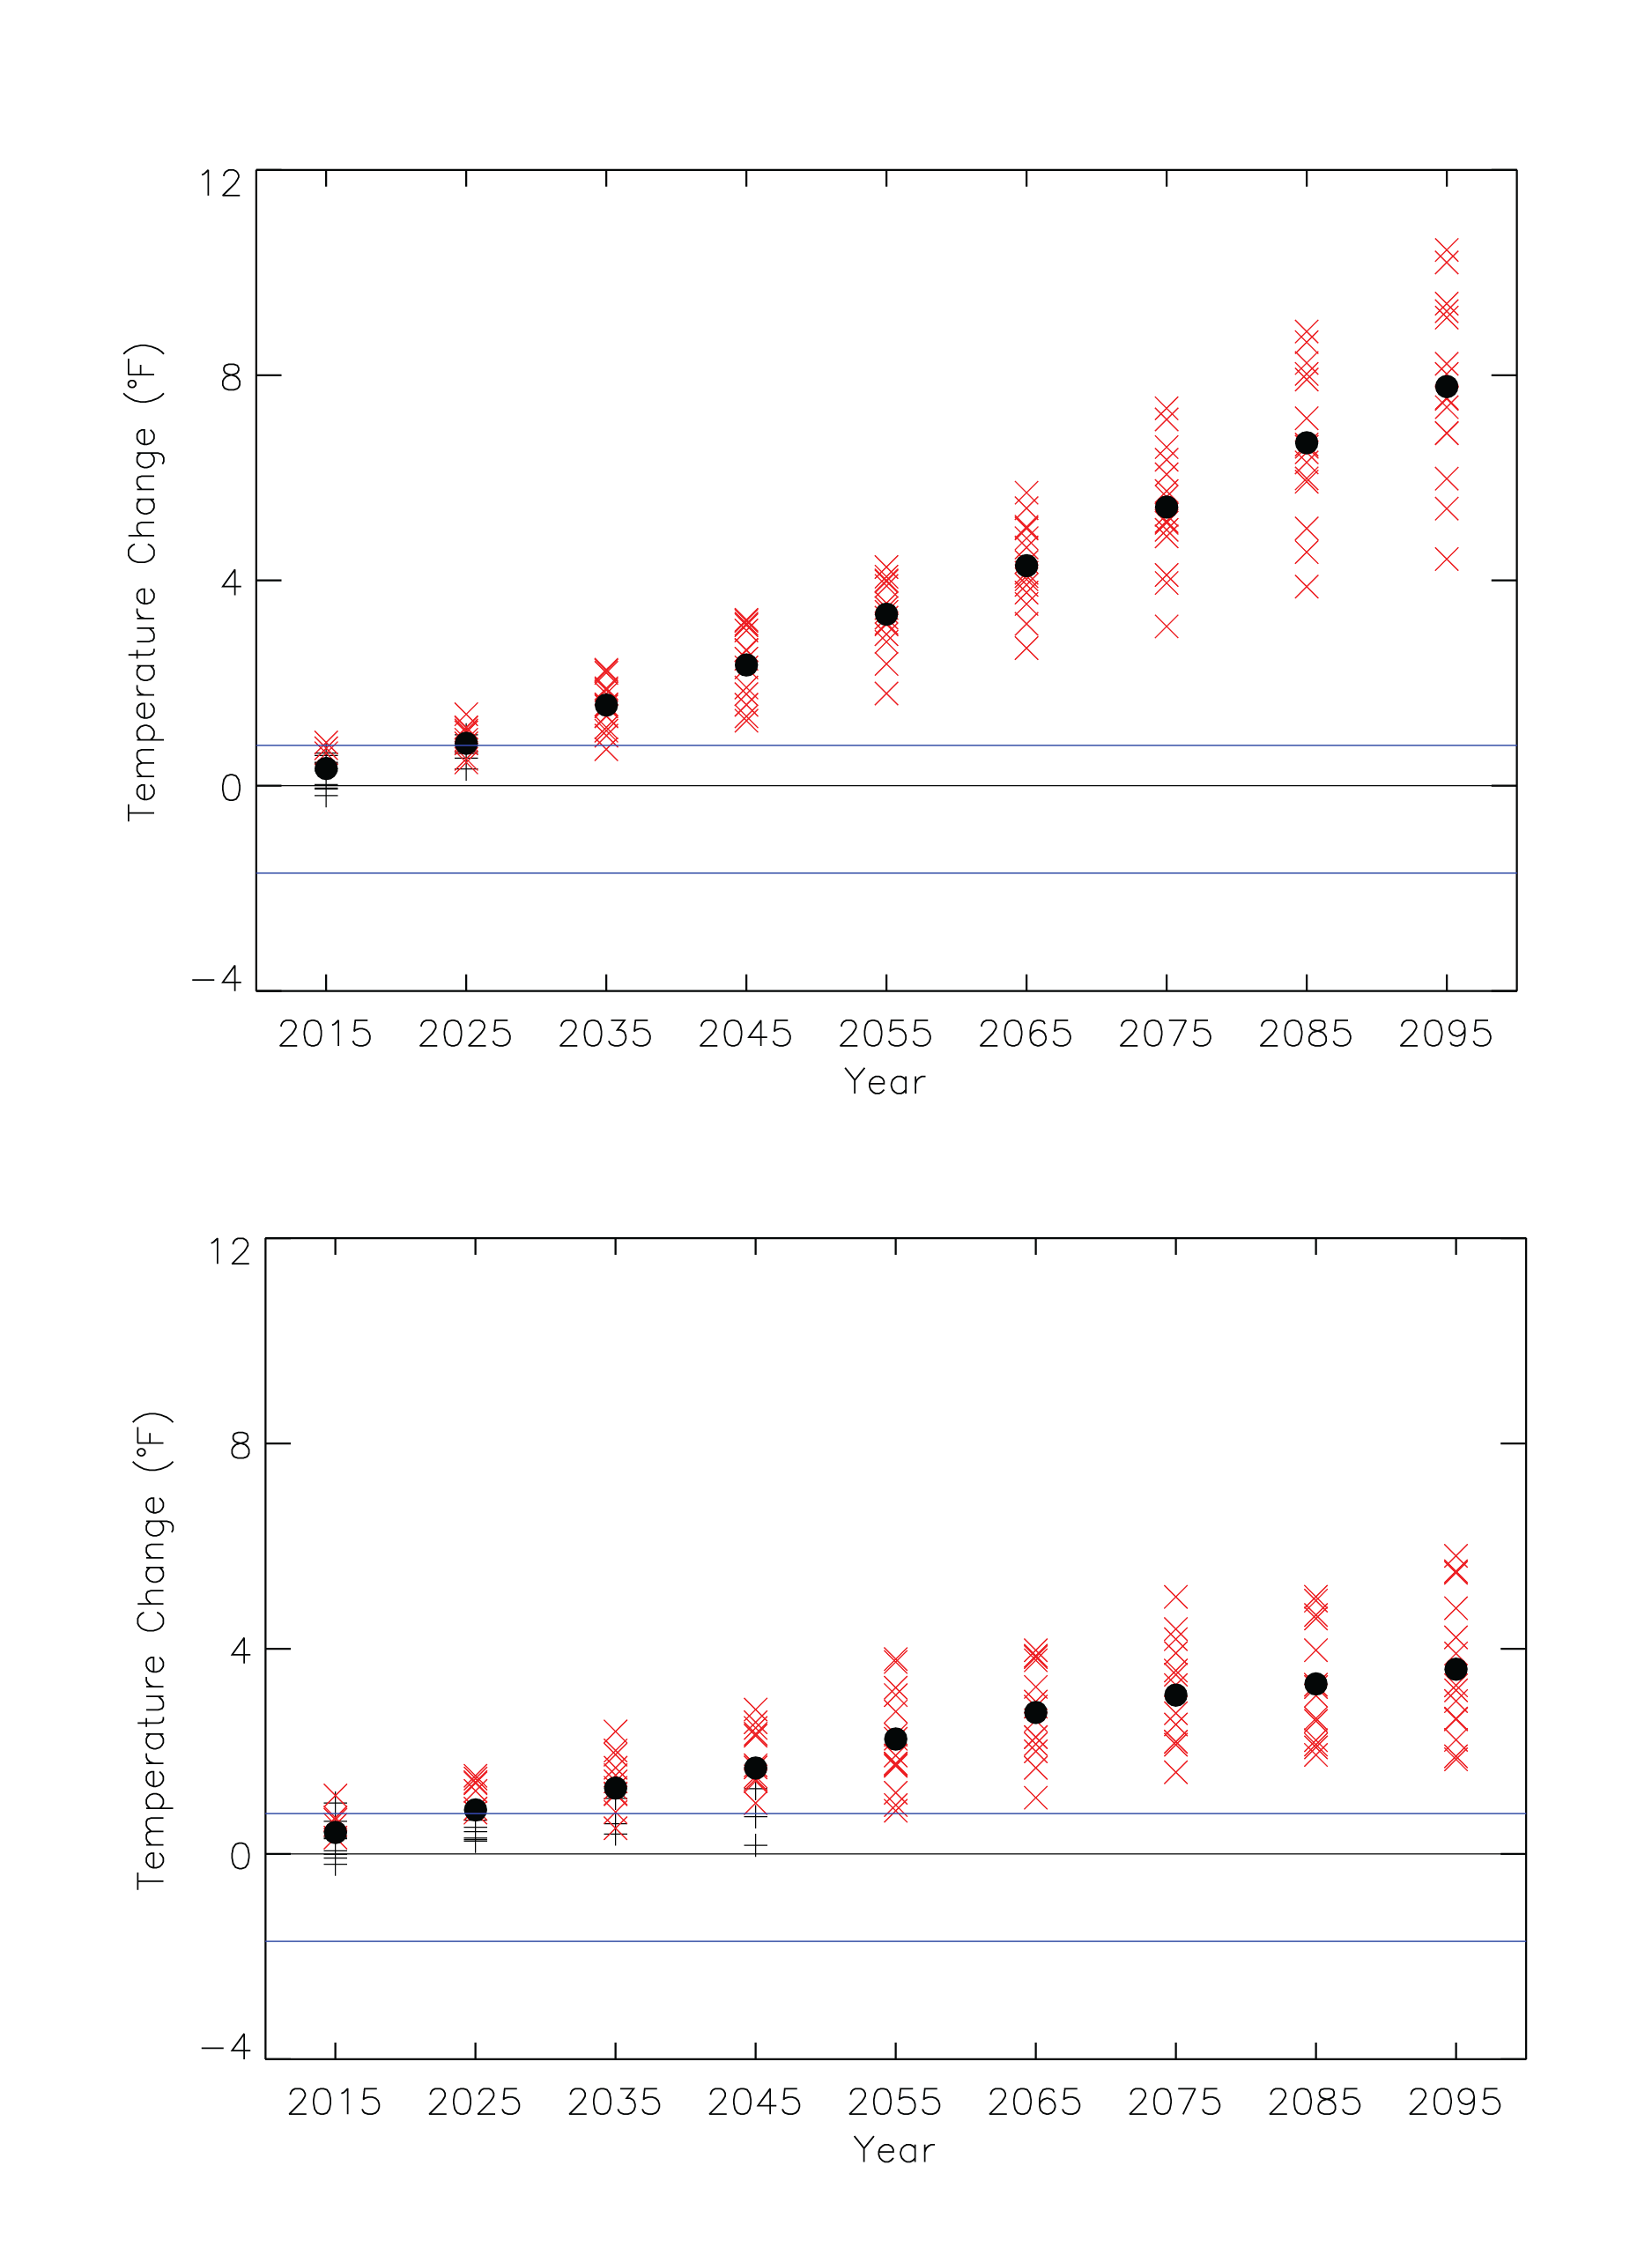
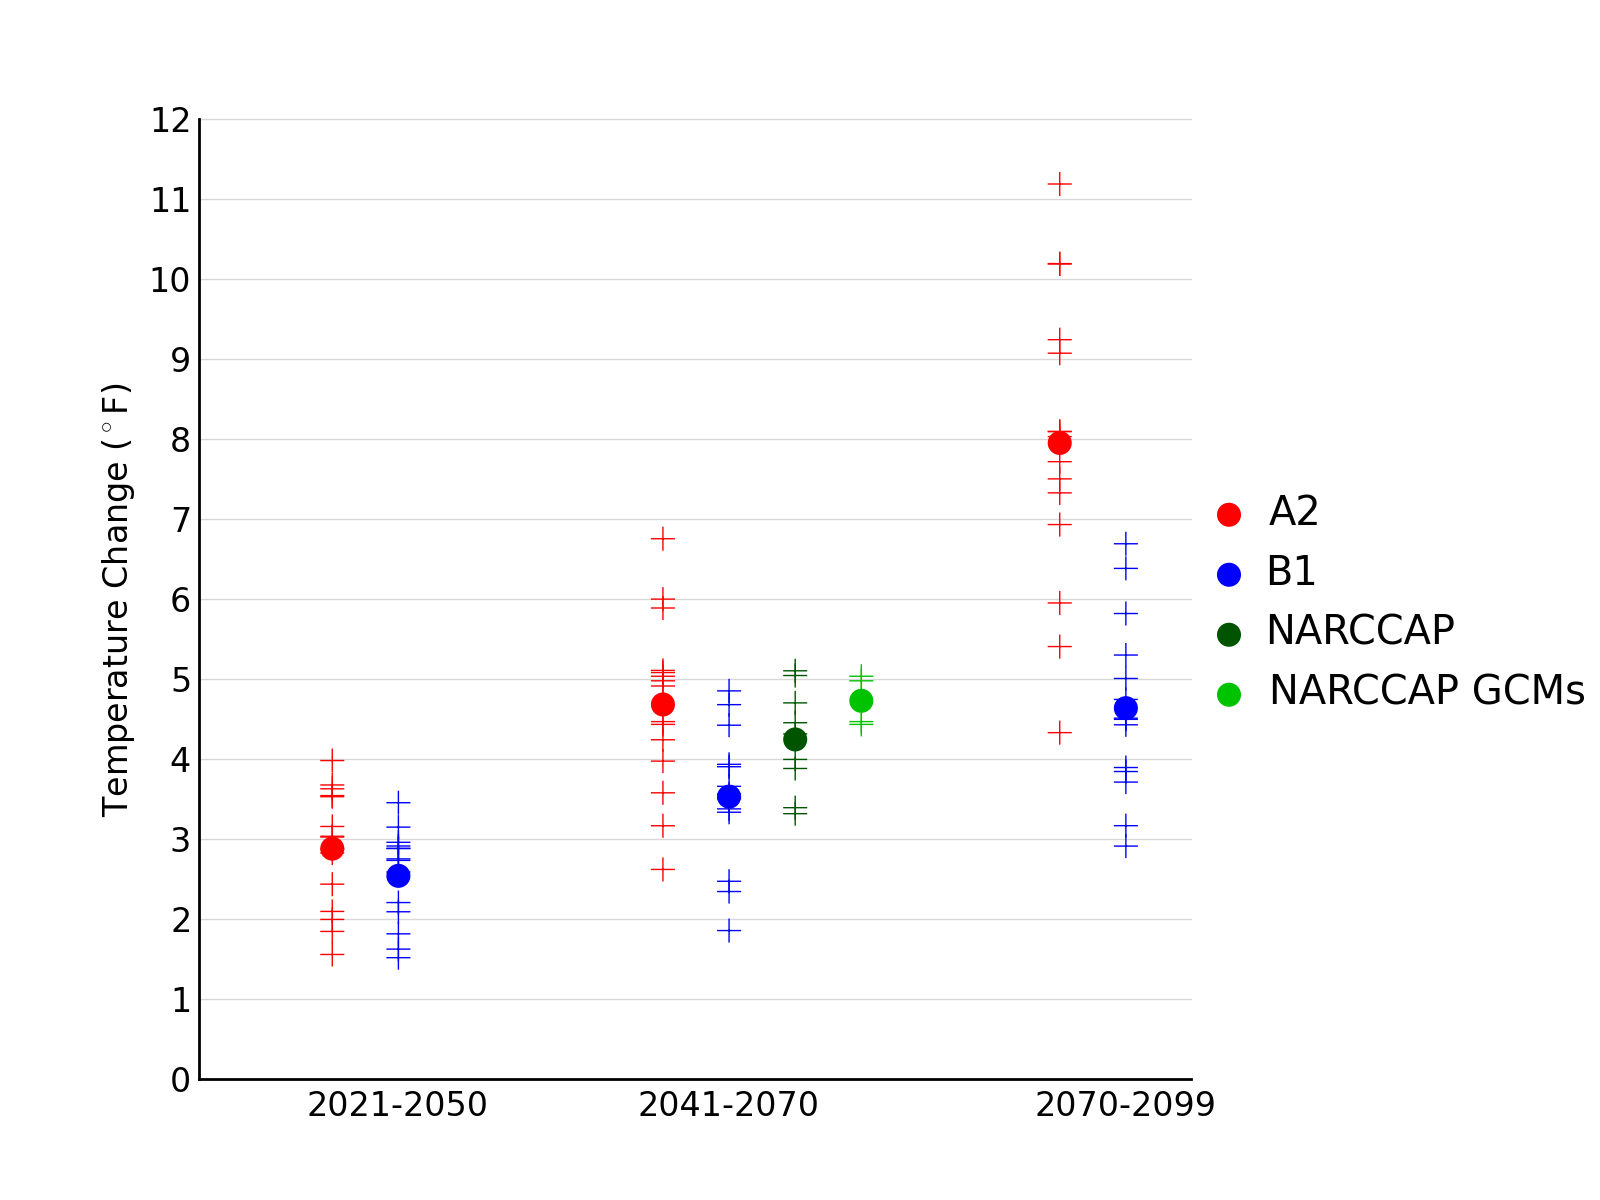
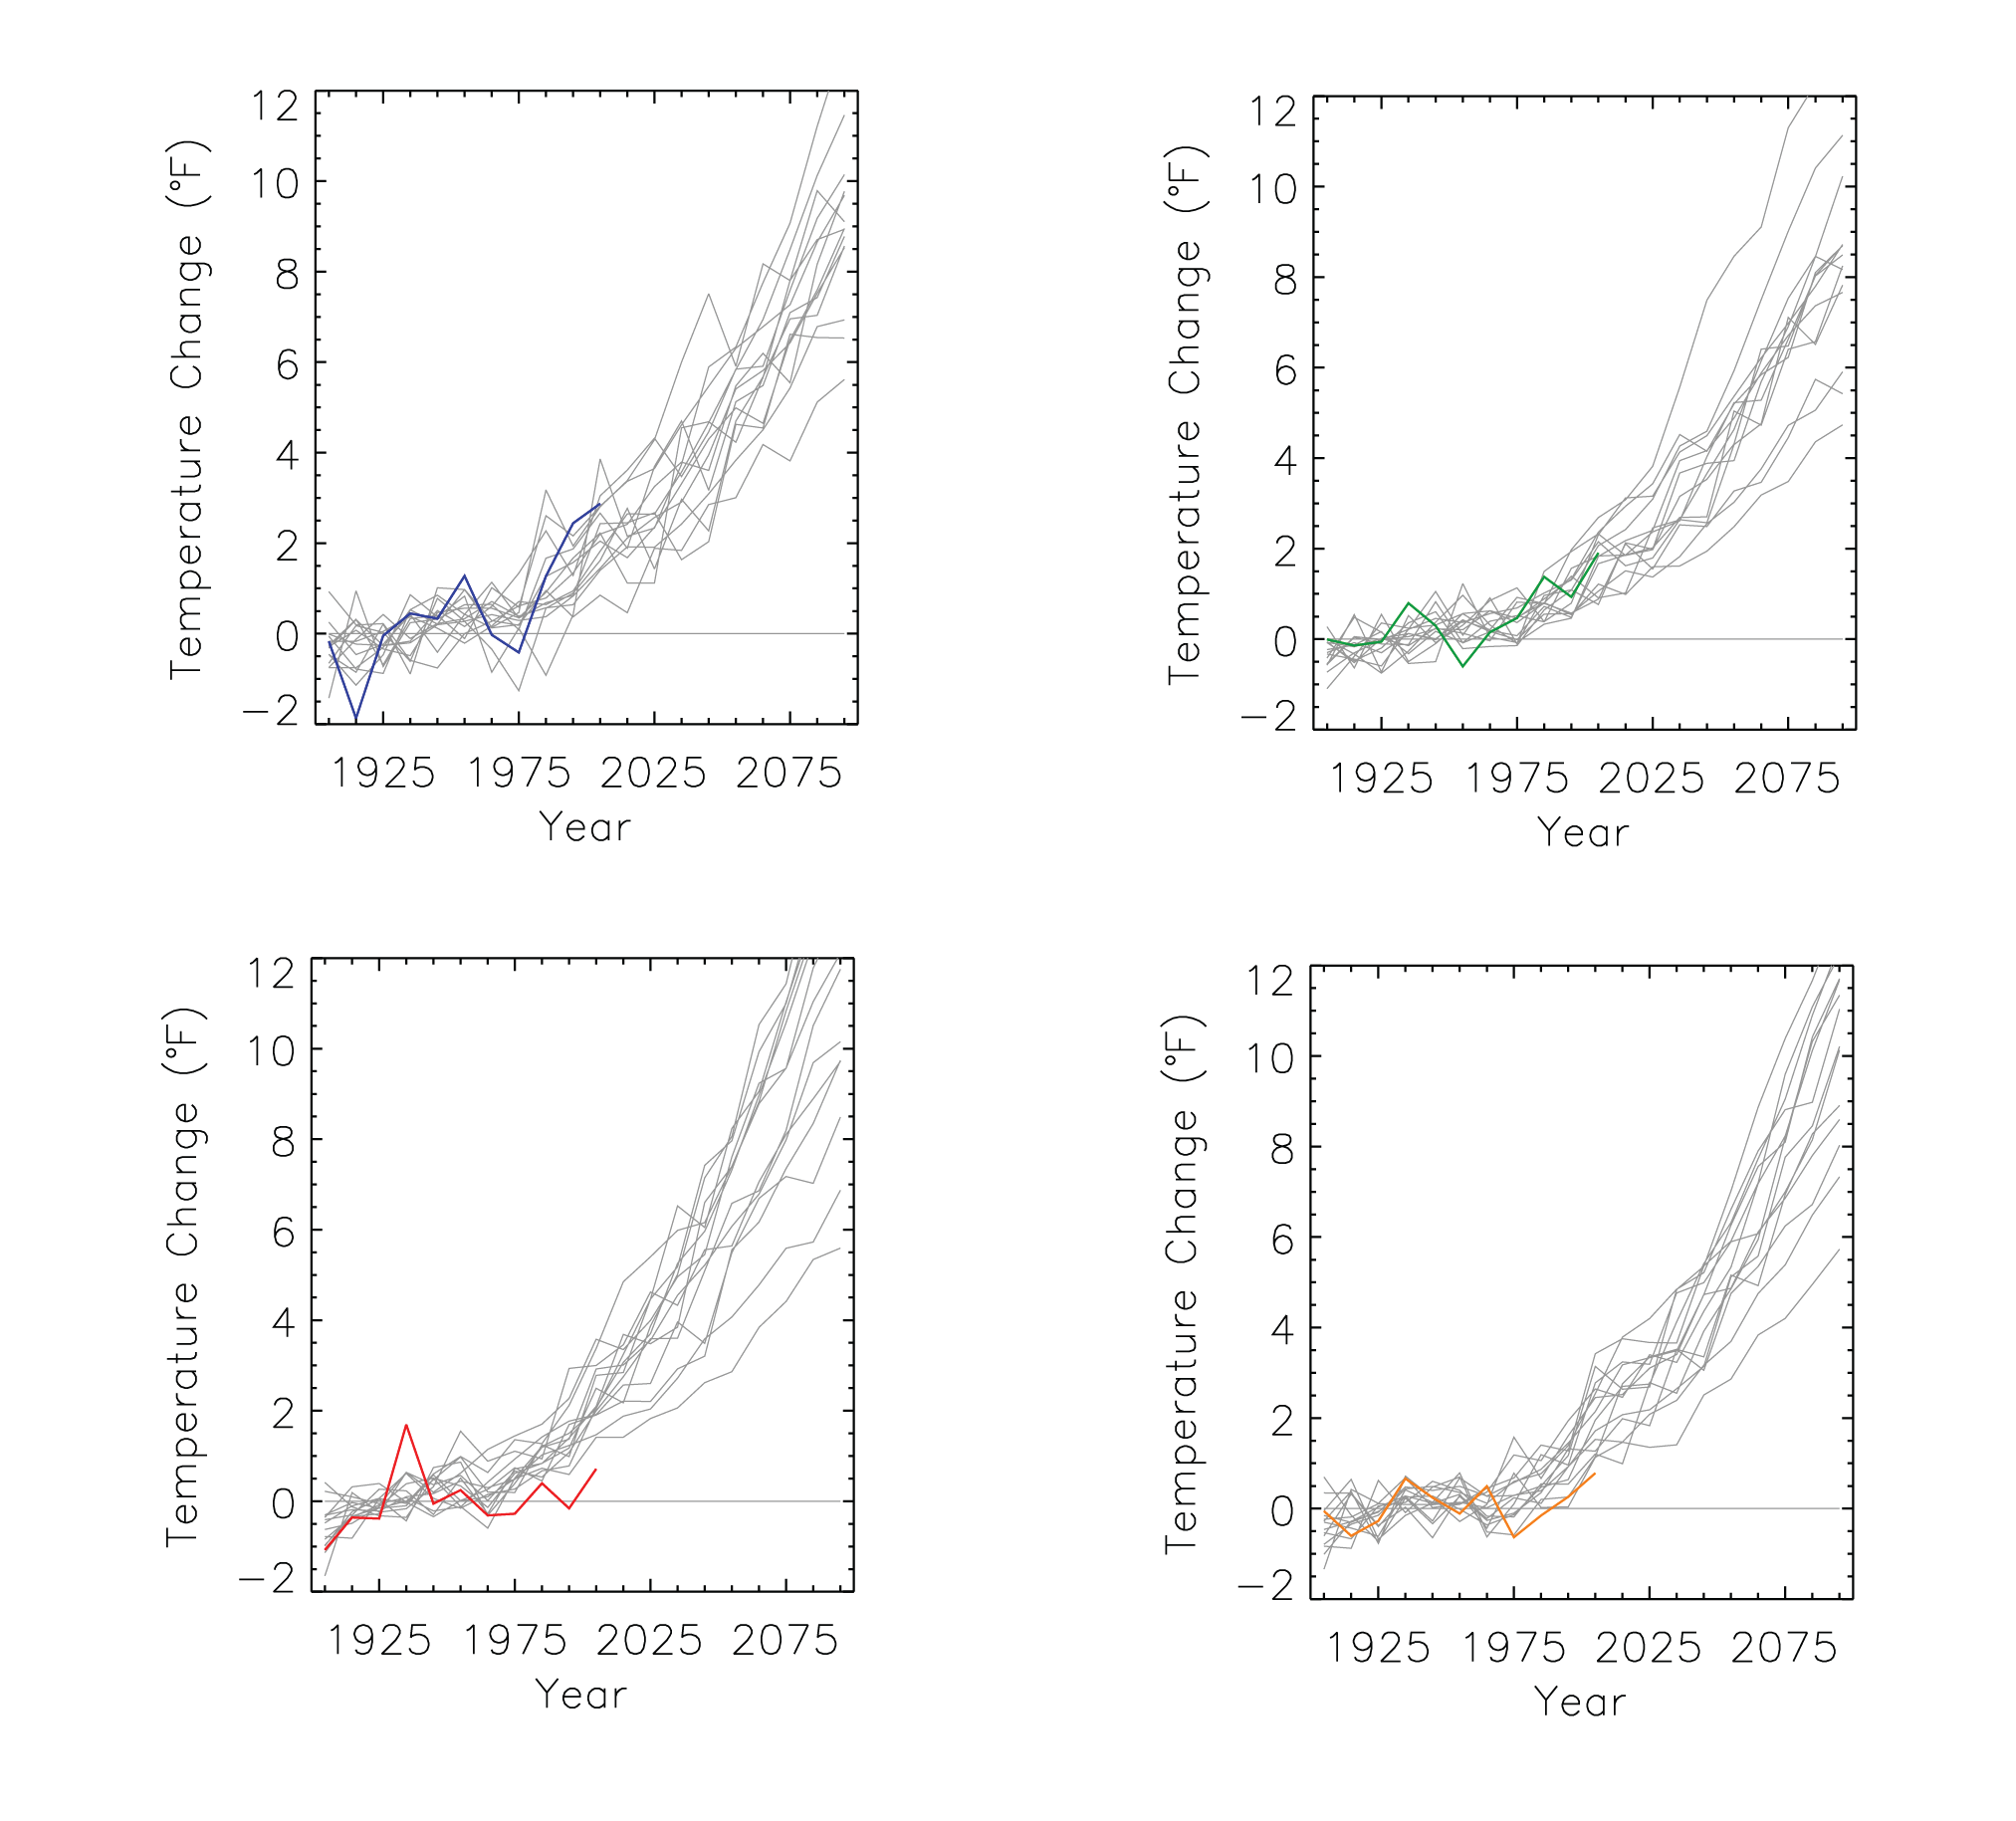
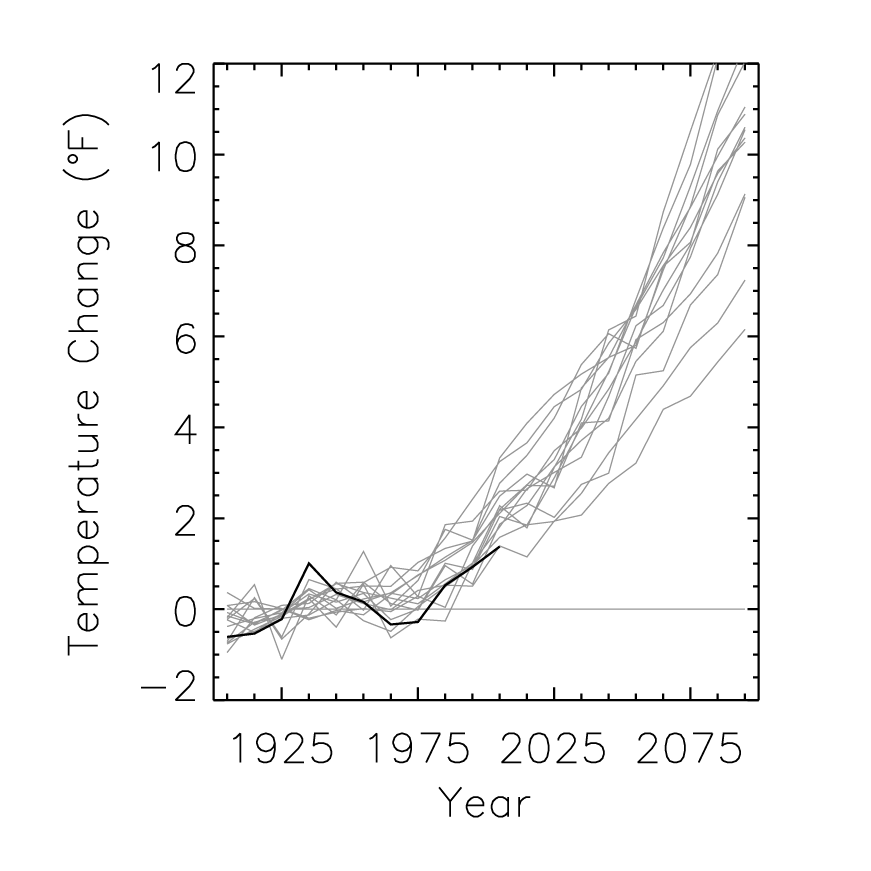
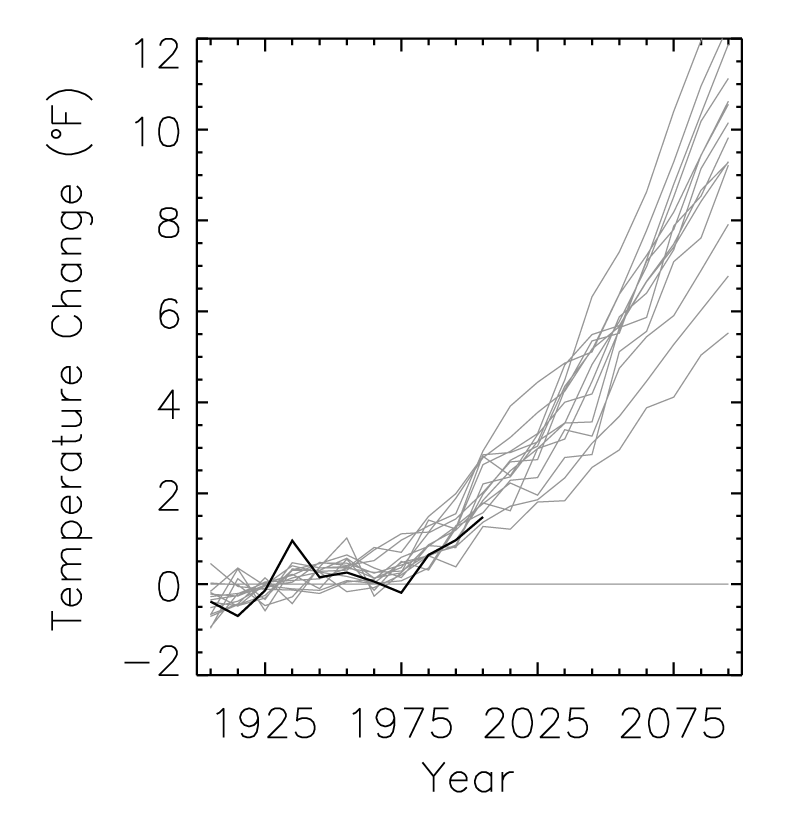
Simulated annual mean temperature change |
Simulated |
Temperature |
Southeast and Caribbean |
Regional Climate Trends and Scenarios for the U.S. National Climate Assessment. Part 2. Climate of the Southeast U.S. |
NCA 3 |
 |
|
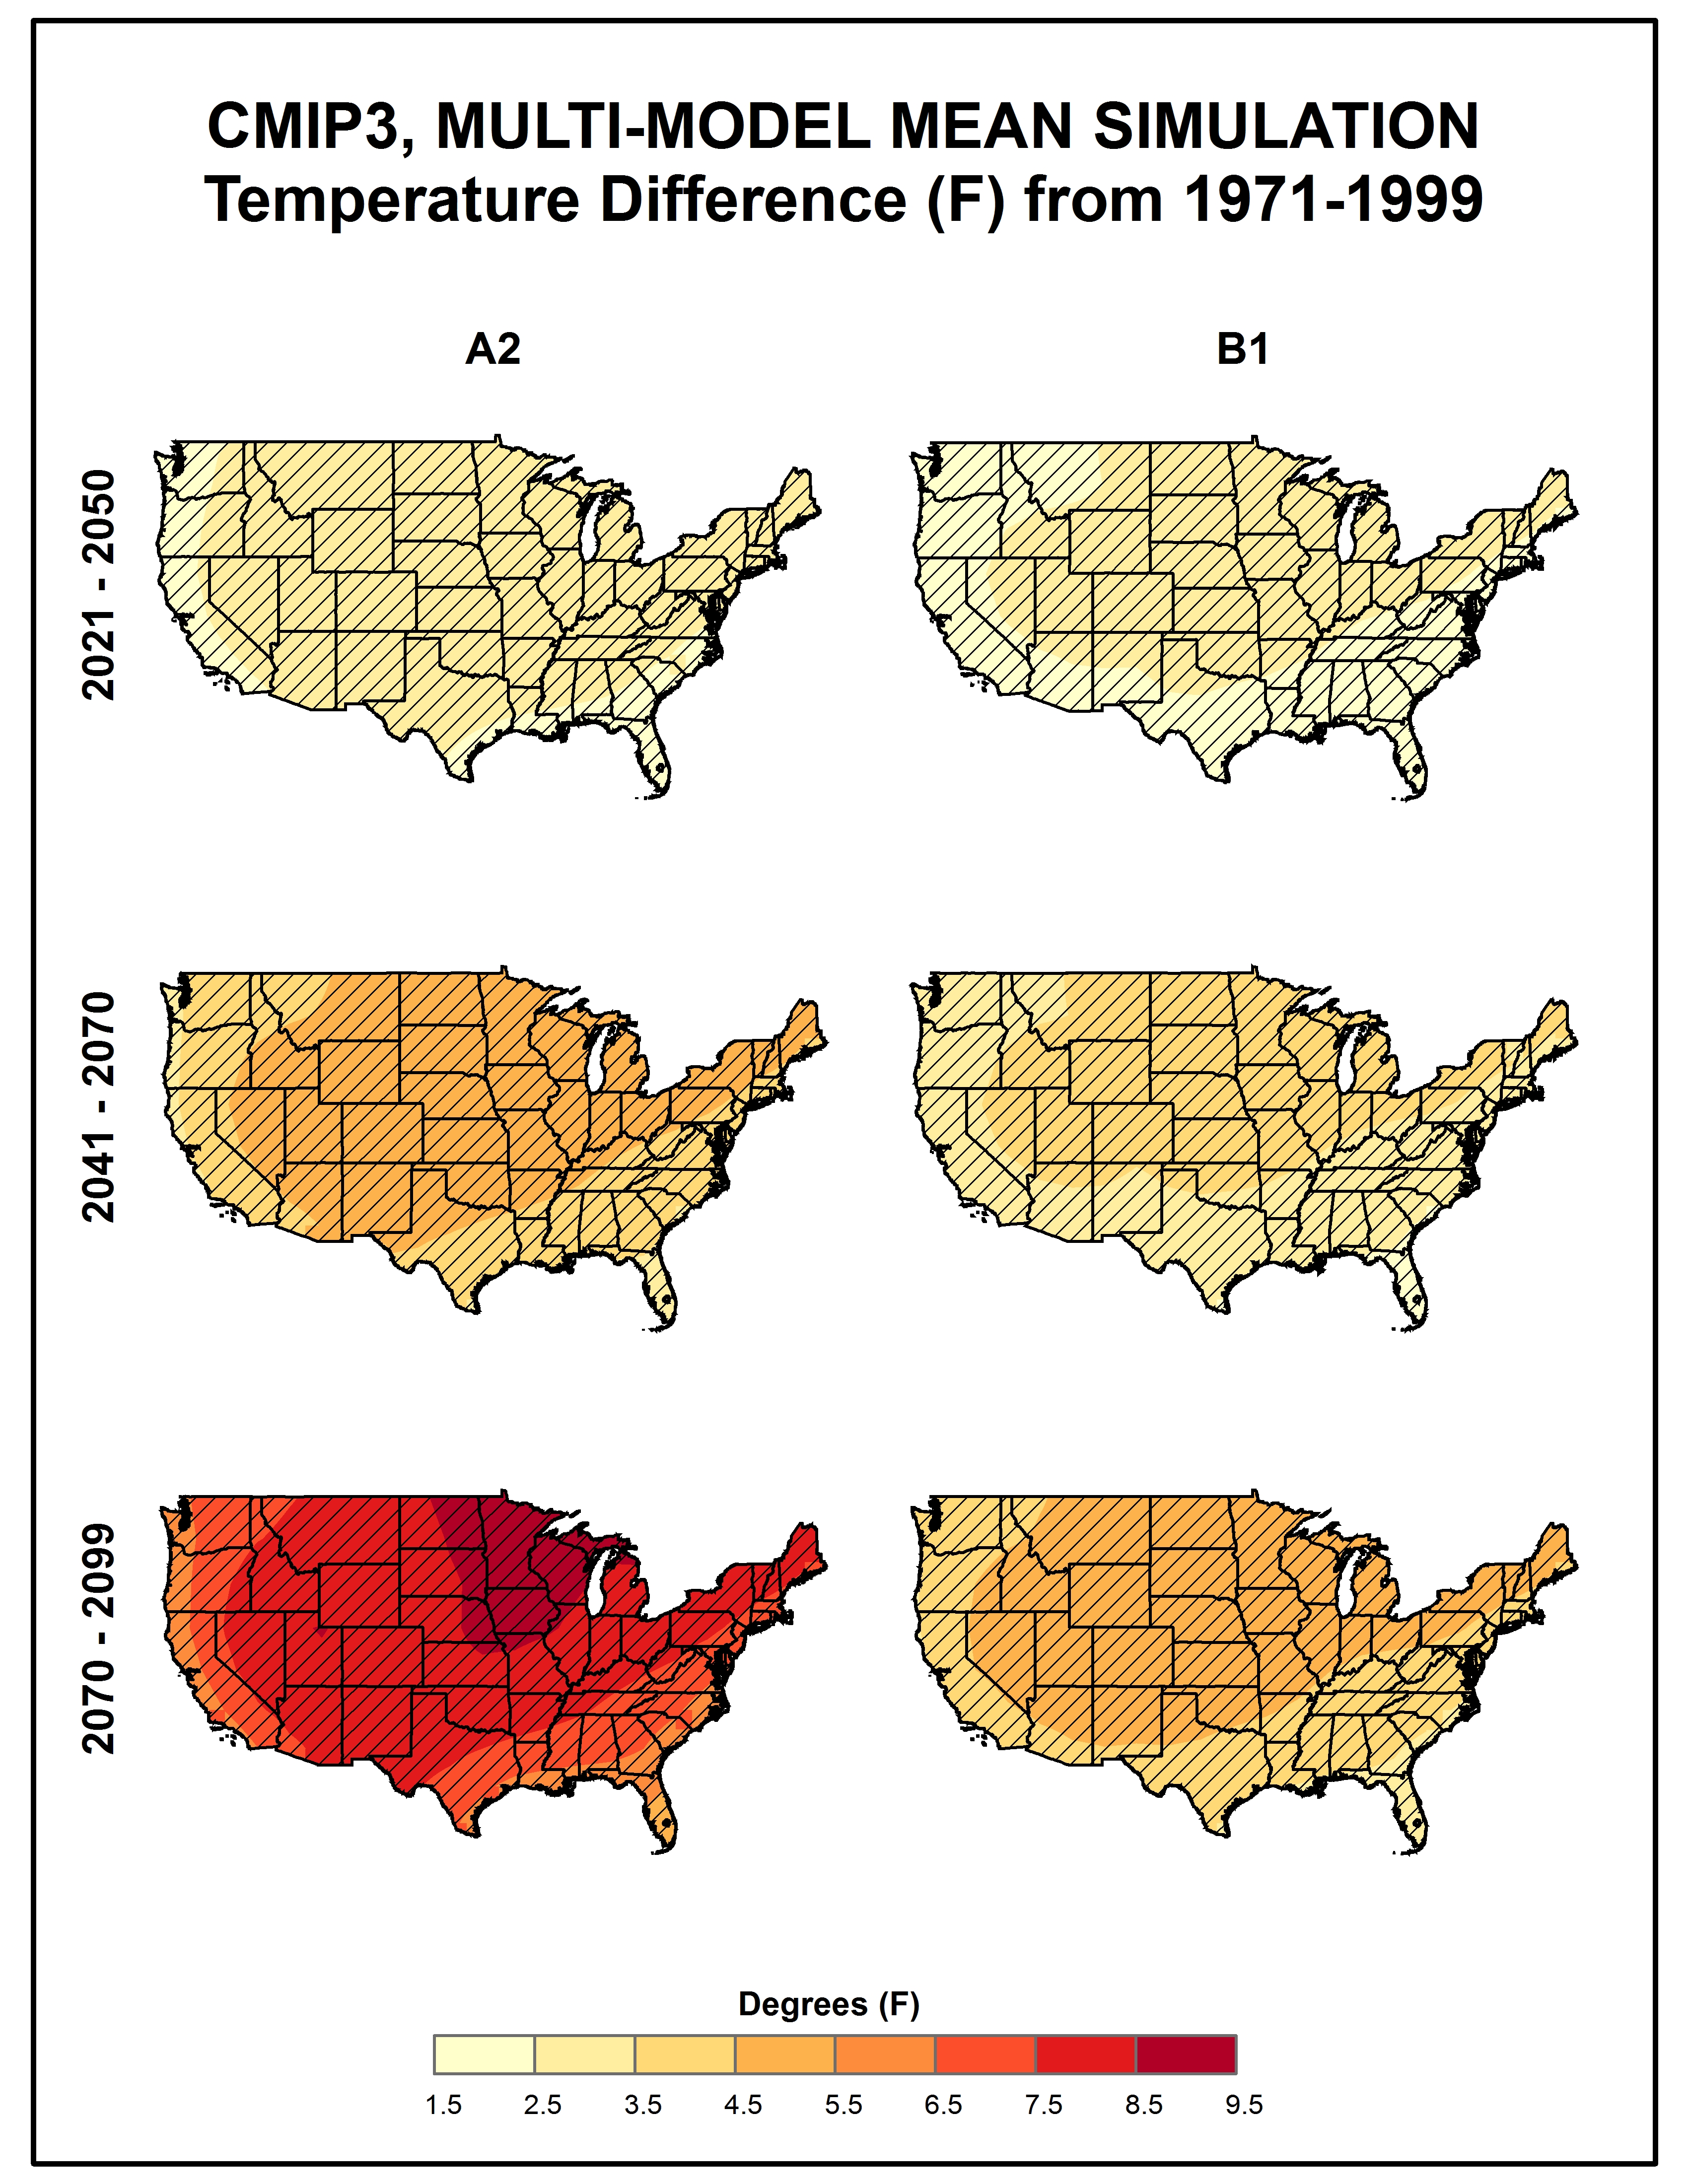
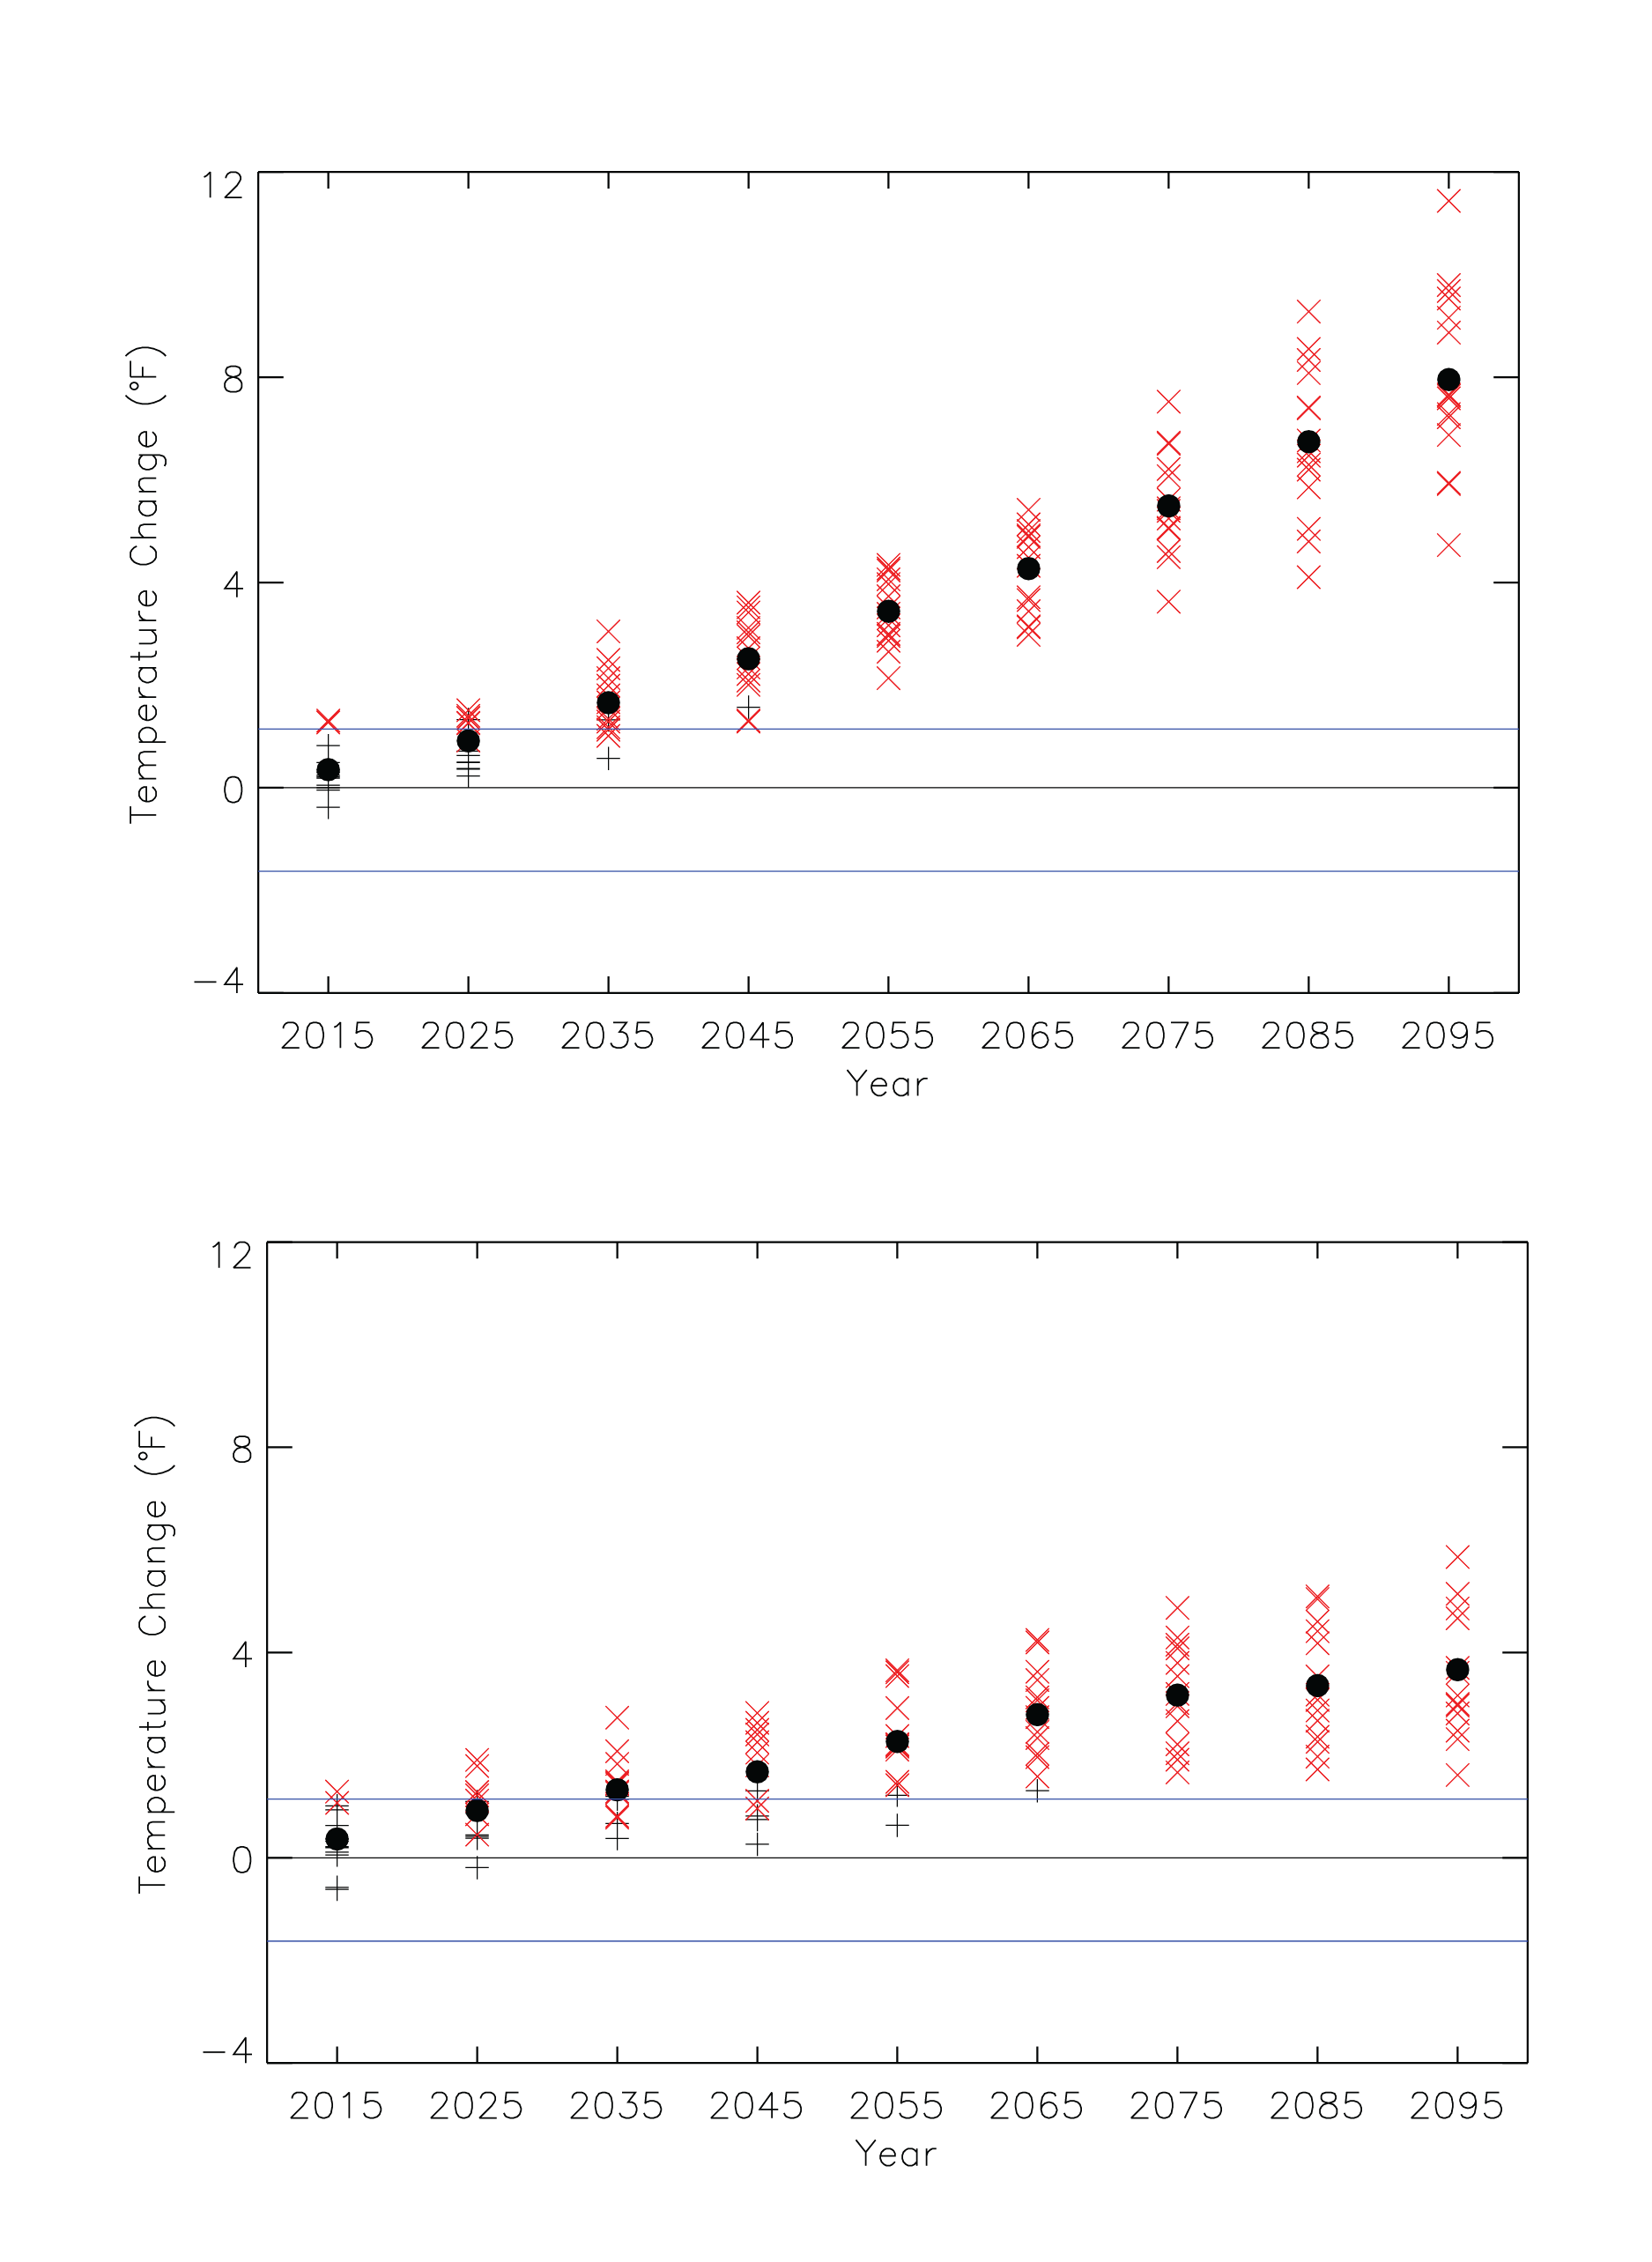
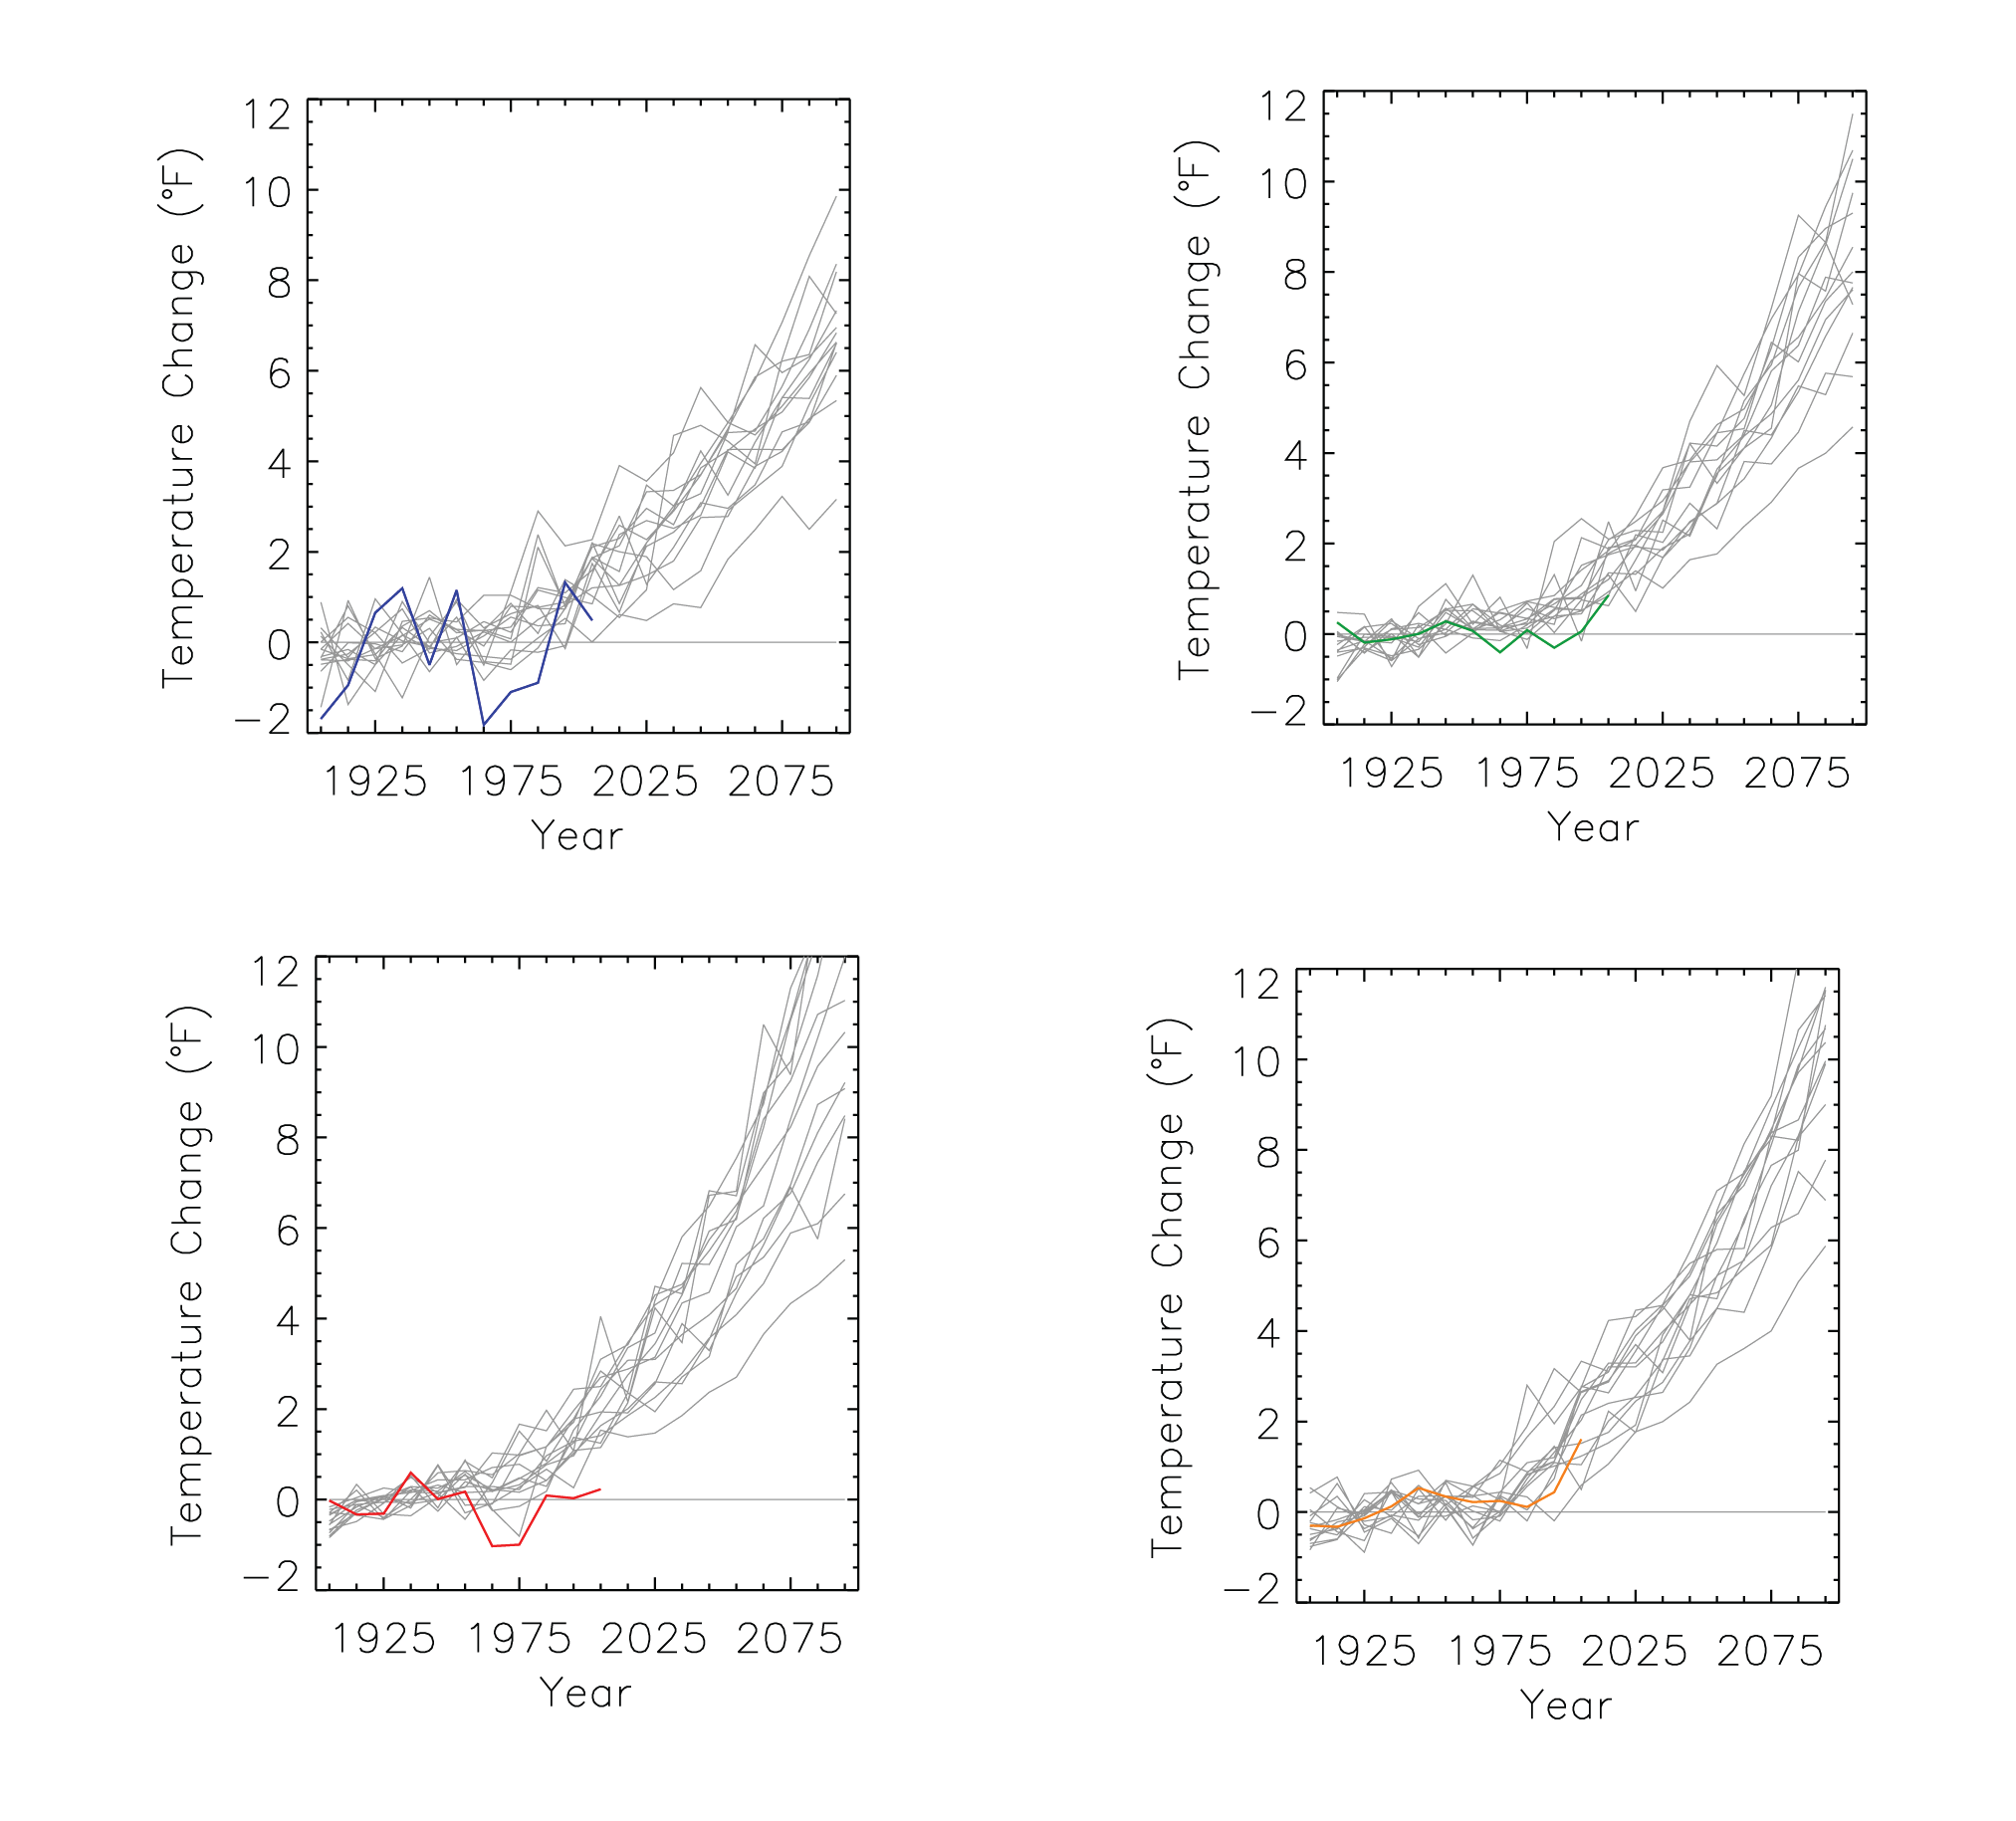
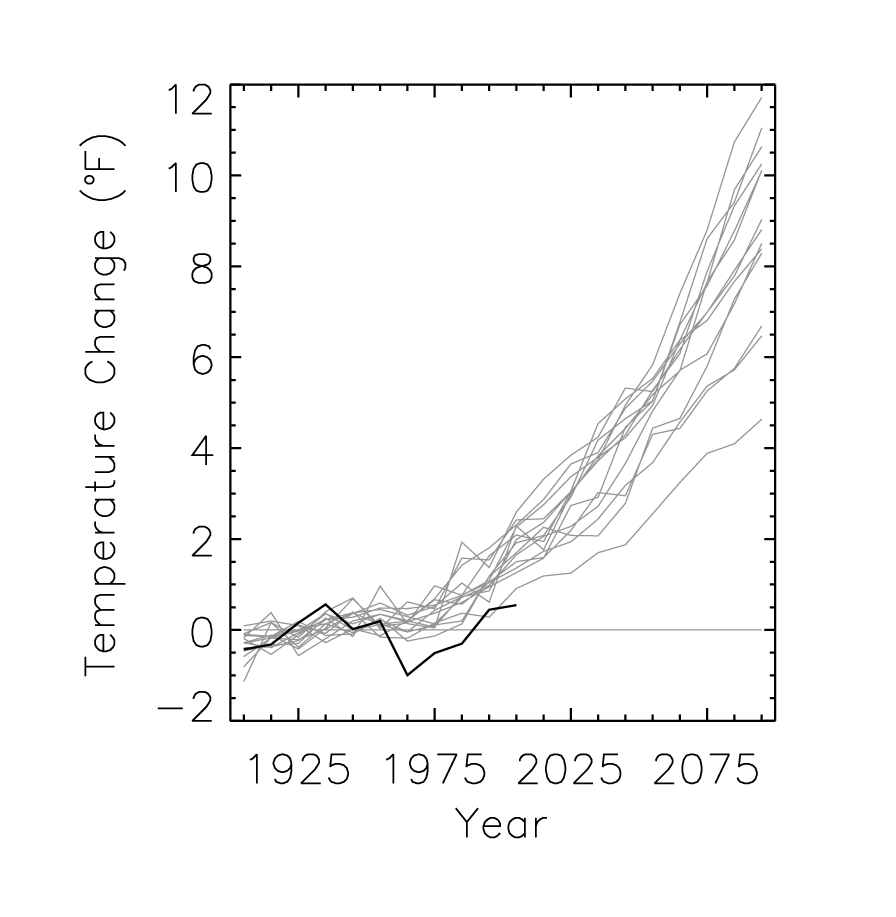
Simulated annual mean temperature change |
Simulated |
Temperature |
National |
Regional Climate Trends and Scenarios for the U.S. National Climate Assessment. Part 9. Climate of the Contiguous United States |
NCA 3 |
 |
|
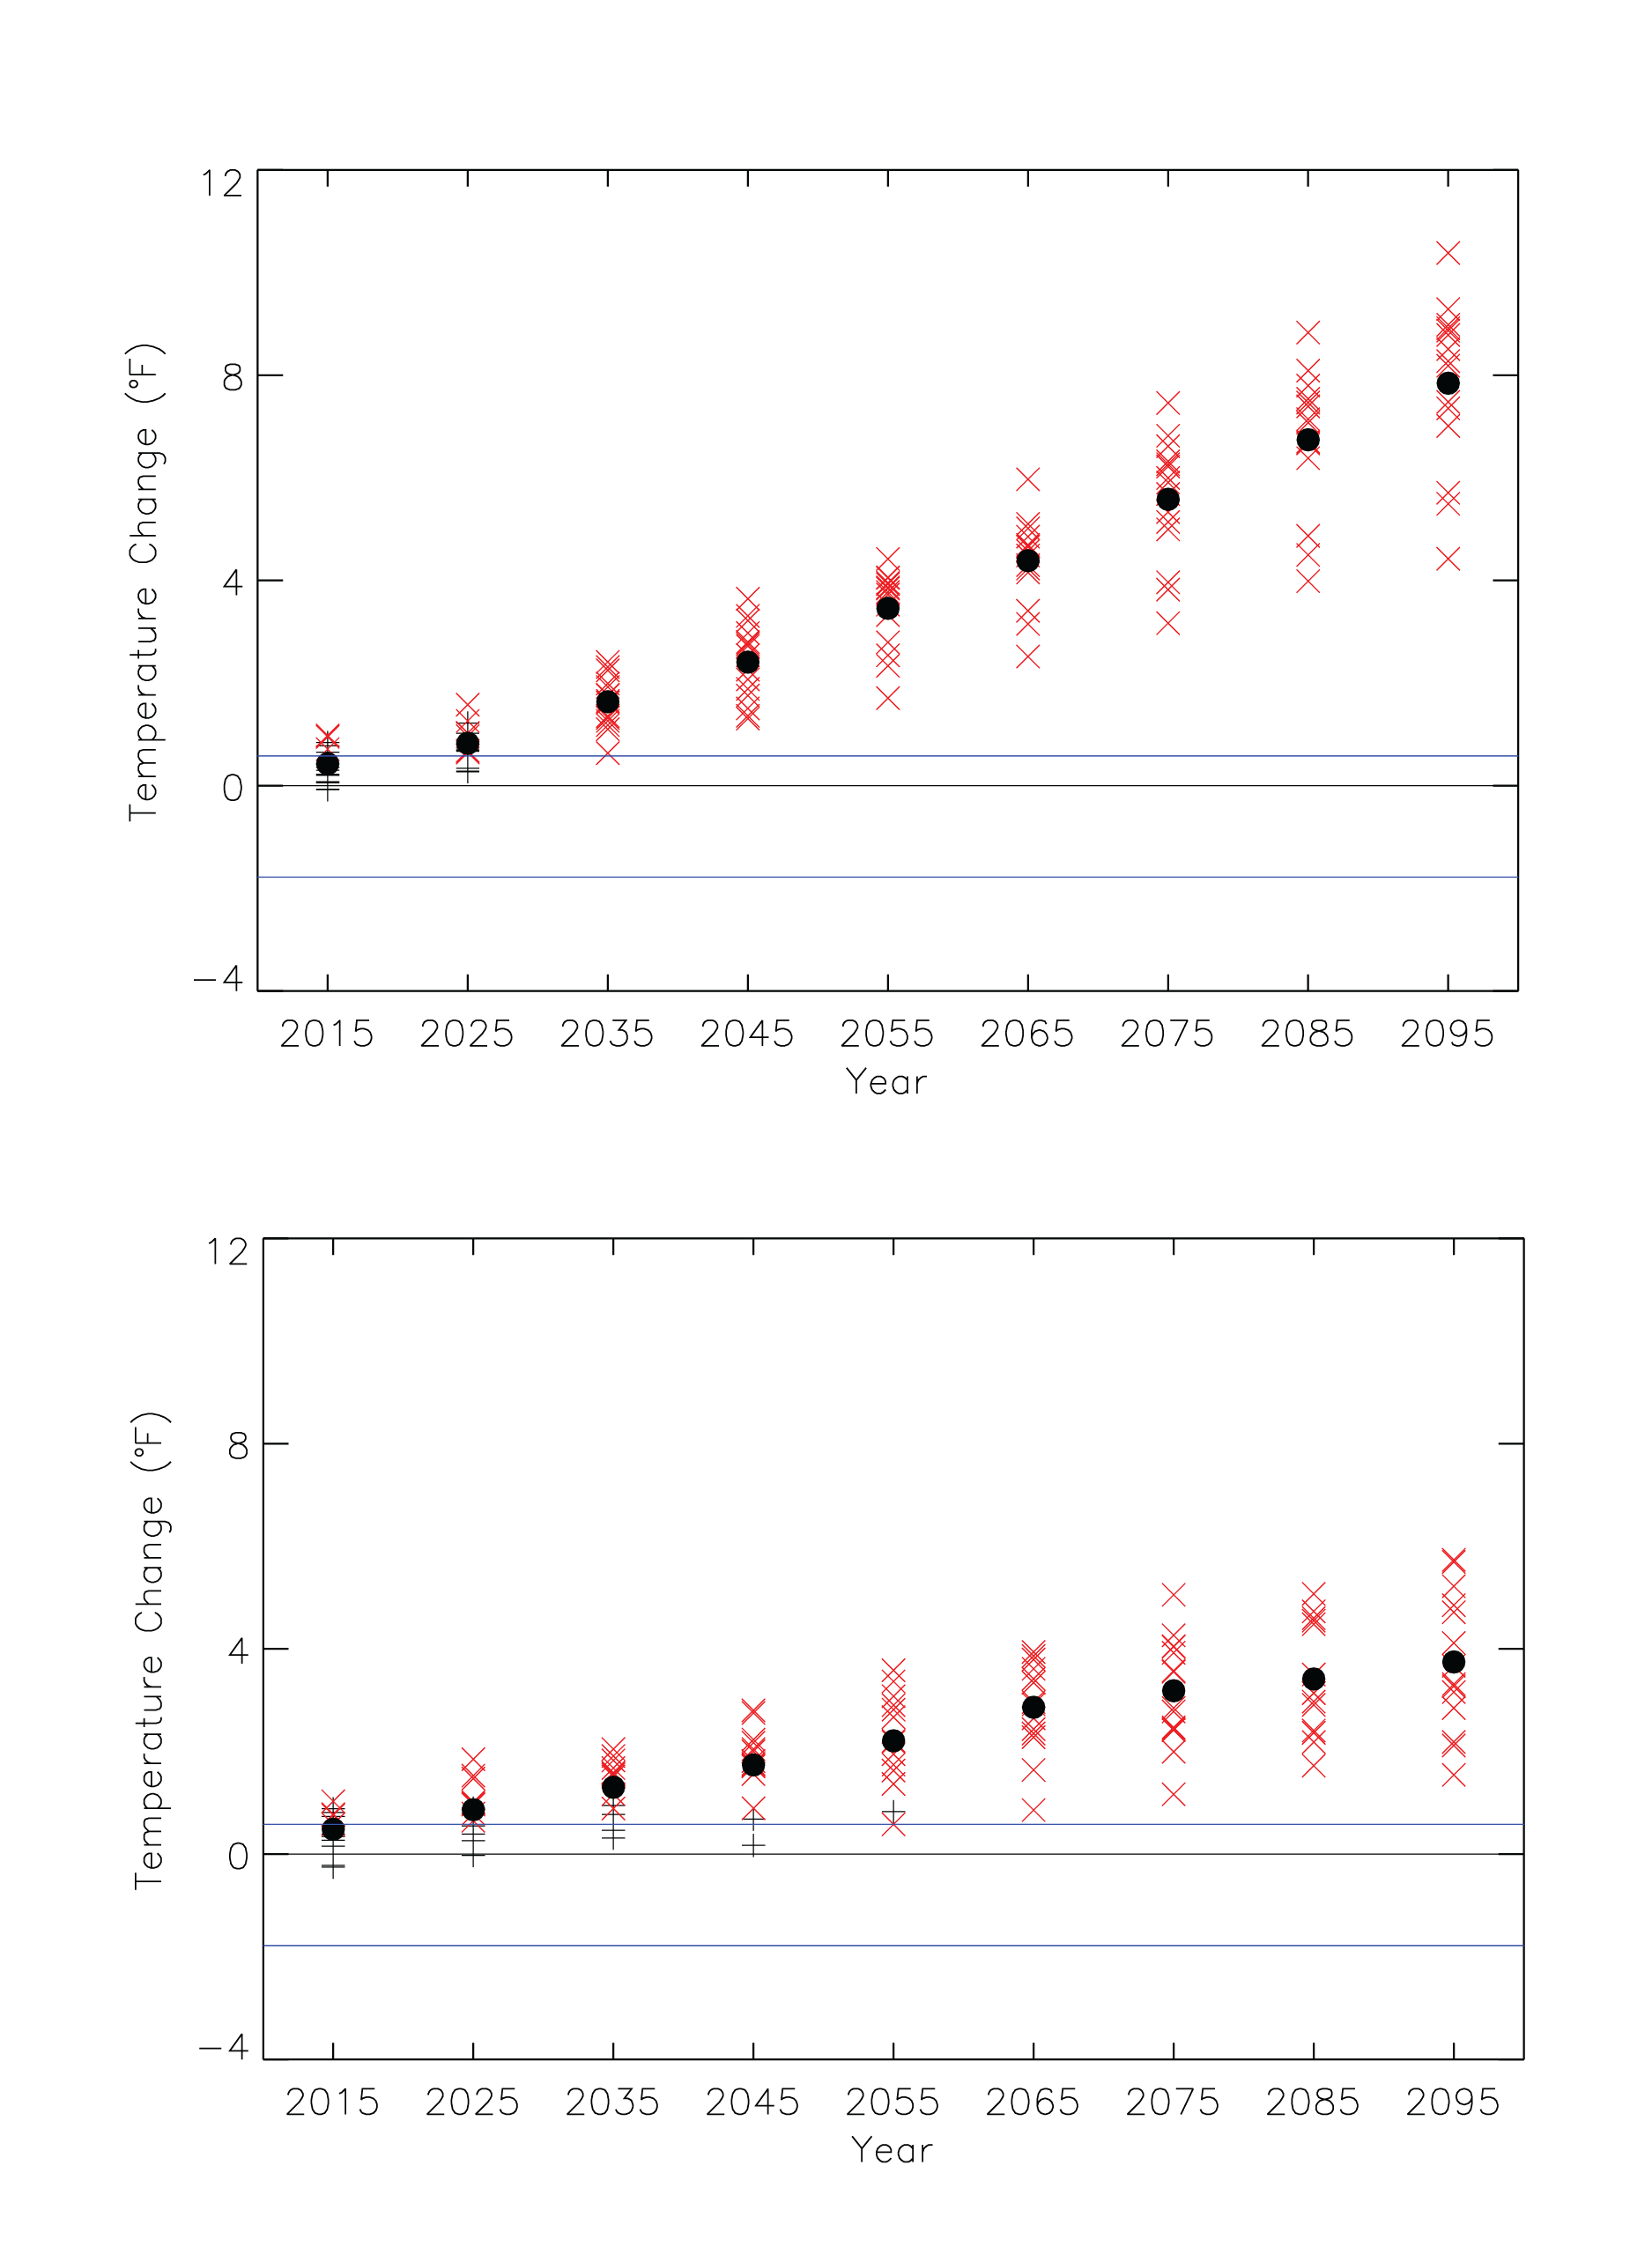
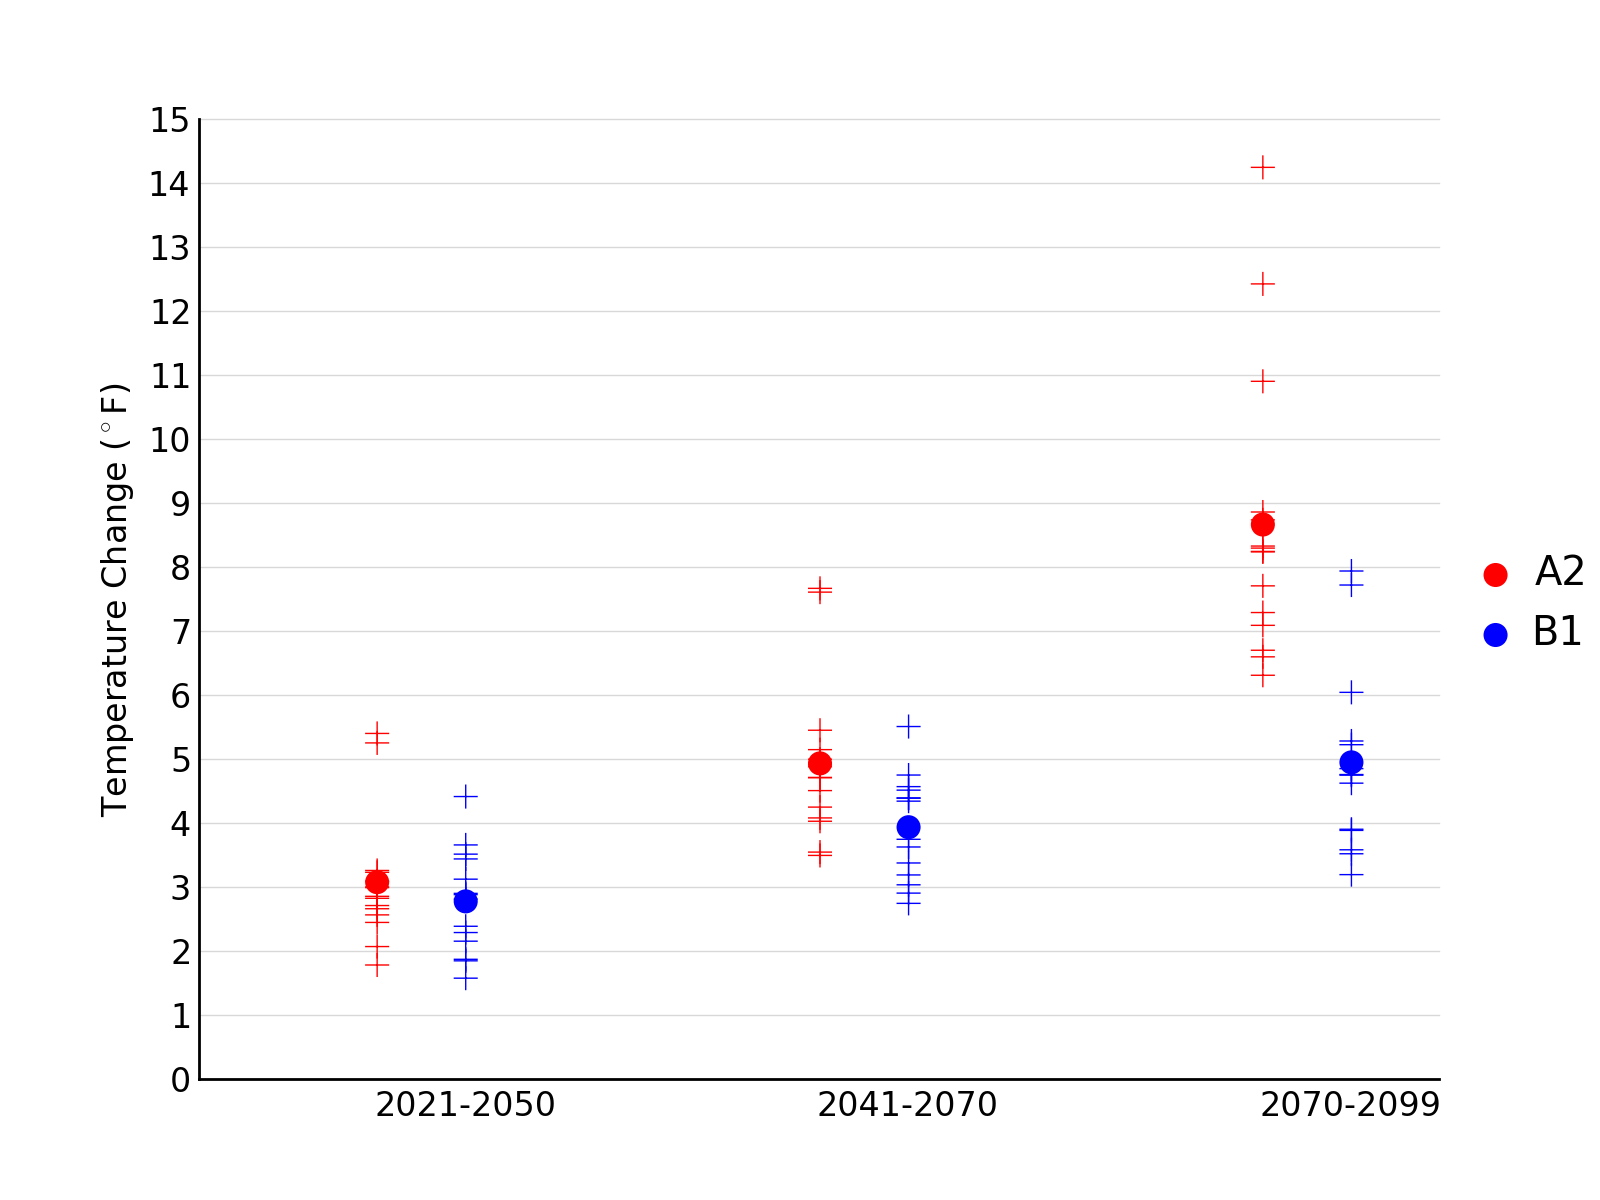
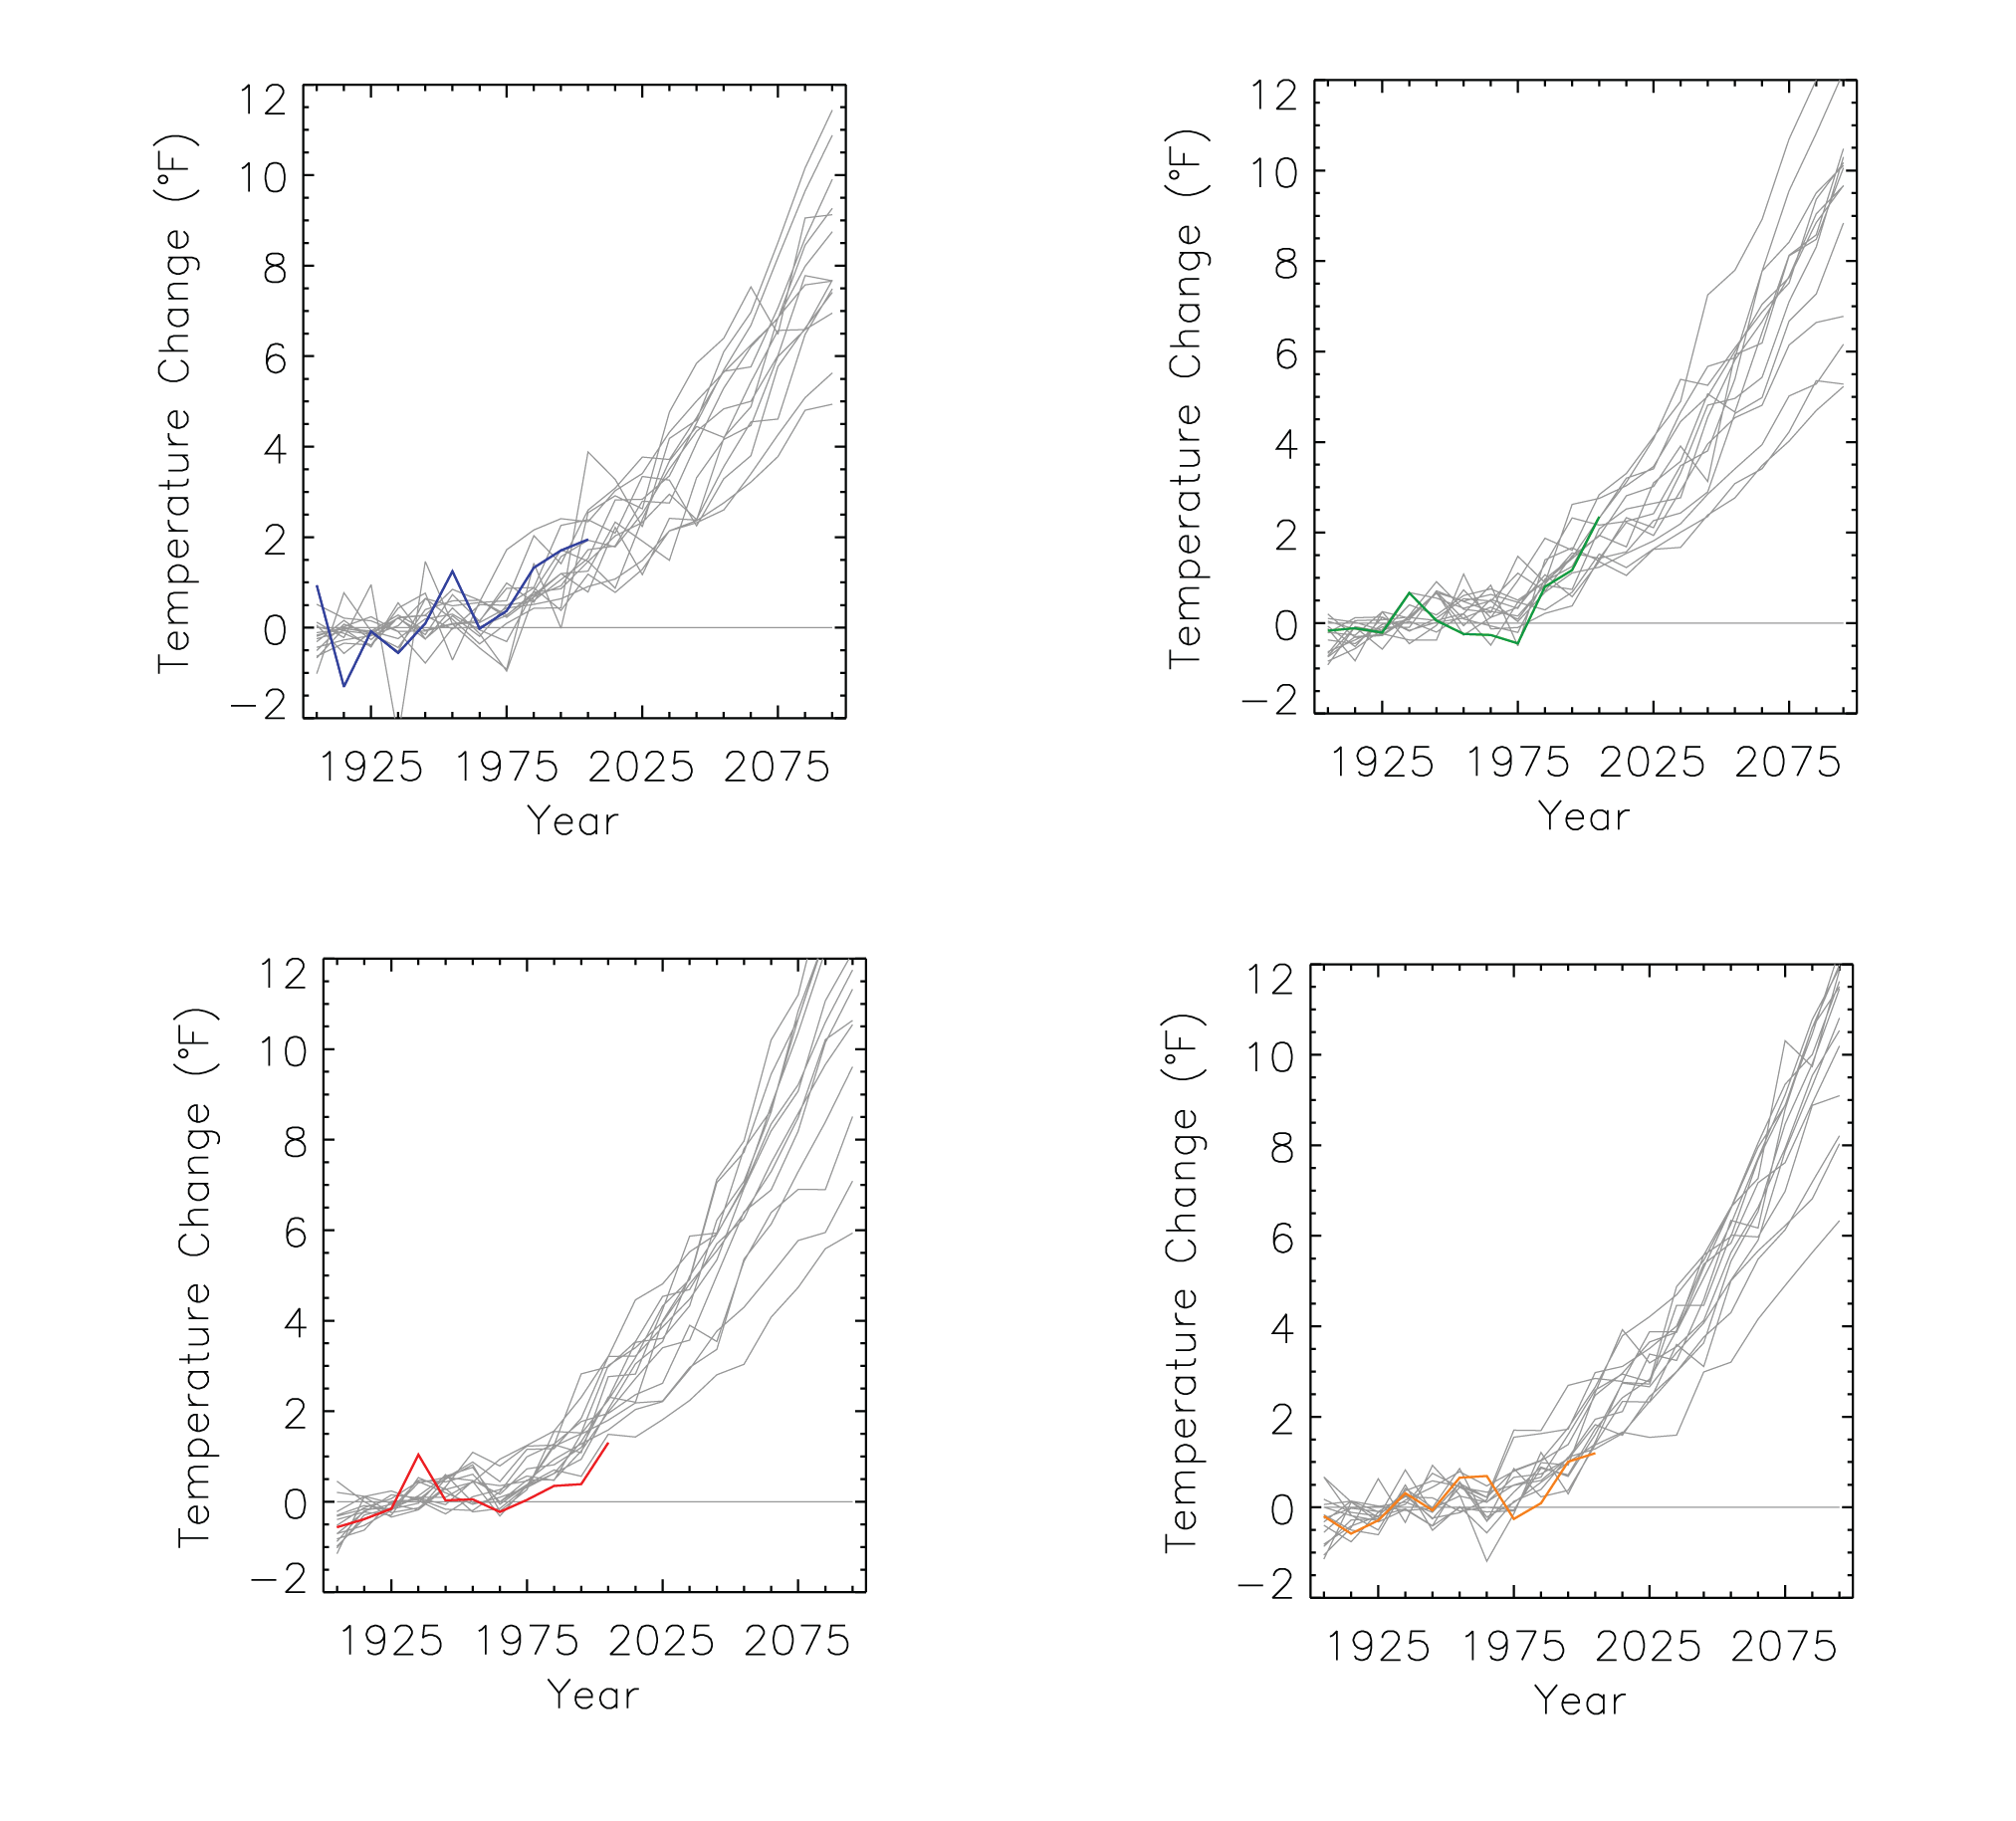
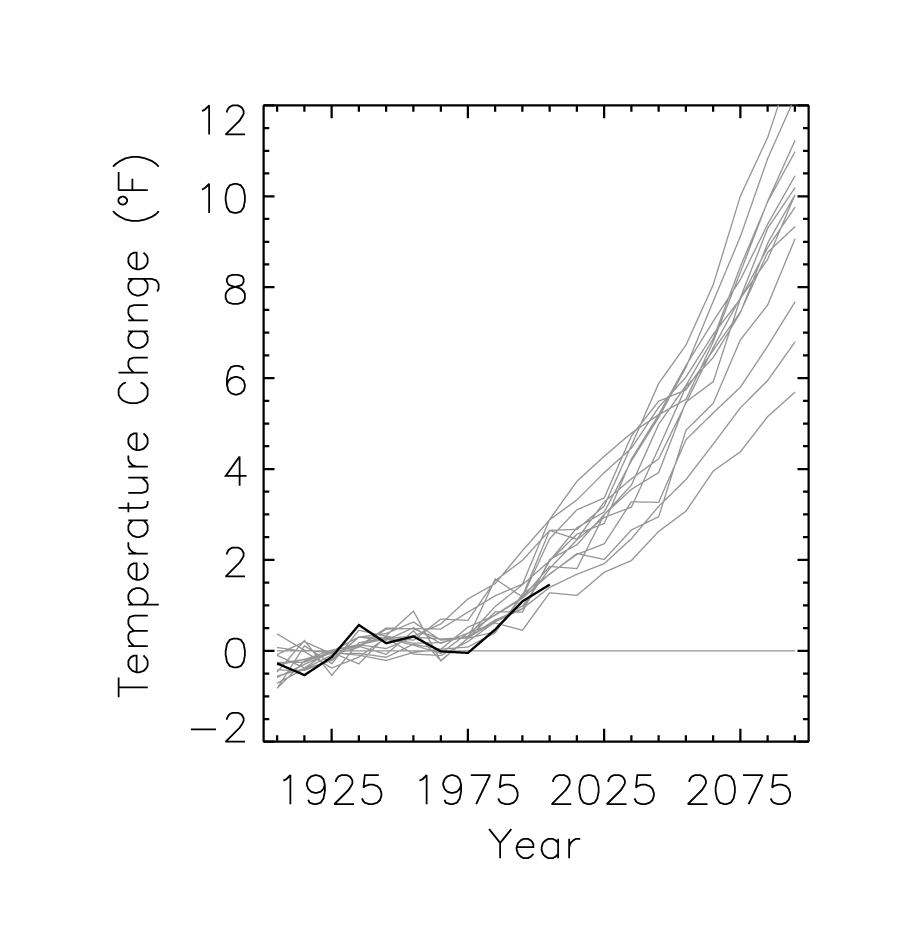
Simulated annual mean temperature change |
Simulated |
Temperature |
Great Plains |
Regional Climate Trends and Scenarios for the U.S. National Climate Assessment. Part 4. Climate of the U.S. Great Plains |
NCA 3 |
 |
|
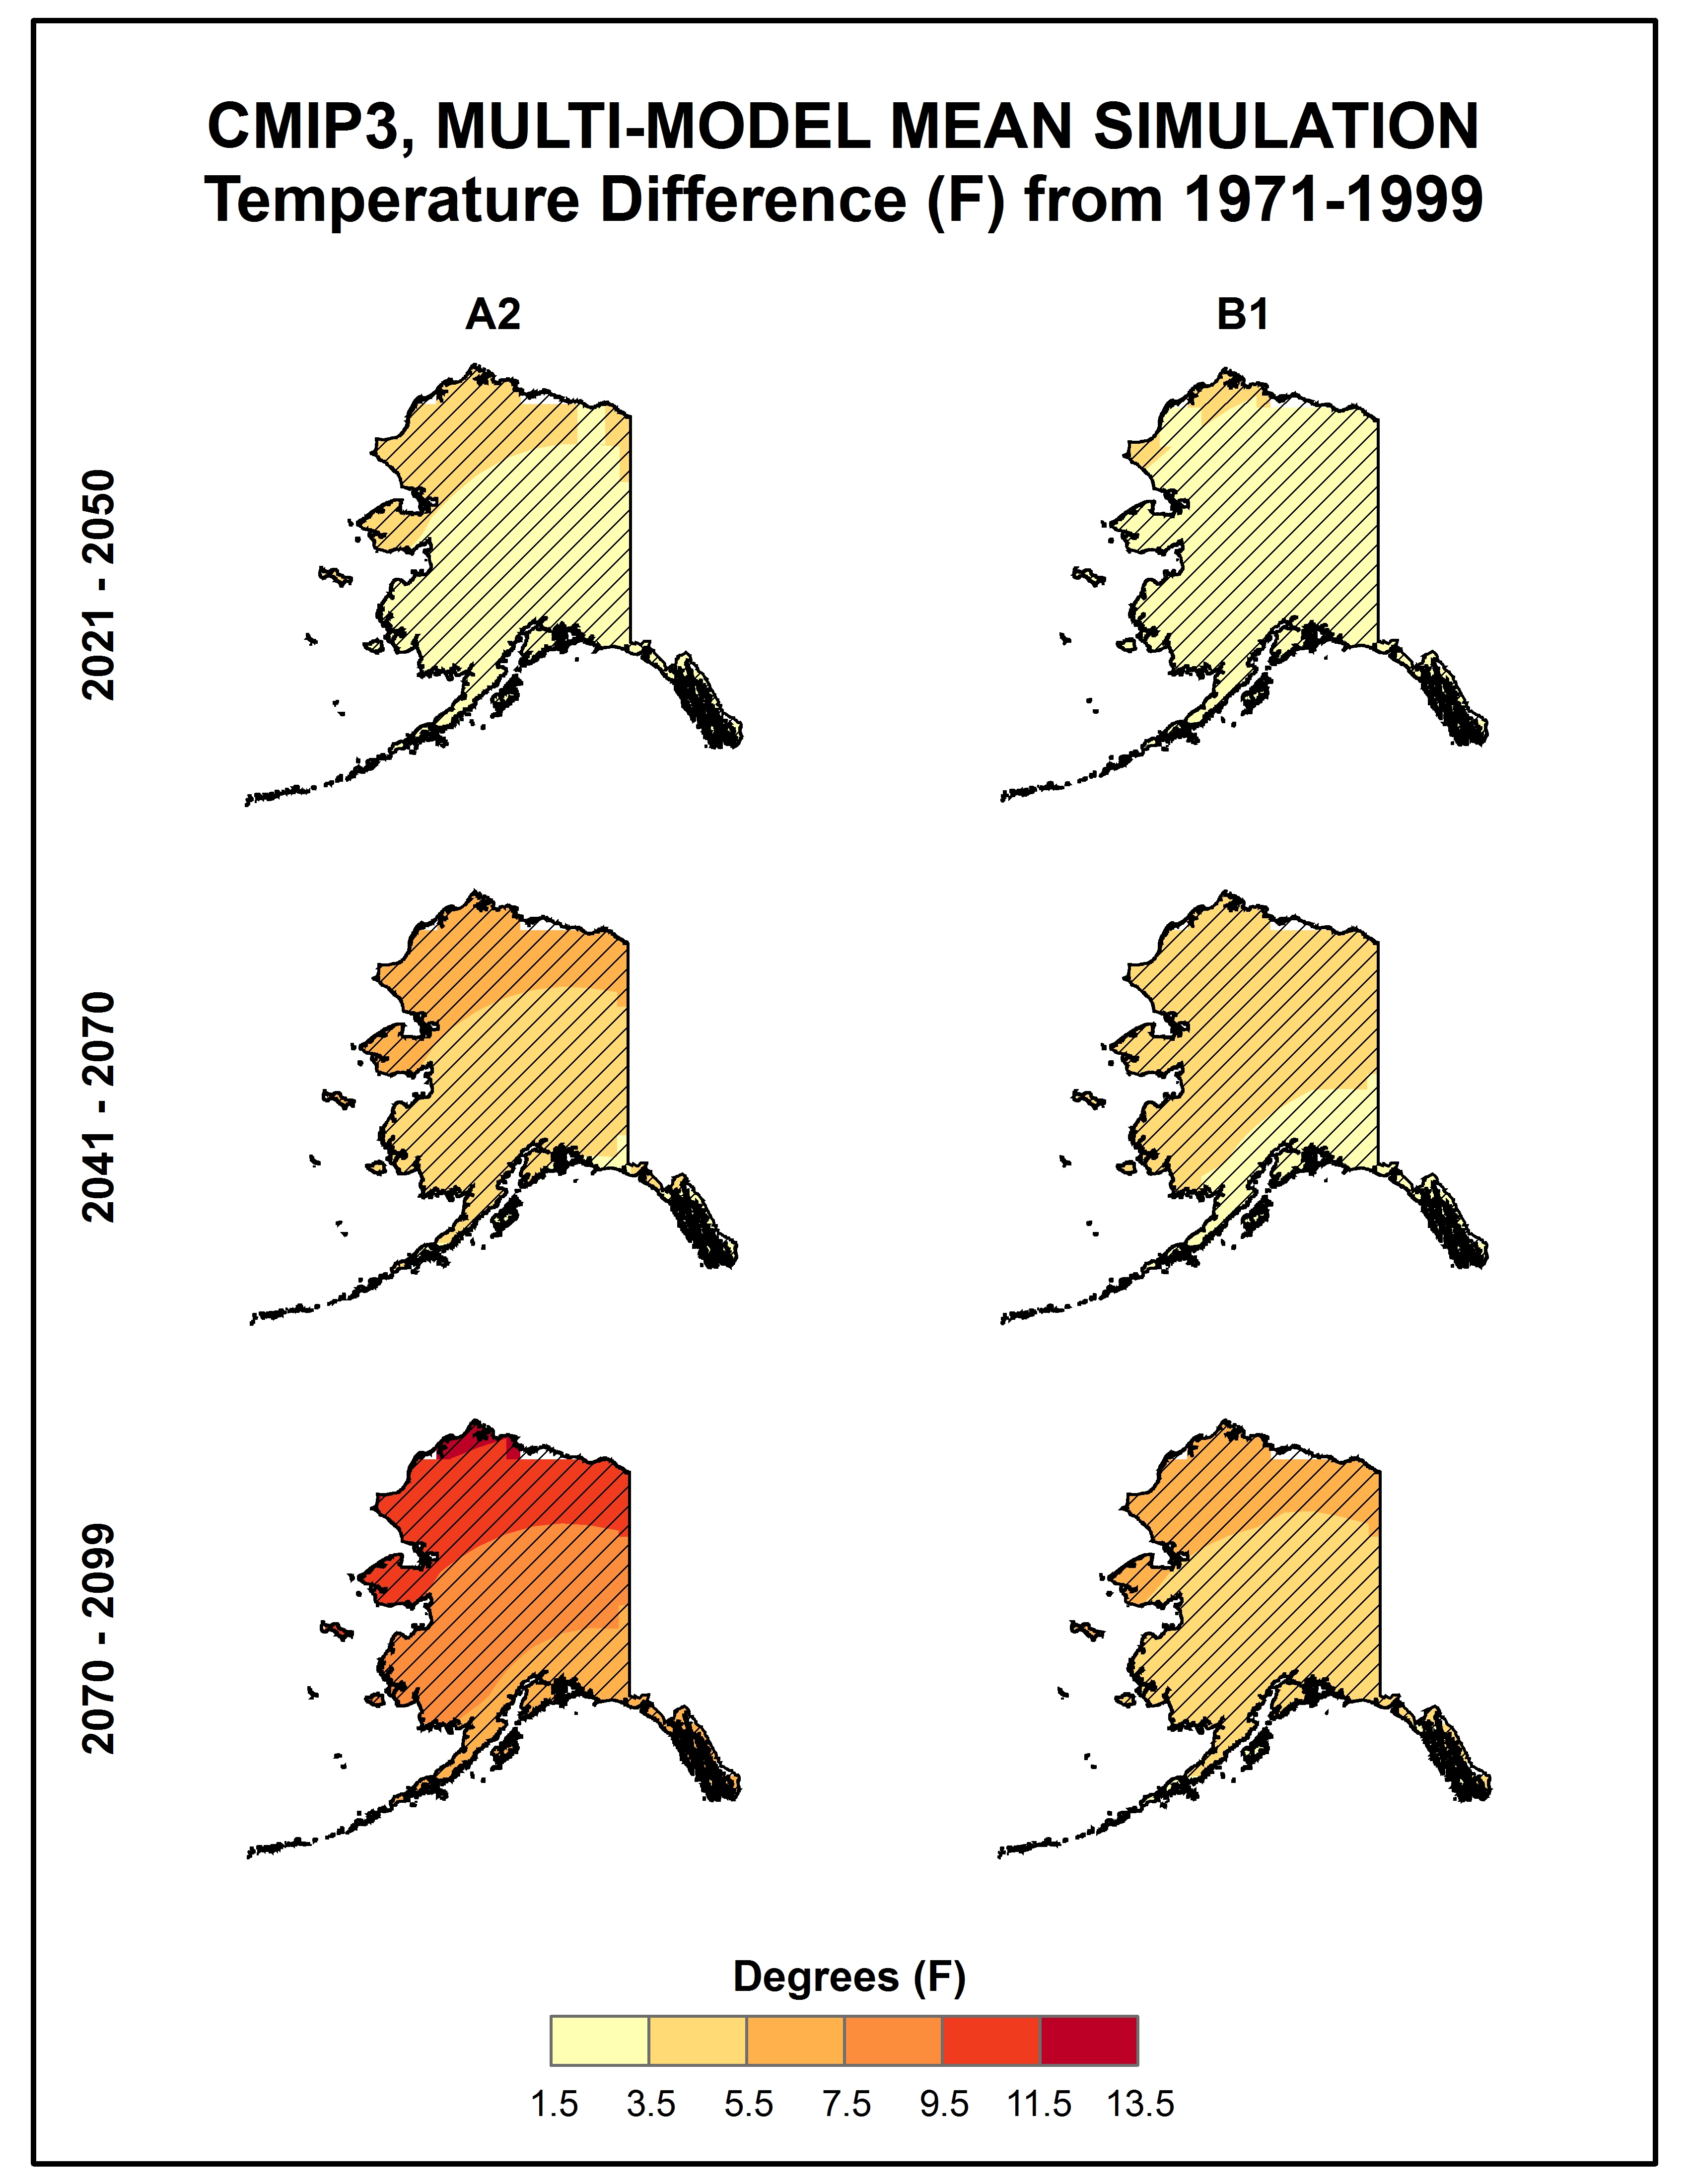
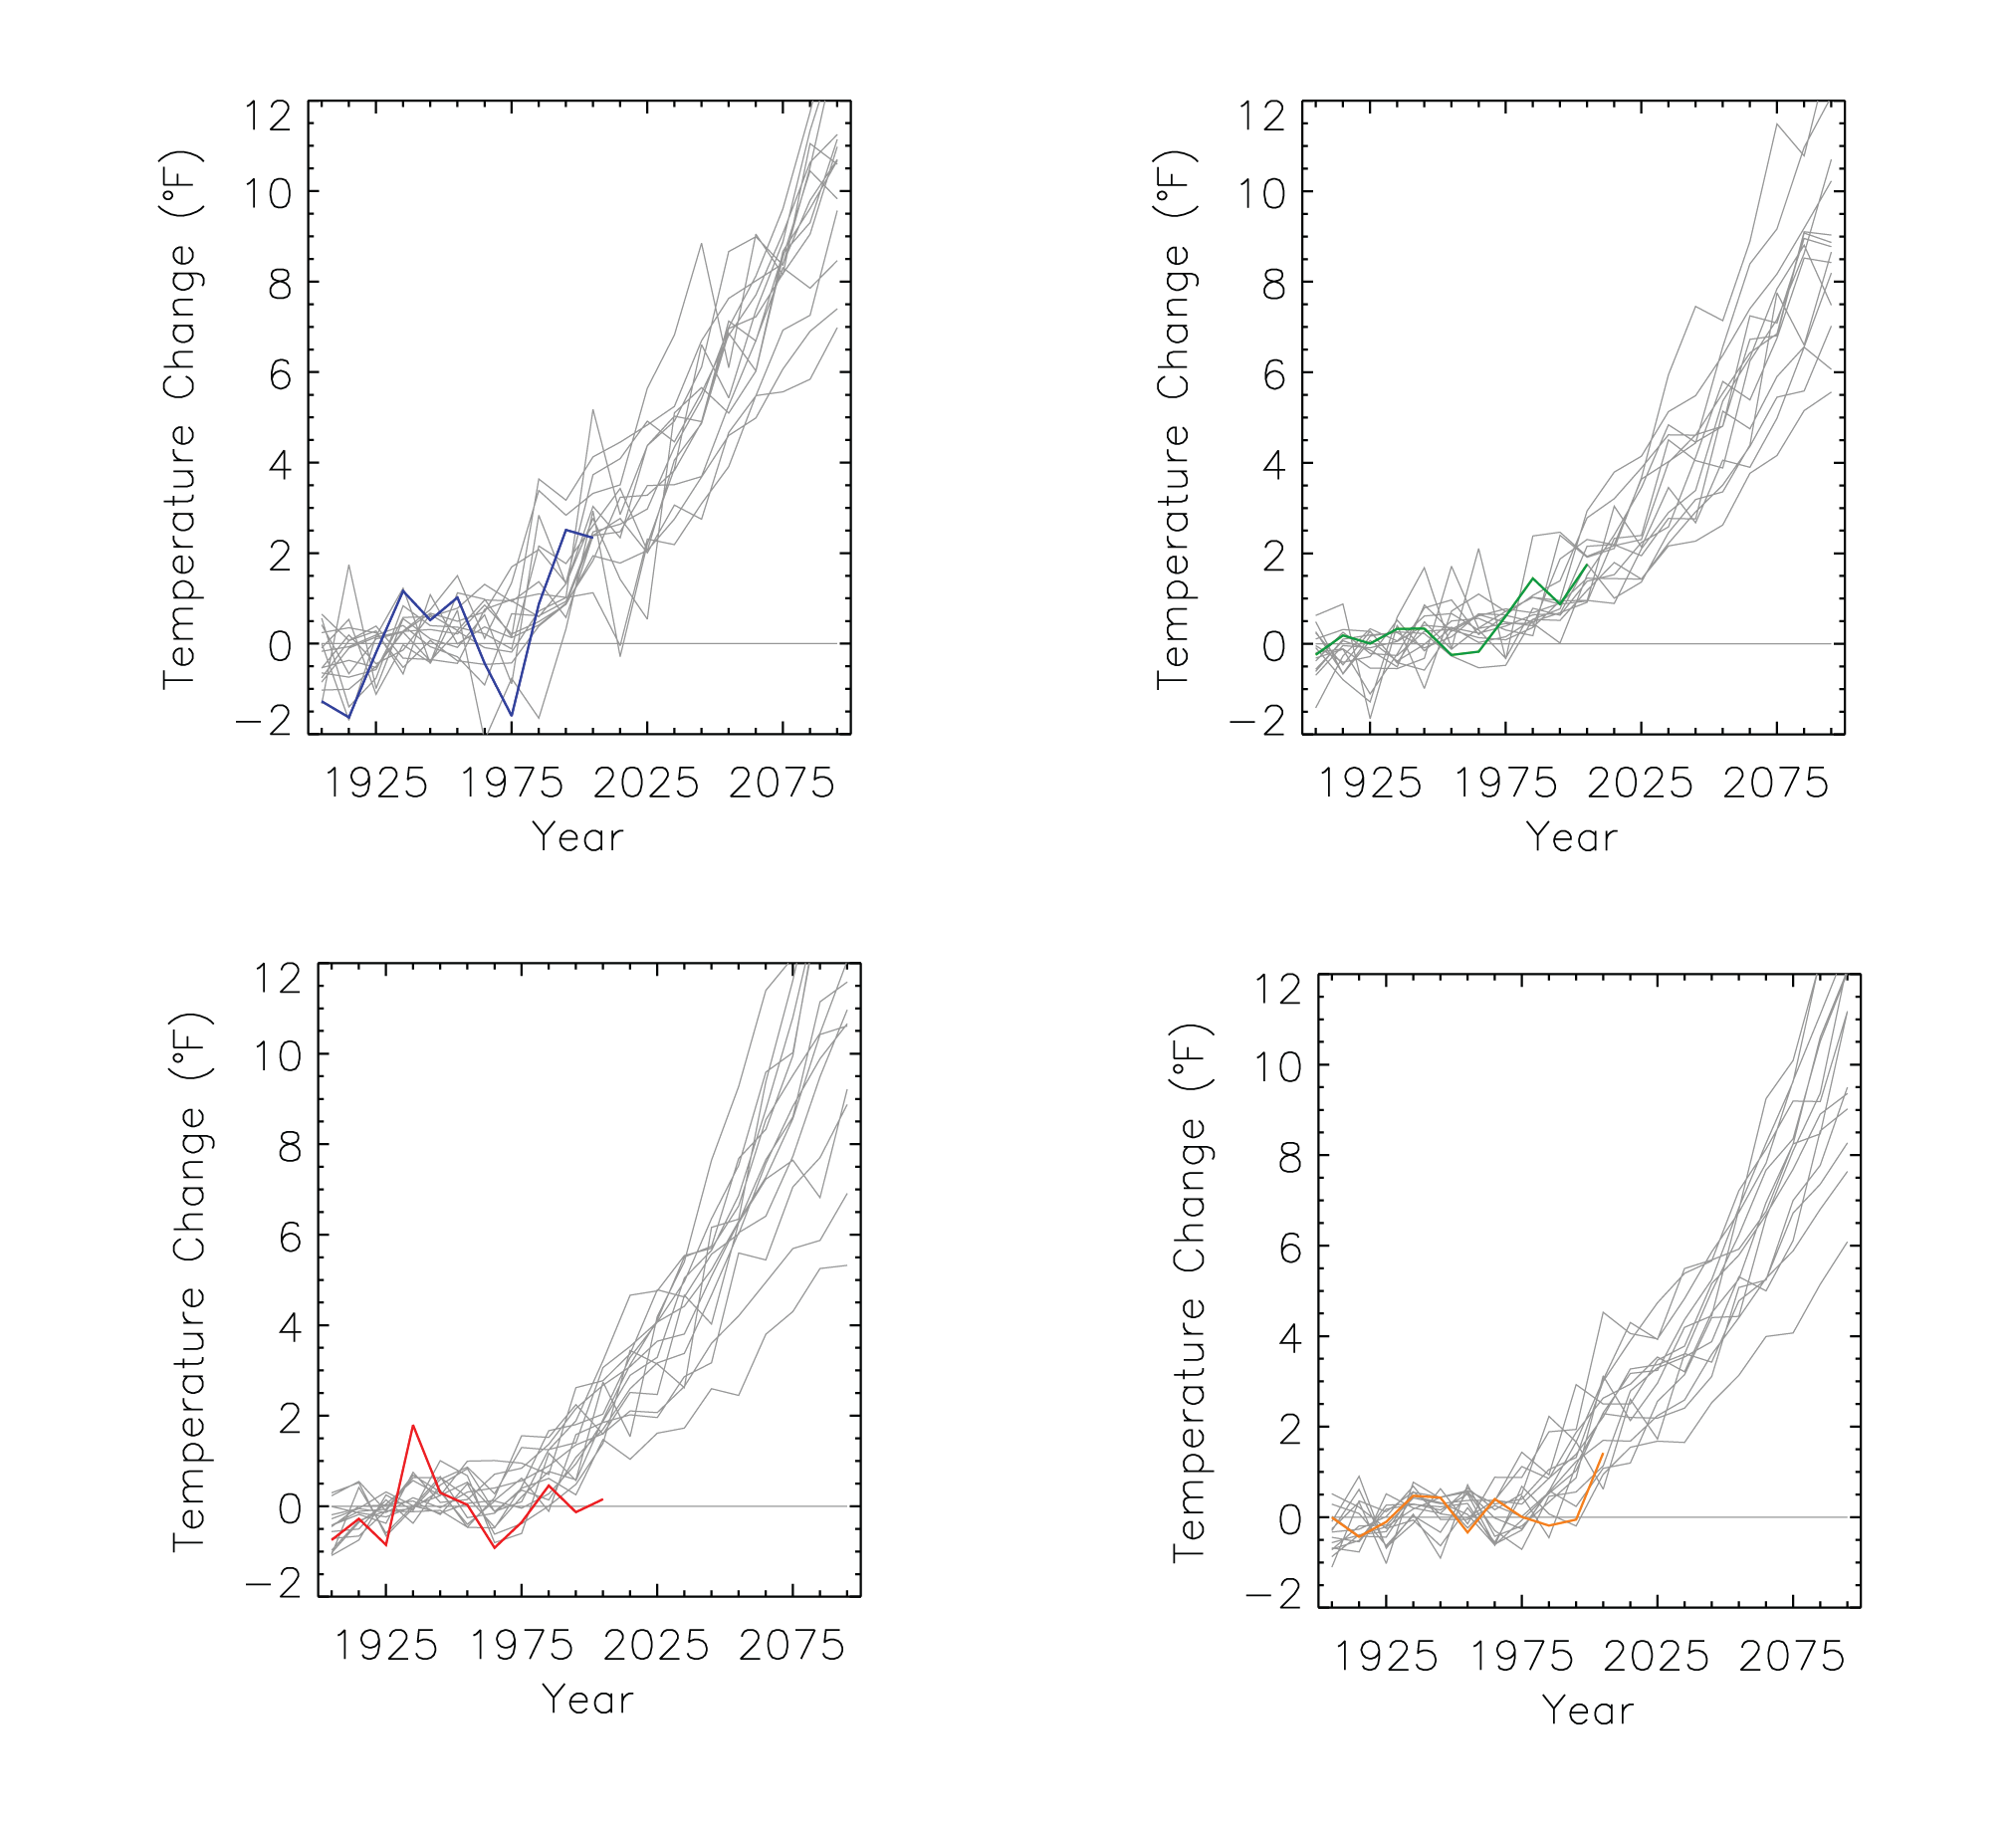
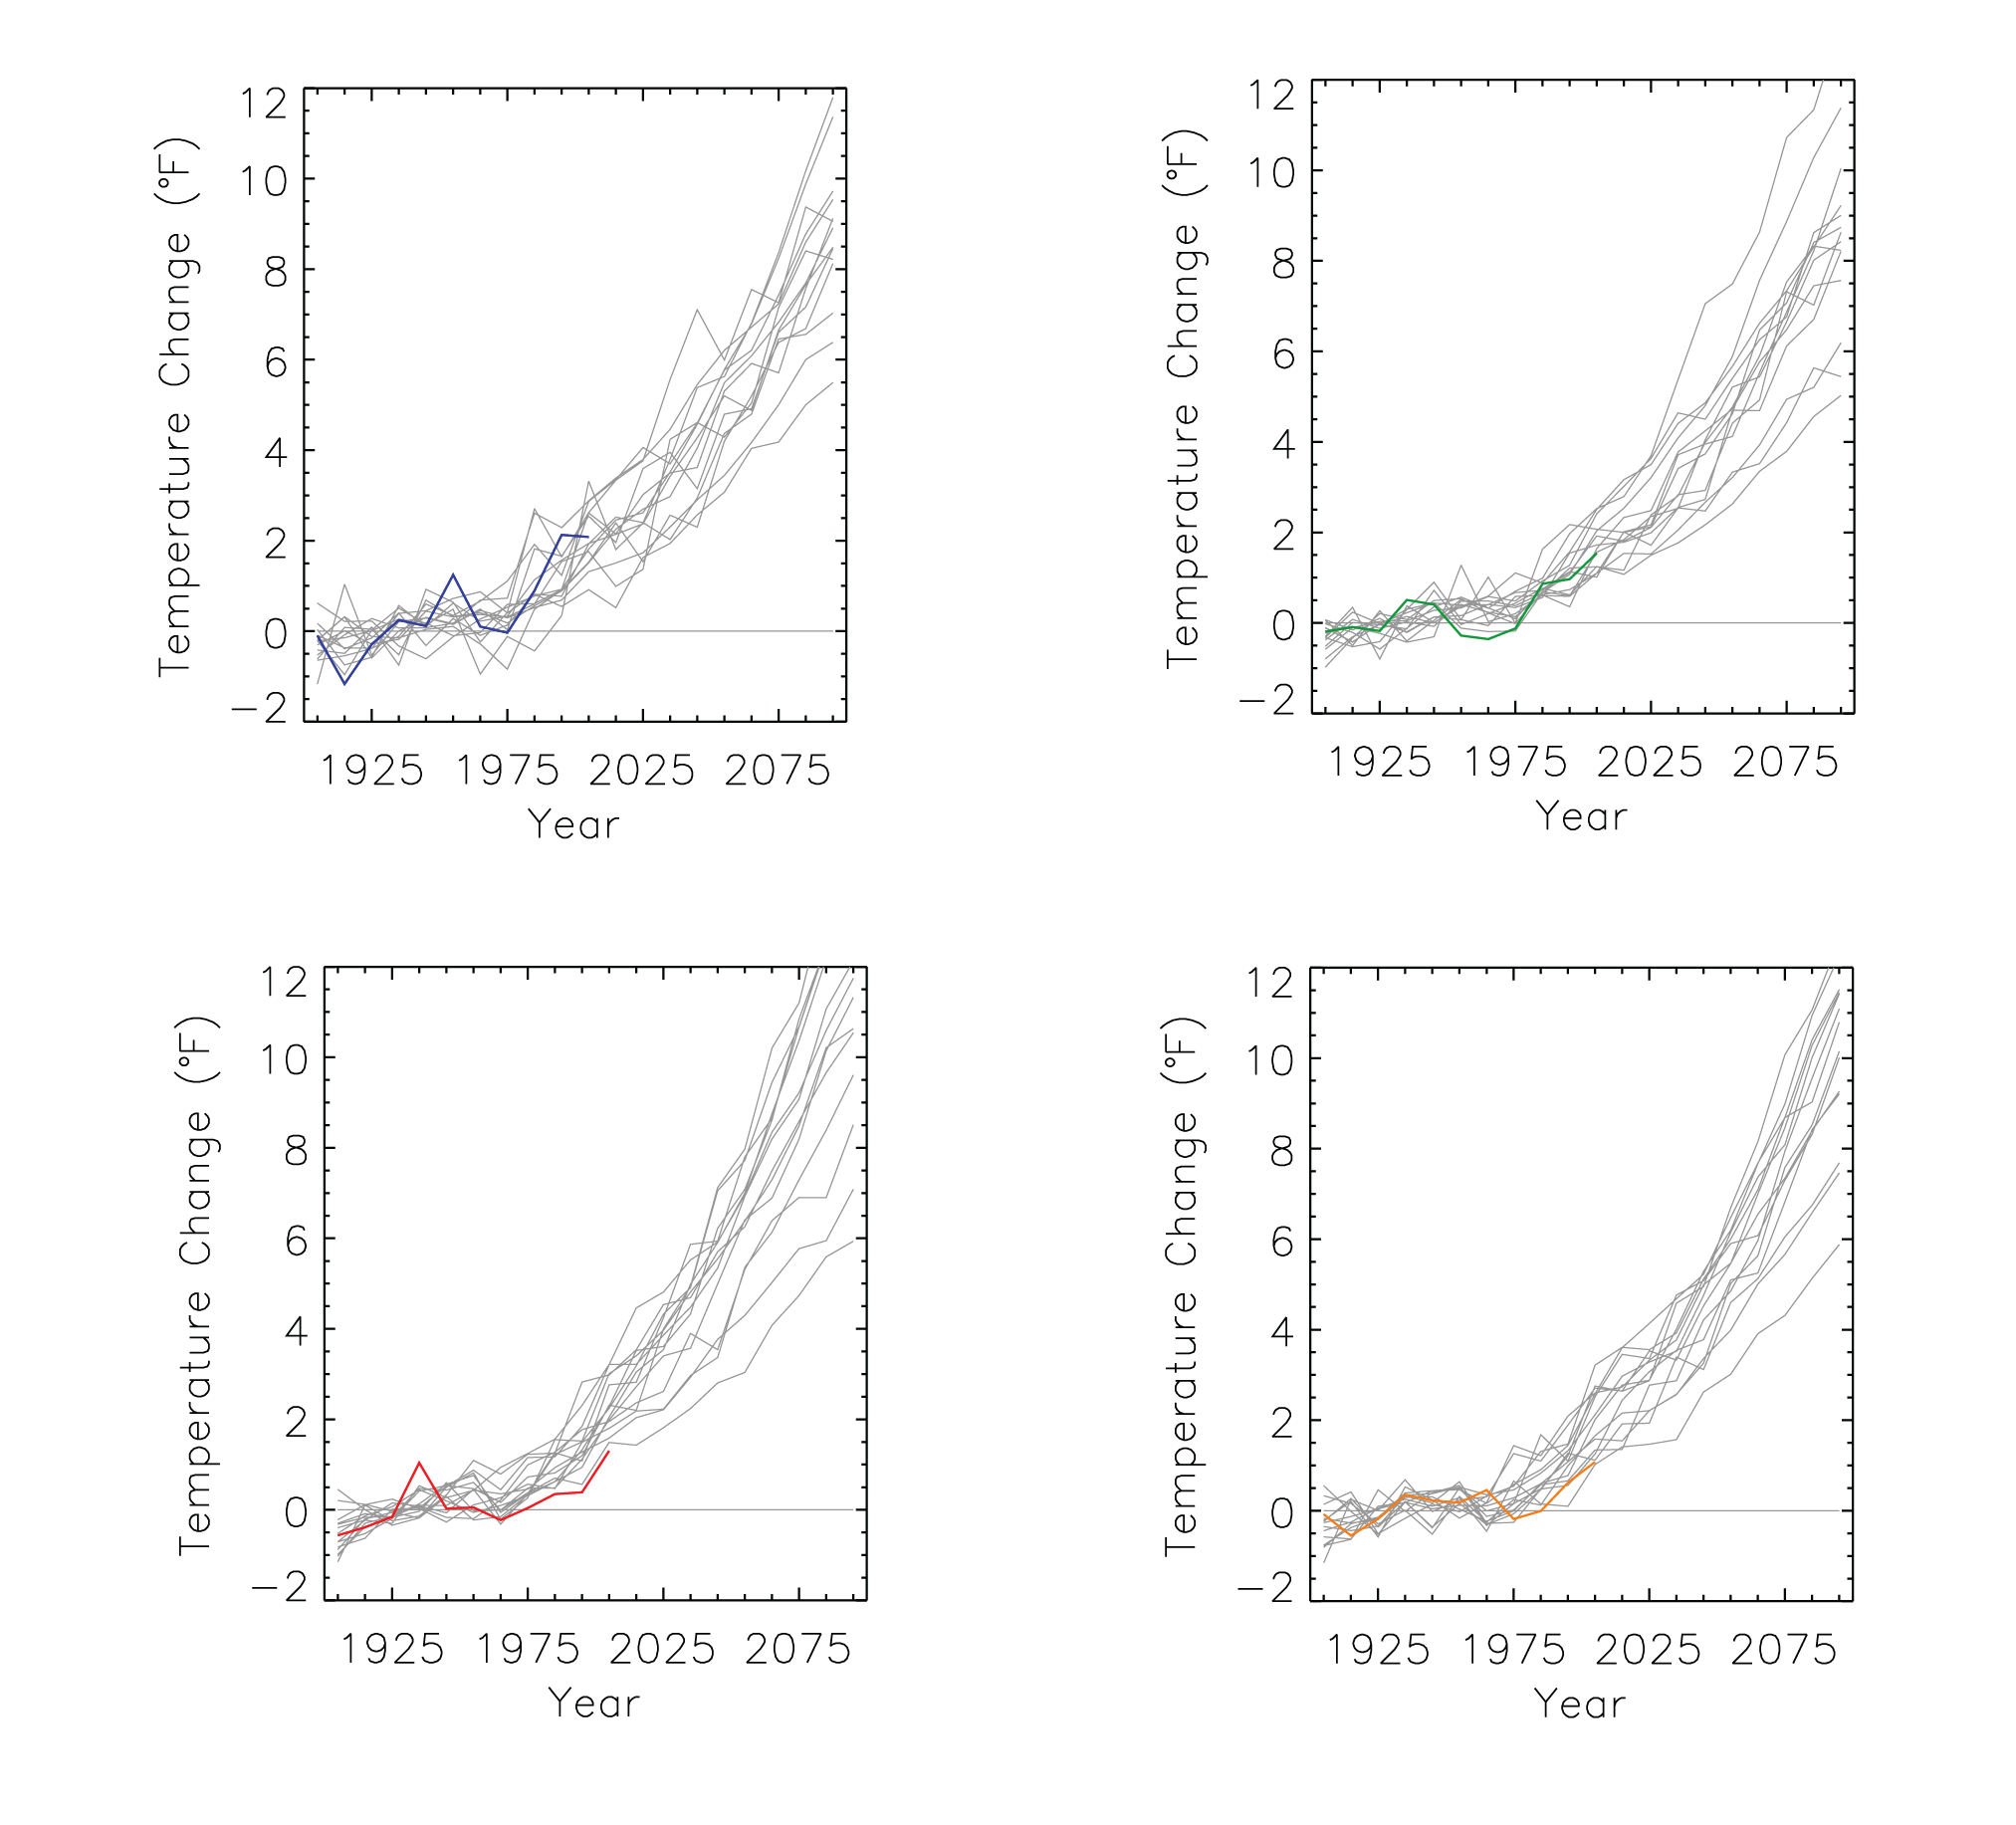
Simulated annual mean temperature change |
Simulated |
Temperature |
Alaska and Arctic |
Regional Climate Trends and Scenarios for the U.S. National Climate Assessment. Part 7. Climate of Alaska |
NCA 3 |
 |
|
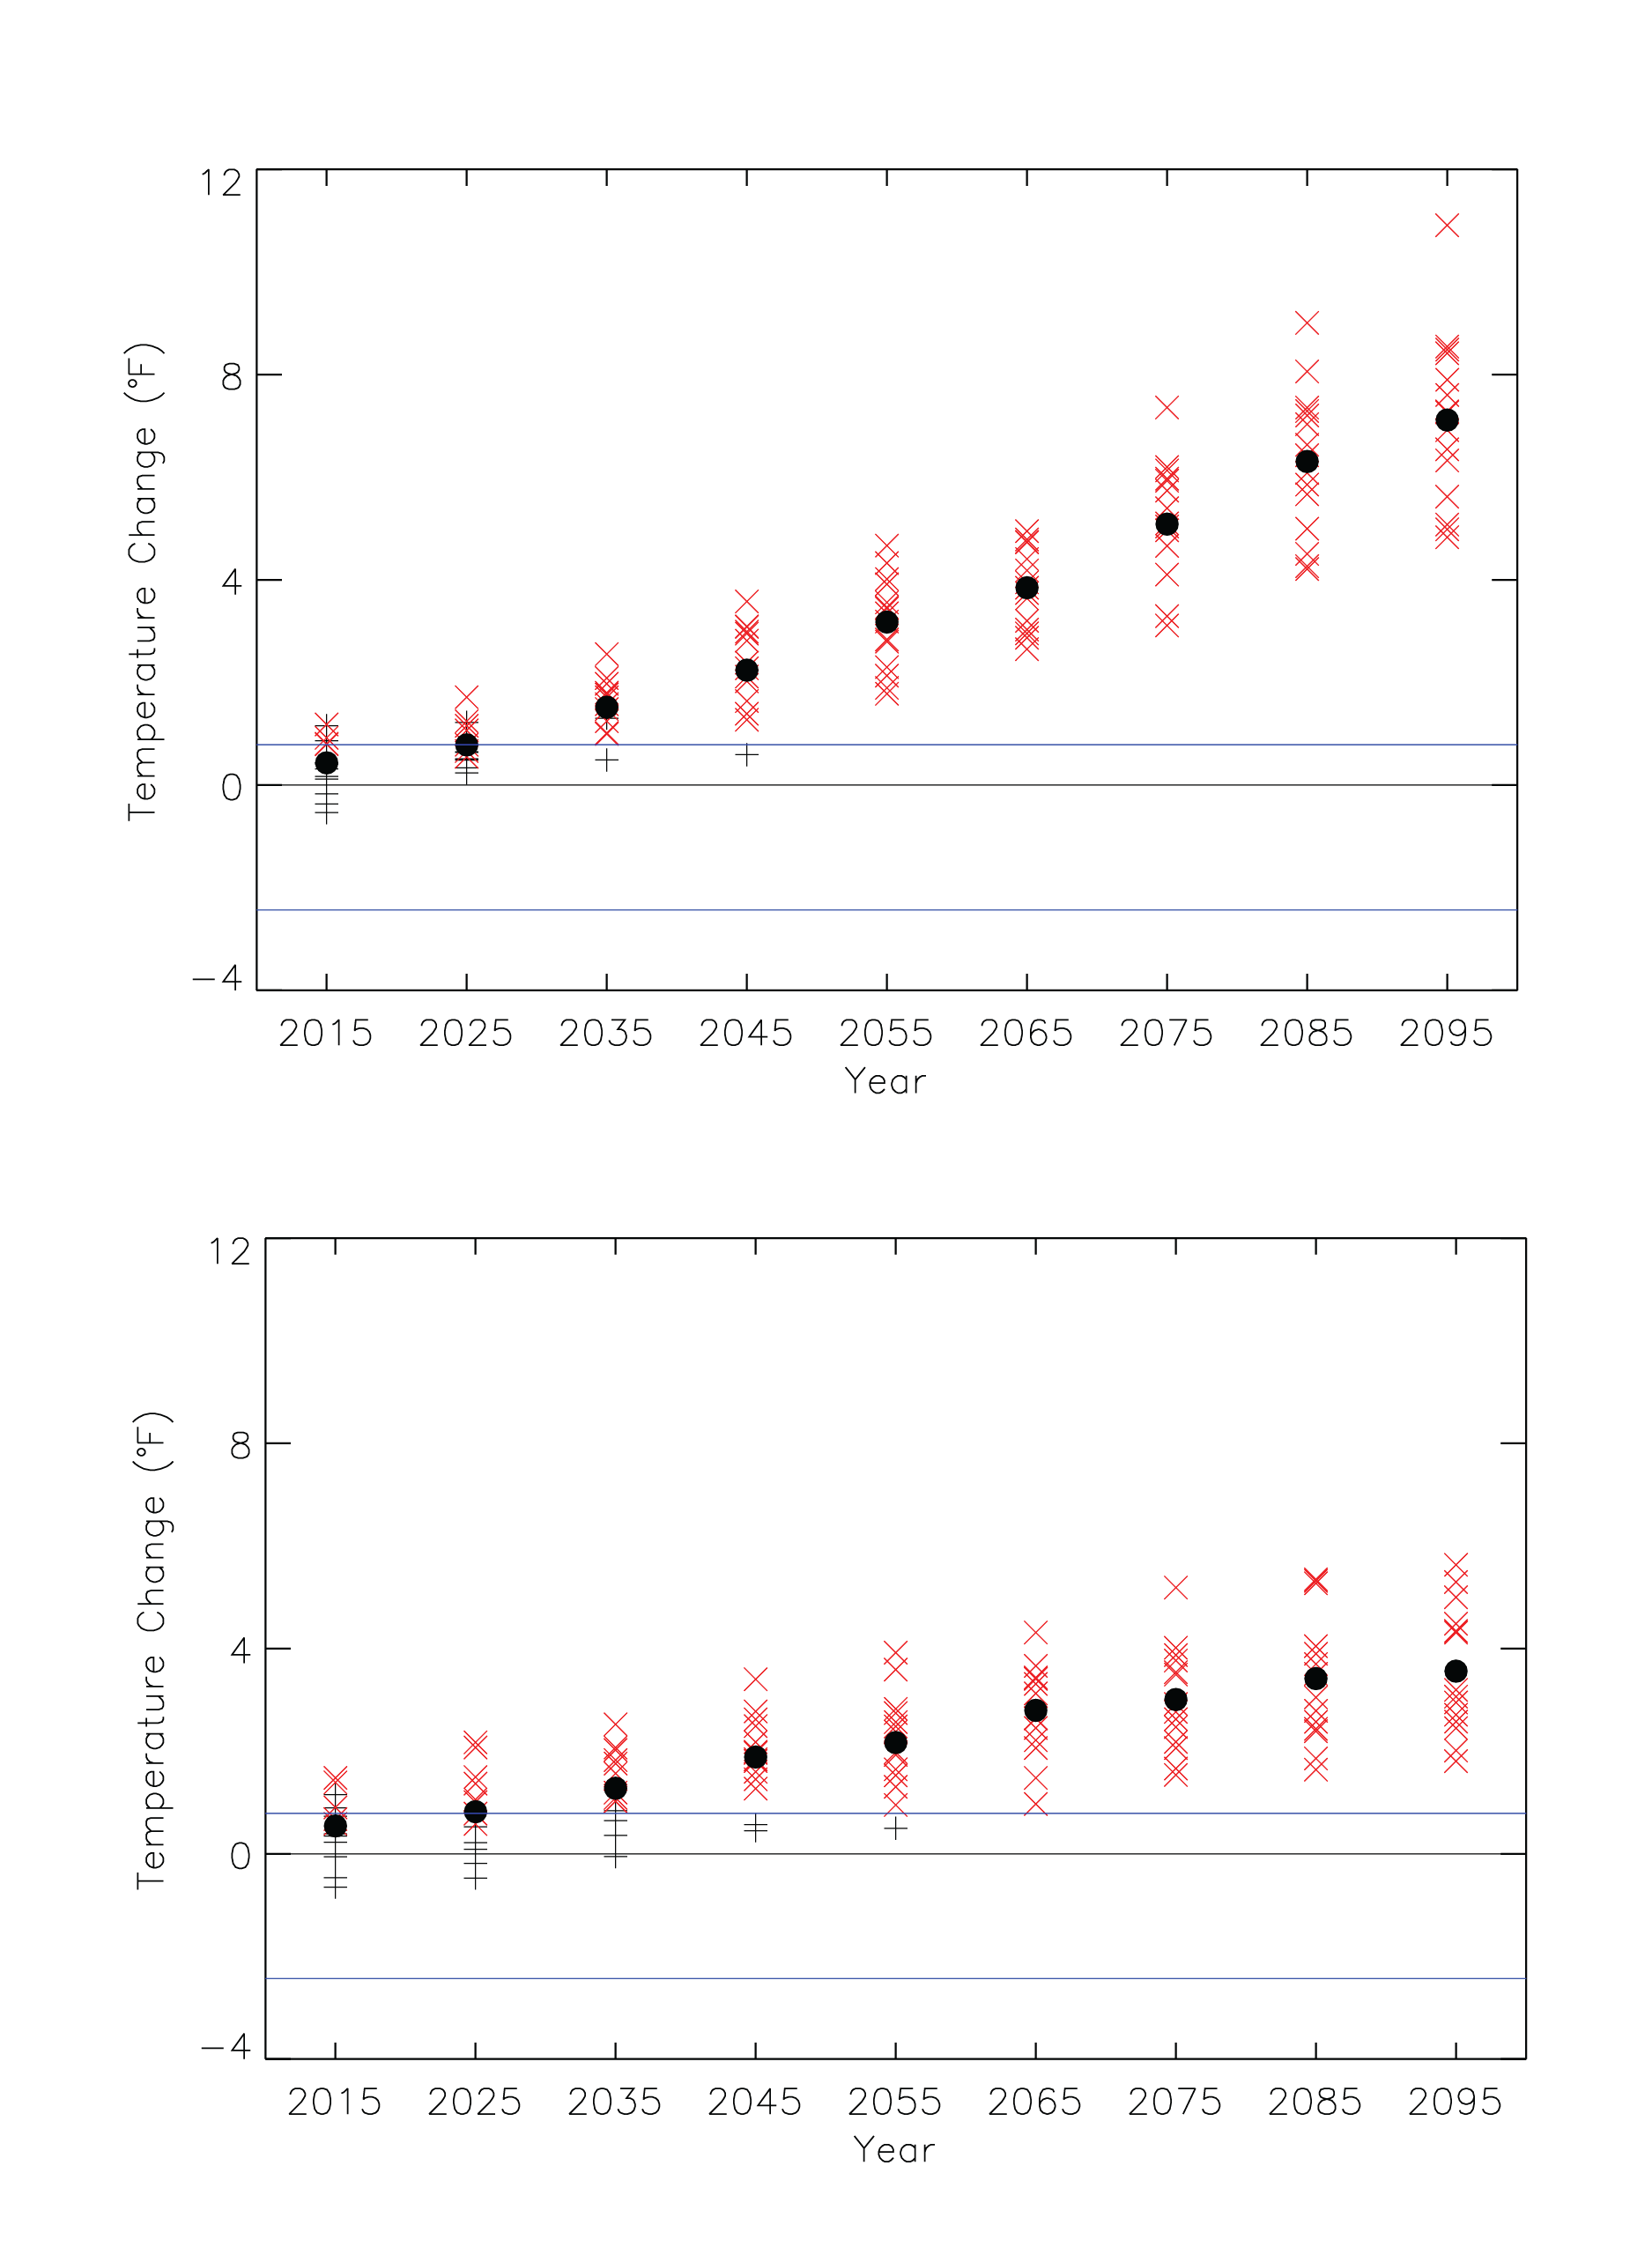
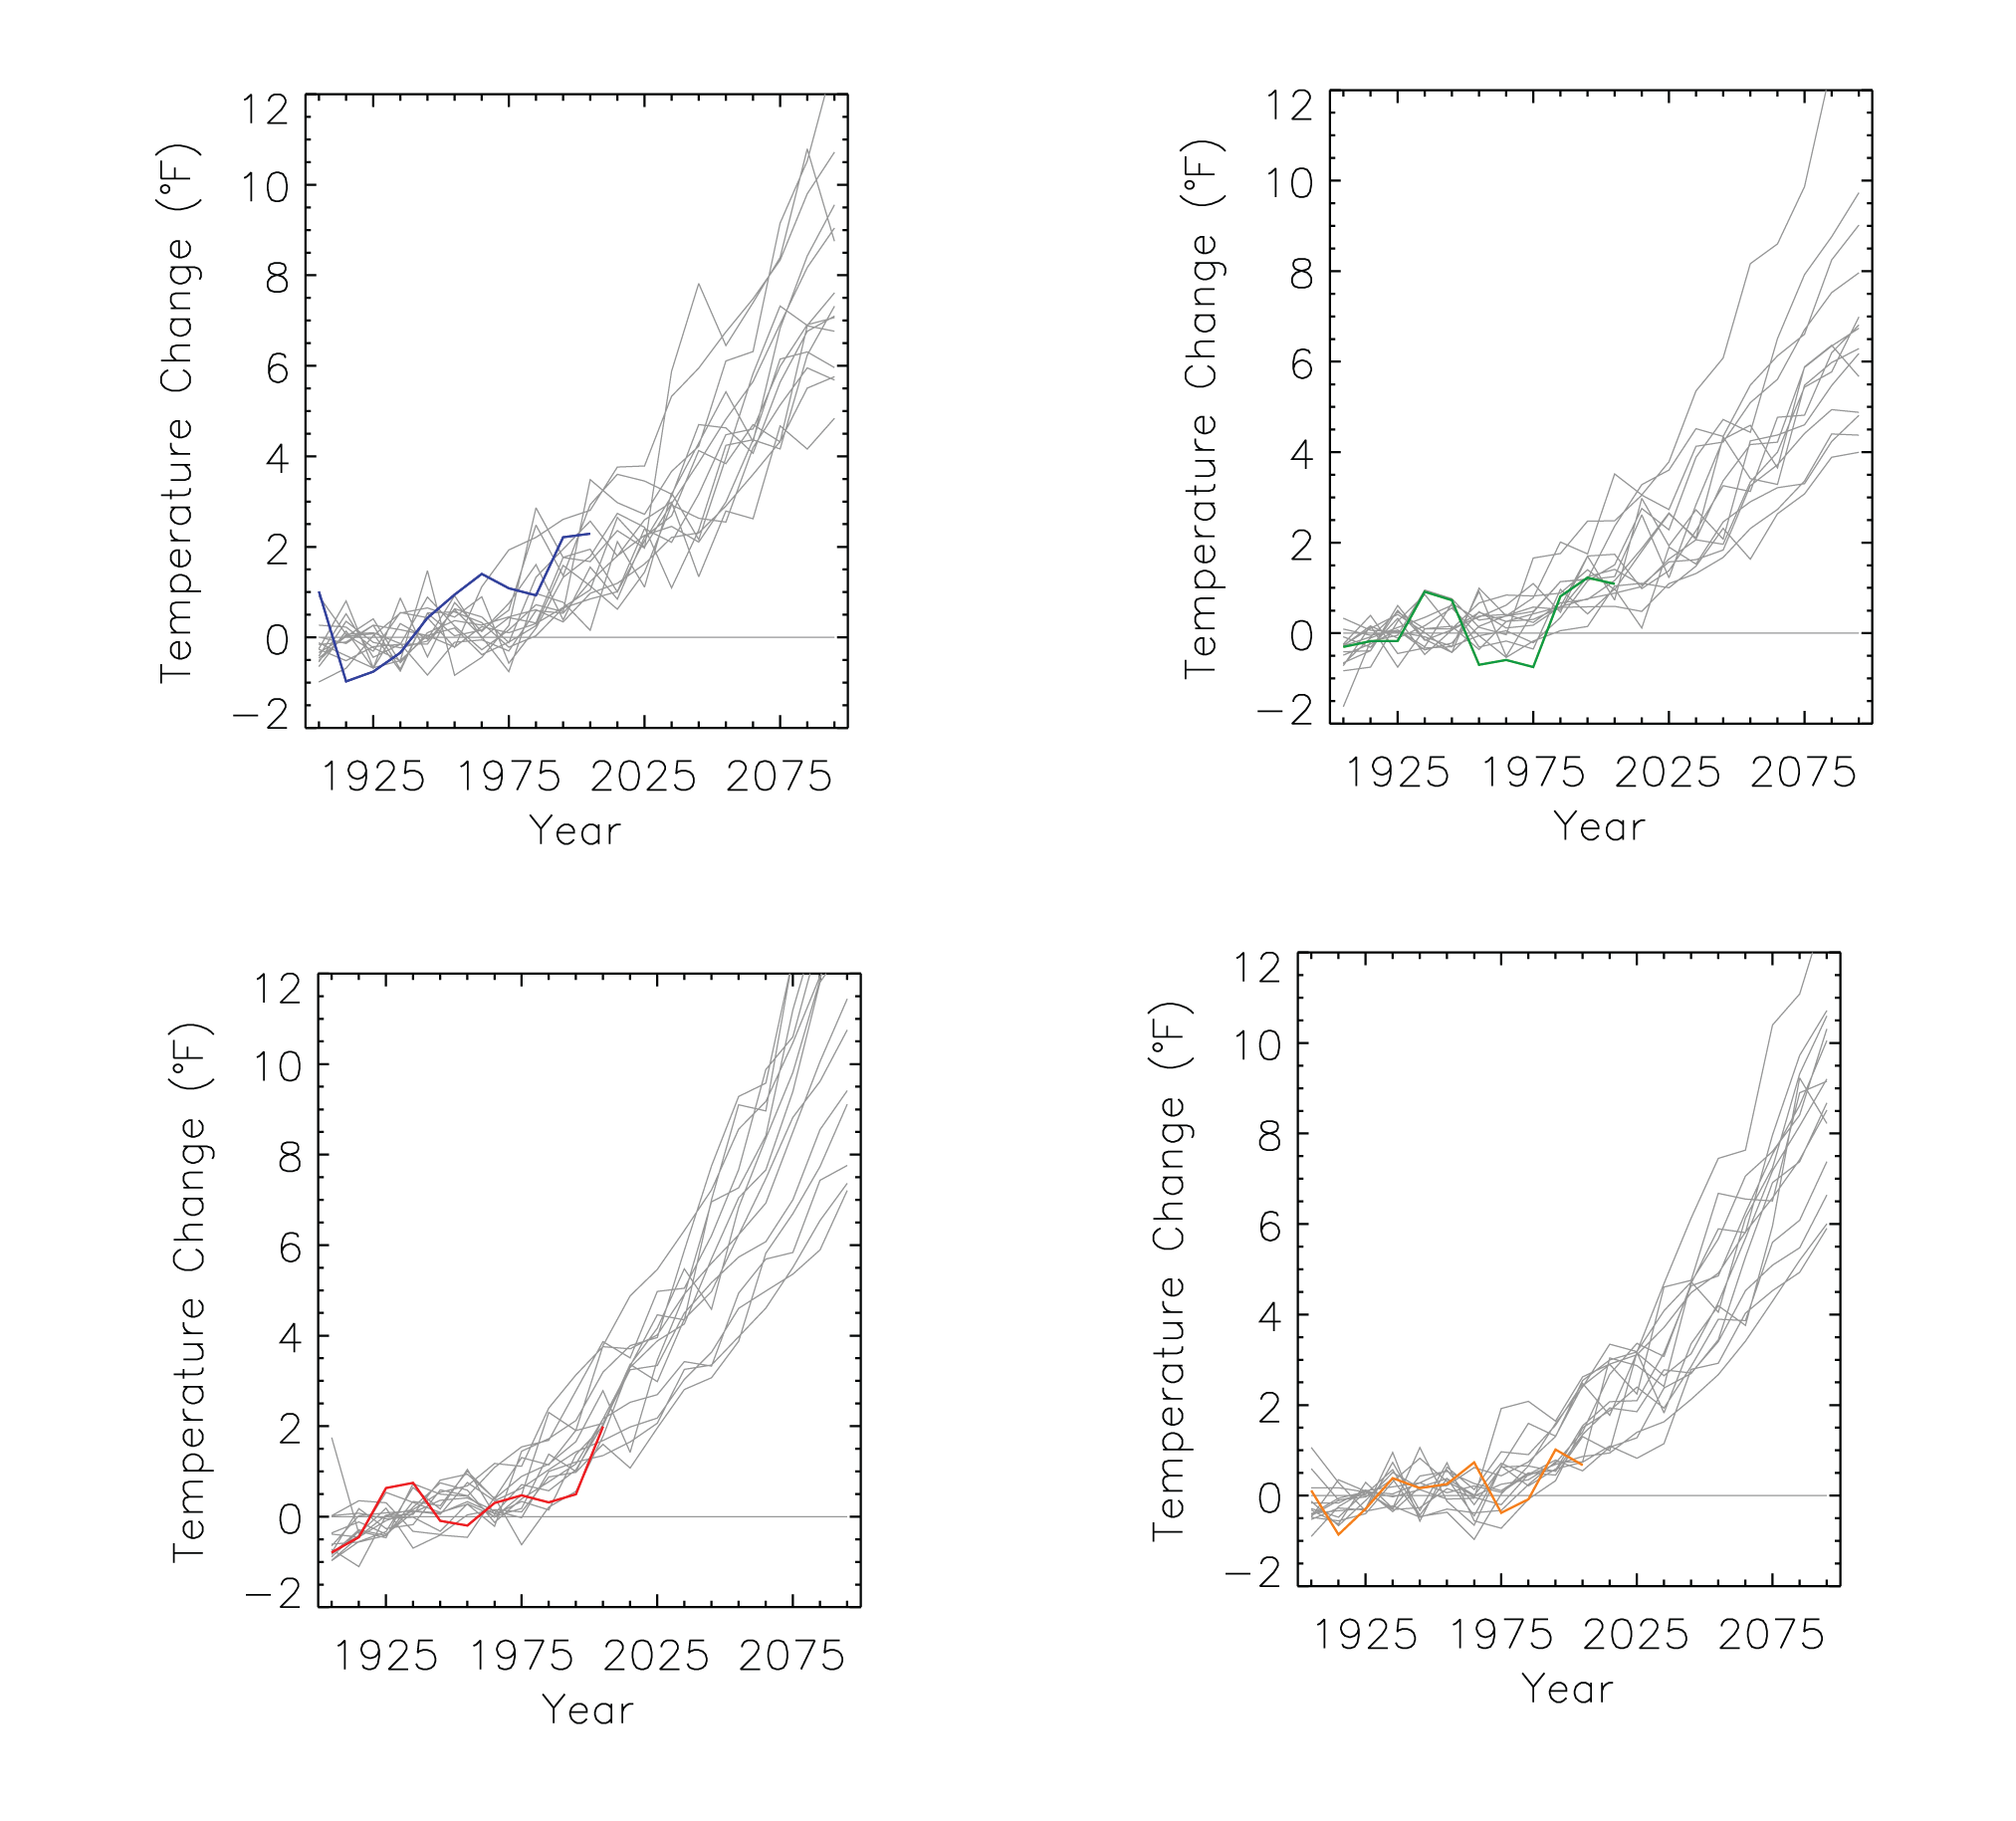
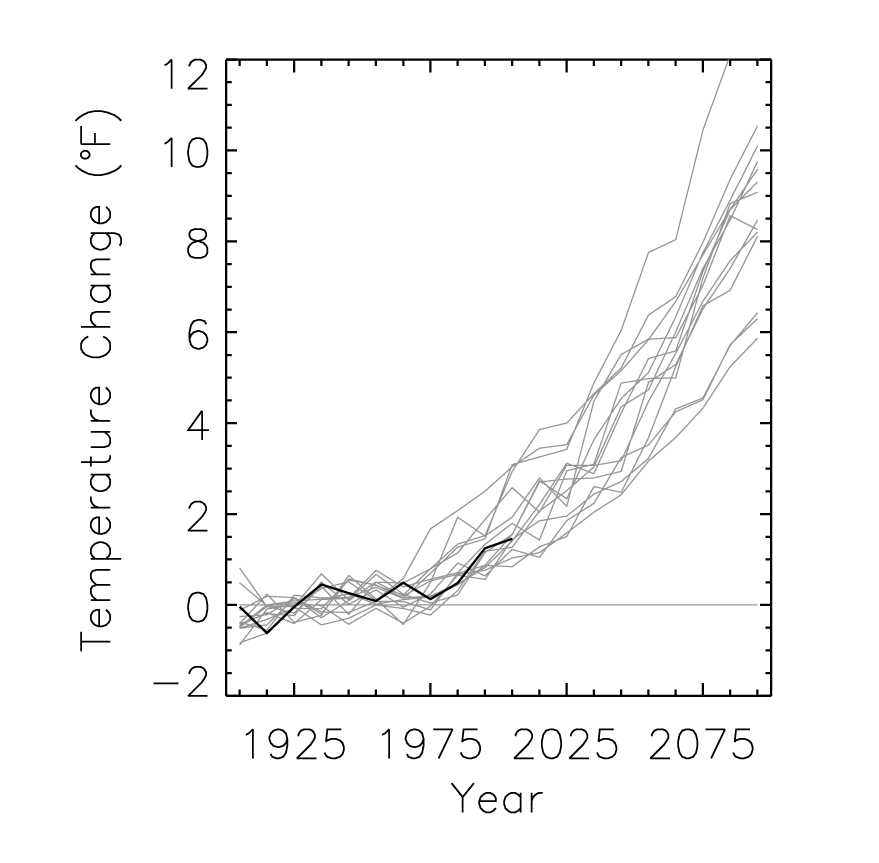
Simulated annual mean temperature change |
Simulated |
Temperature |
Northeast |
Regional Climate Trends and Scenarios for the U.S. National Climate Assessment. Part 1. Climate of the Northeast U.S. |
NCA 3 |
 |
|
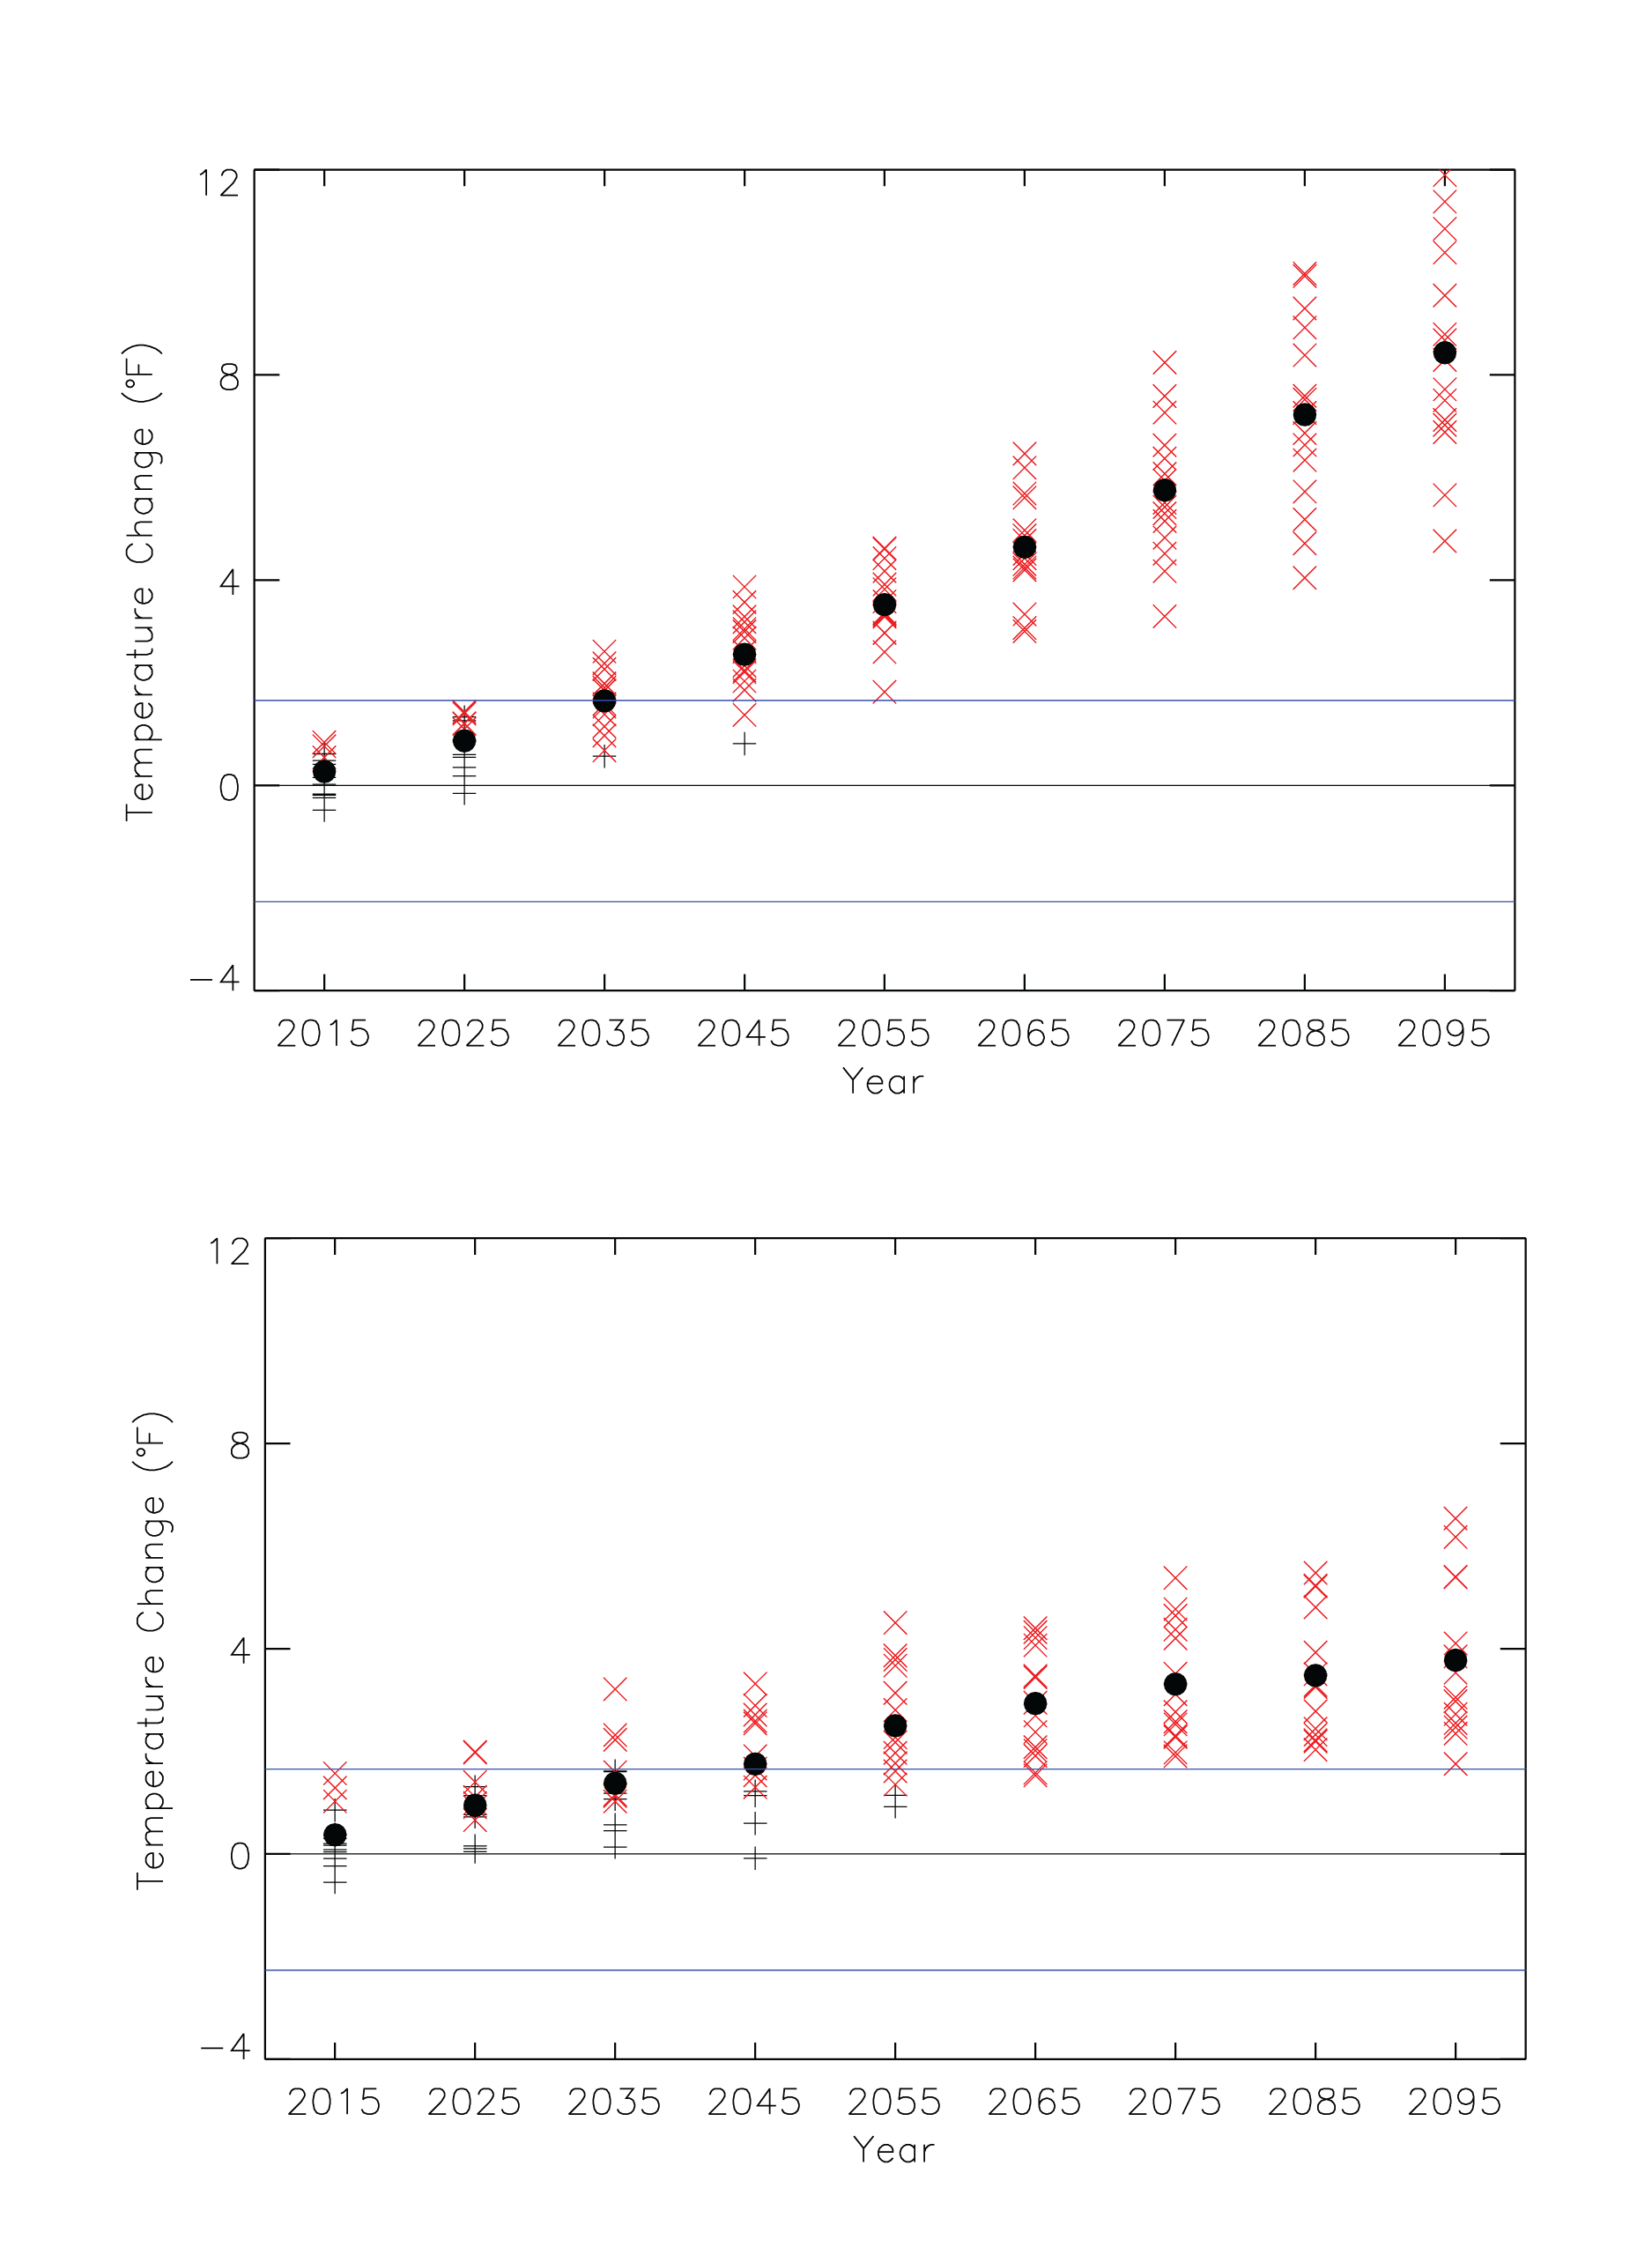
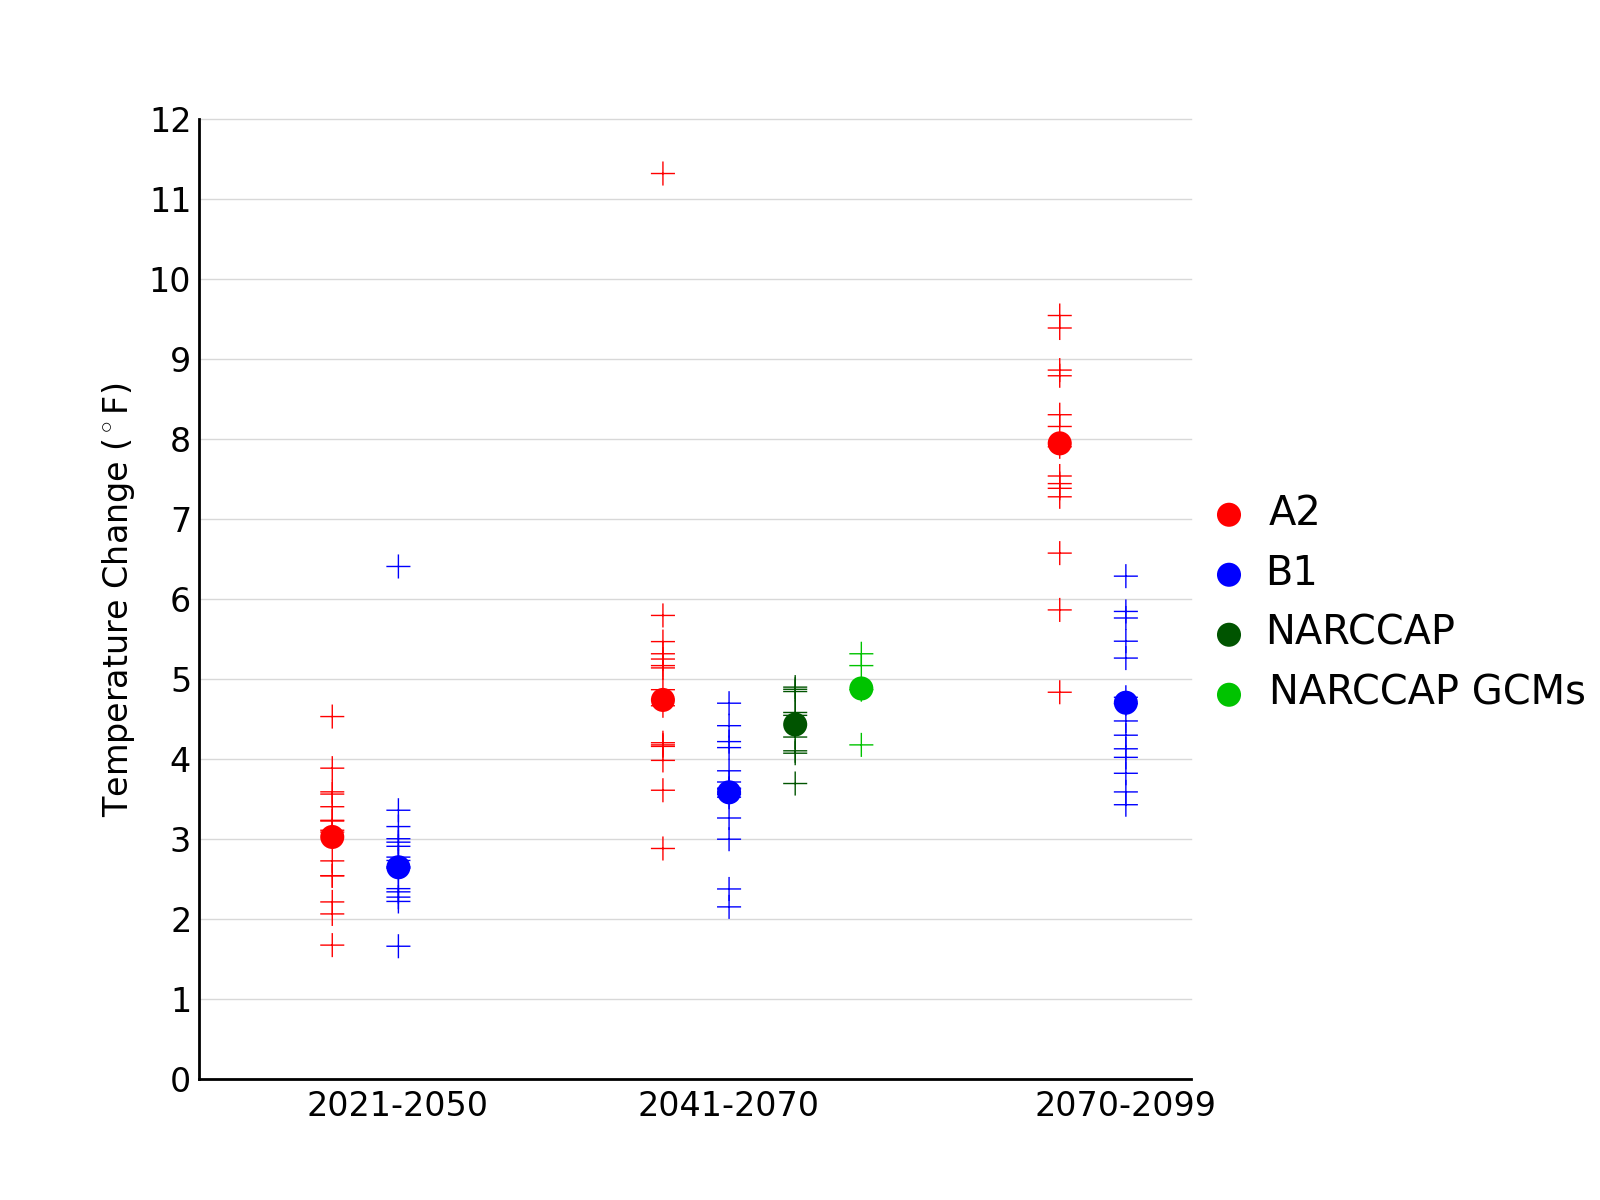
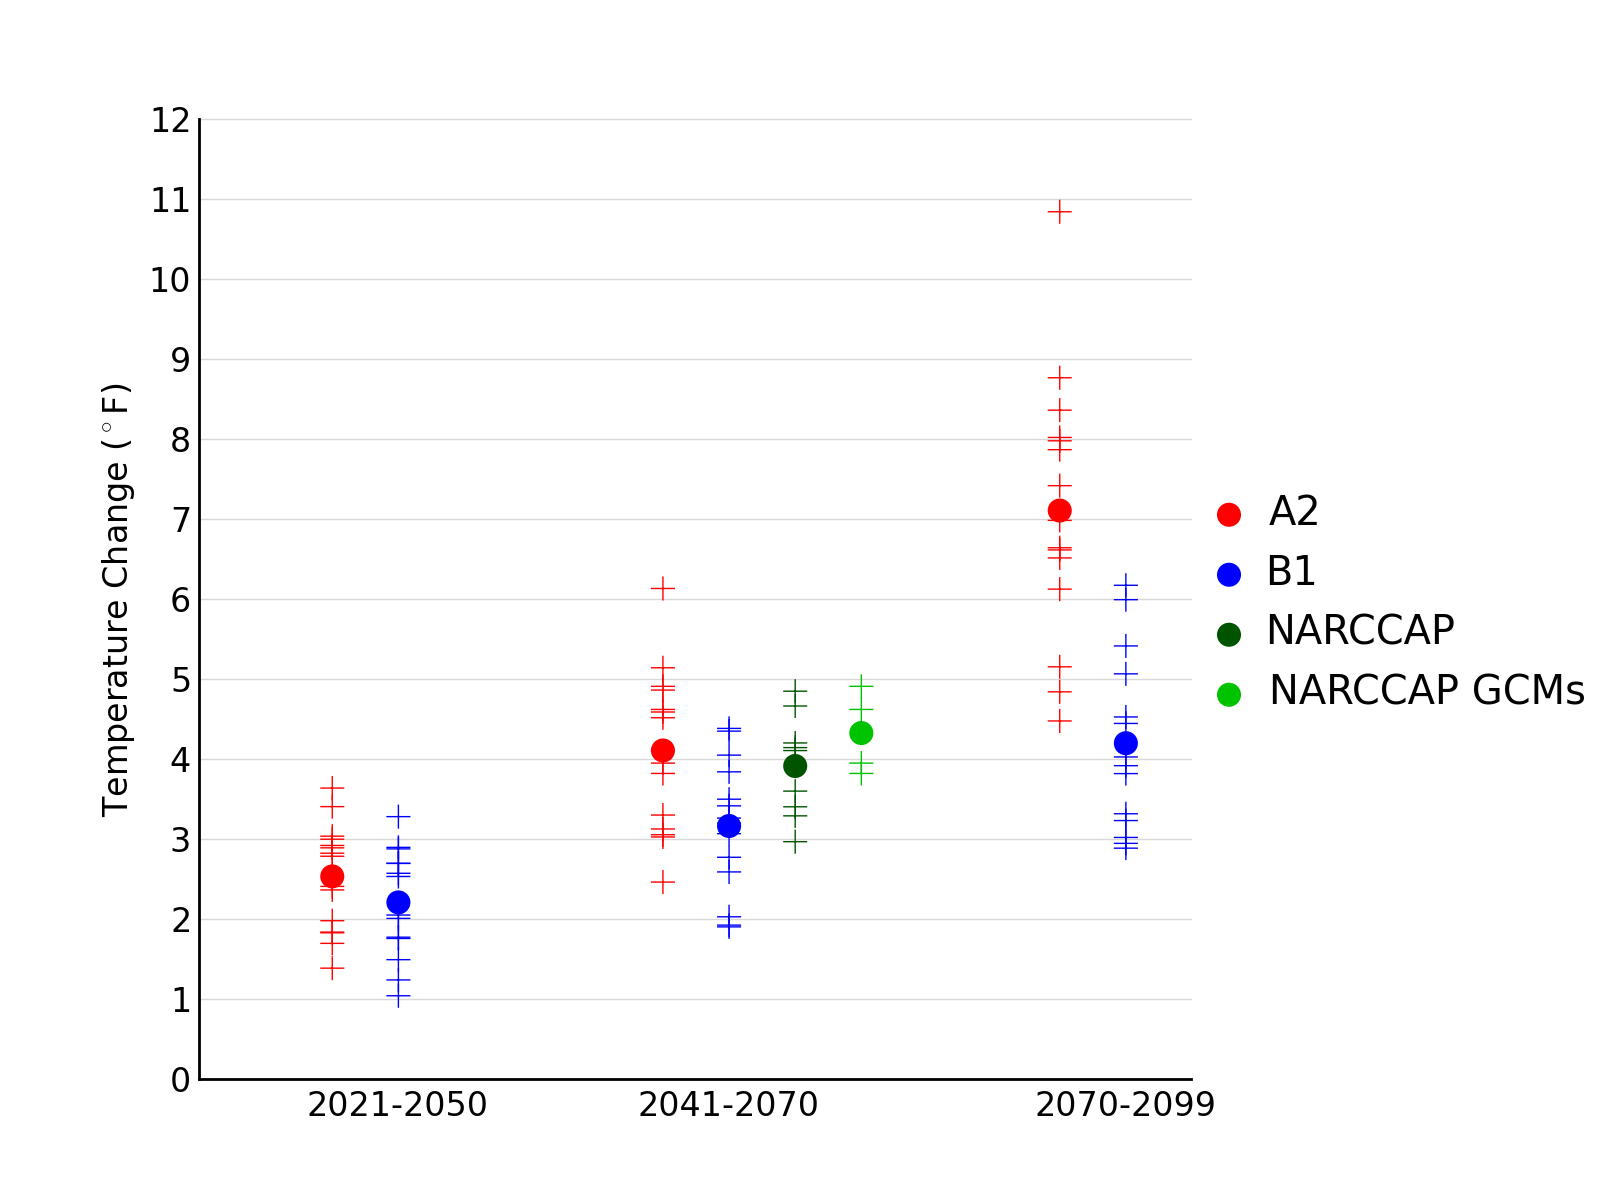
Simulated annual mean temperature change |
Simulated |
Temperature |
Southwest |
Regional Climate Trends and Scenarios for the U.S. National Climate Assessment. Part 5. Climate of the Southwest U.S. |
NCA 3 |
 |
|
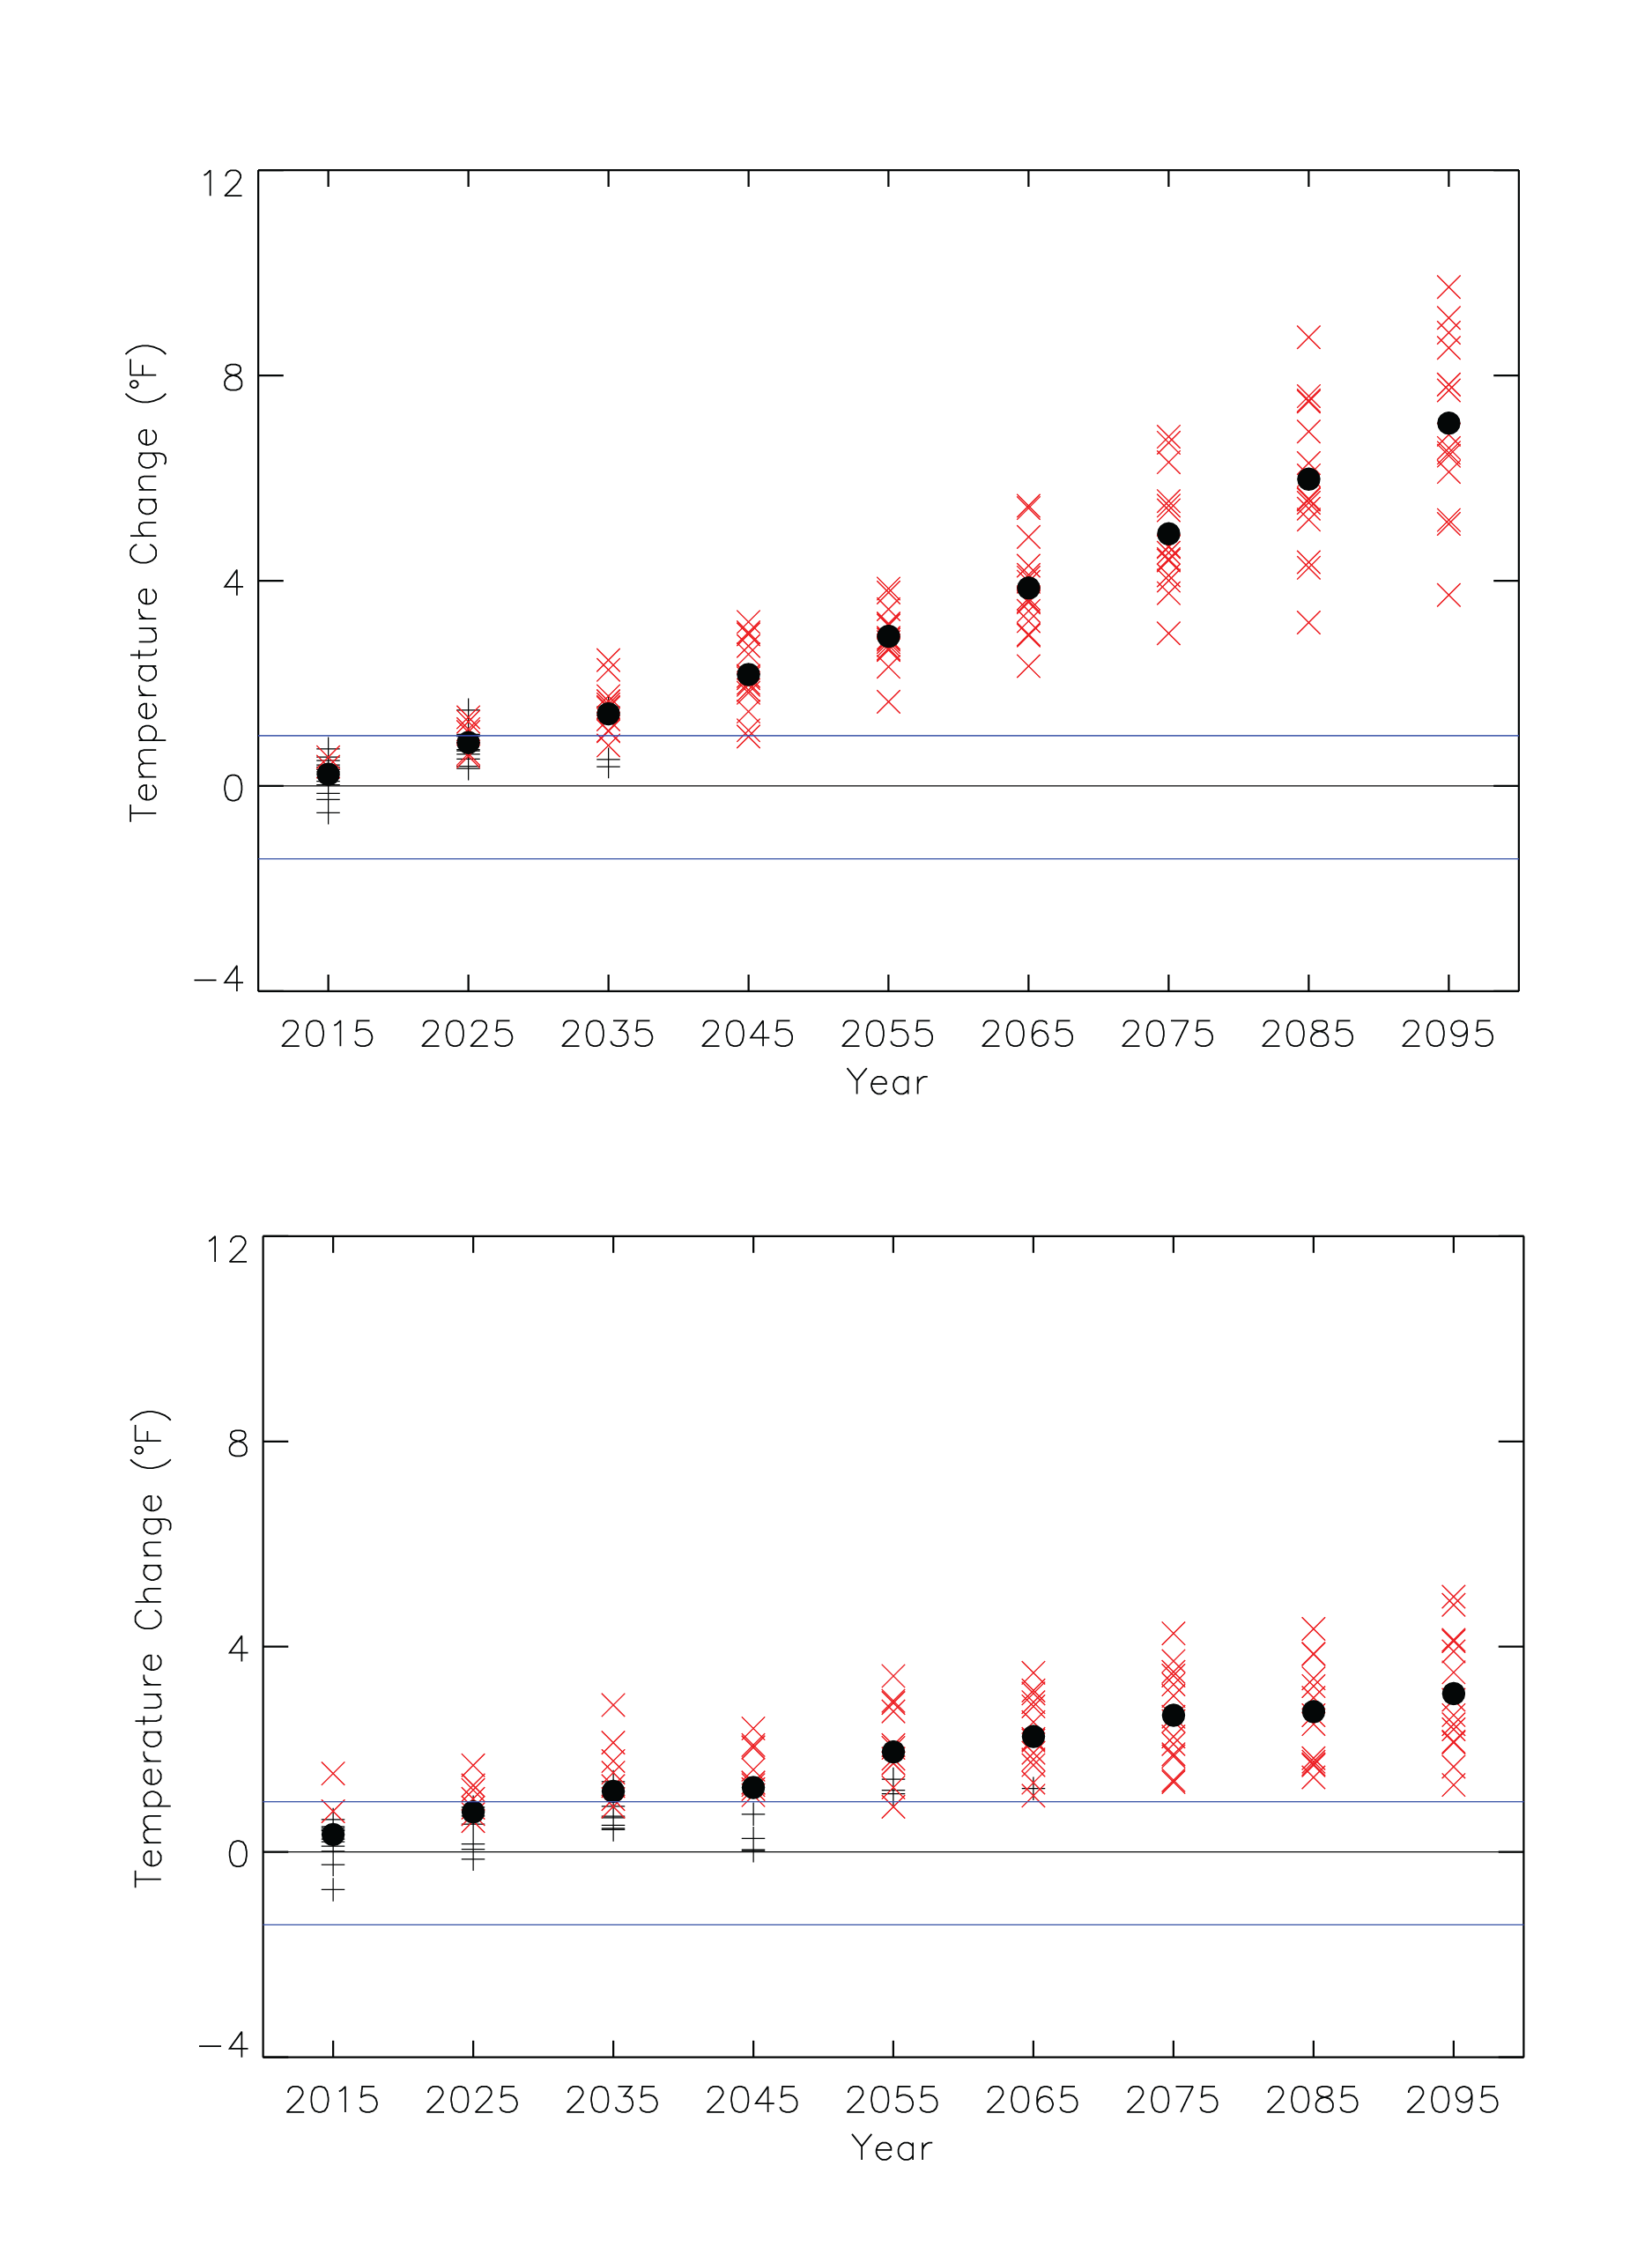
Simulated annual mean temperature change |
Simulated |
Temperature |
Northwest |
Regional Climate Trends and Scenarios for the U.S. National Climate Assessment. Part 6. Climate of the Northwest U.S. |
NCA 3 |
 |
|
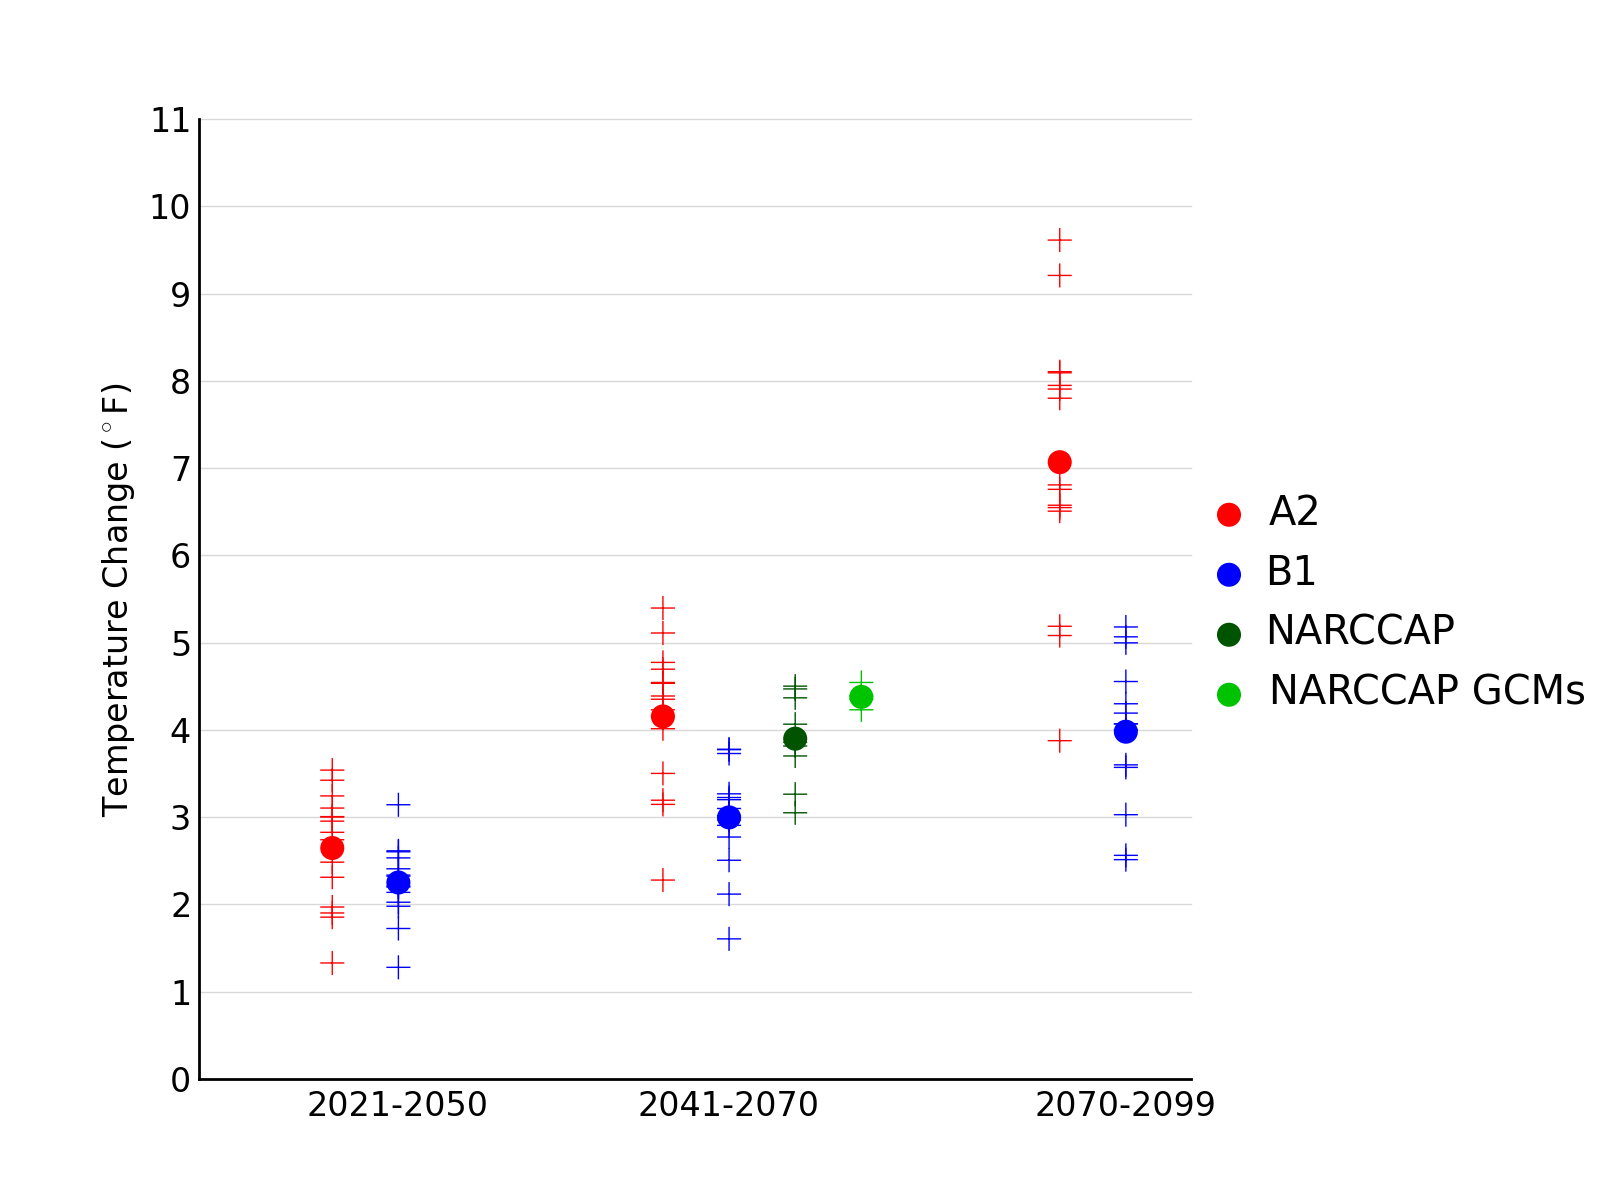
Simulated annual mean temperature change |
Simulated |
Temperature |
Midwest |
Regional Climate Trends and Scenarios for the U.S. National Climate Assessment. Part 3. Climate of the Midwest U.S. |
NCA 3 |
 |
|
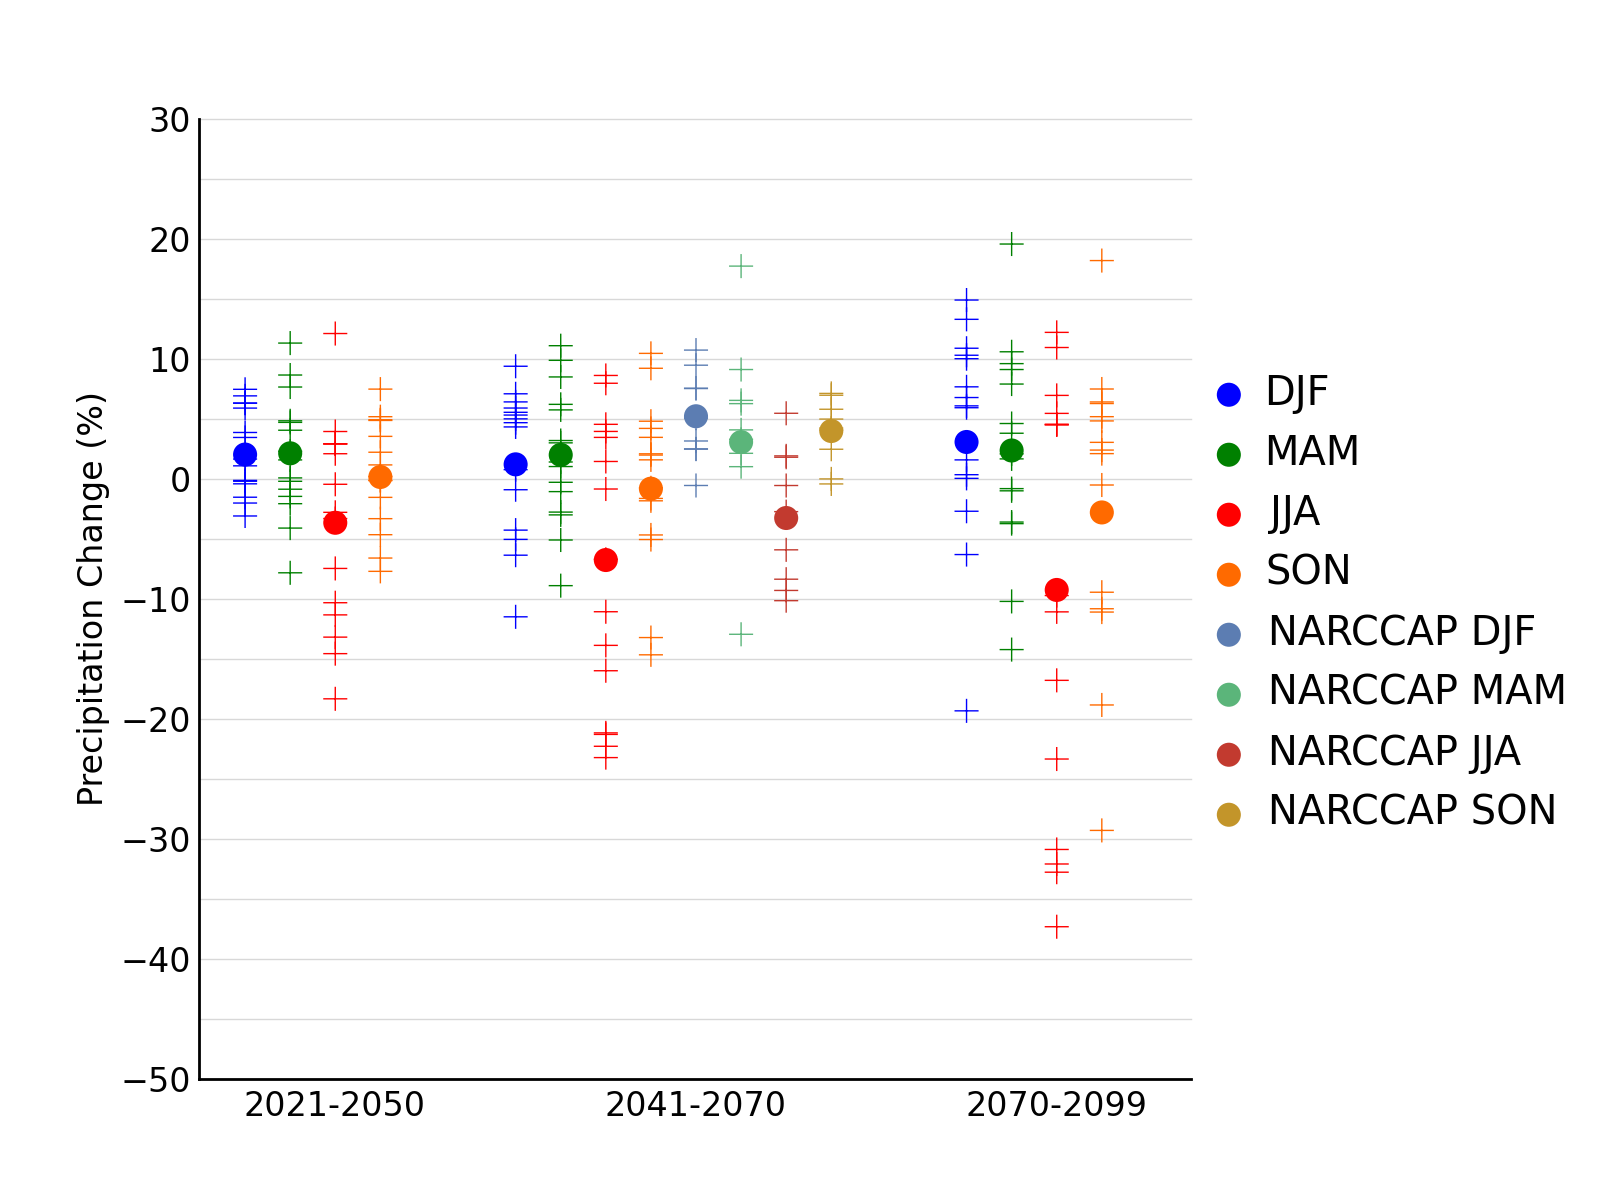
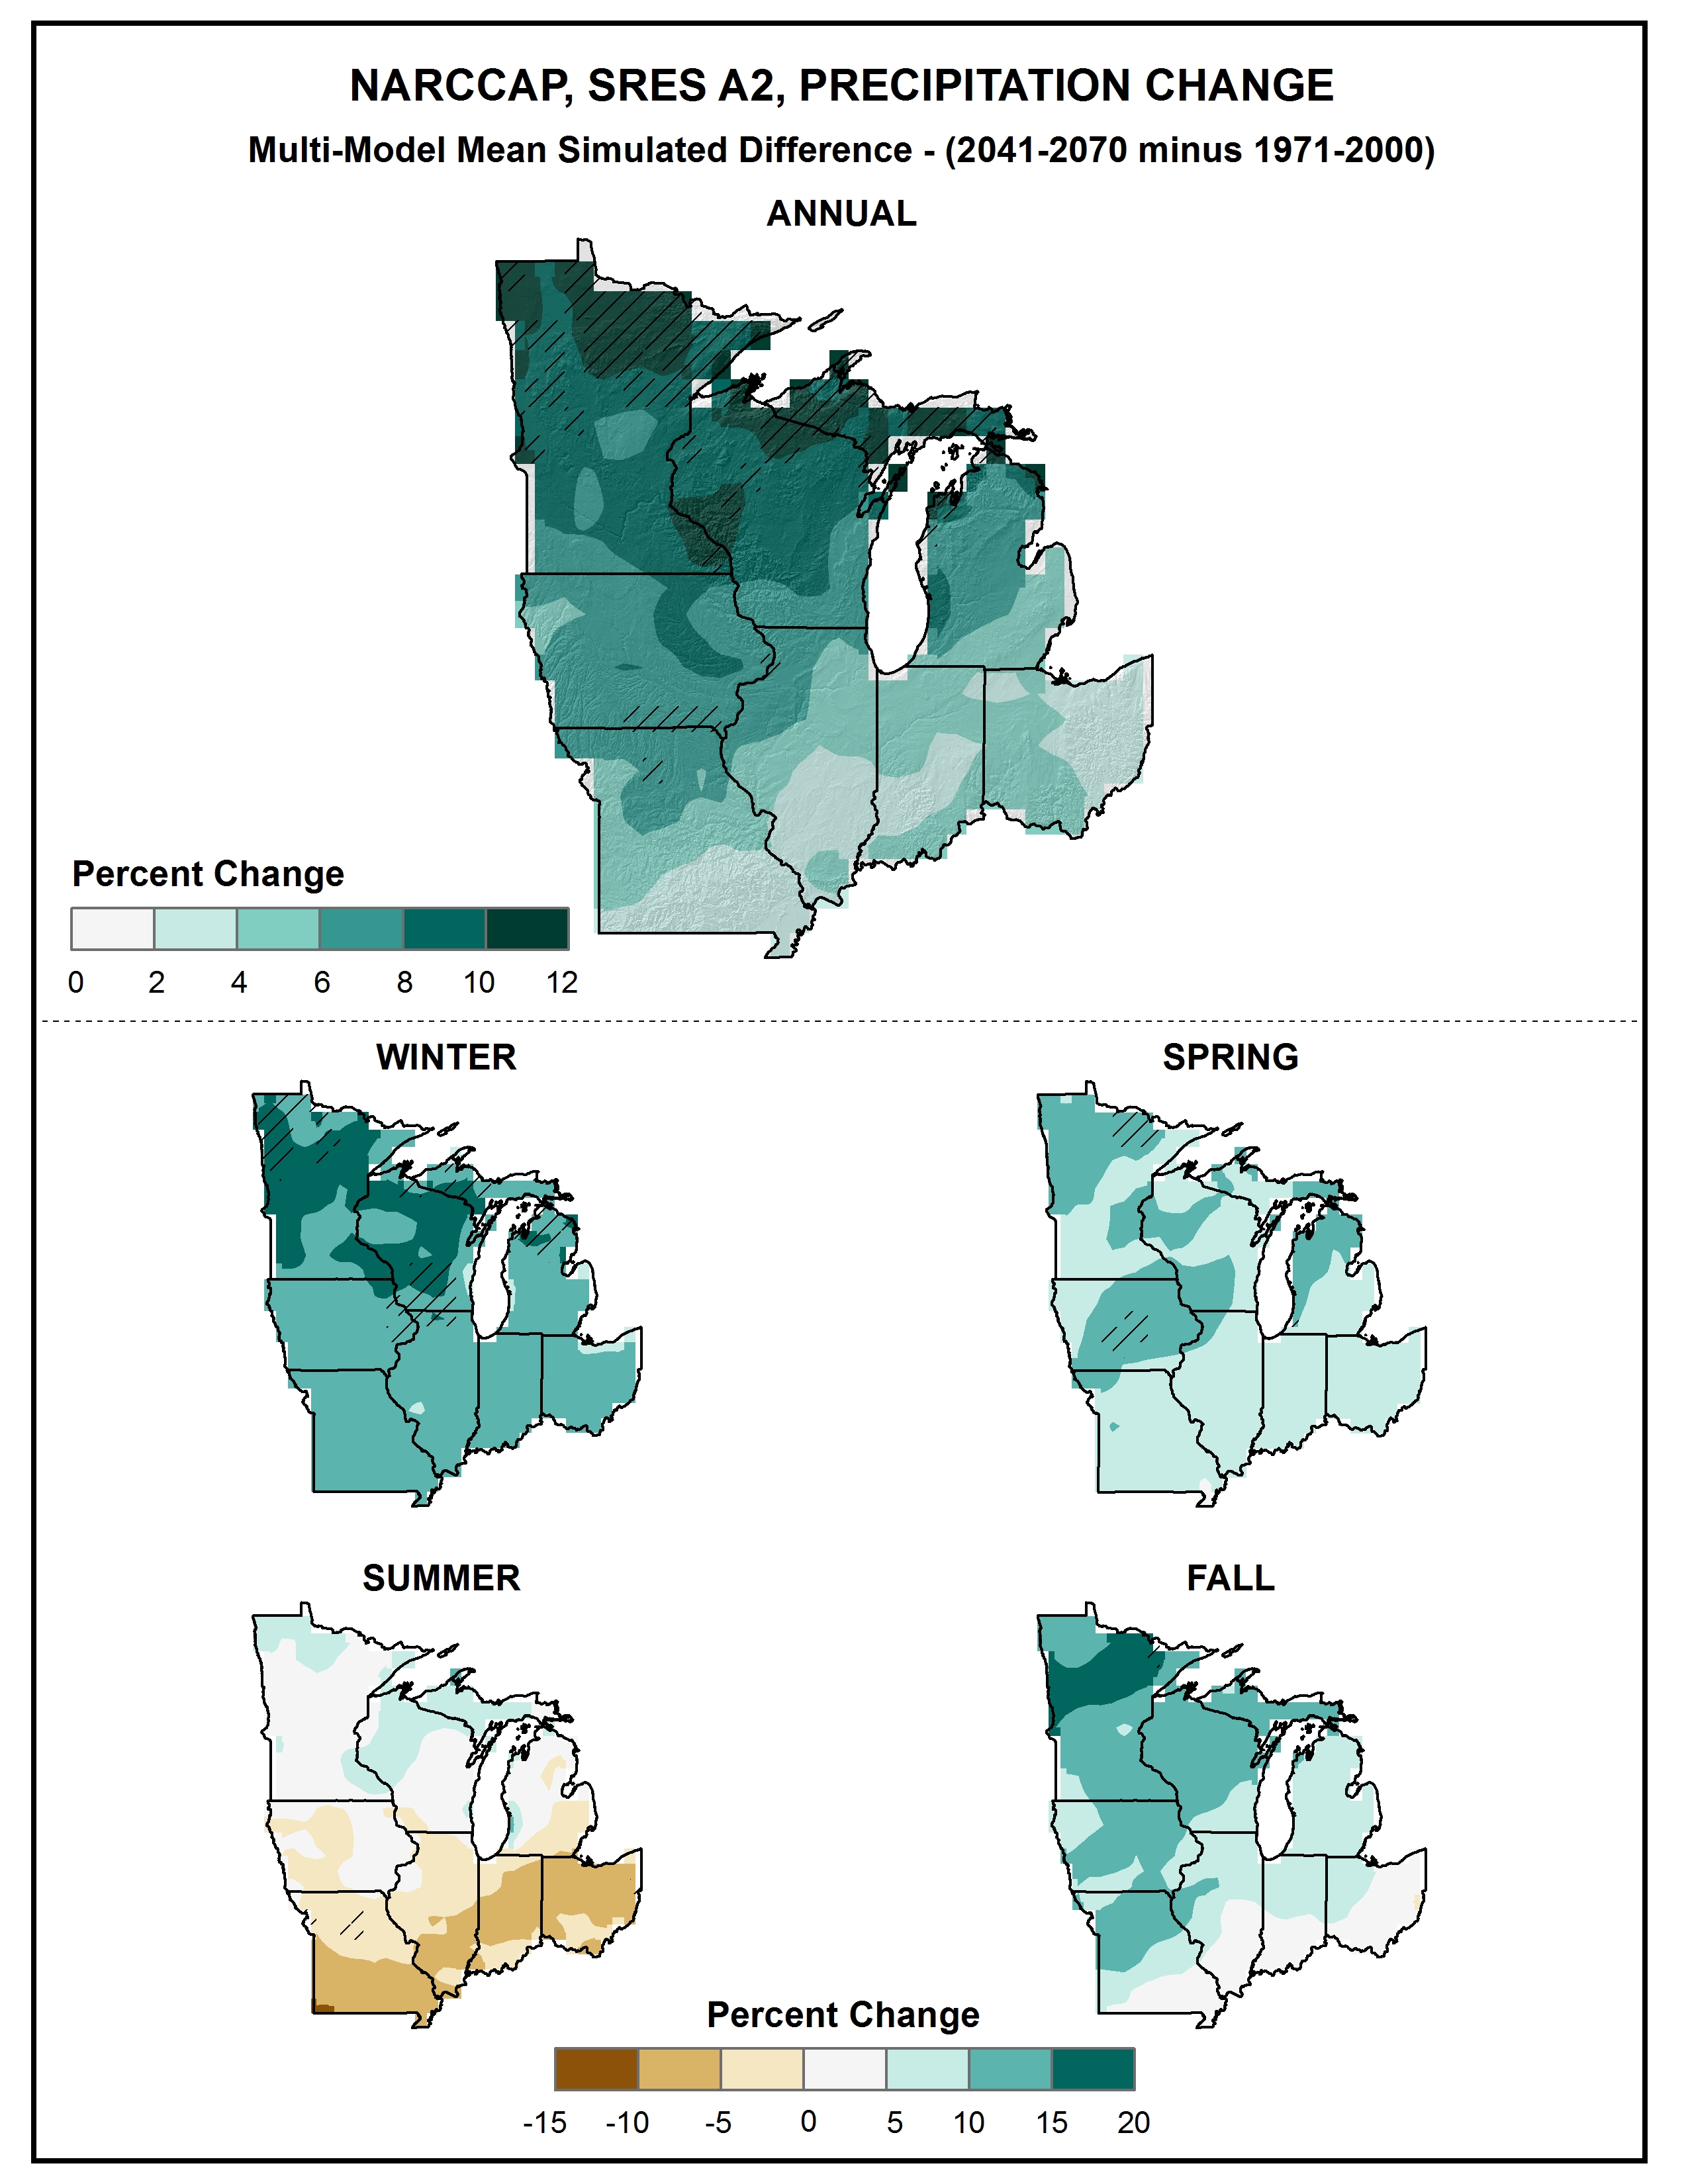
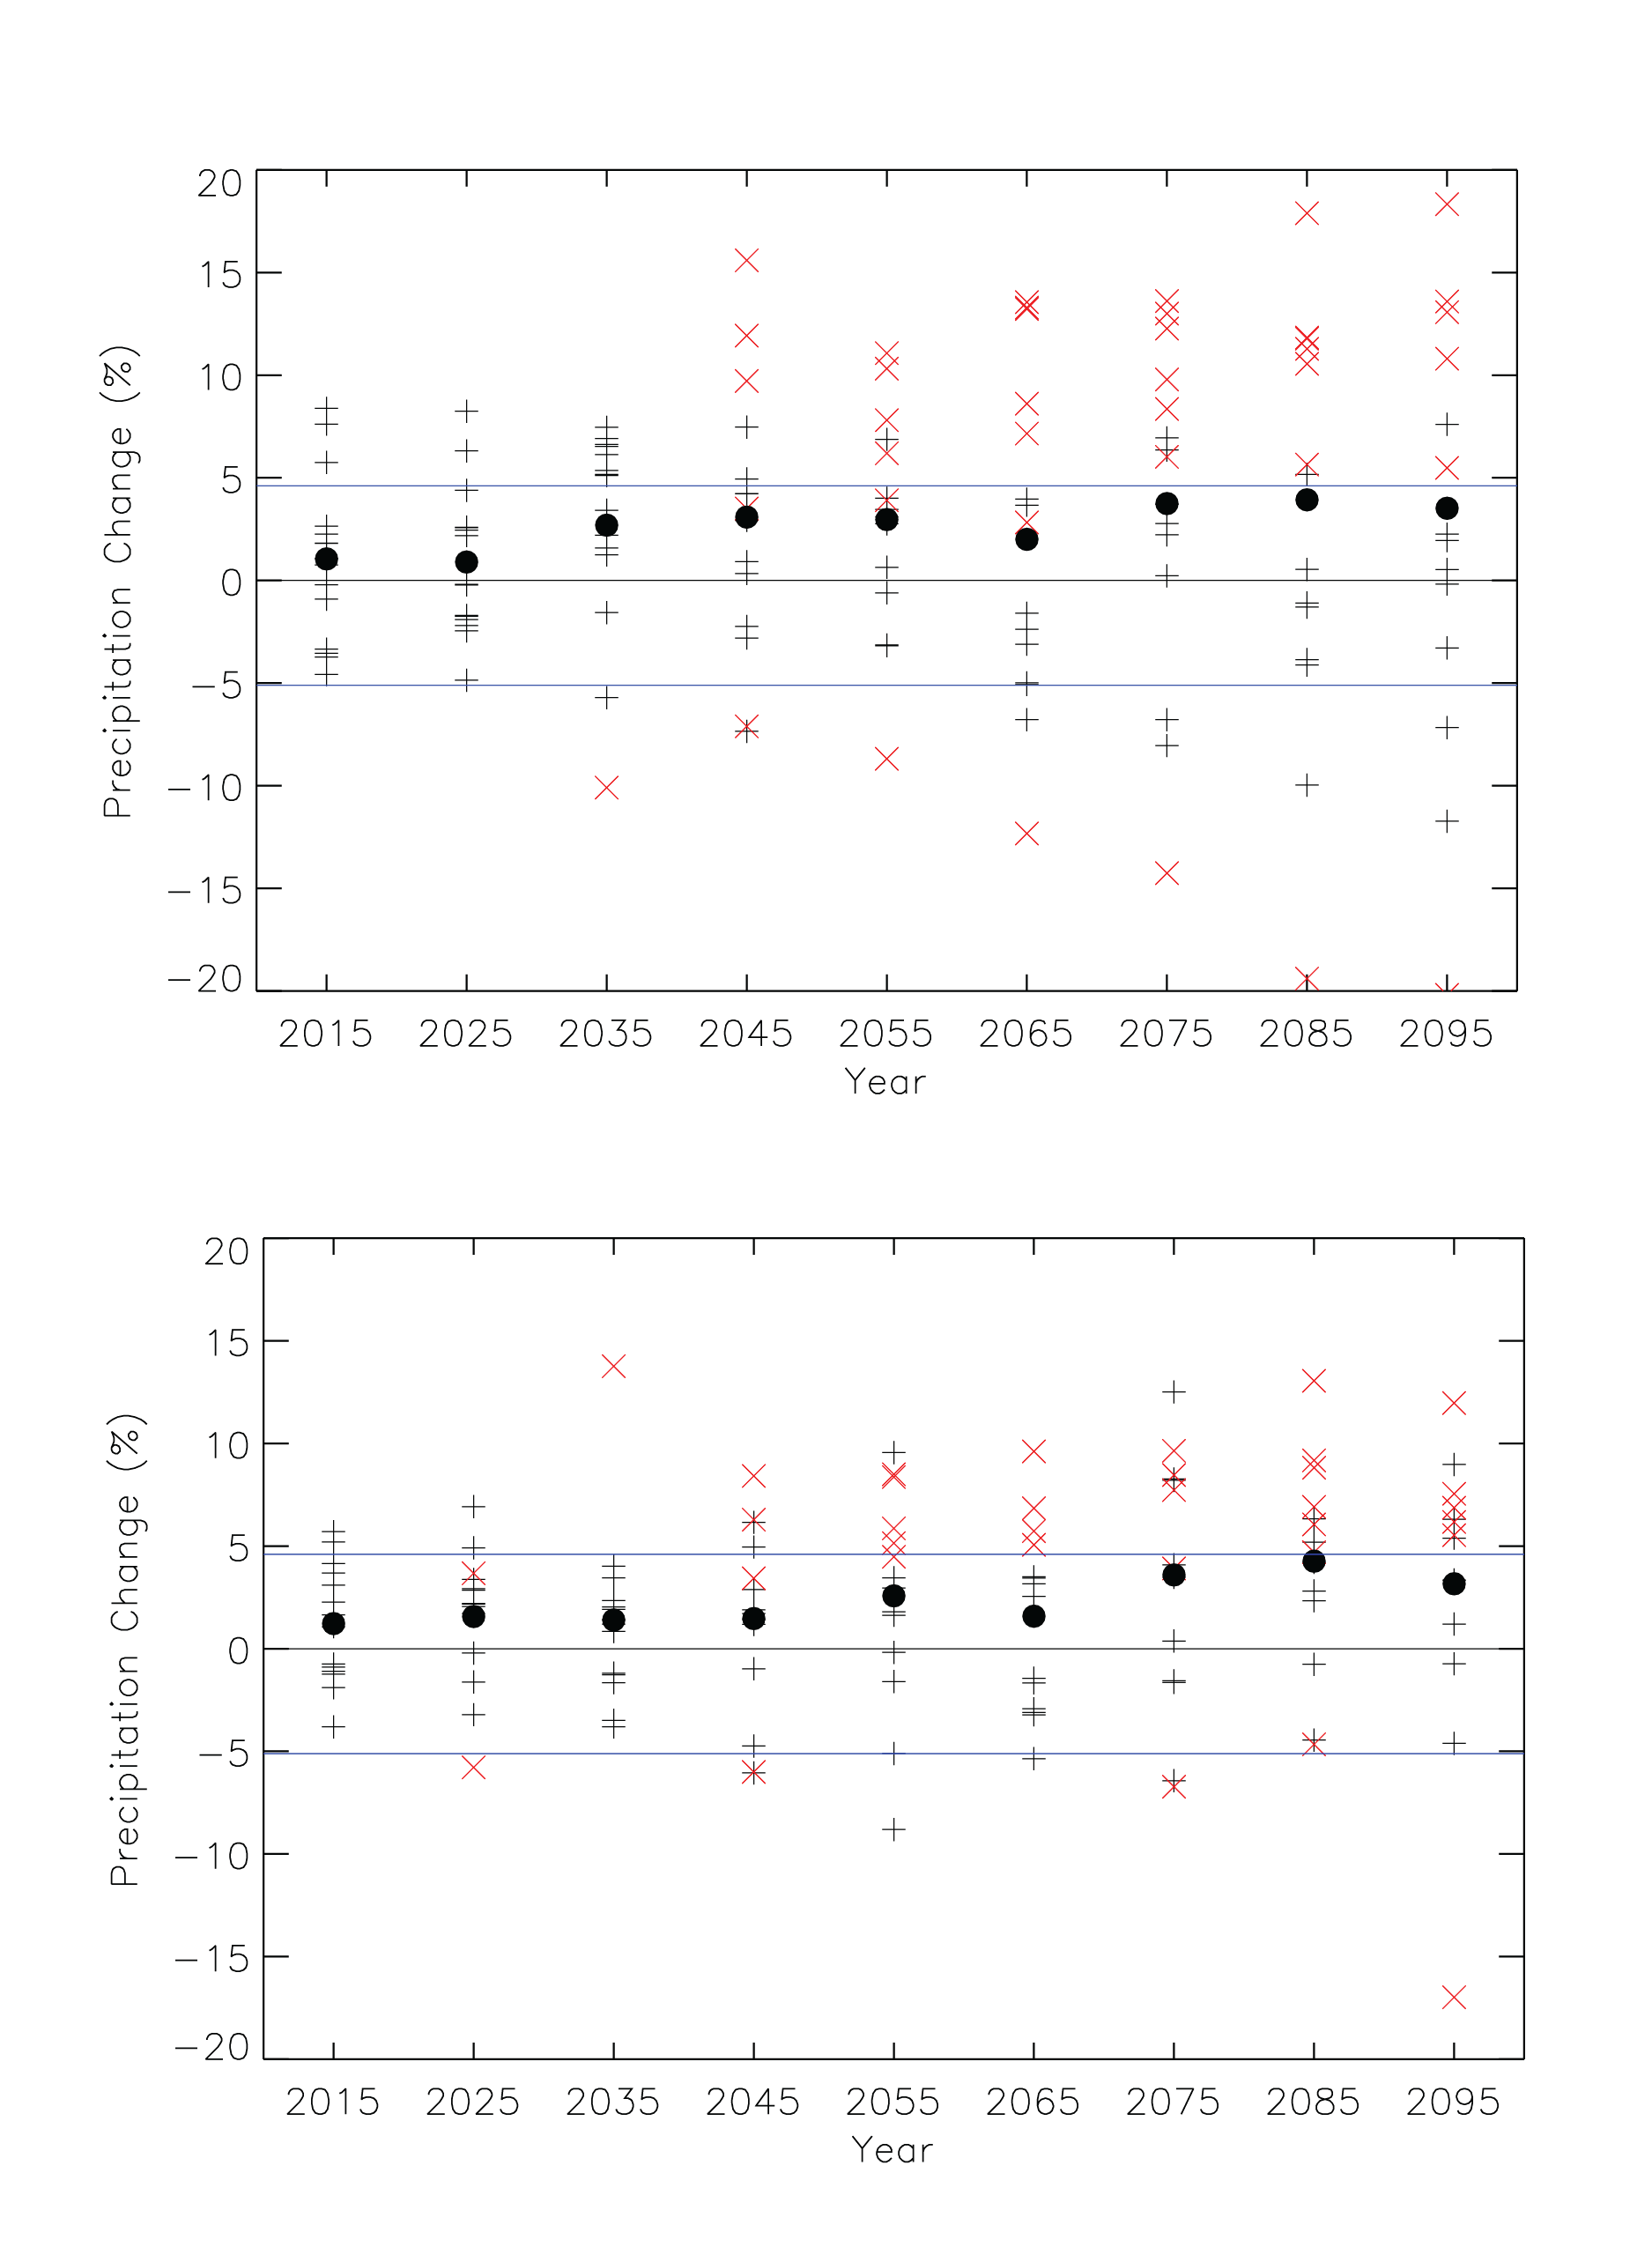
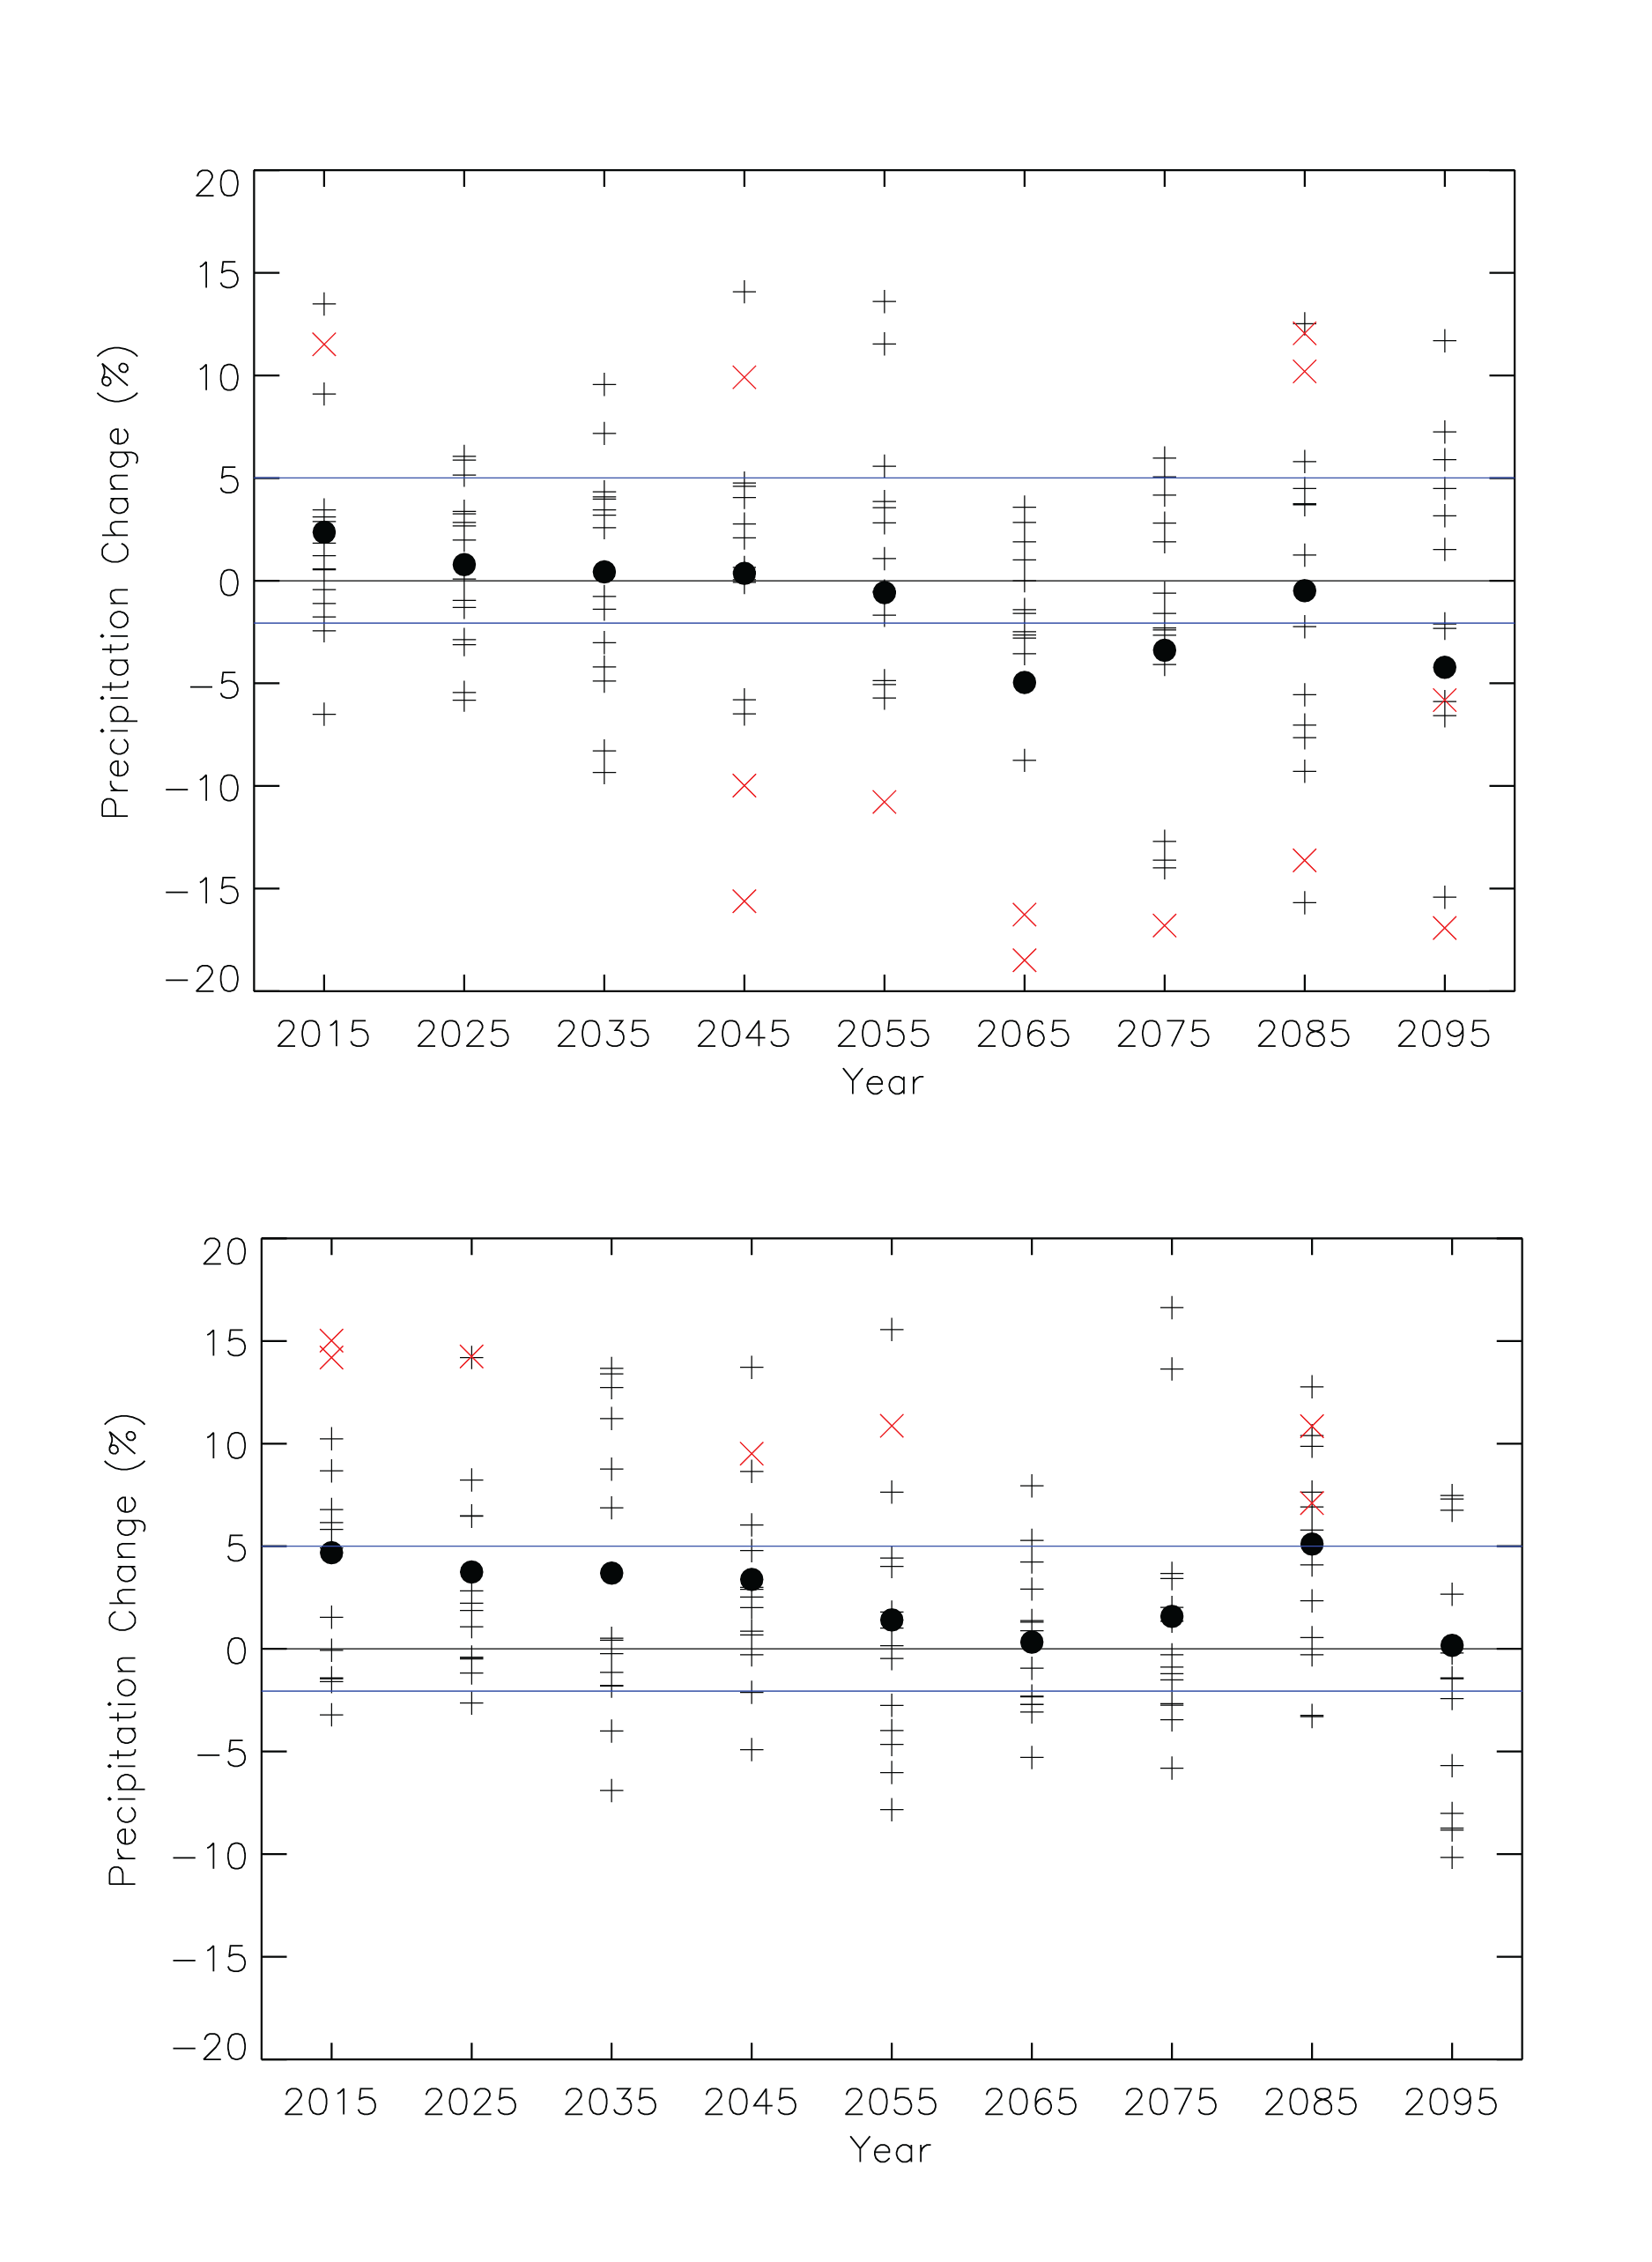
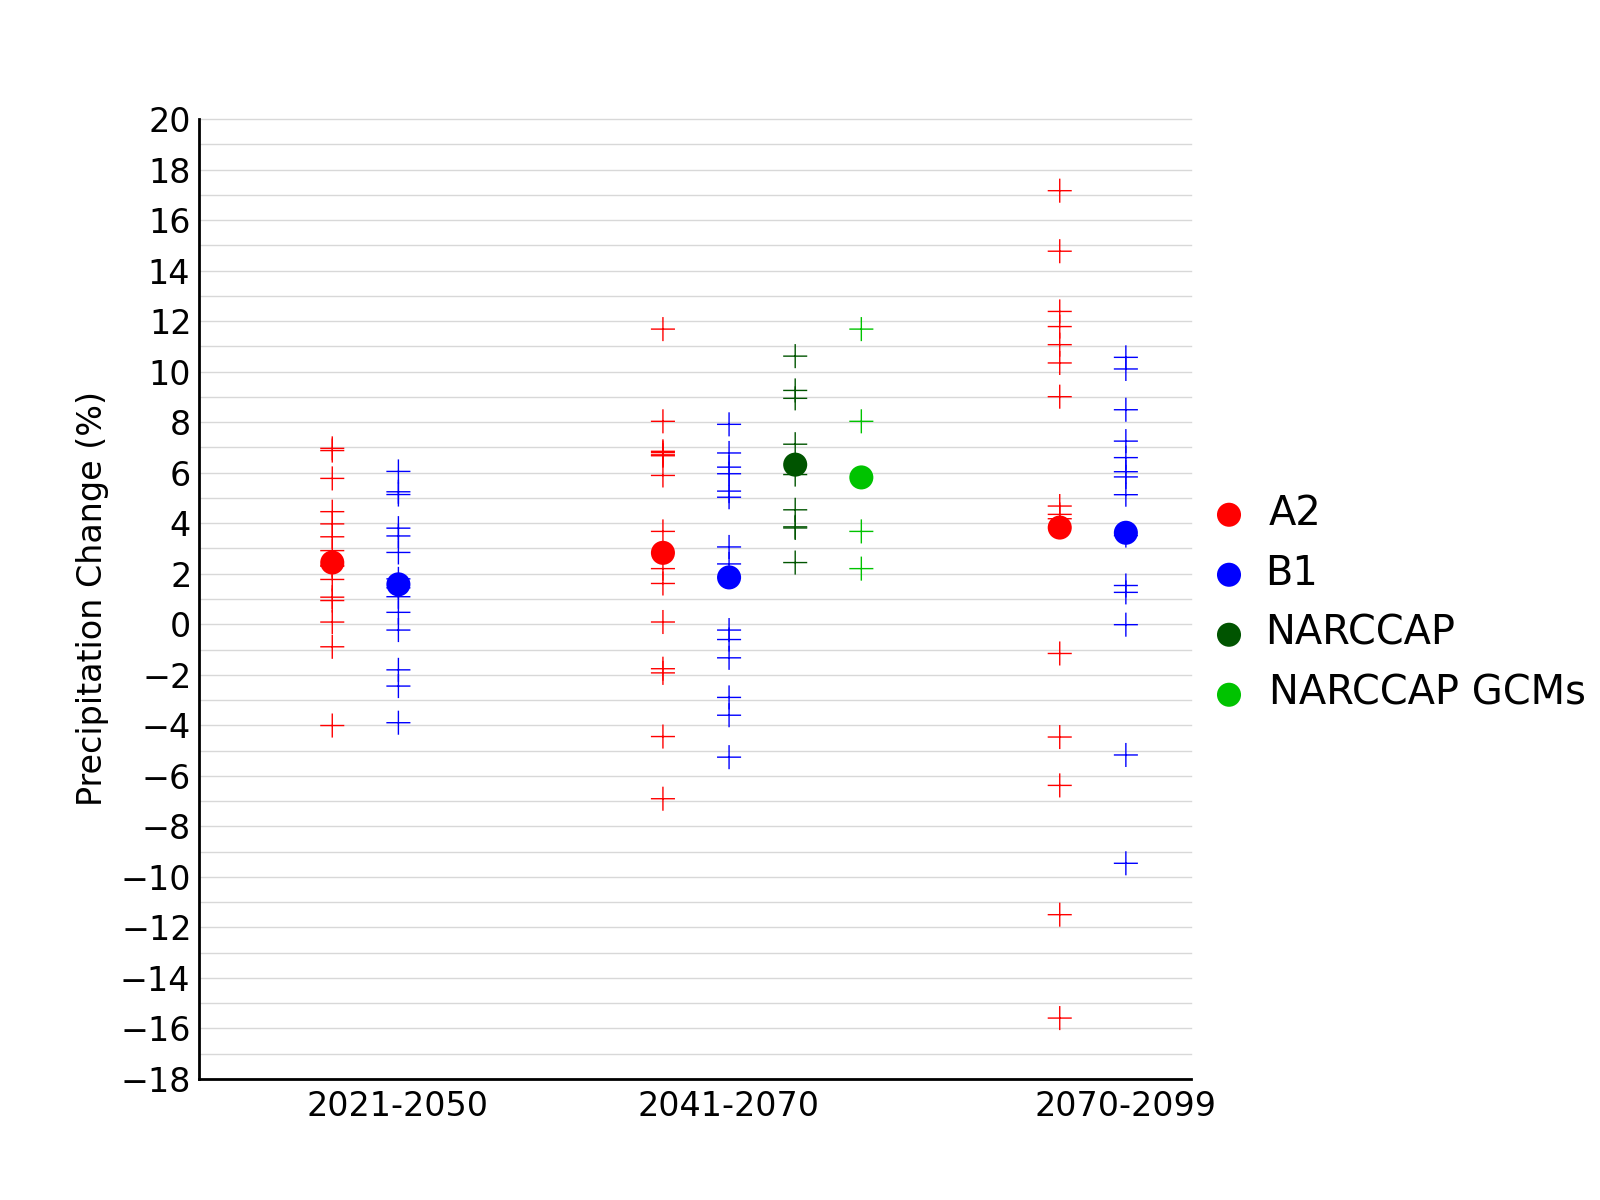
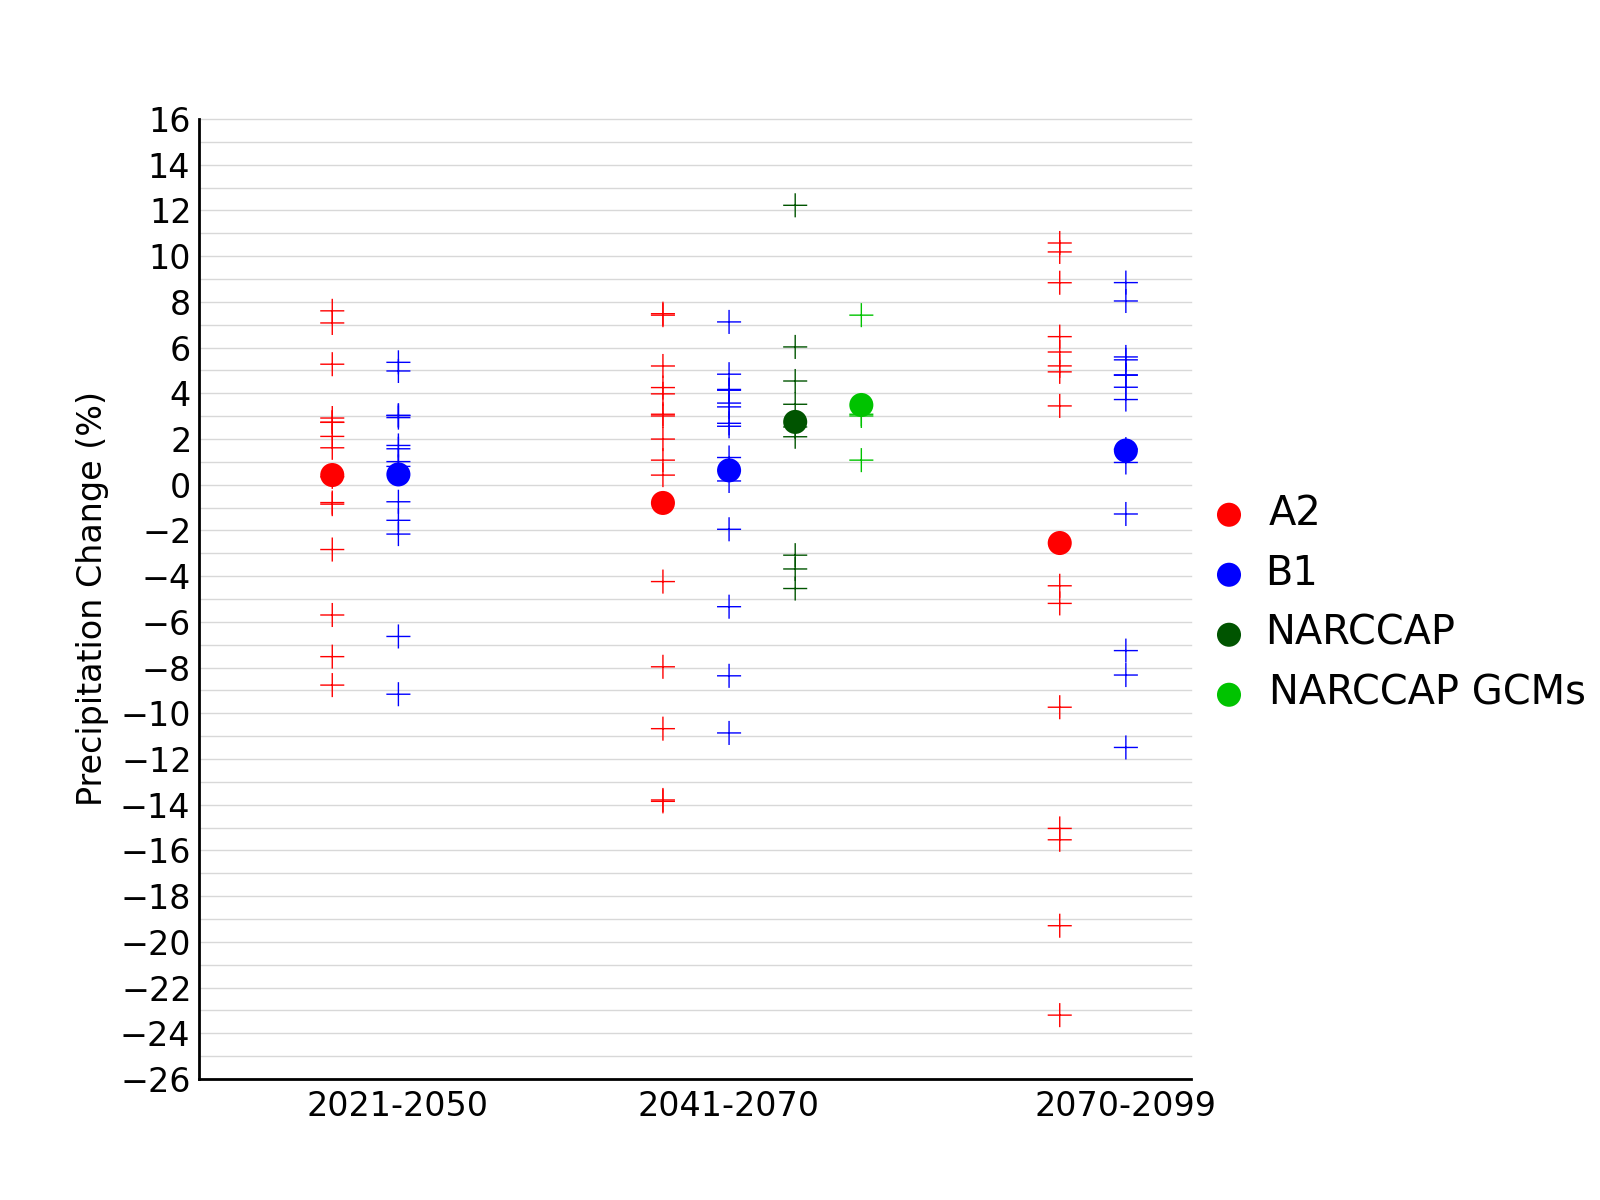
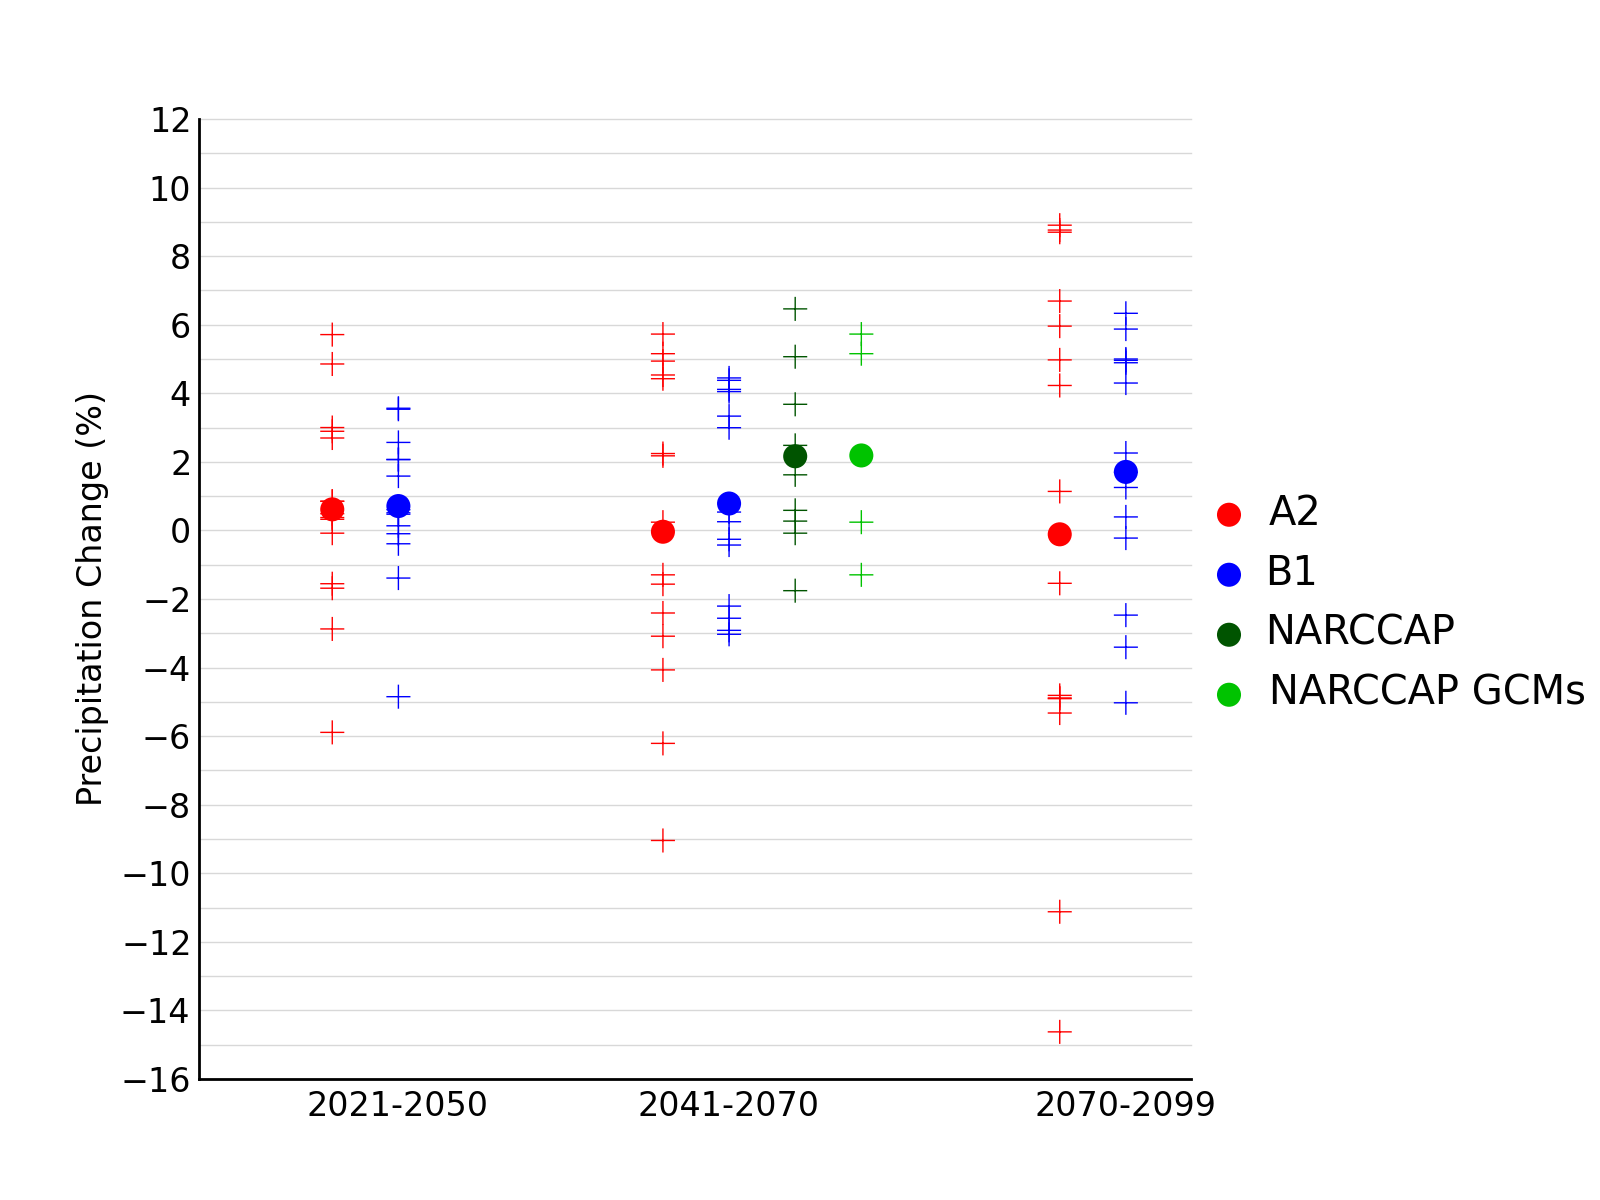
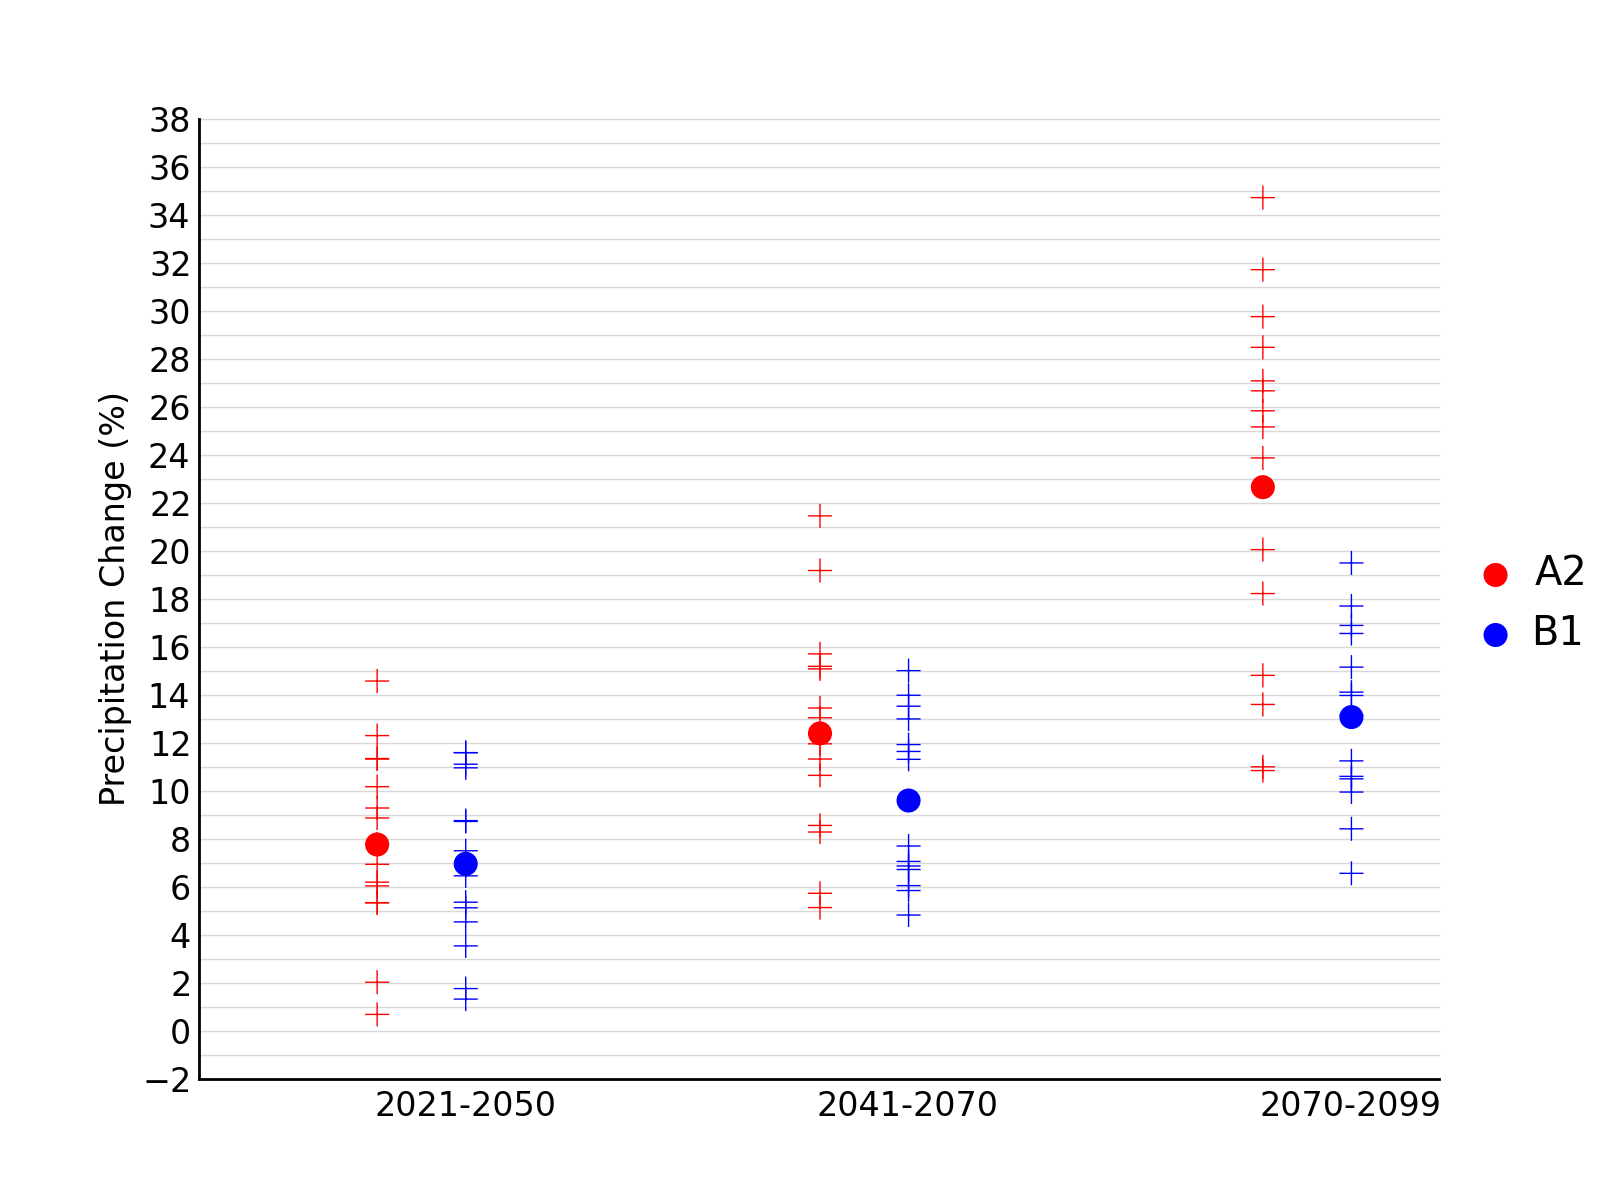
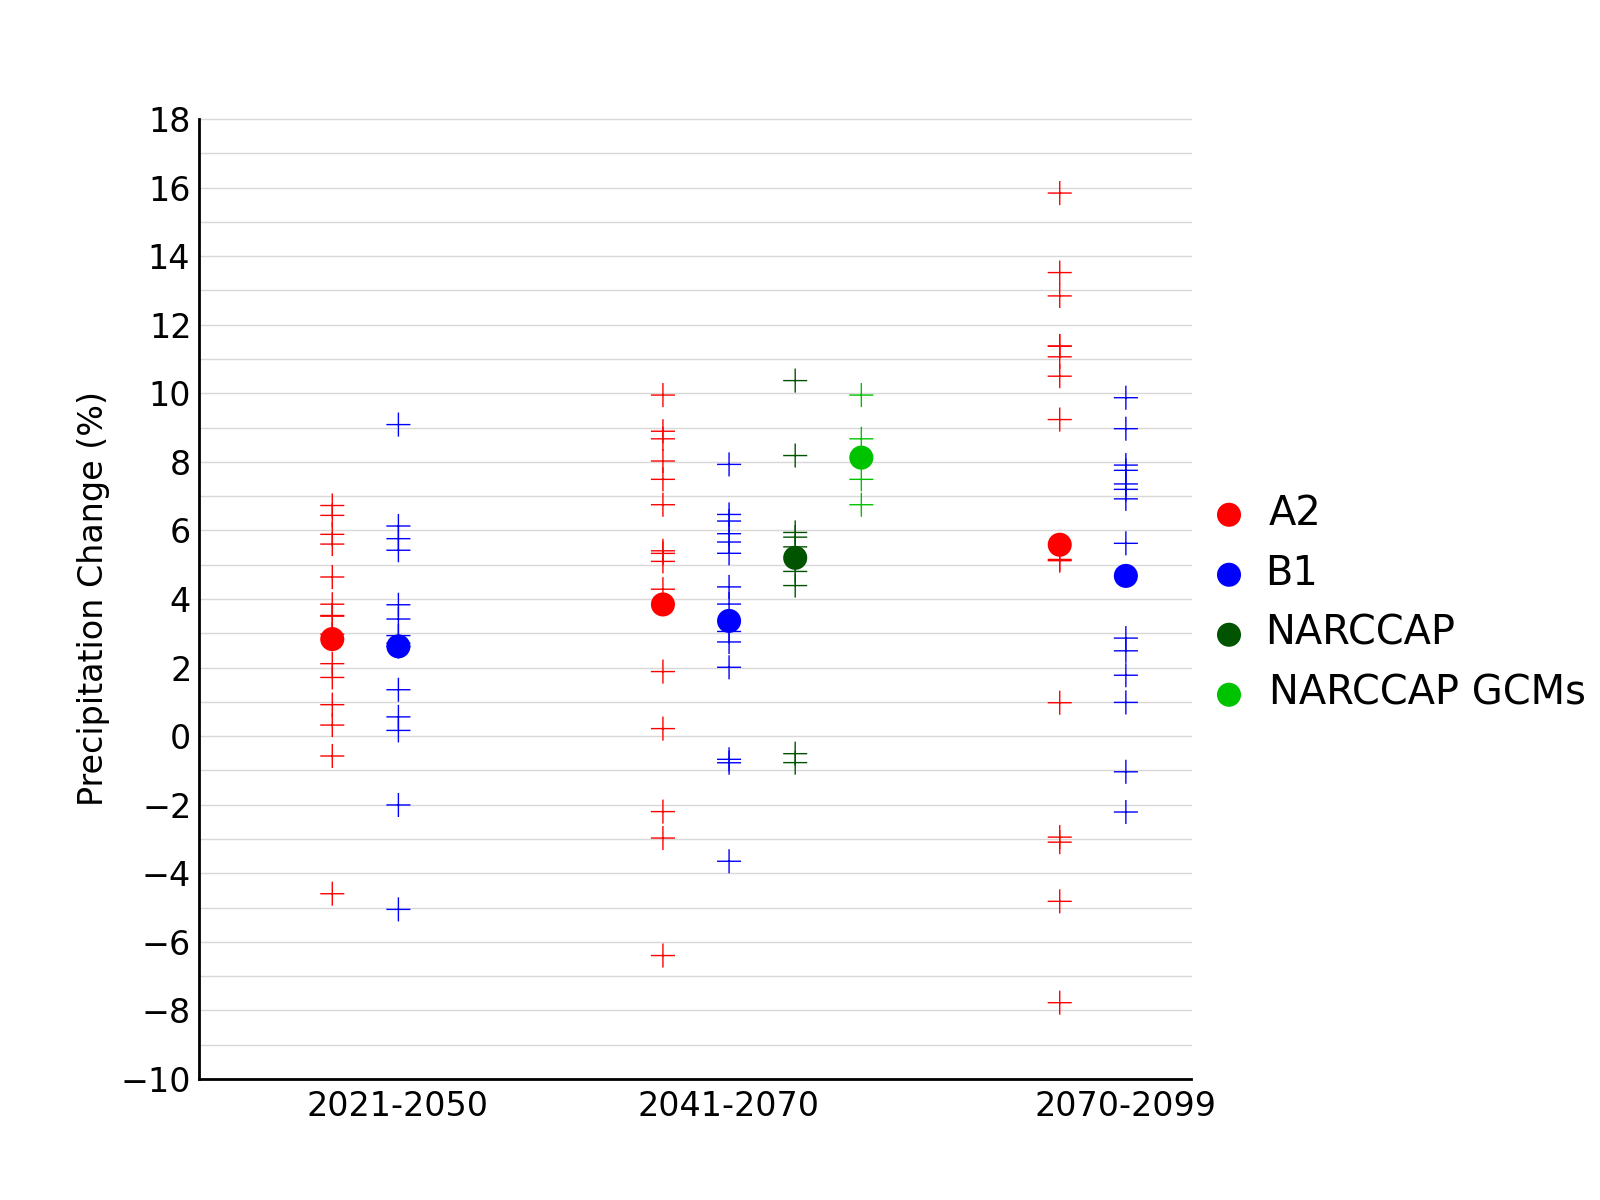
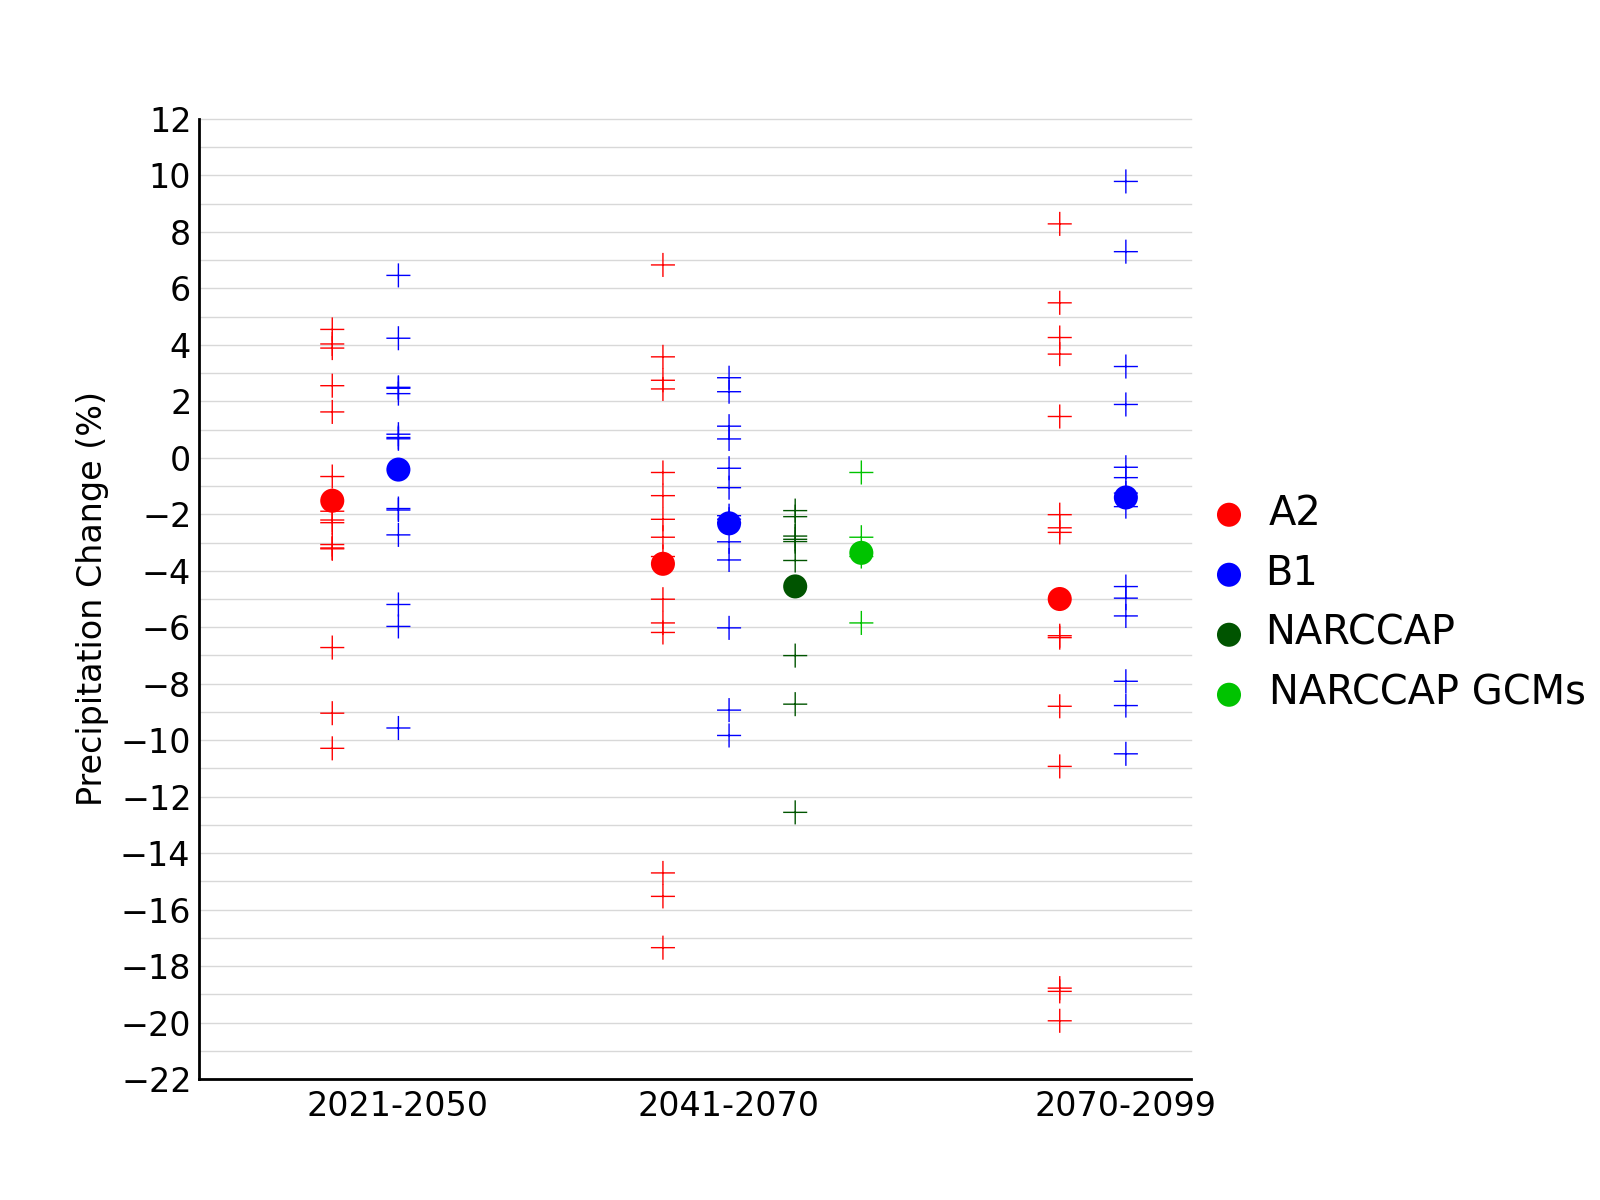
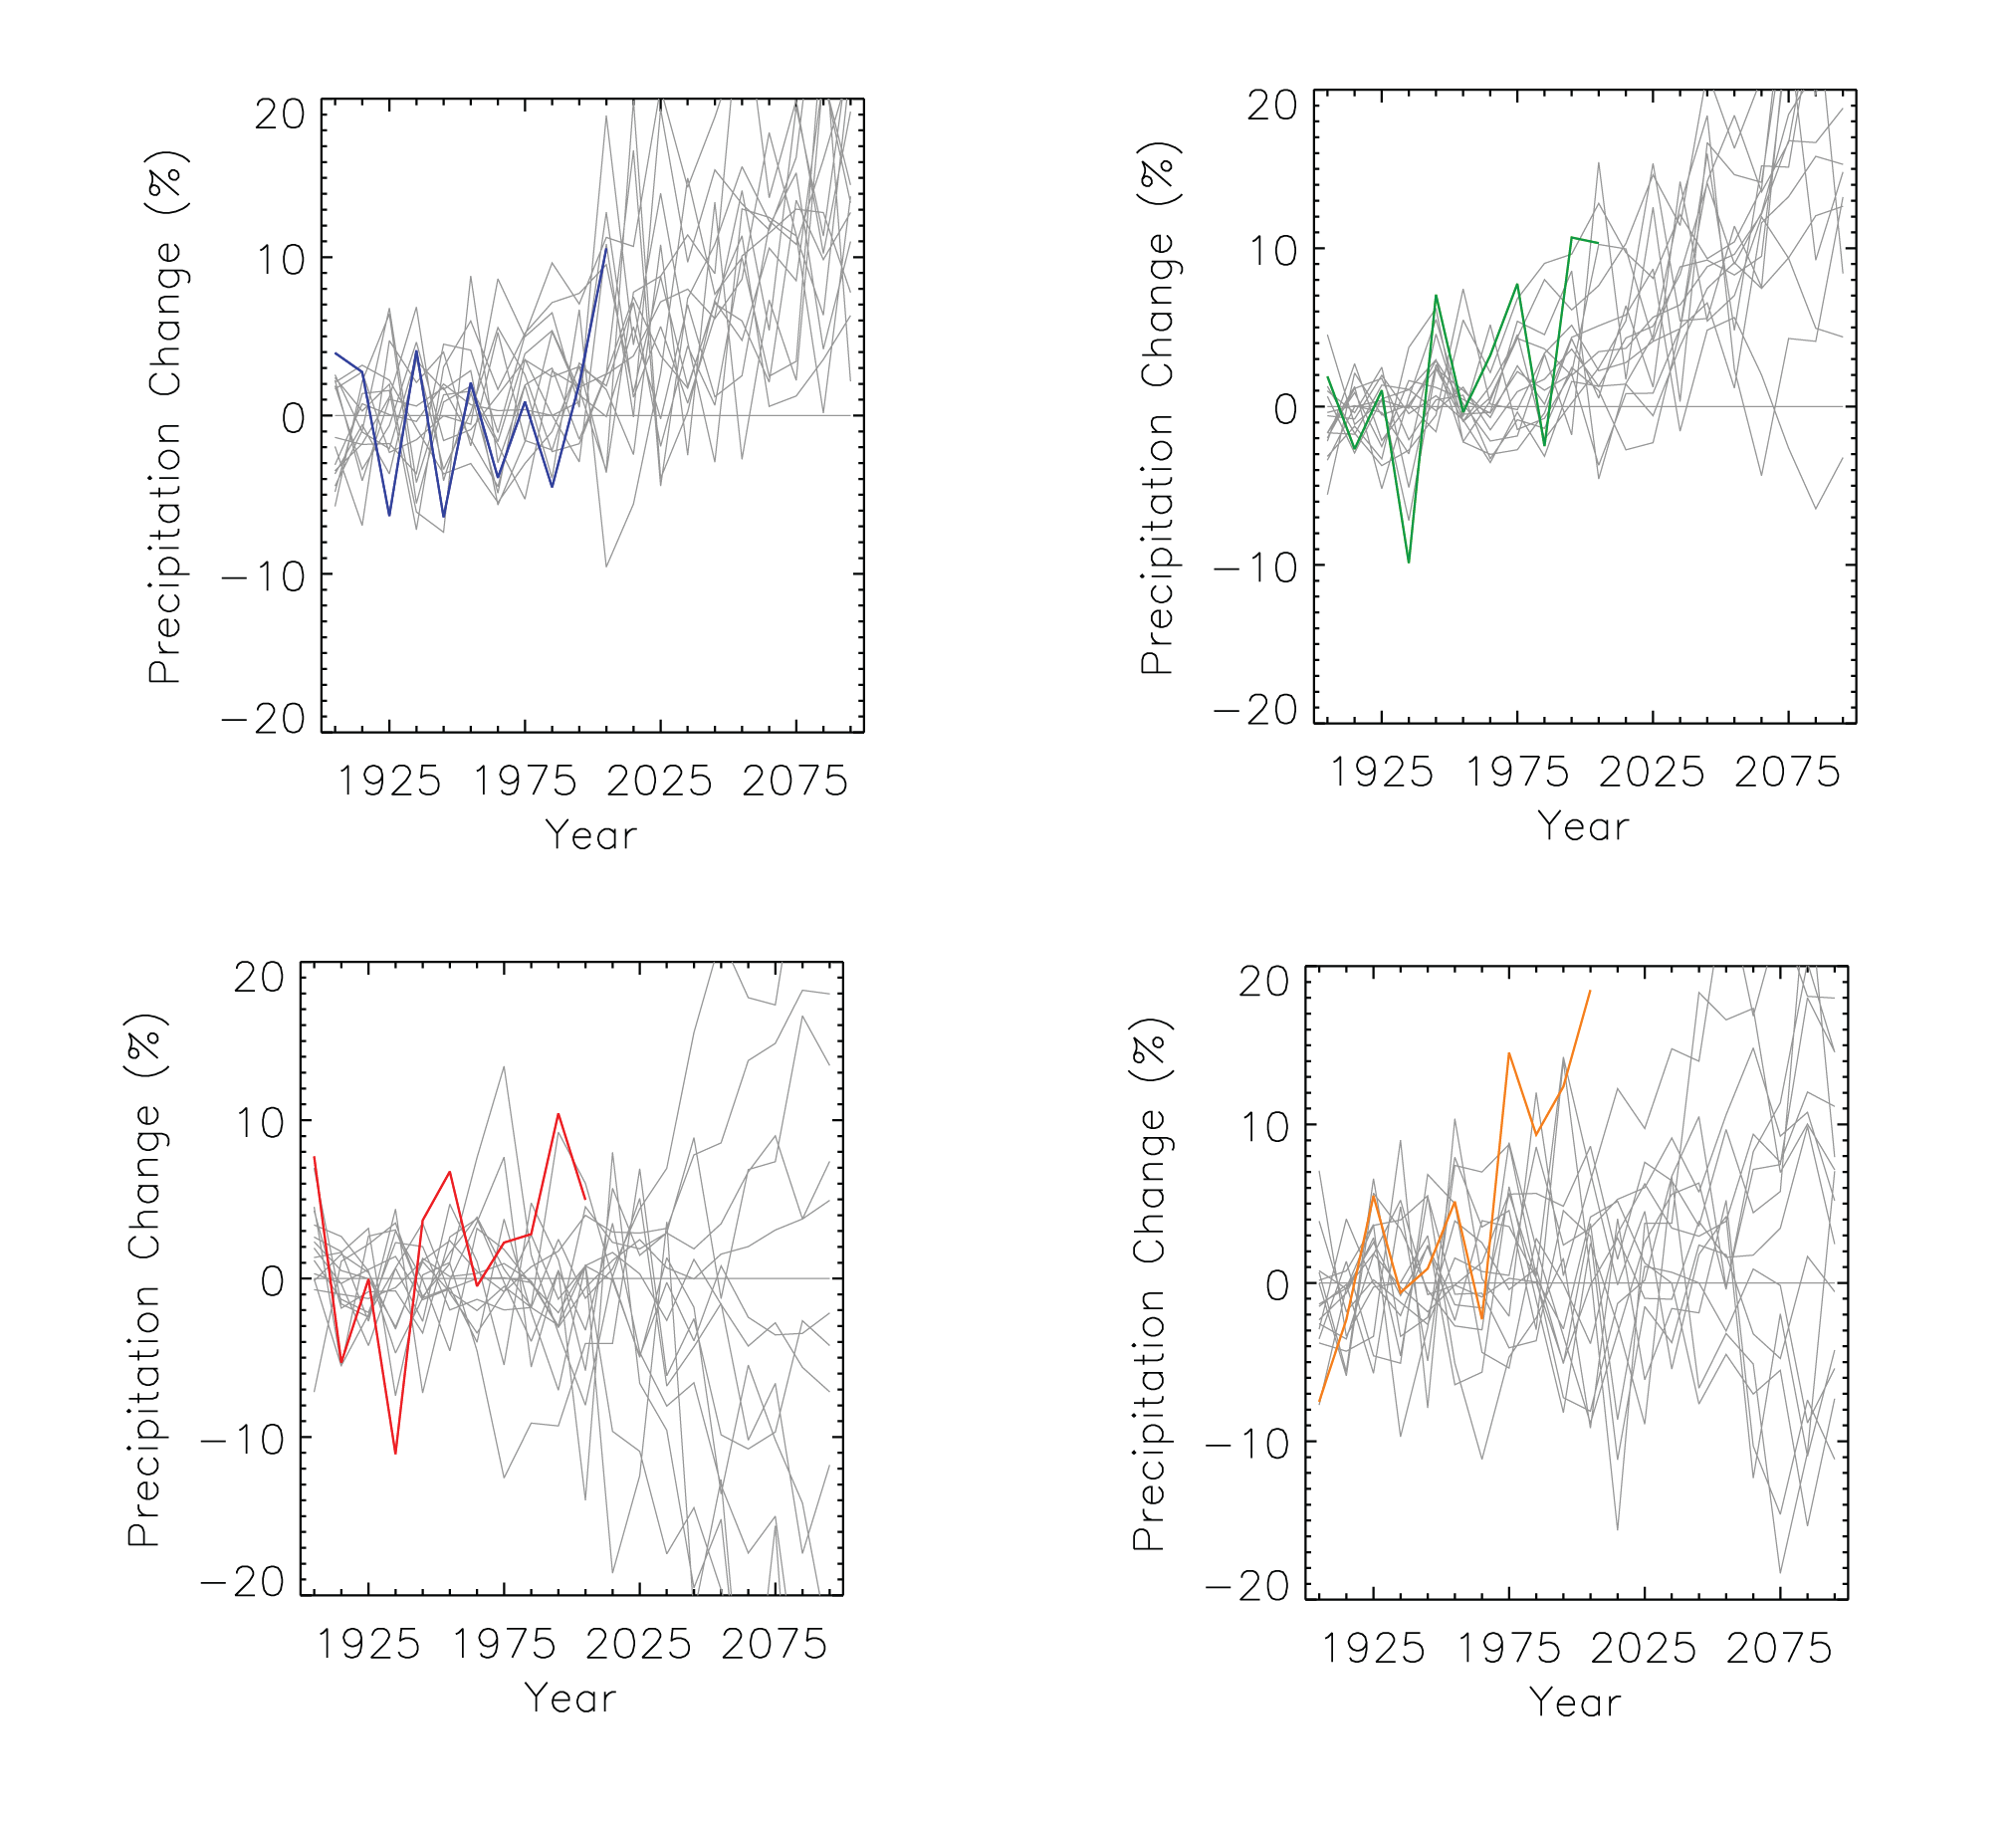
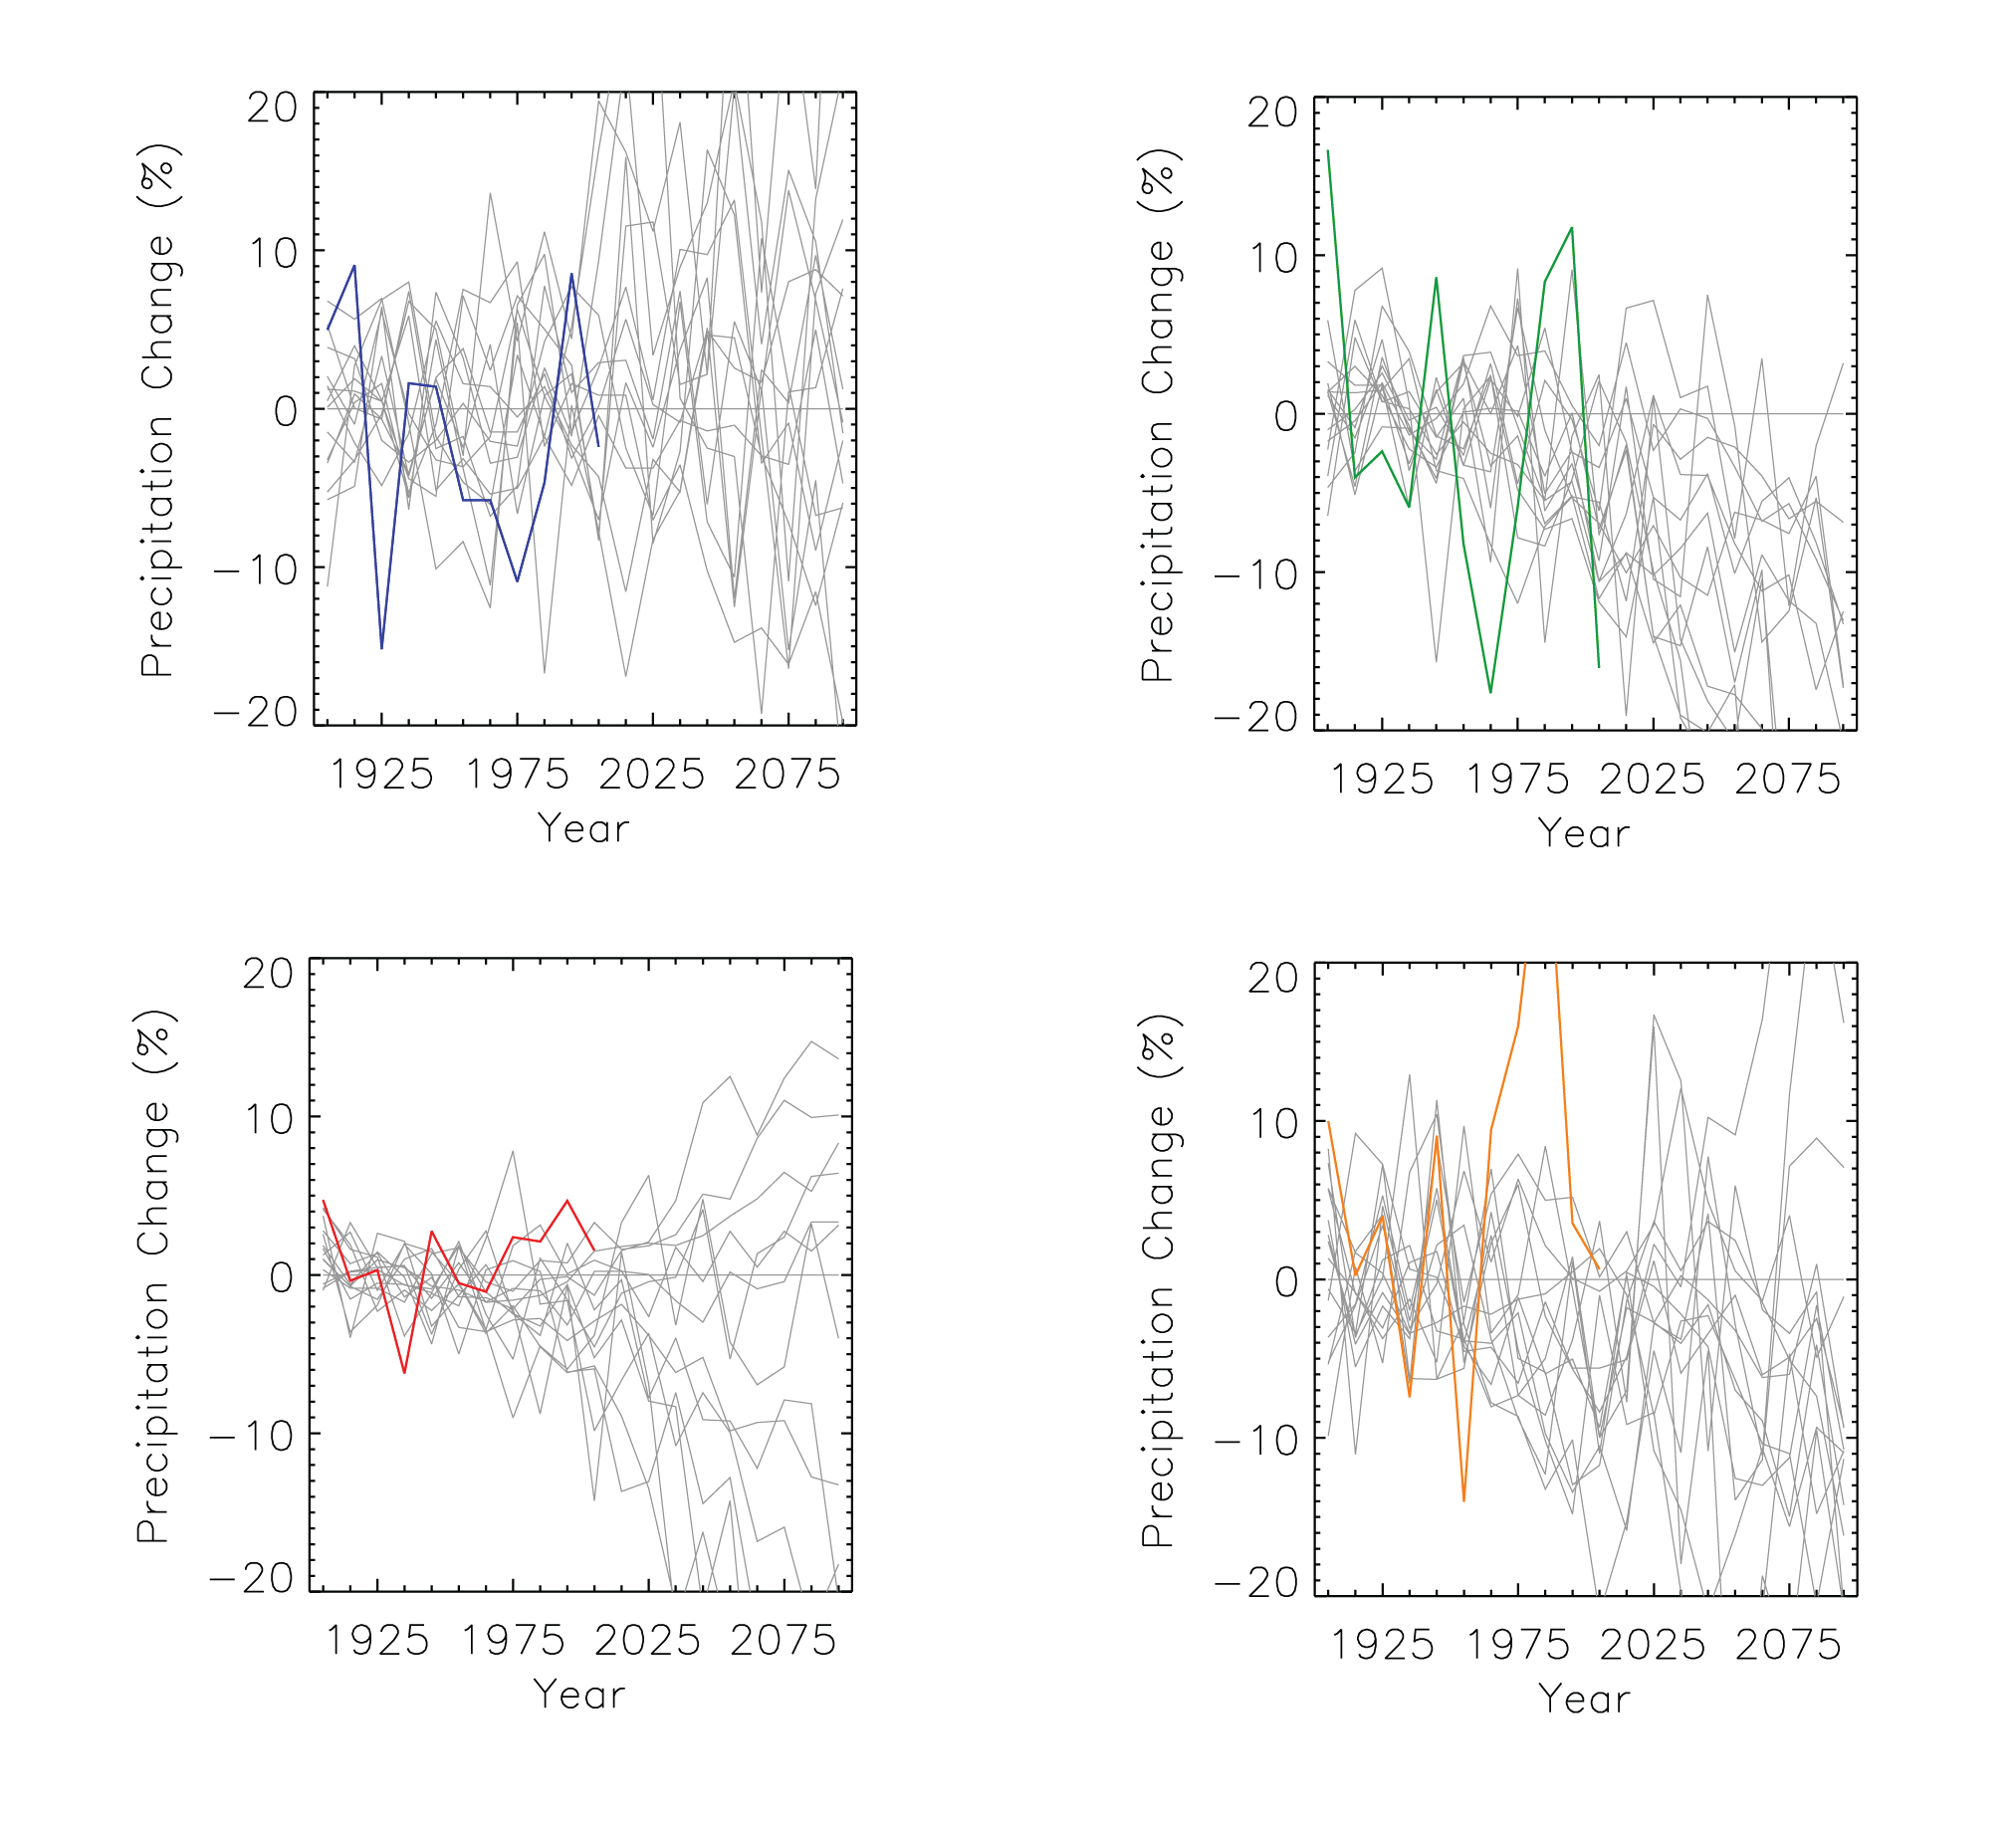
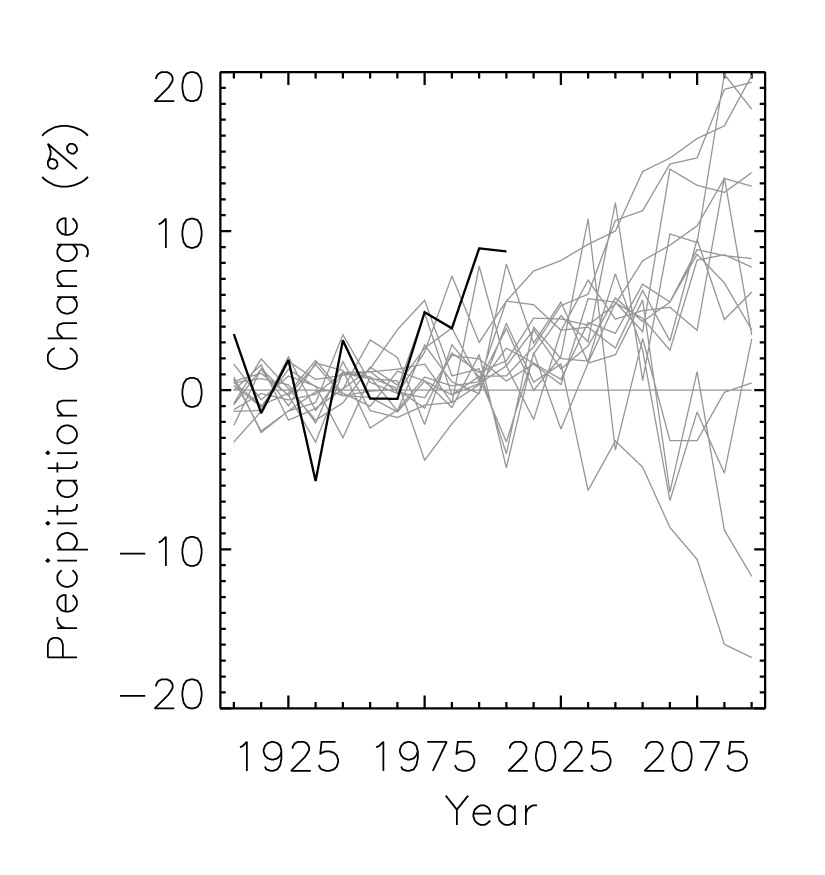
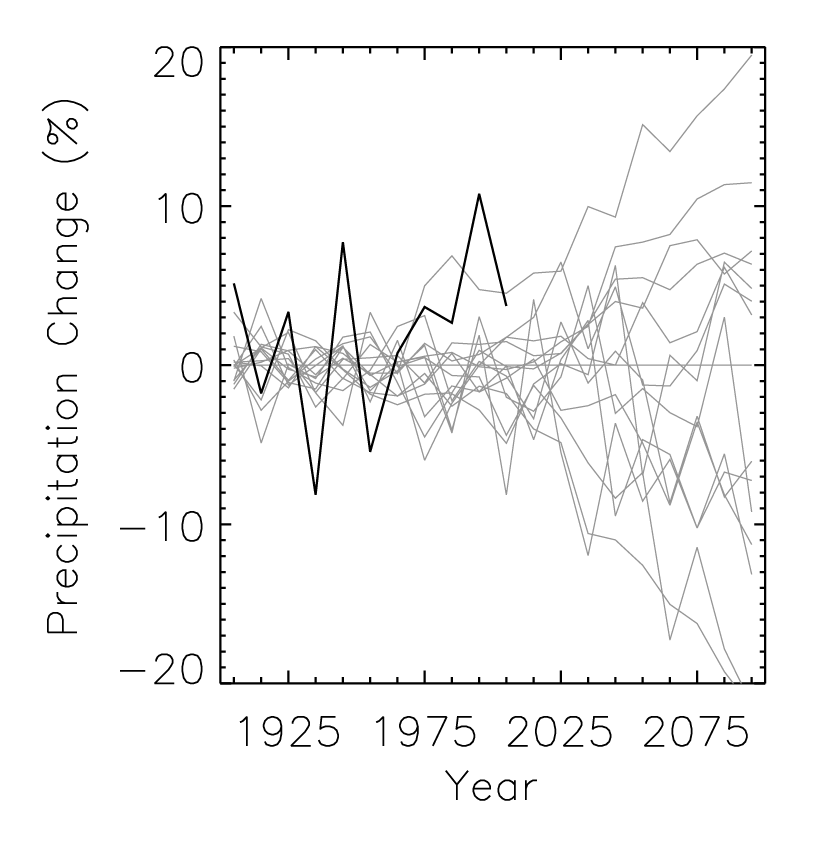
Simulated annual mean precipitation change |
Simulated |
Precipitation |
Midwest |
Regional Climate Trends and Scenarios for the U.S. National Climate Assessment. Part 3. Climate of the Midwest U.S. |
NCA 3 |
 |
|
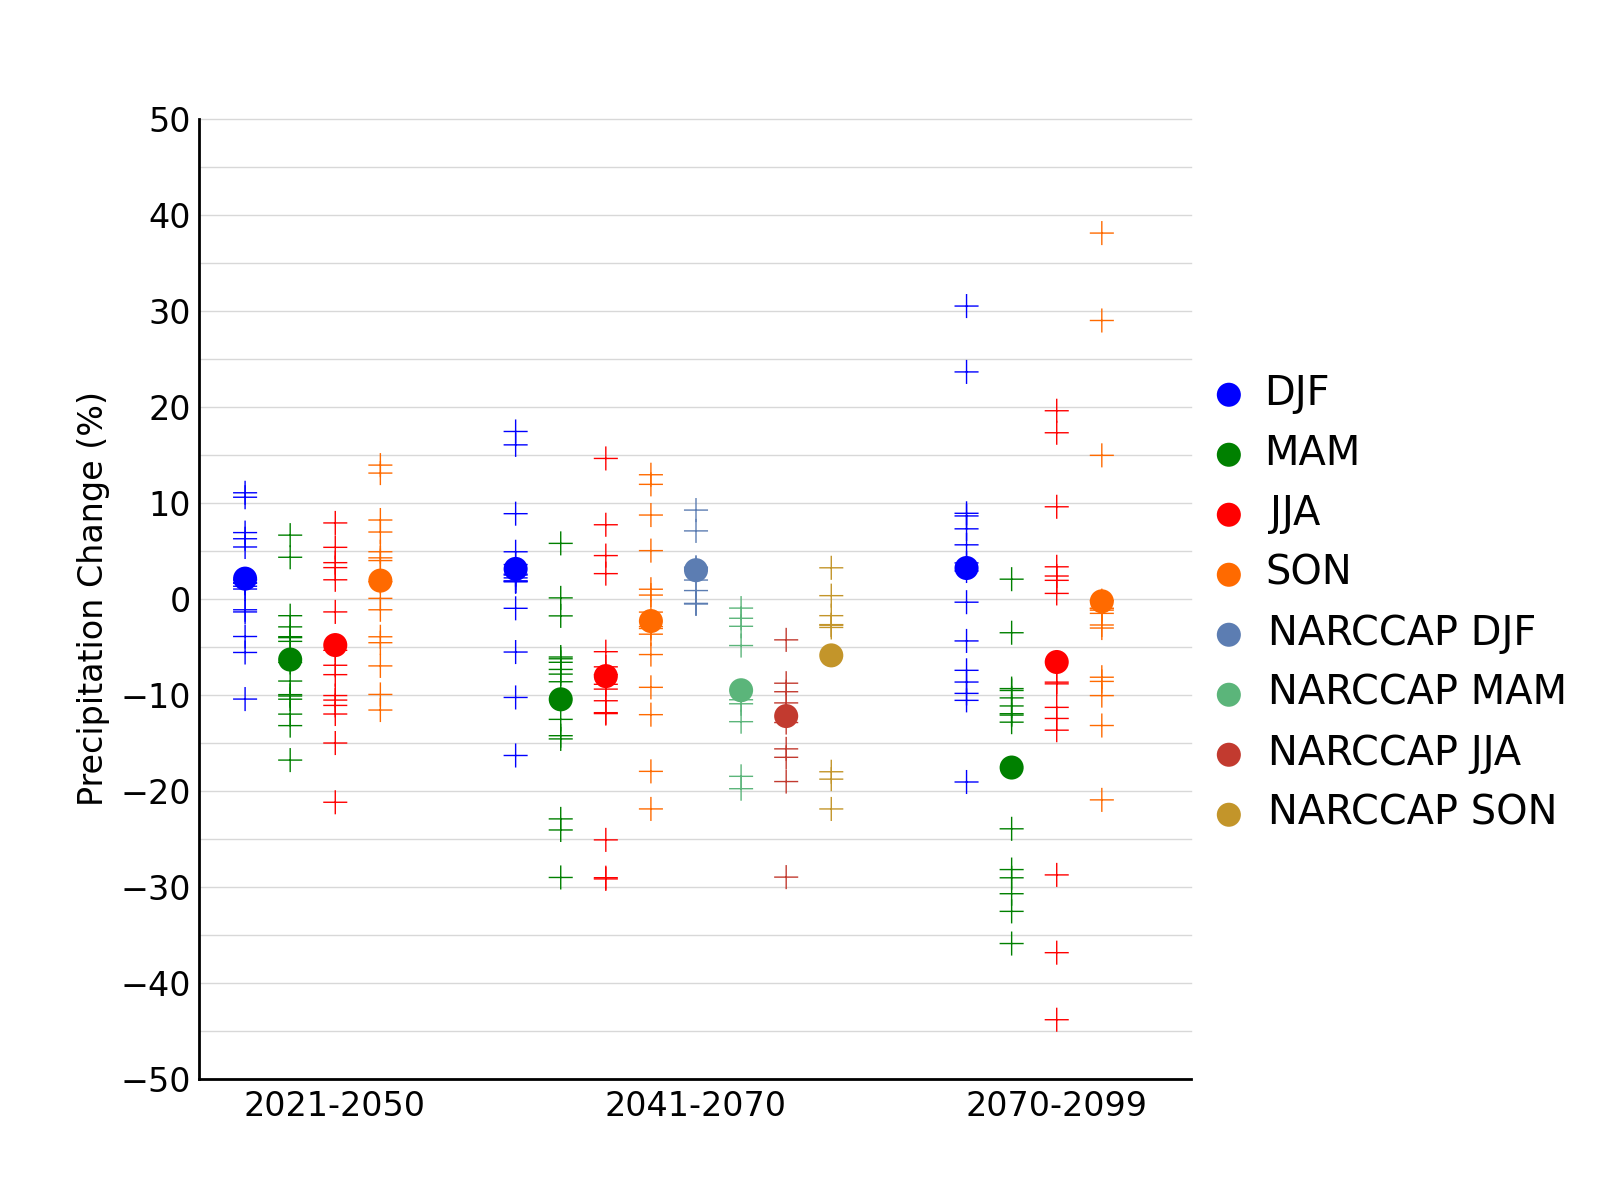
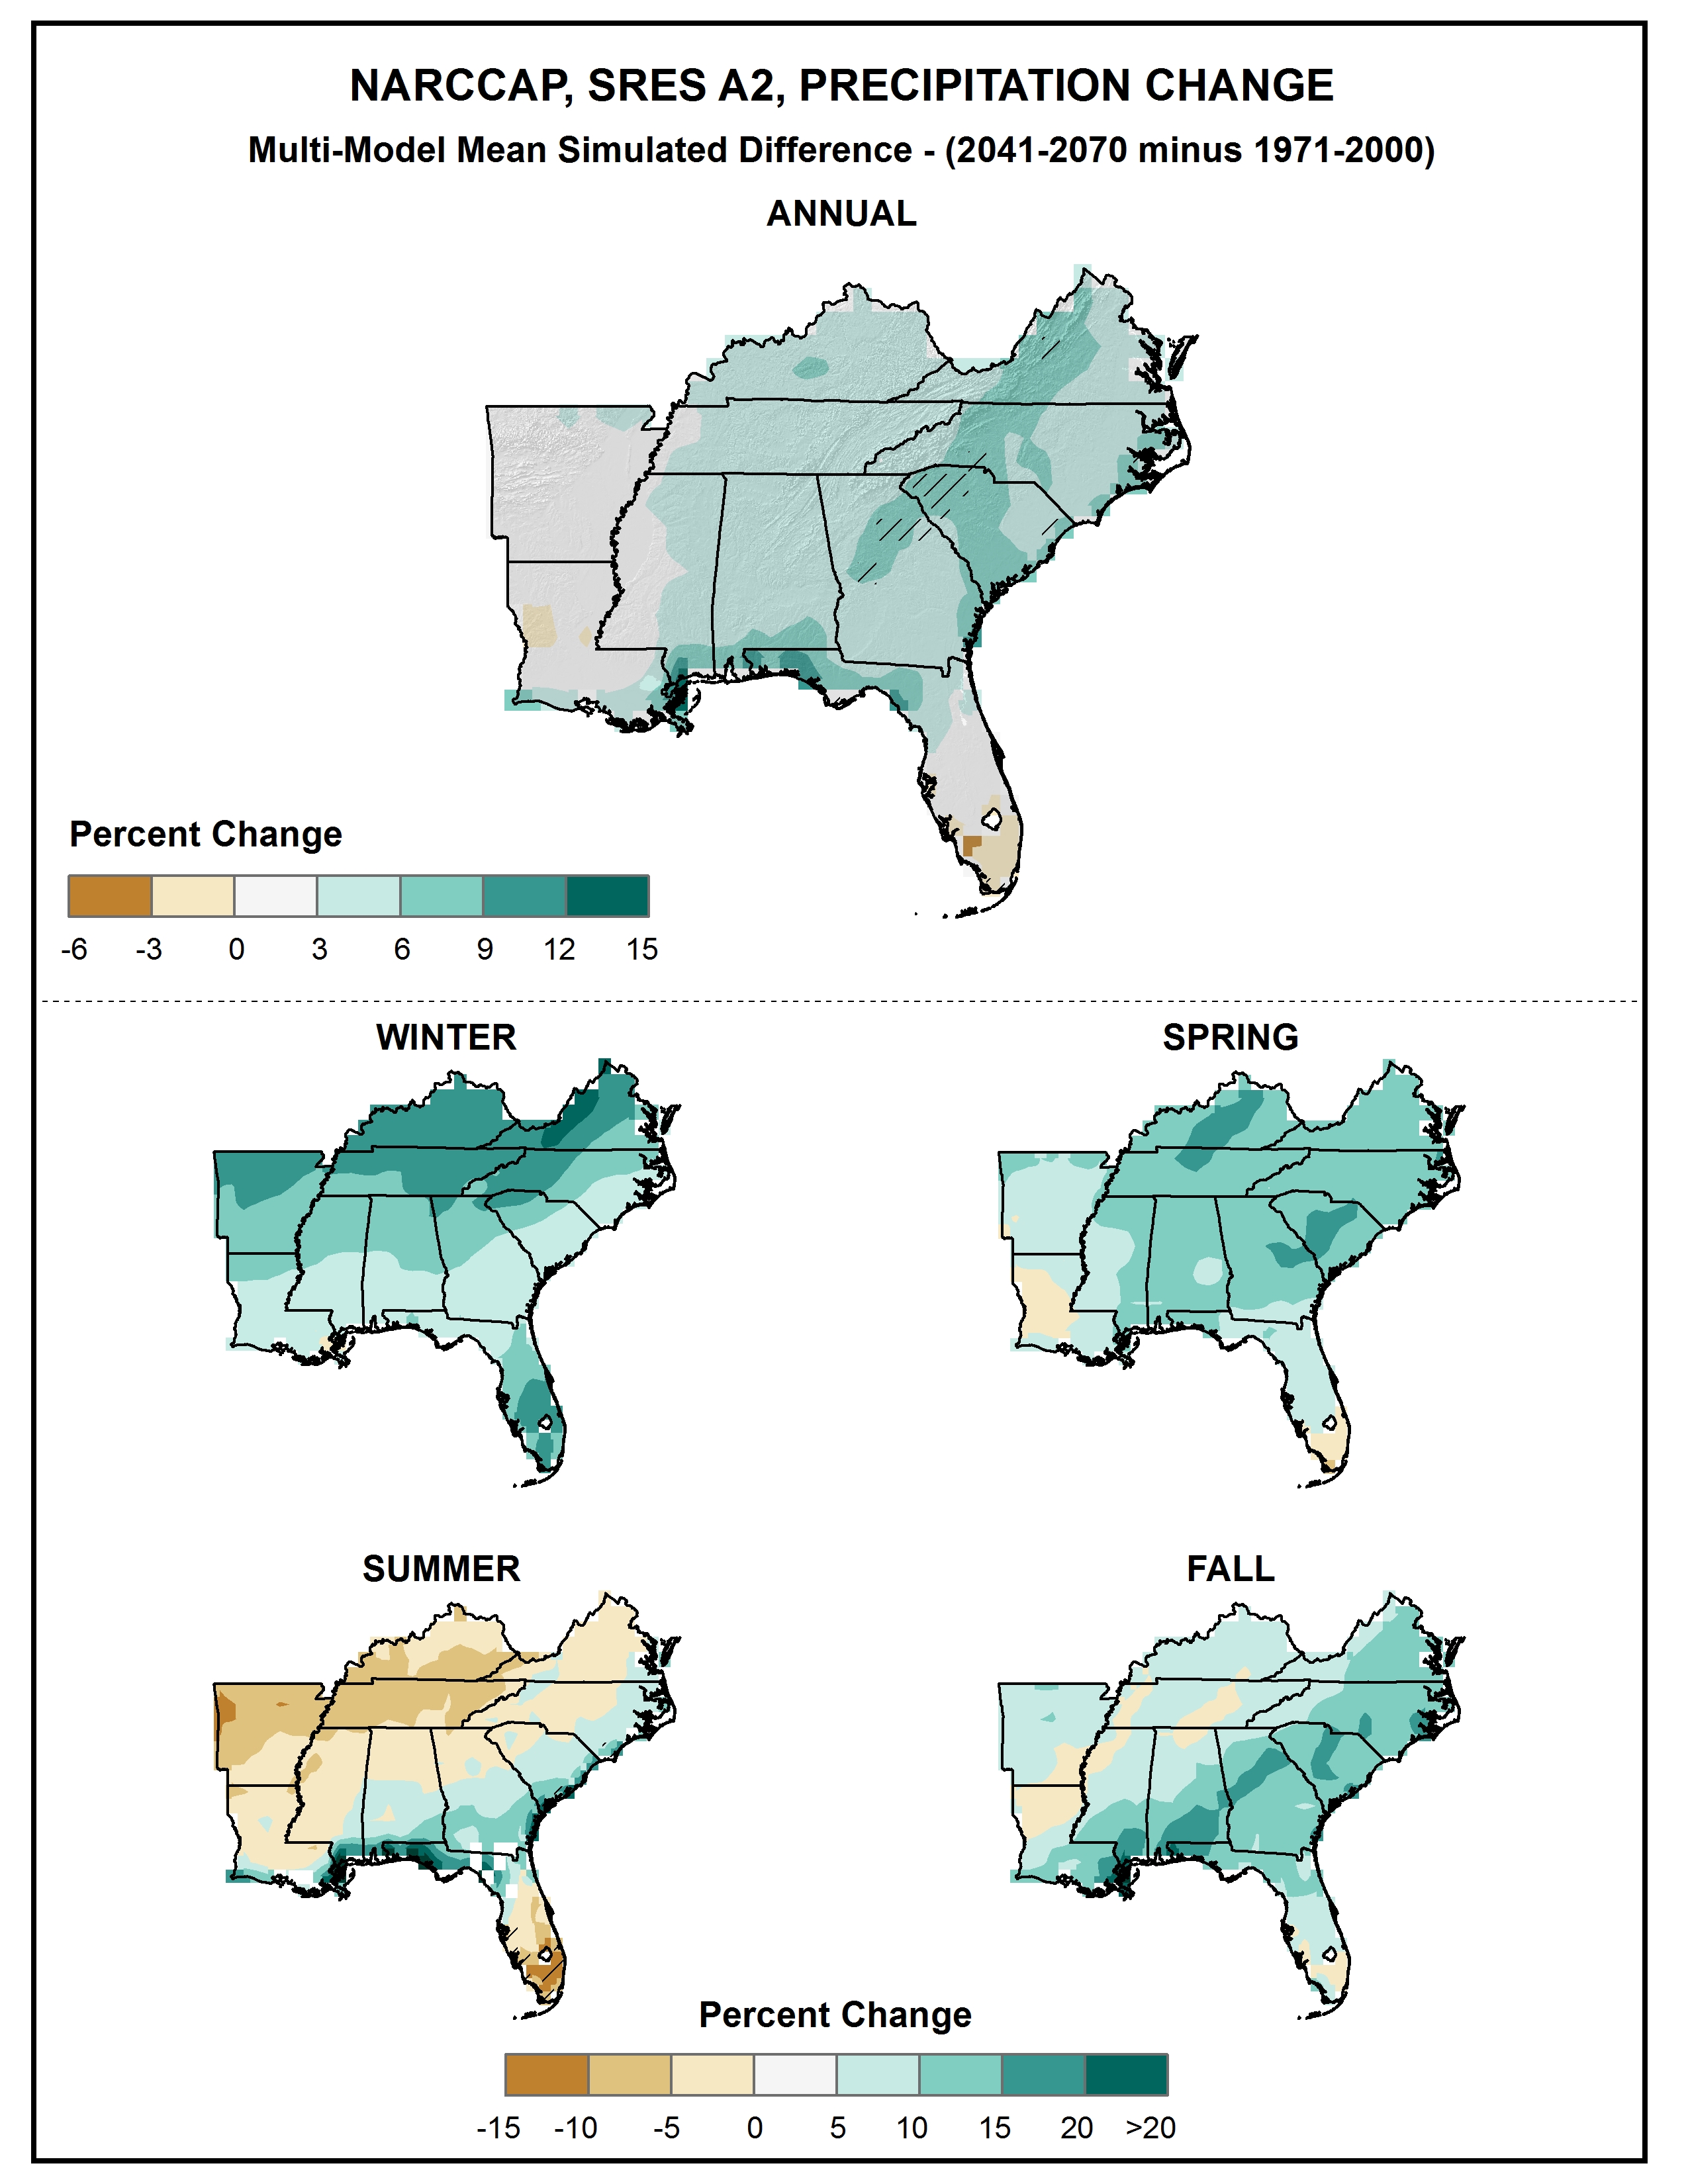
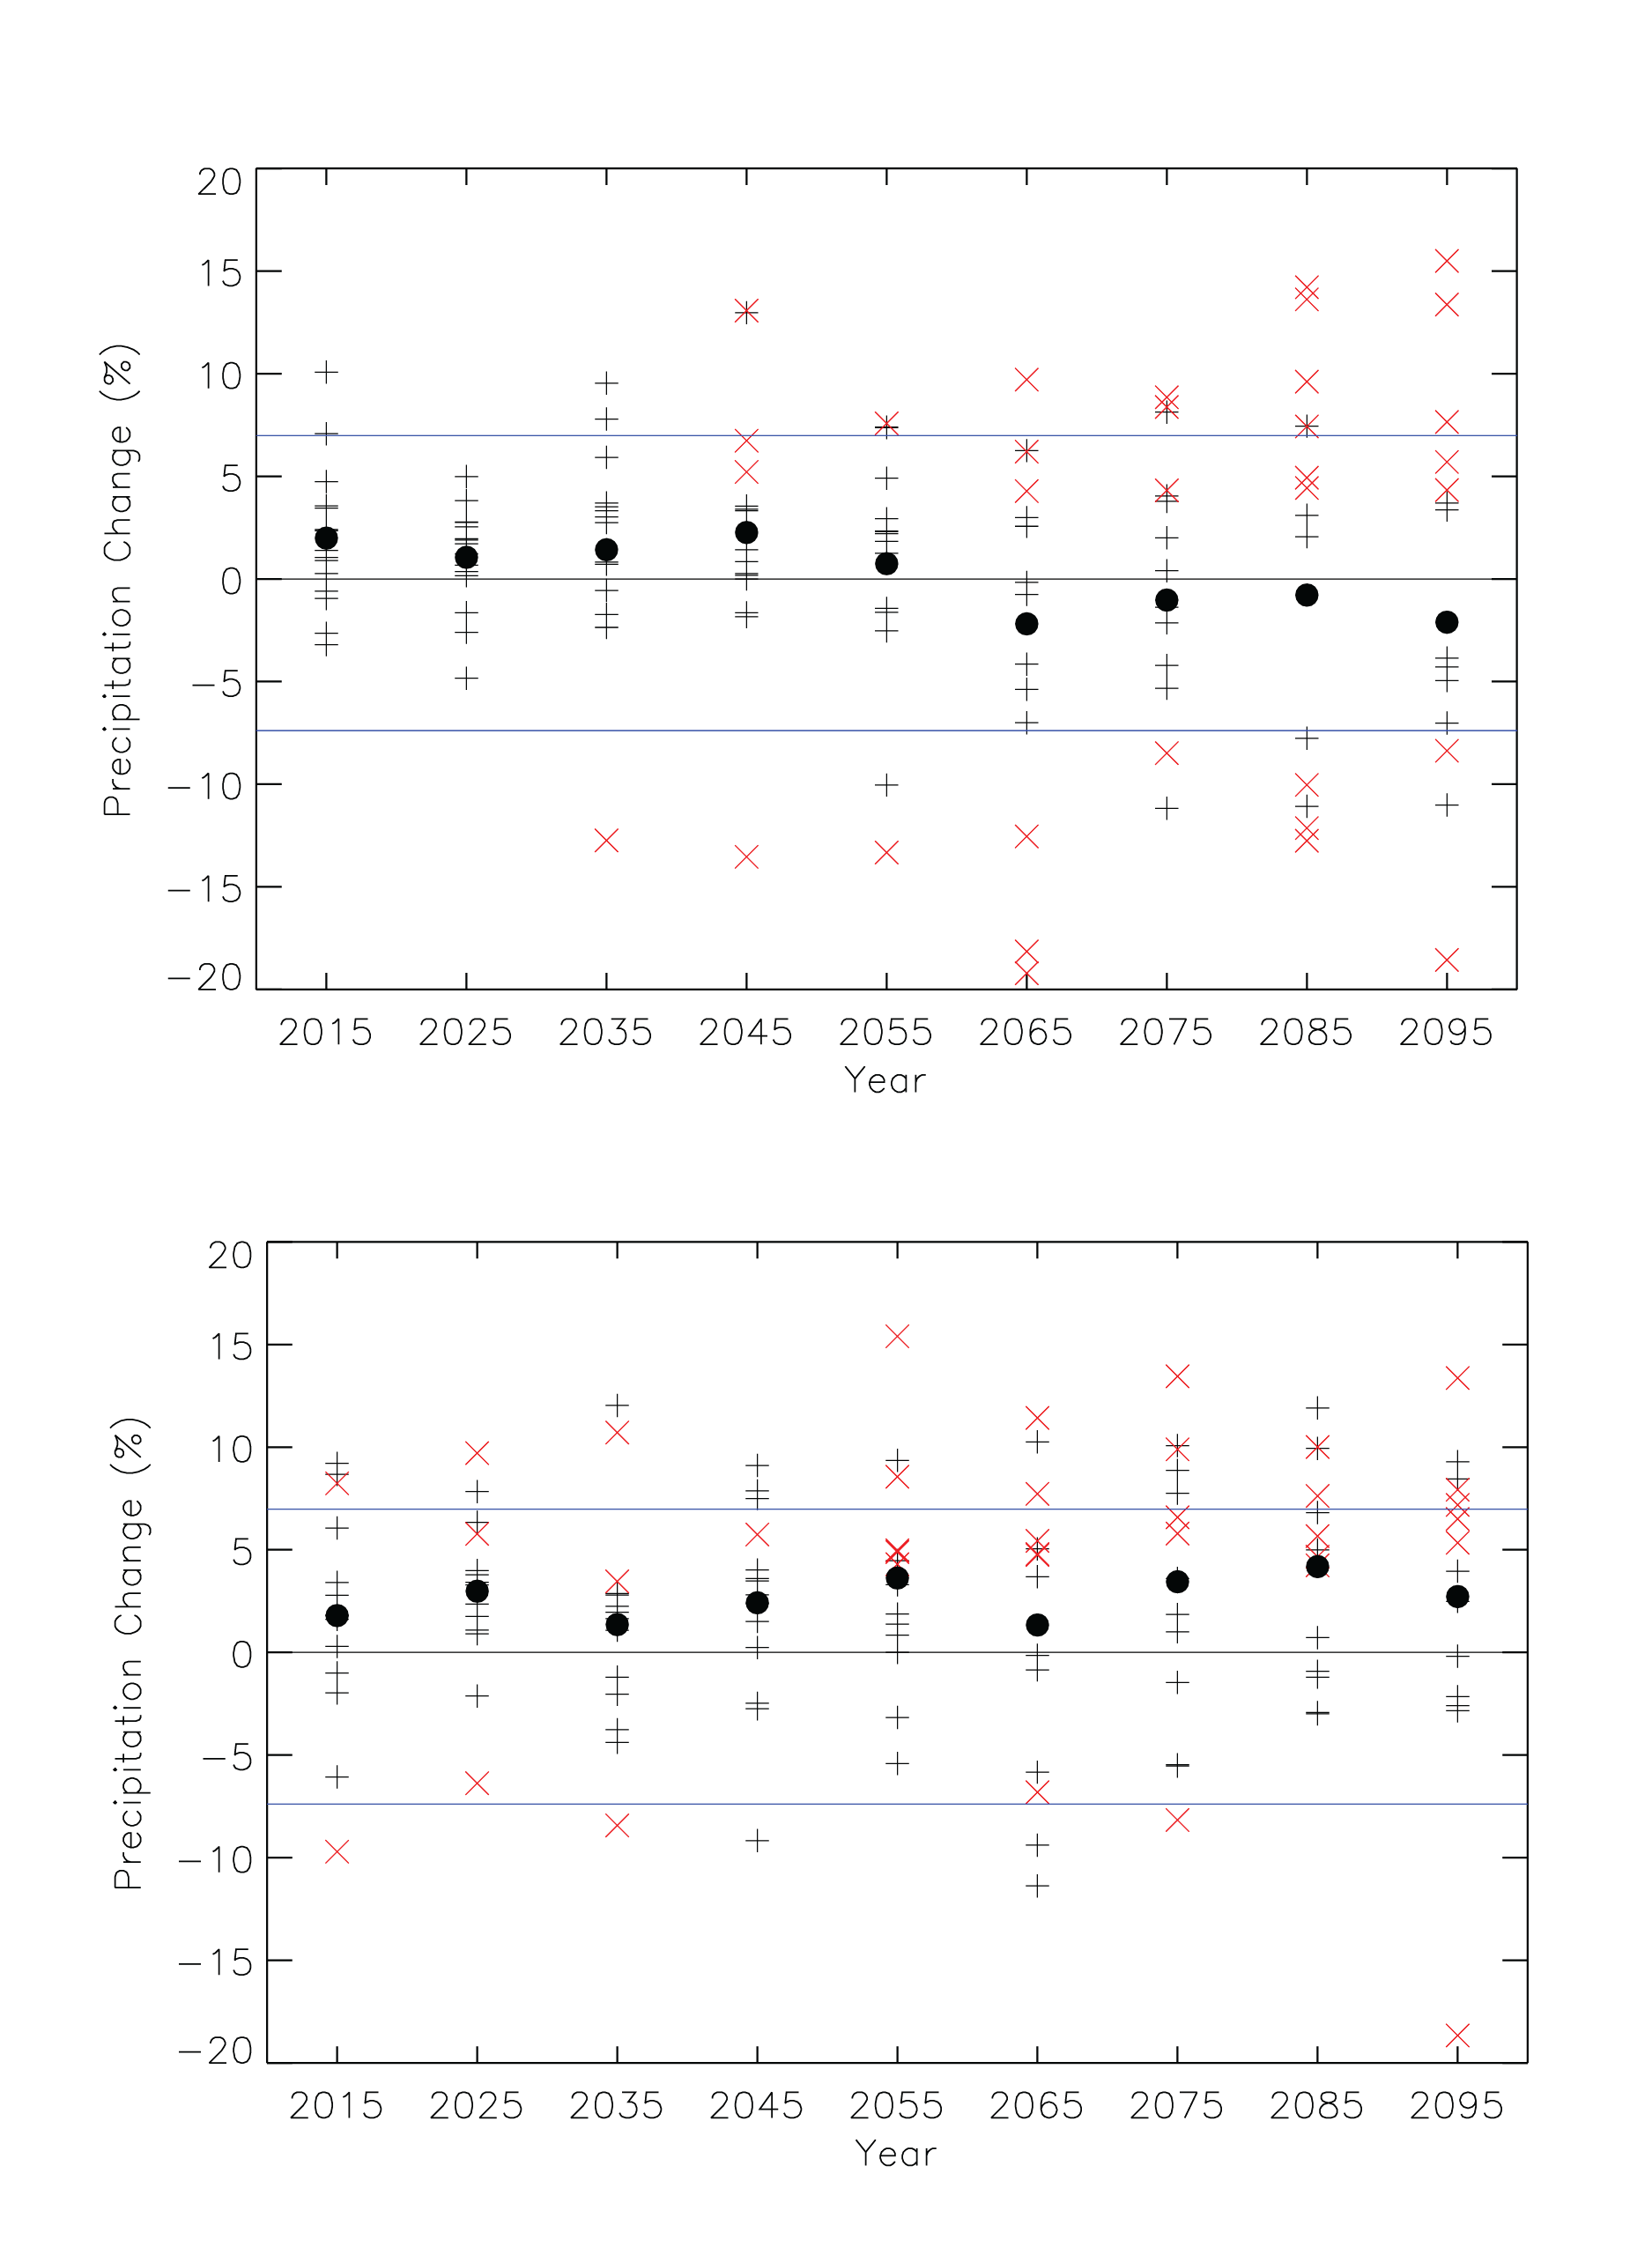
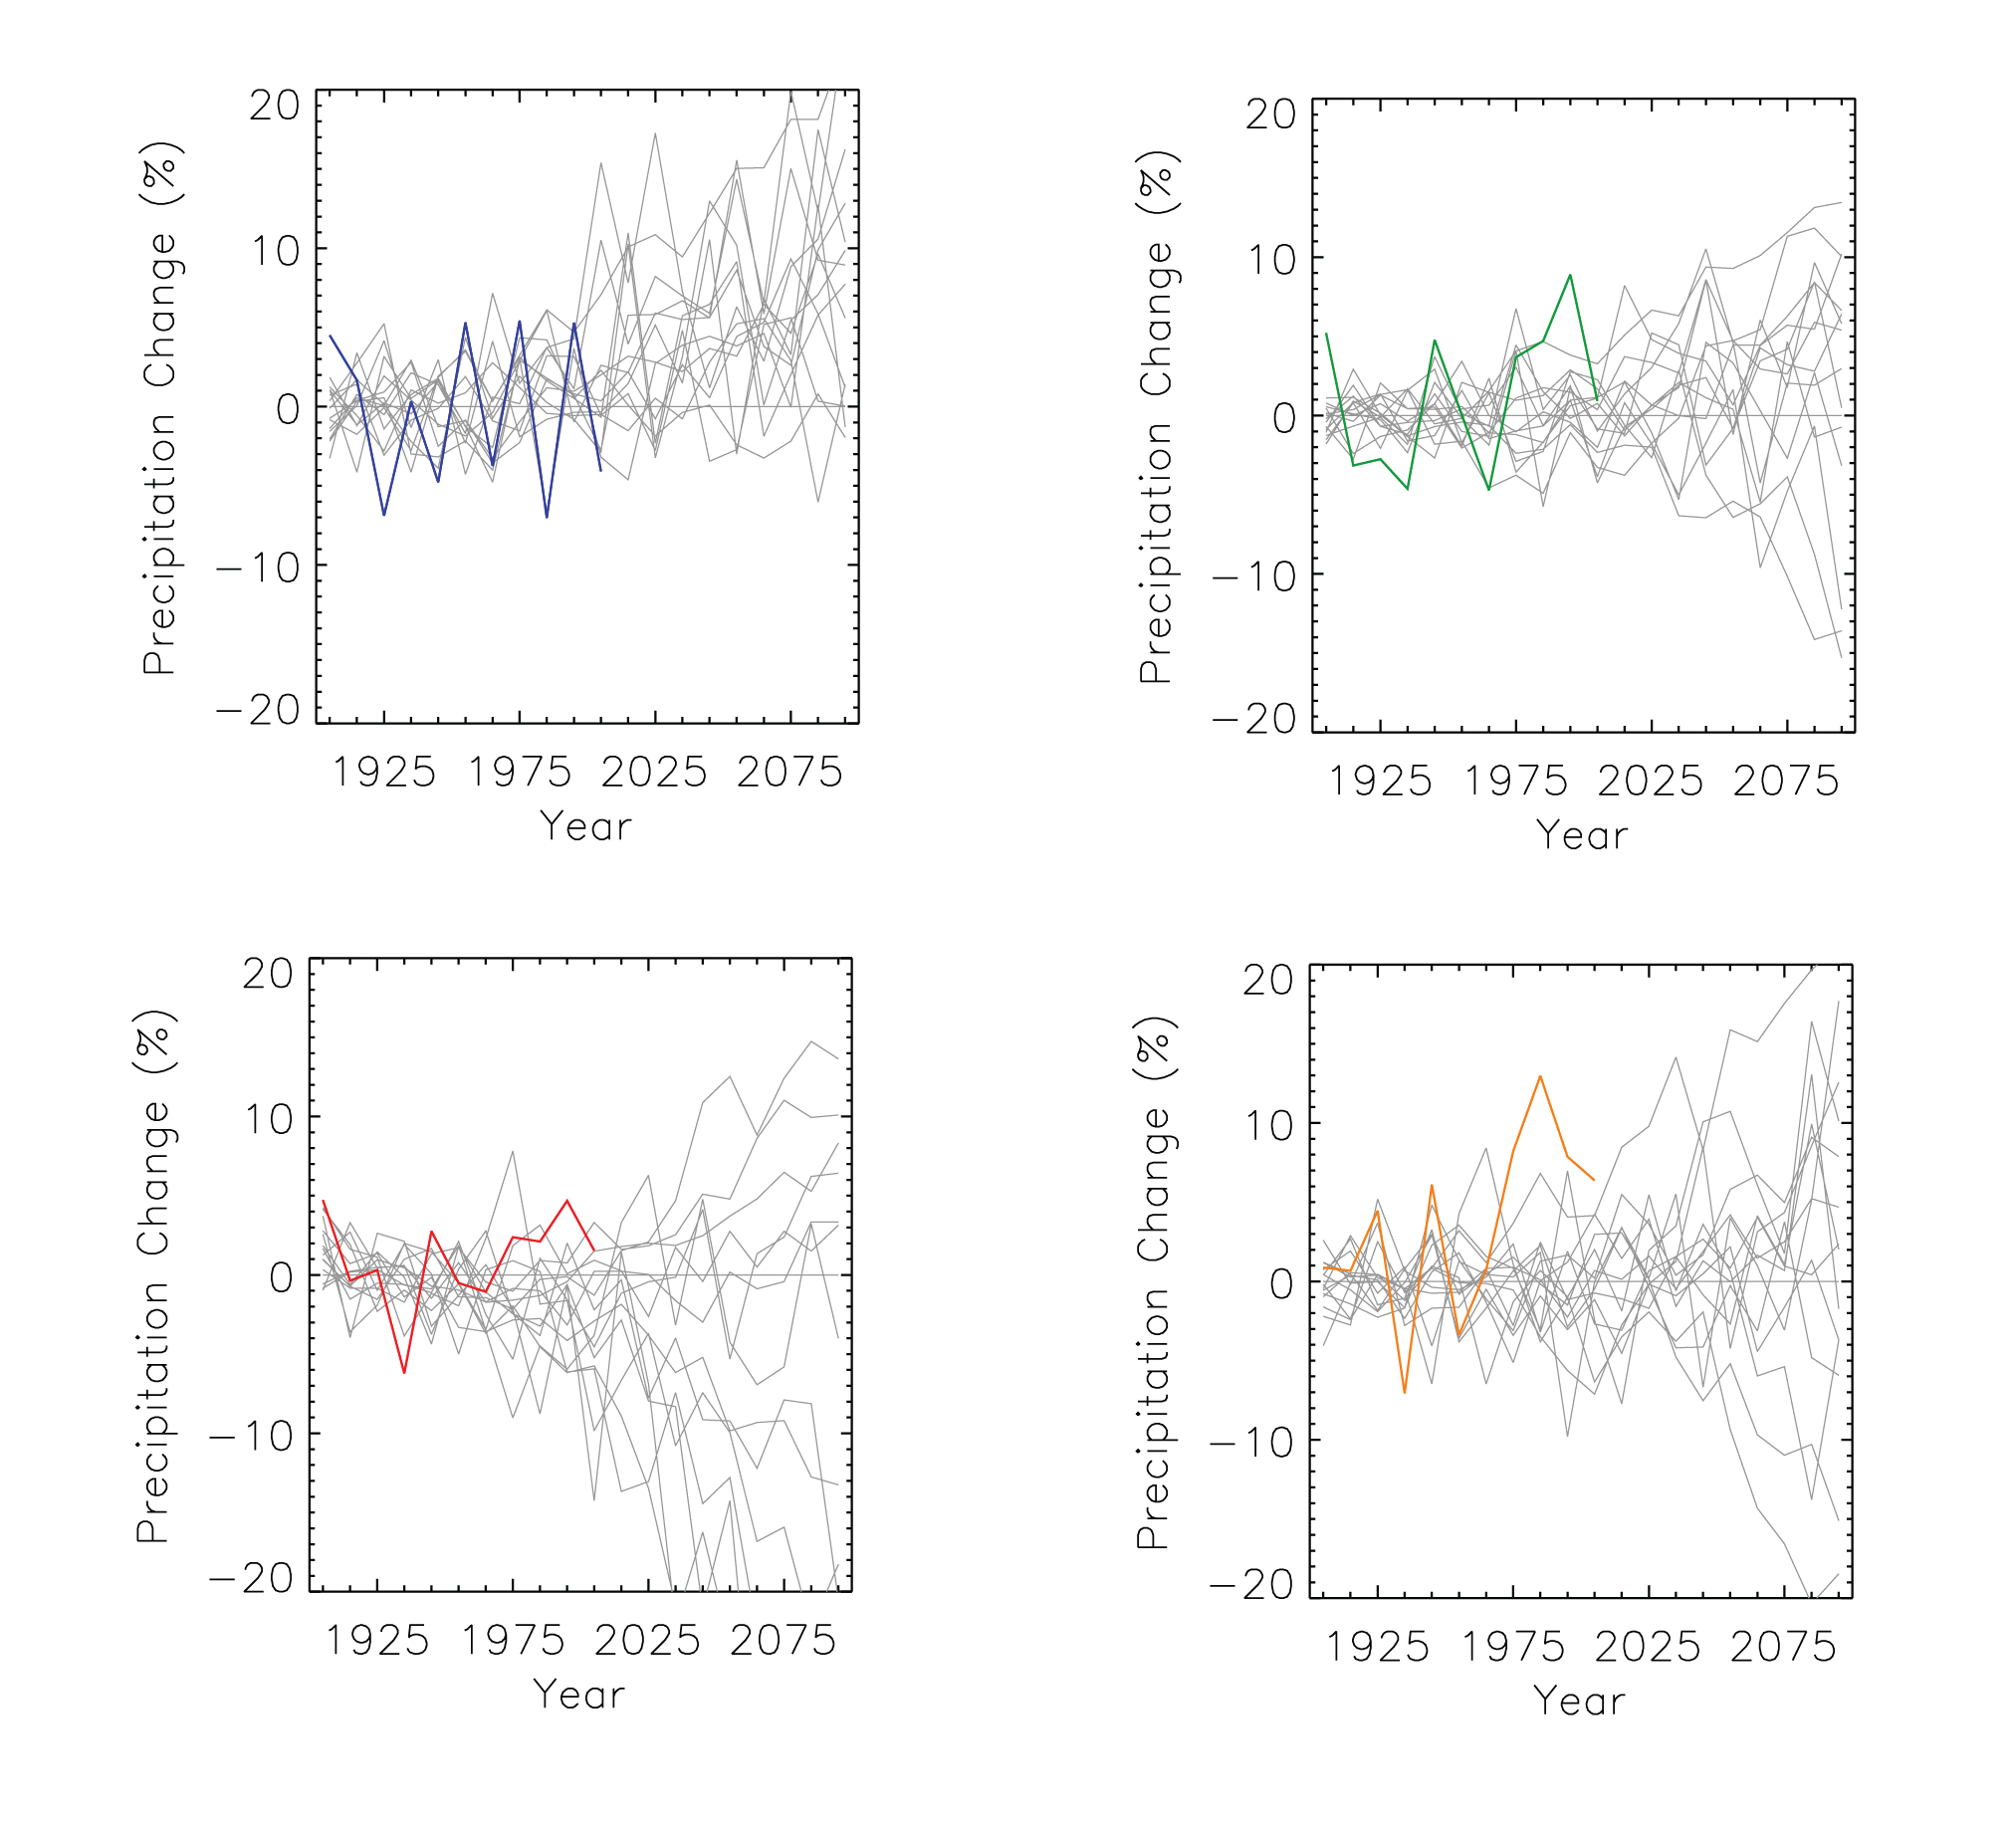
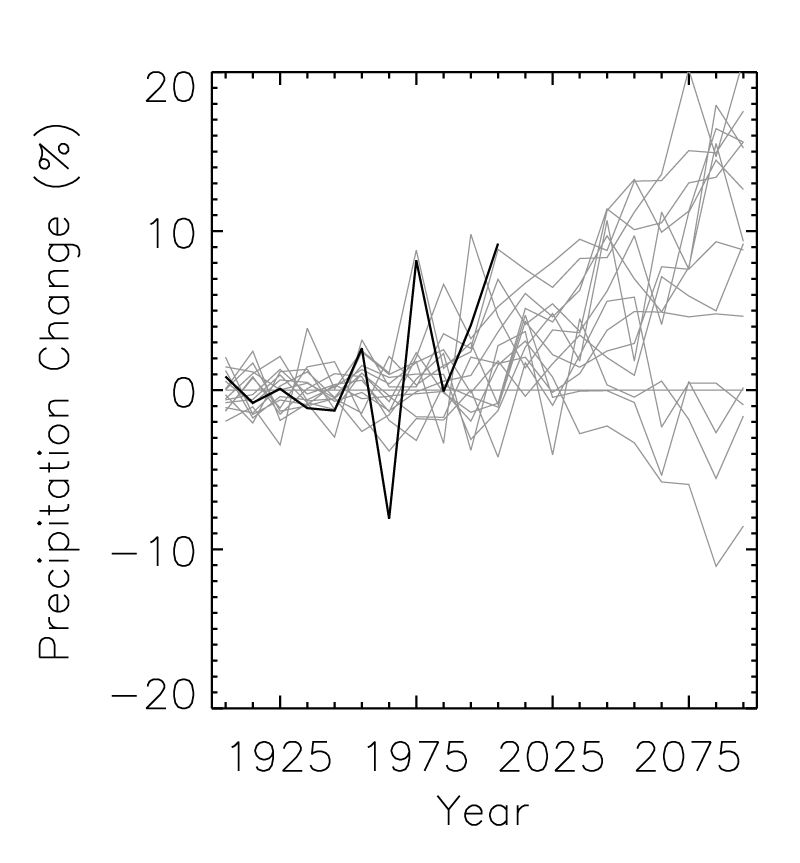
Simulated annual mean precipitation change |
Simulated |
Precipitation |
Southeast and Caribbean |
Regional Climate Trends and Scenarios for the U.S. National Climate Assessment. Part 2. Climate of the Southeast U.S. |
NCA 3 |
 |
|
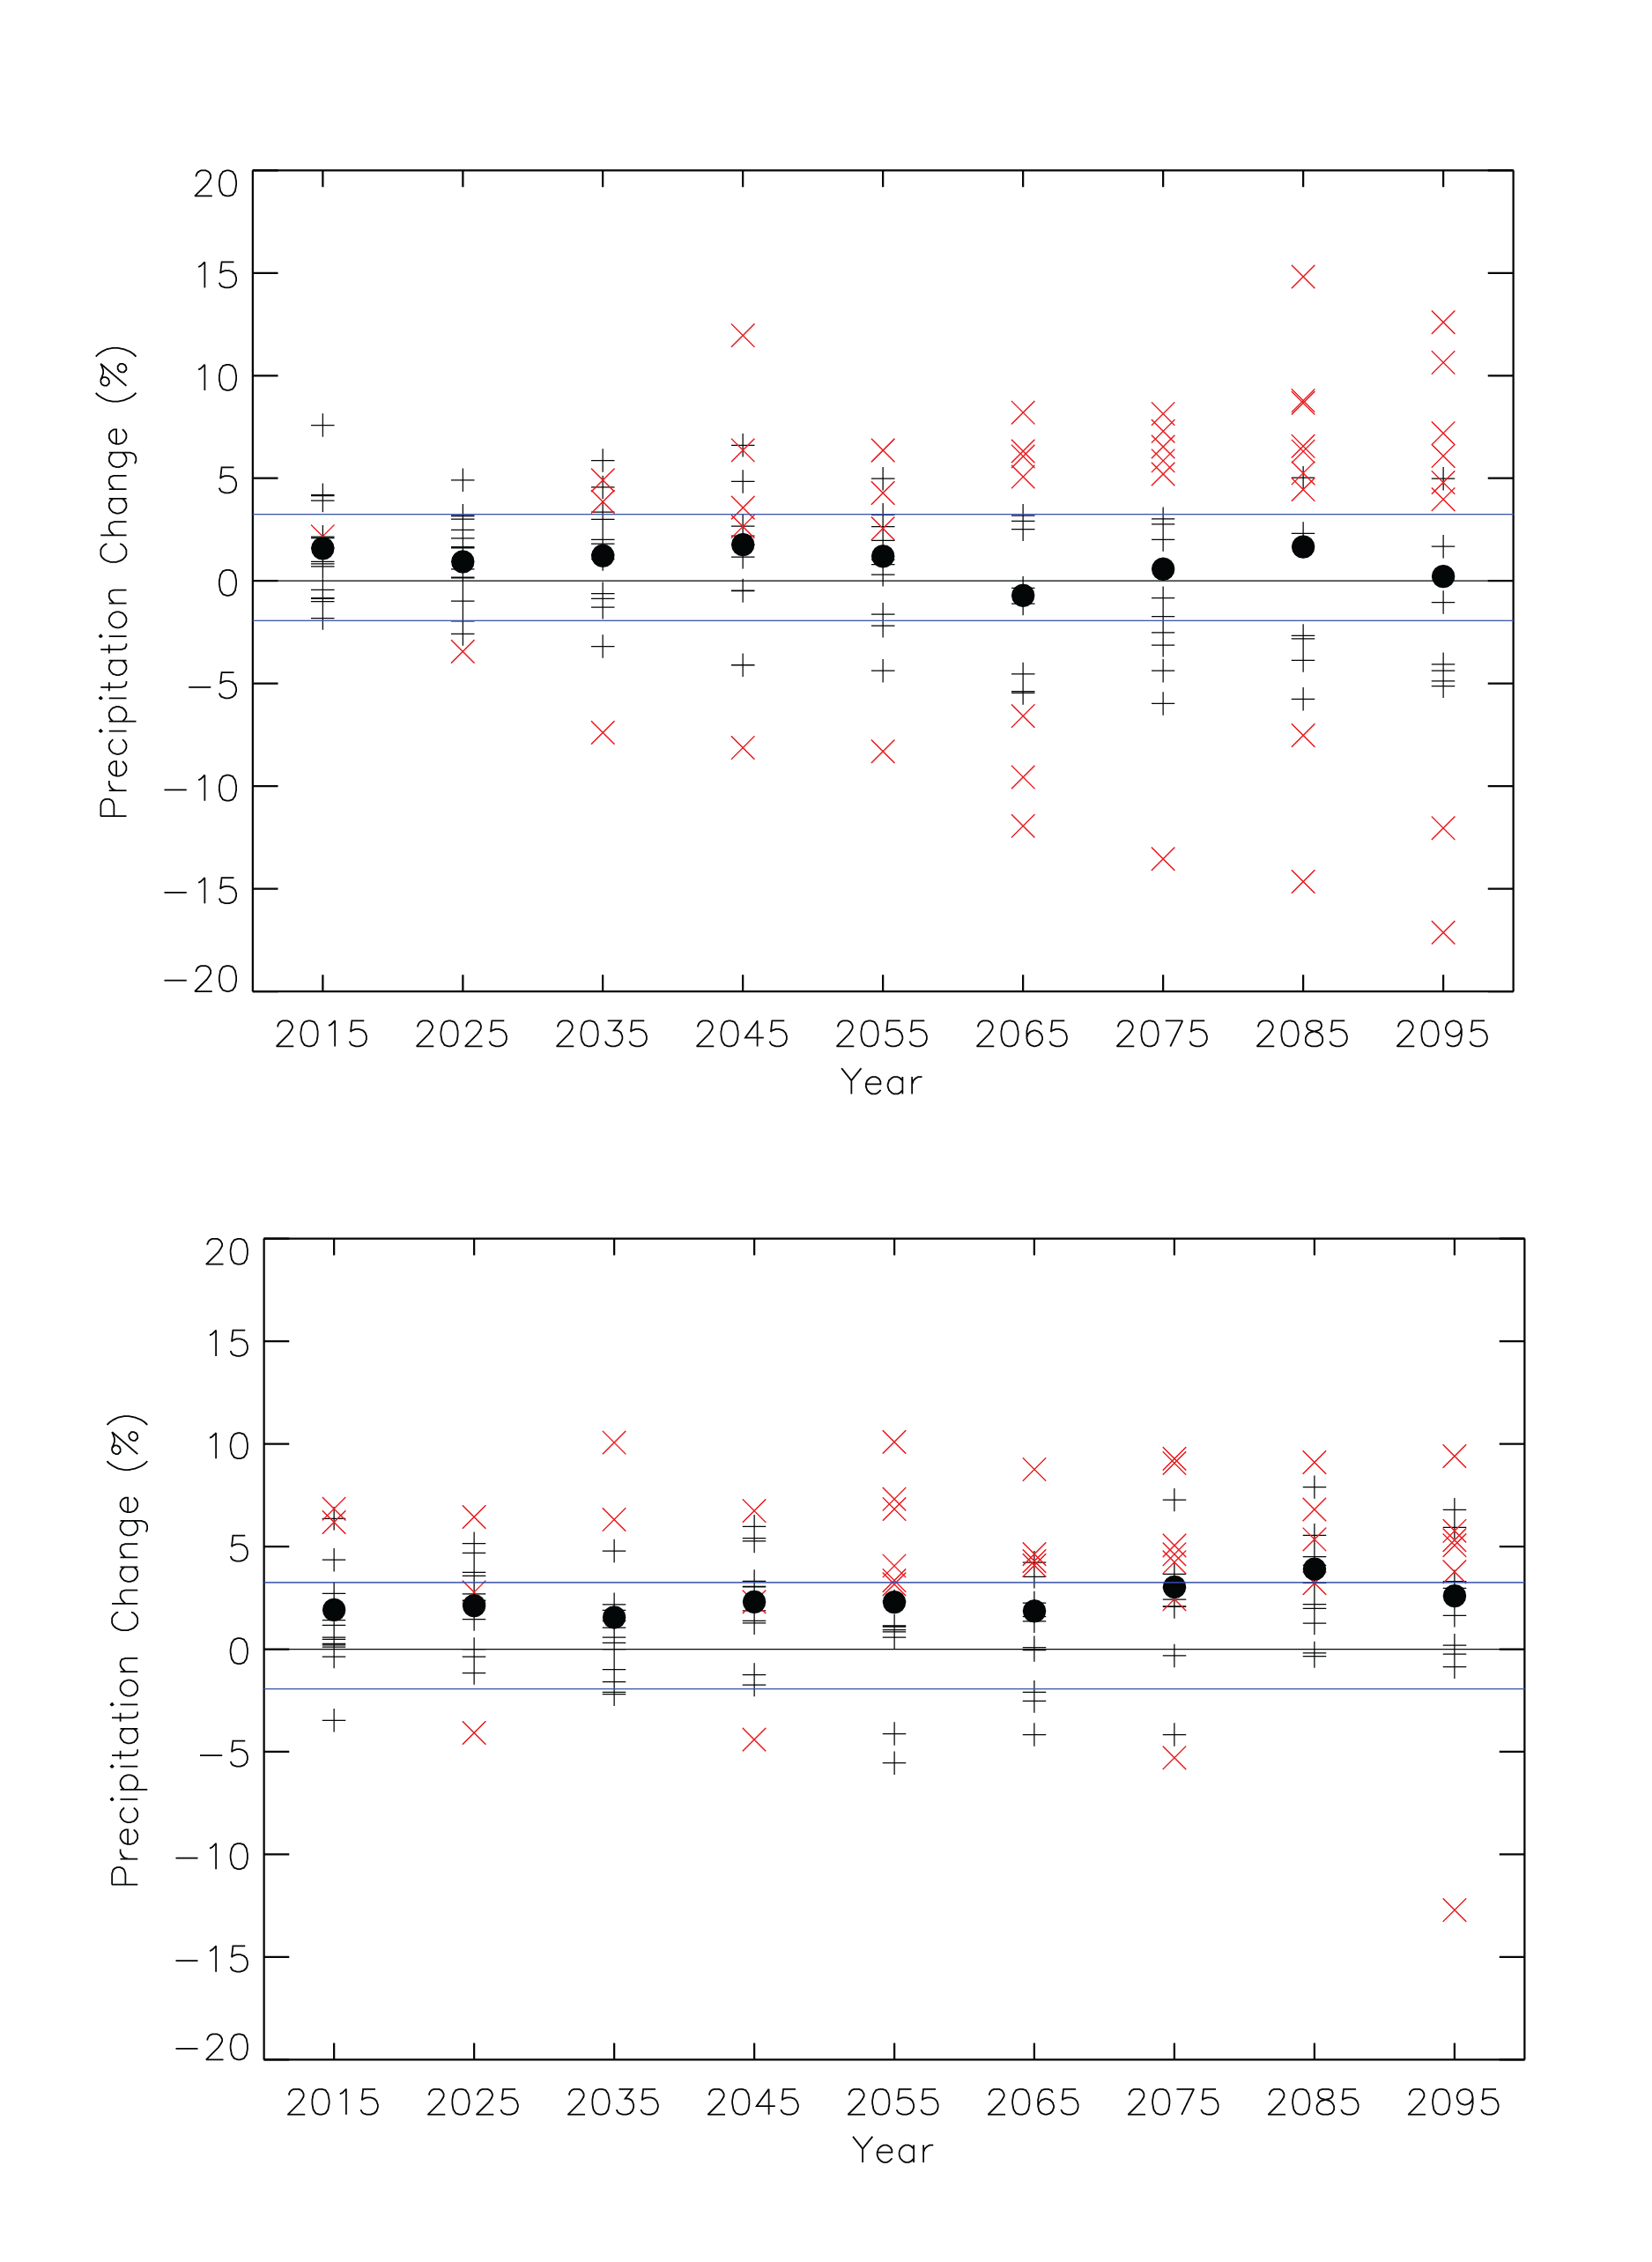
Simulated annual mean precipitation change |
Simulated |
Precipitation |
National |
Regional Climate Trends and Scenarios for the U.S. National Climate Assessment. Part 9. Climate of the Contiguous United States |
NCA 3 |
 |
|
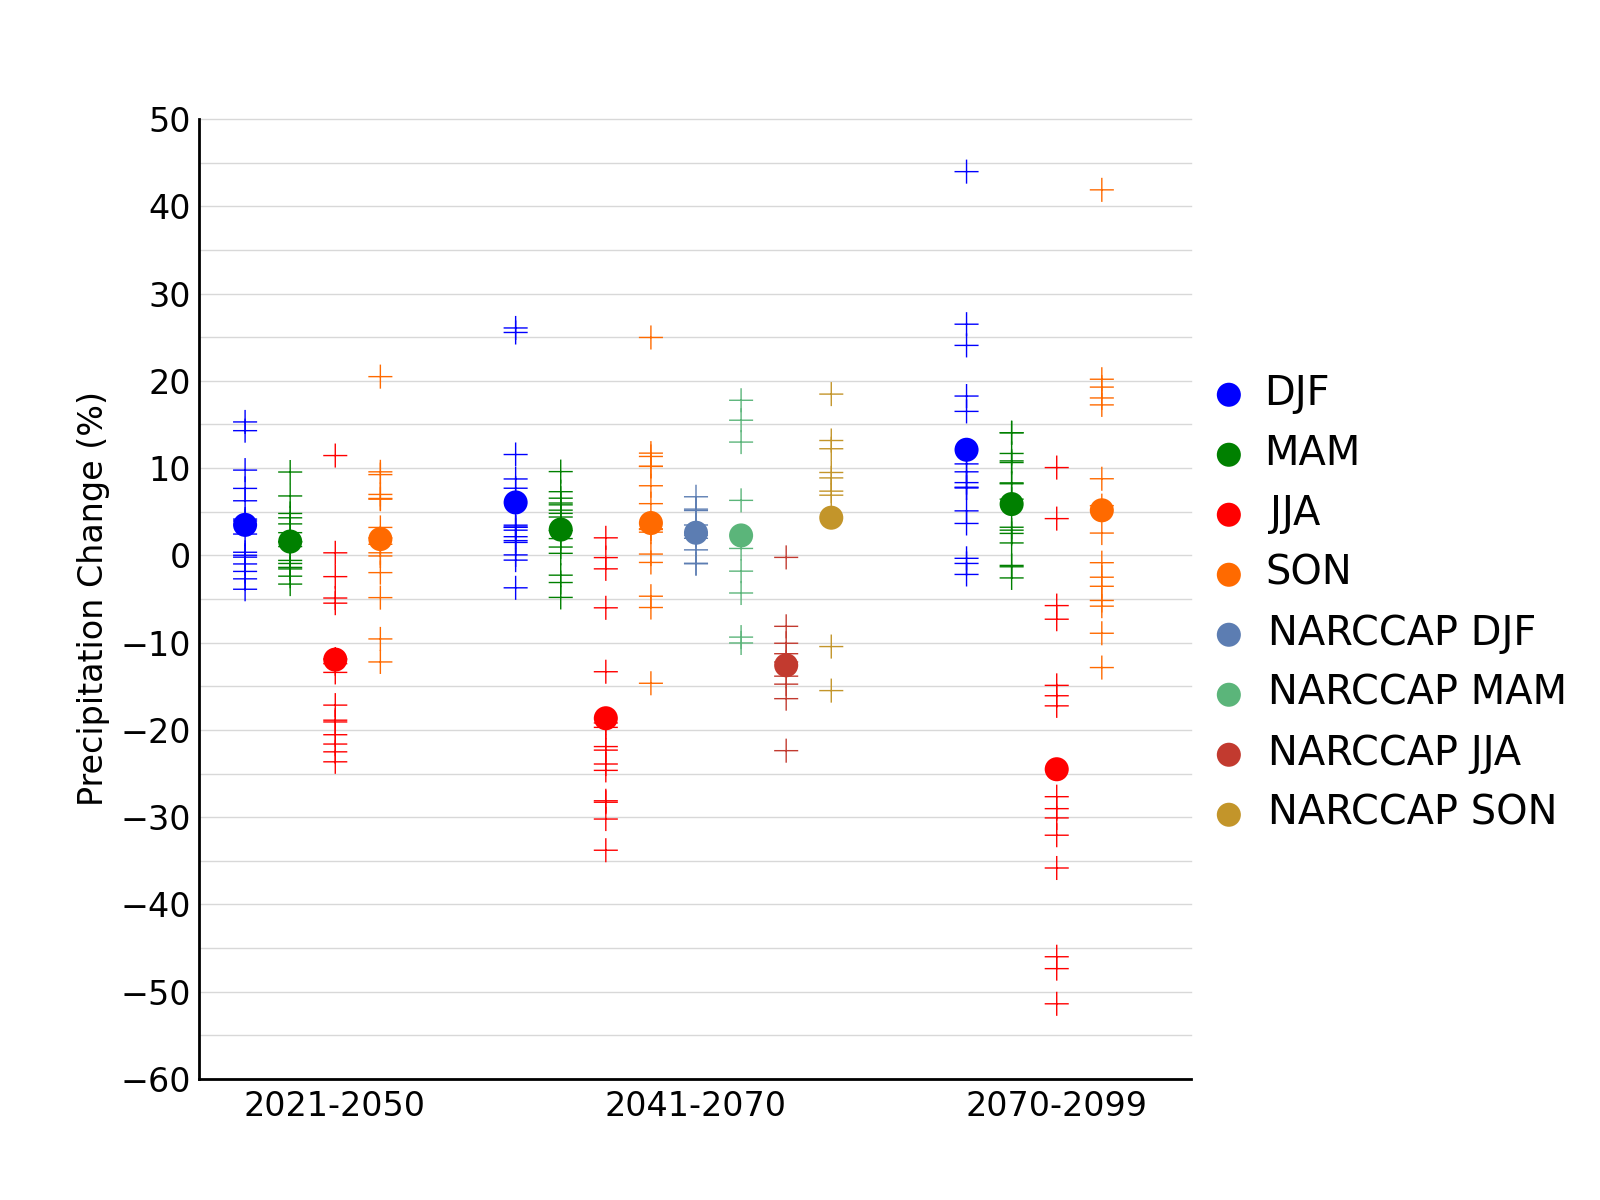
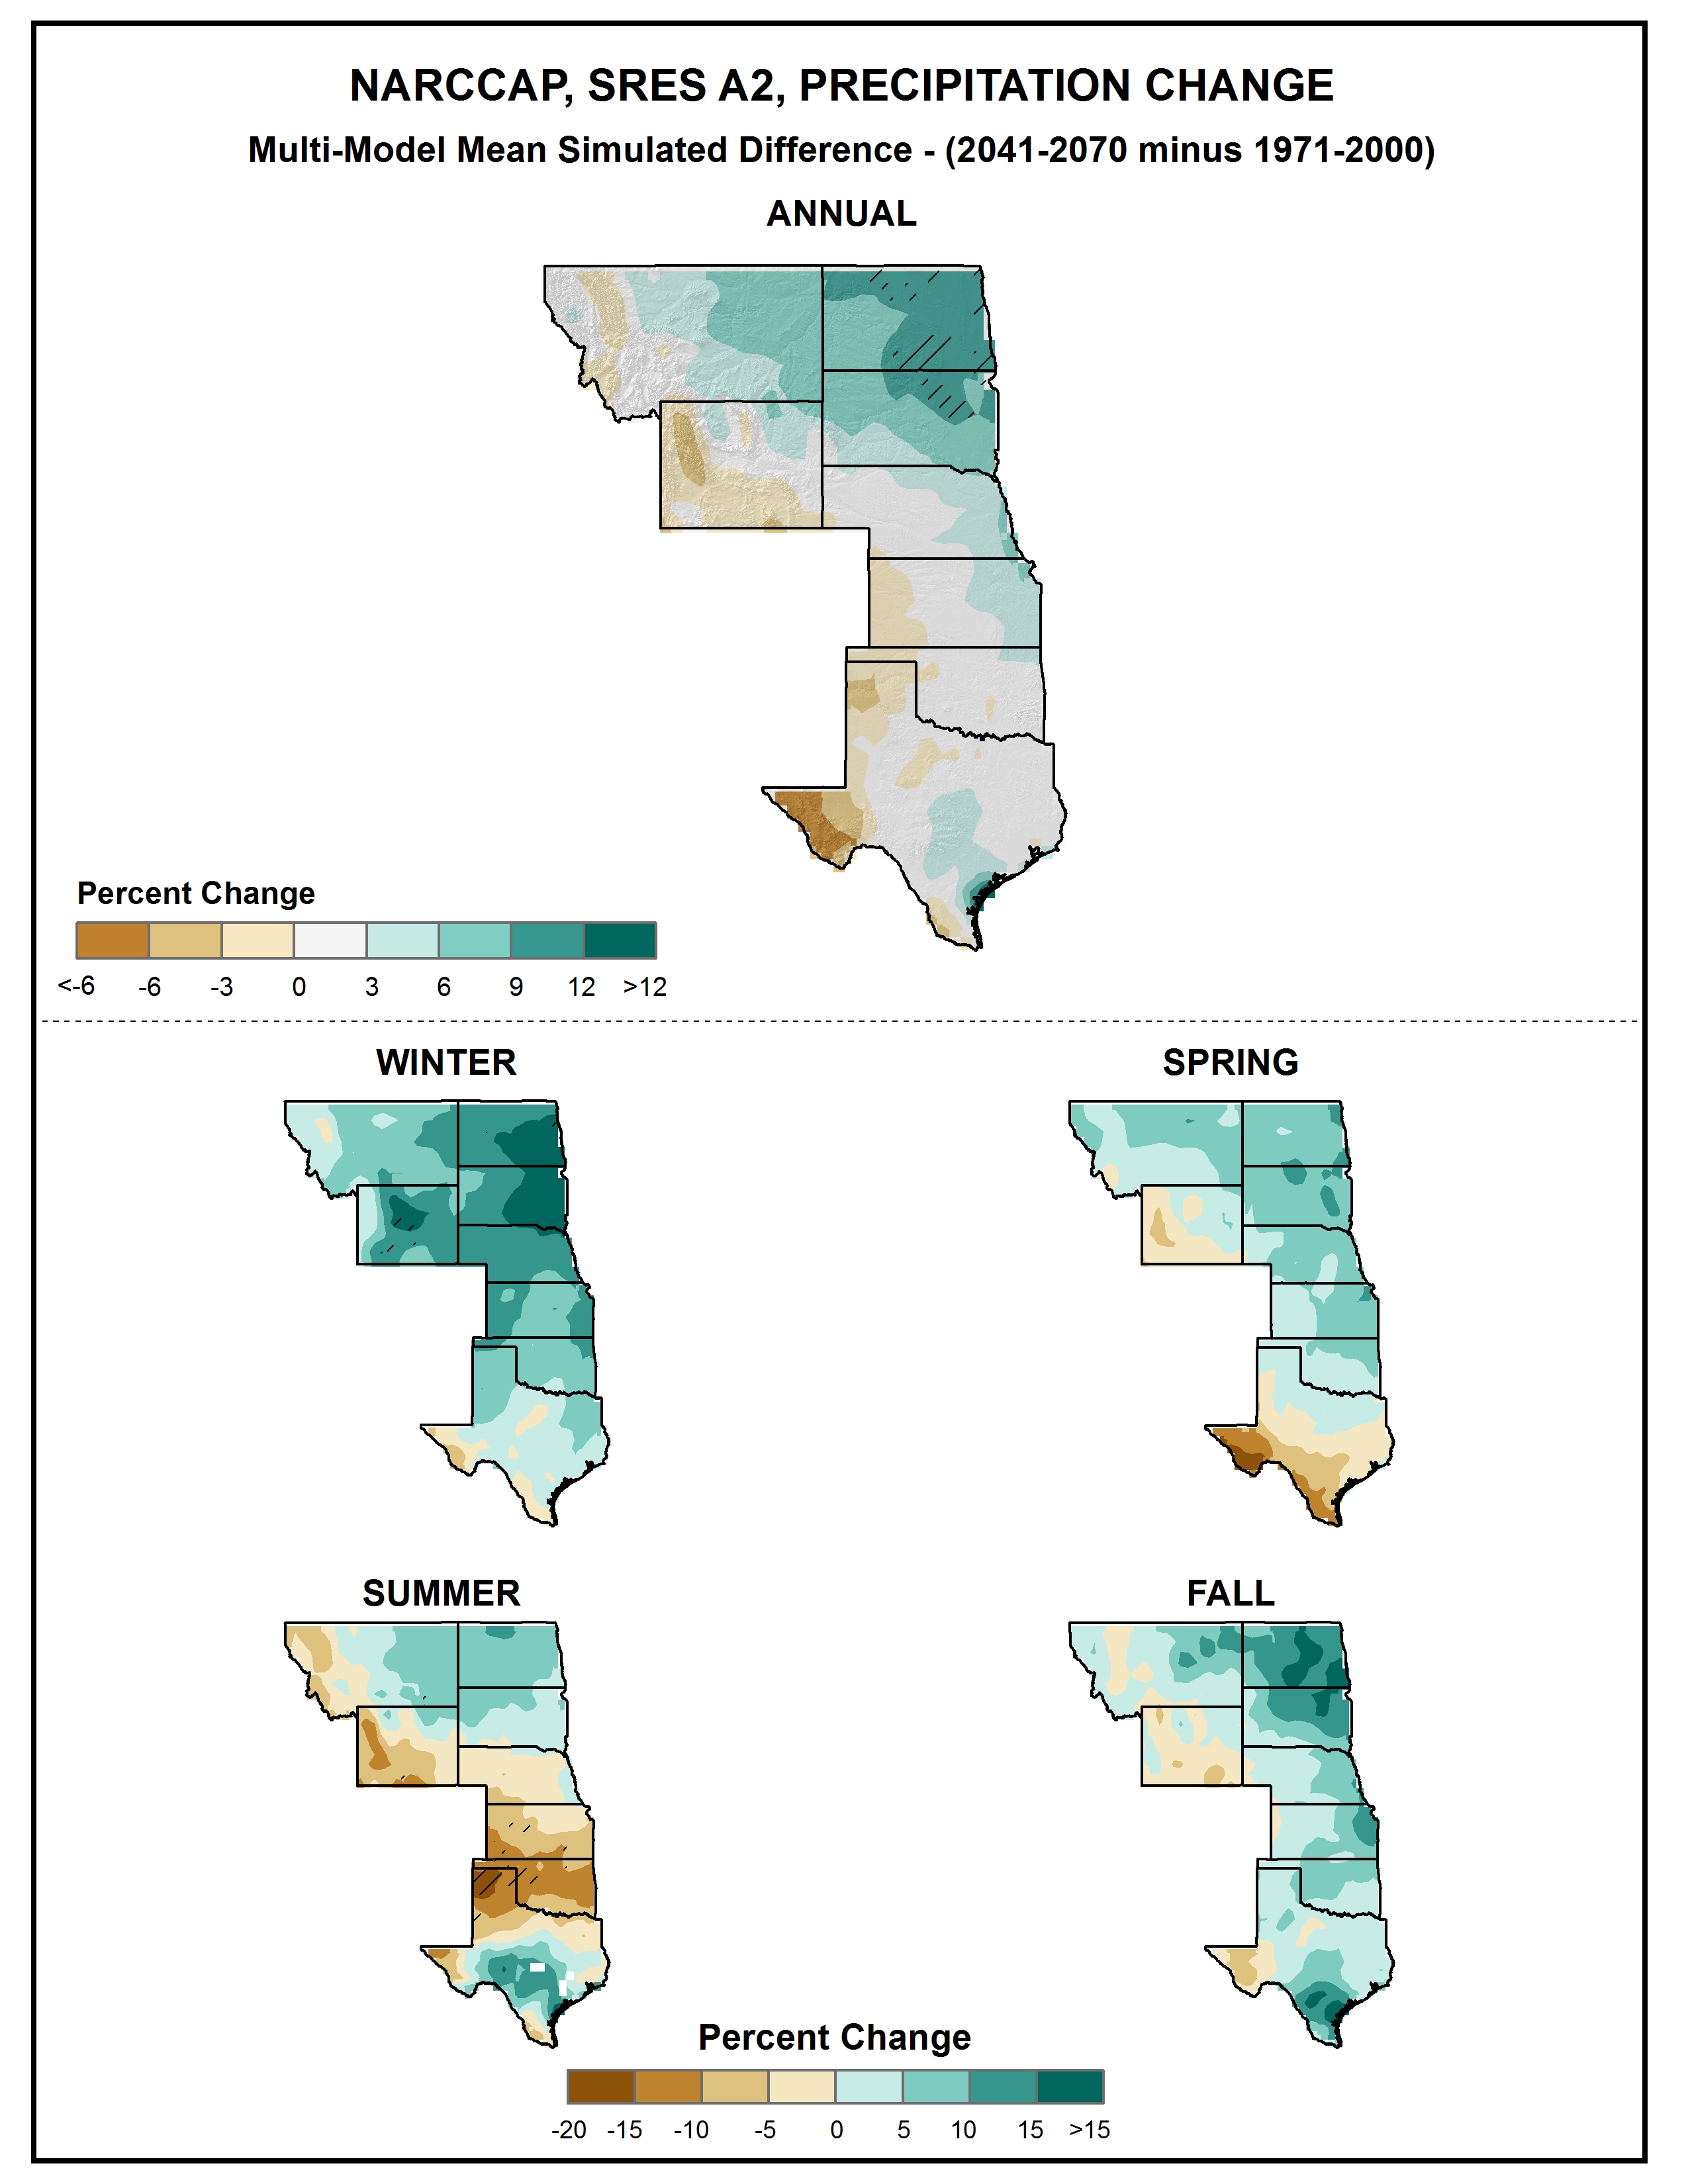
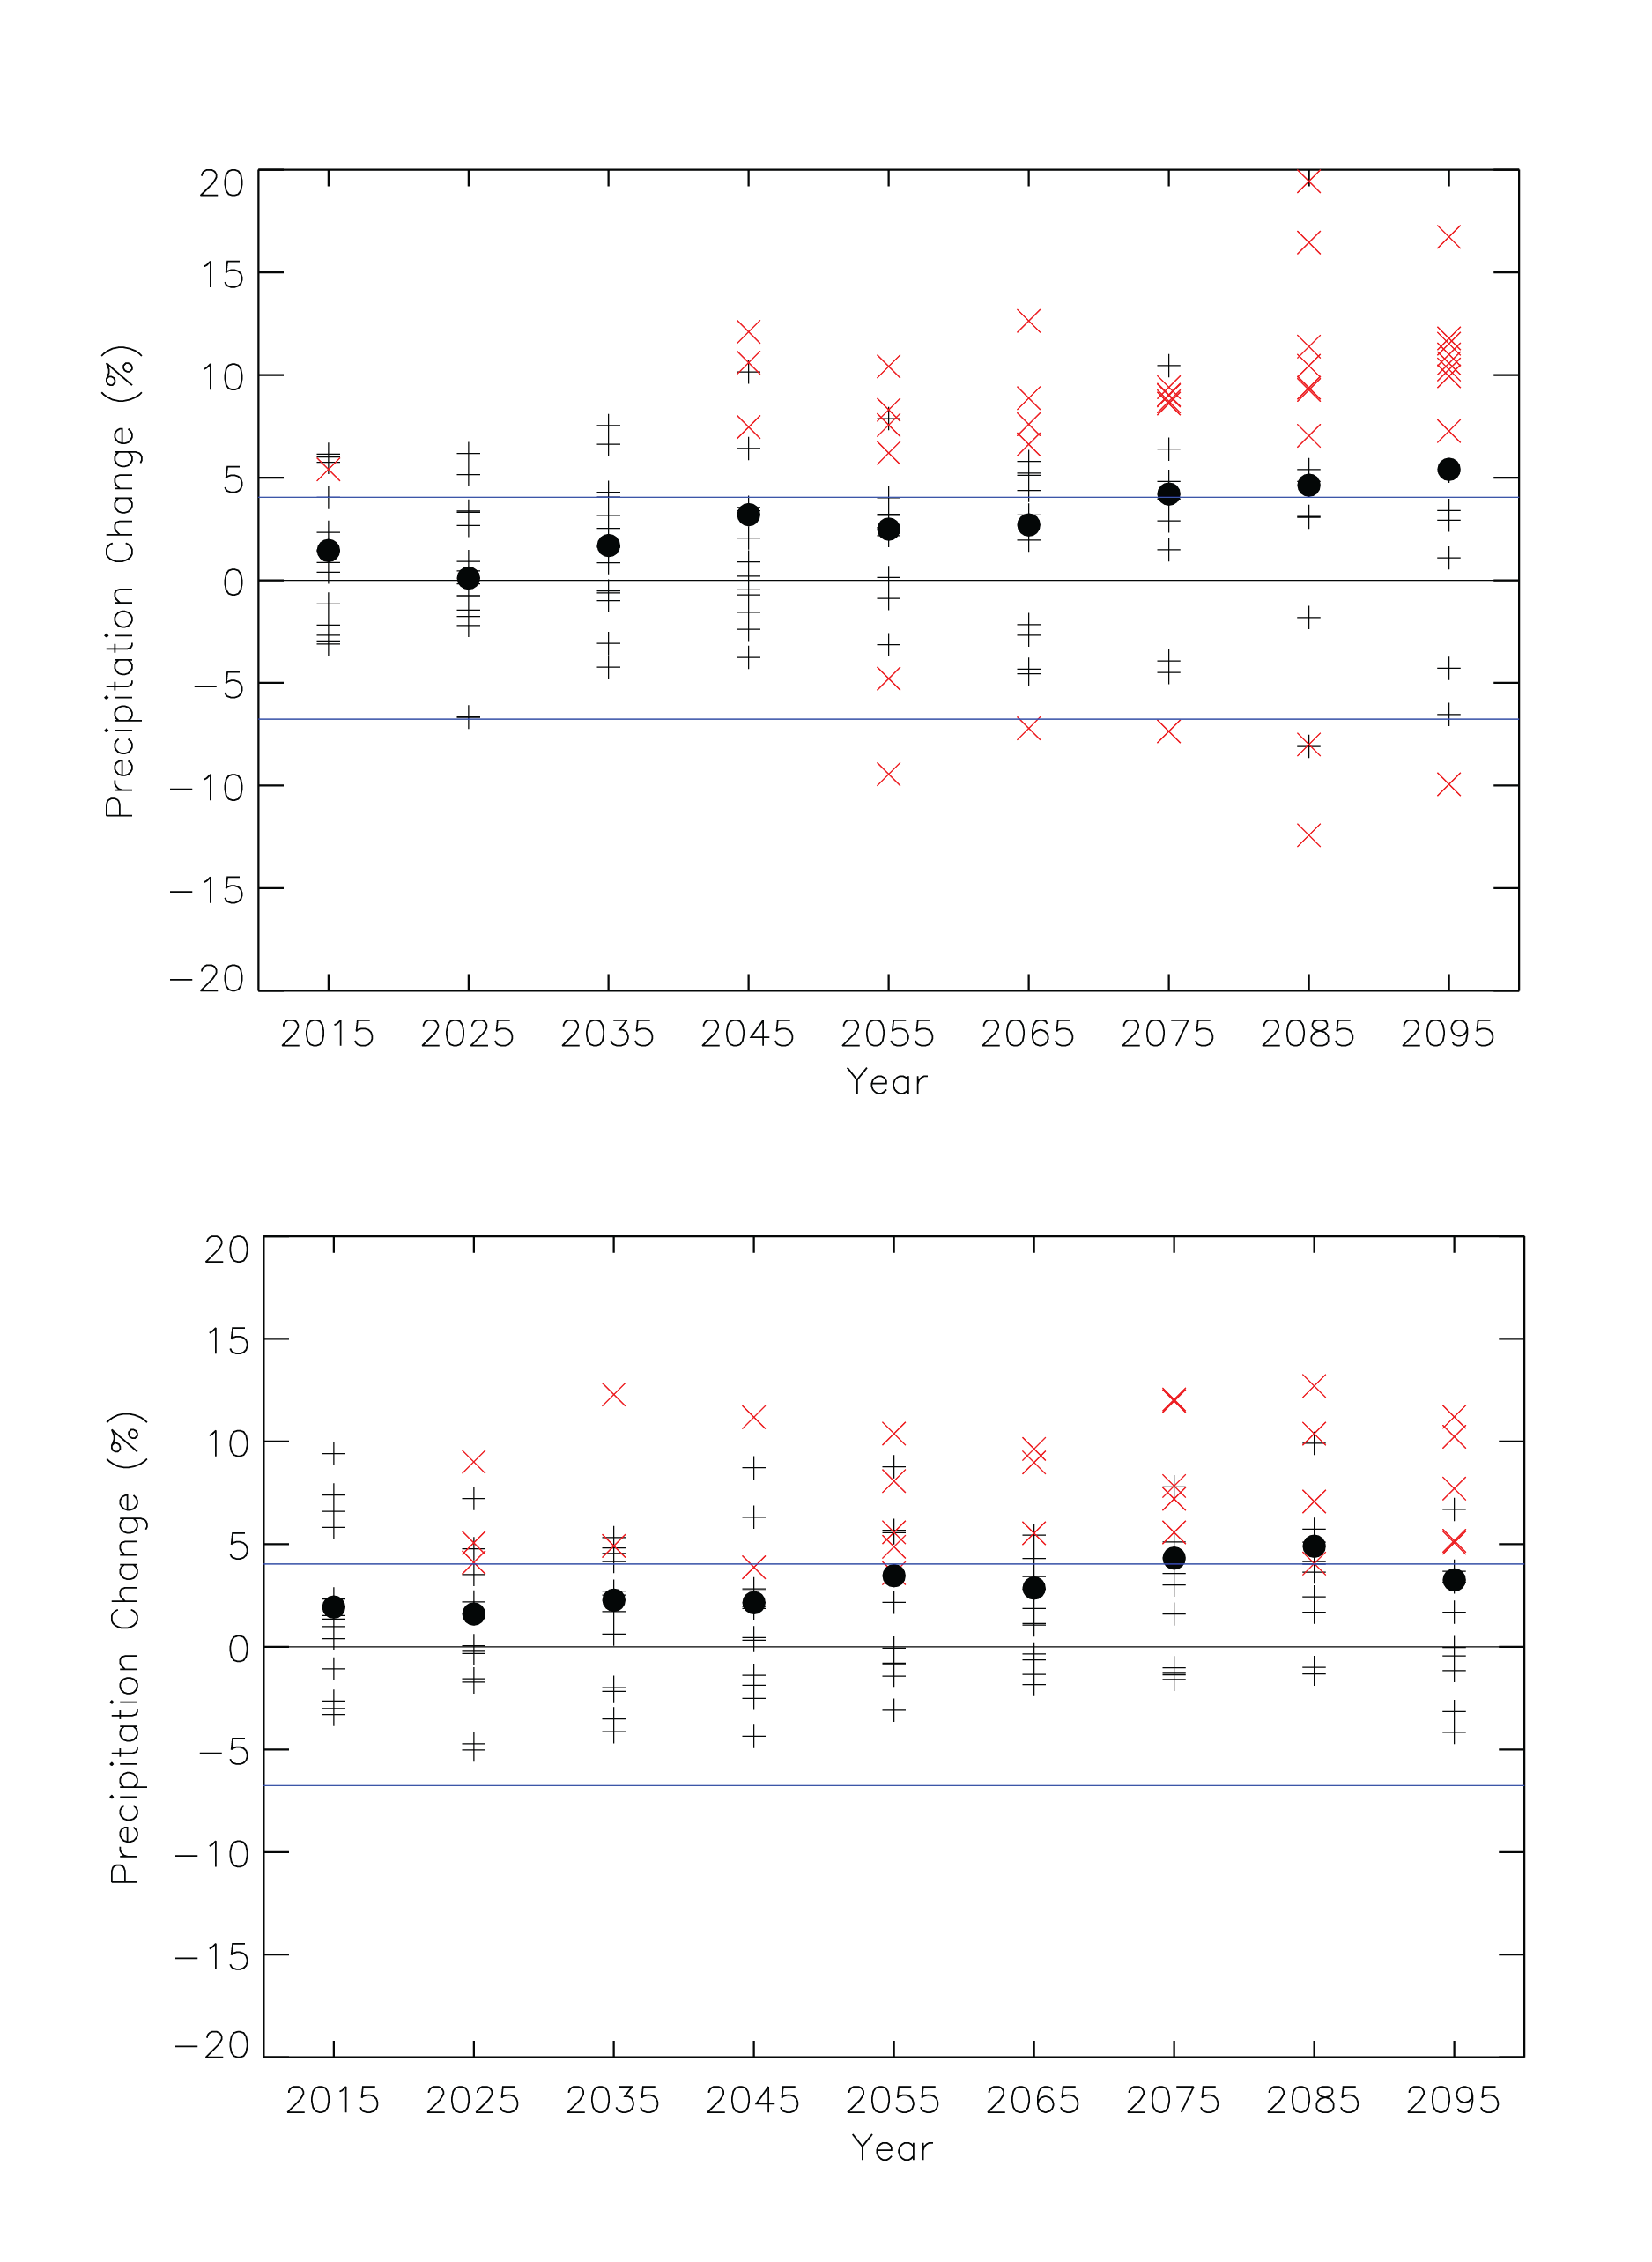
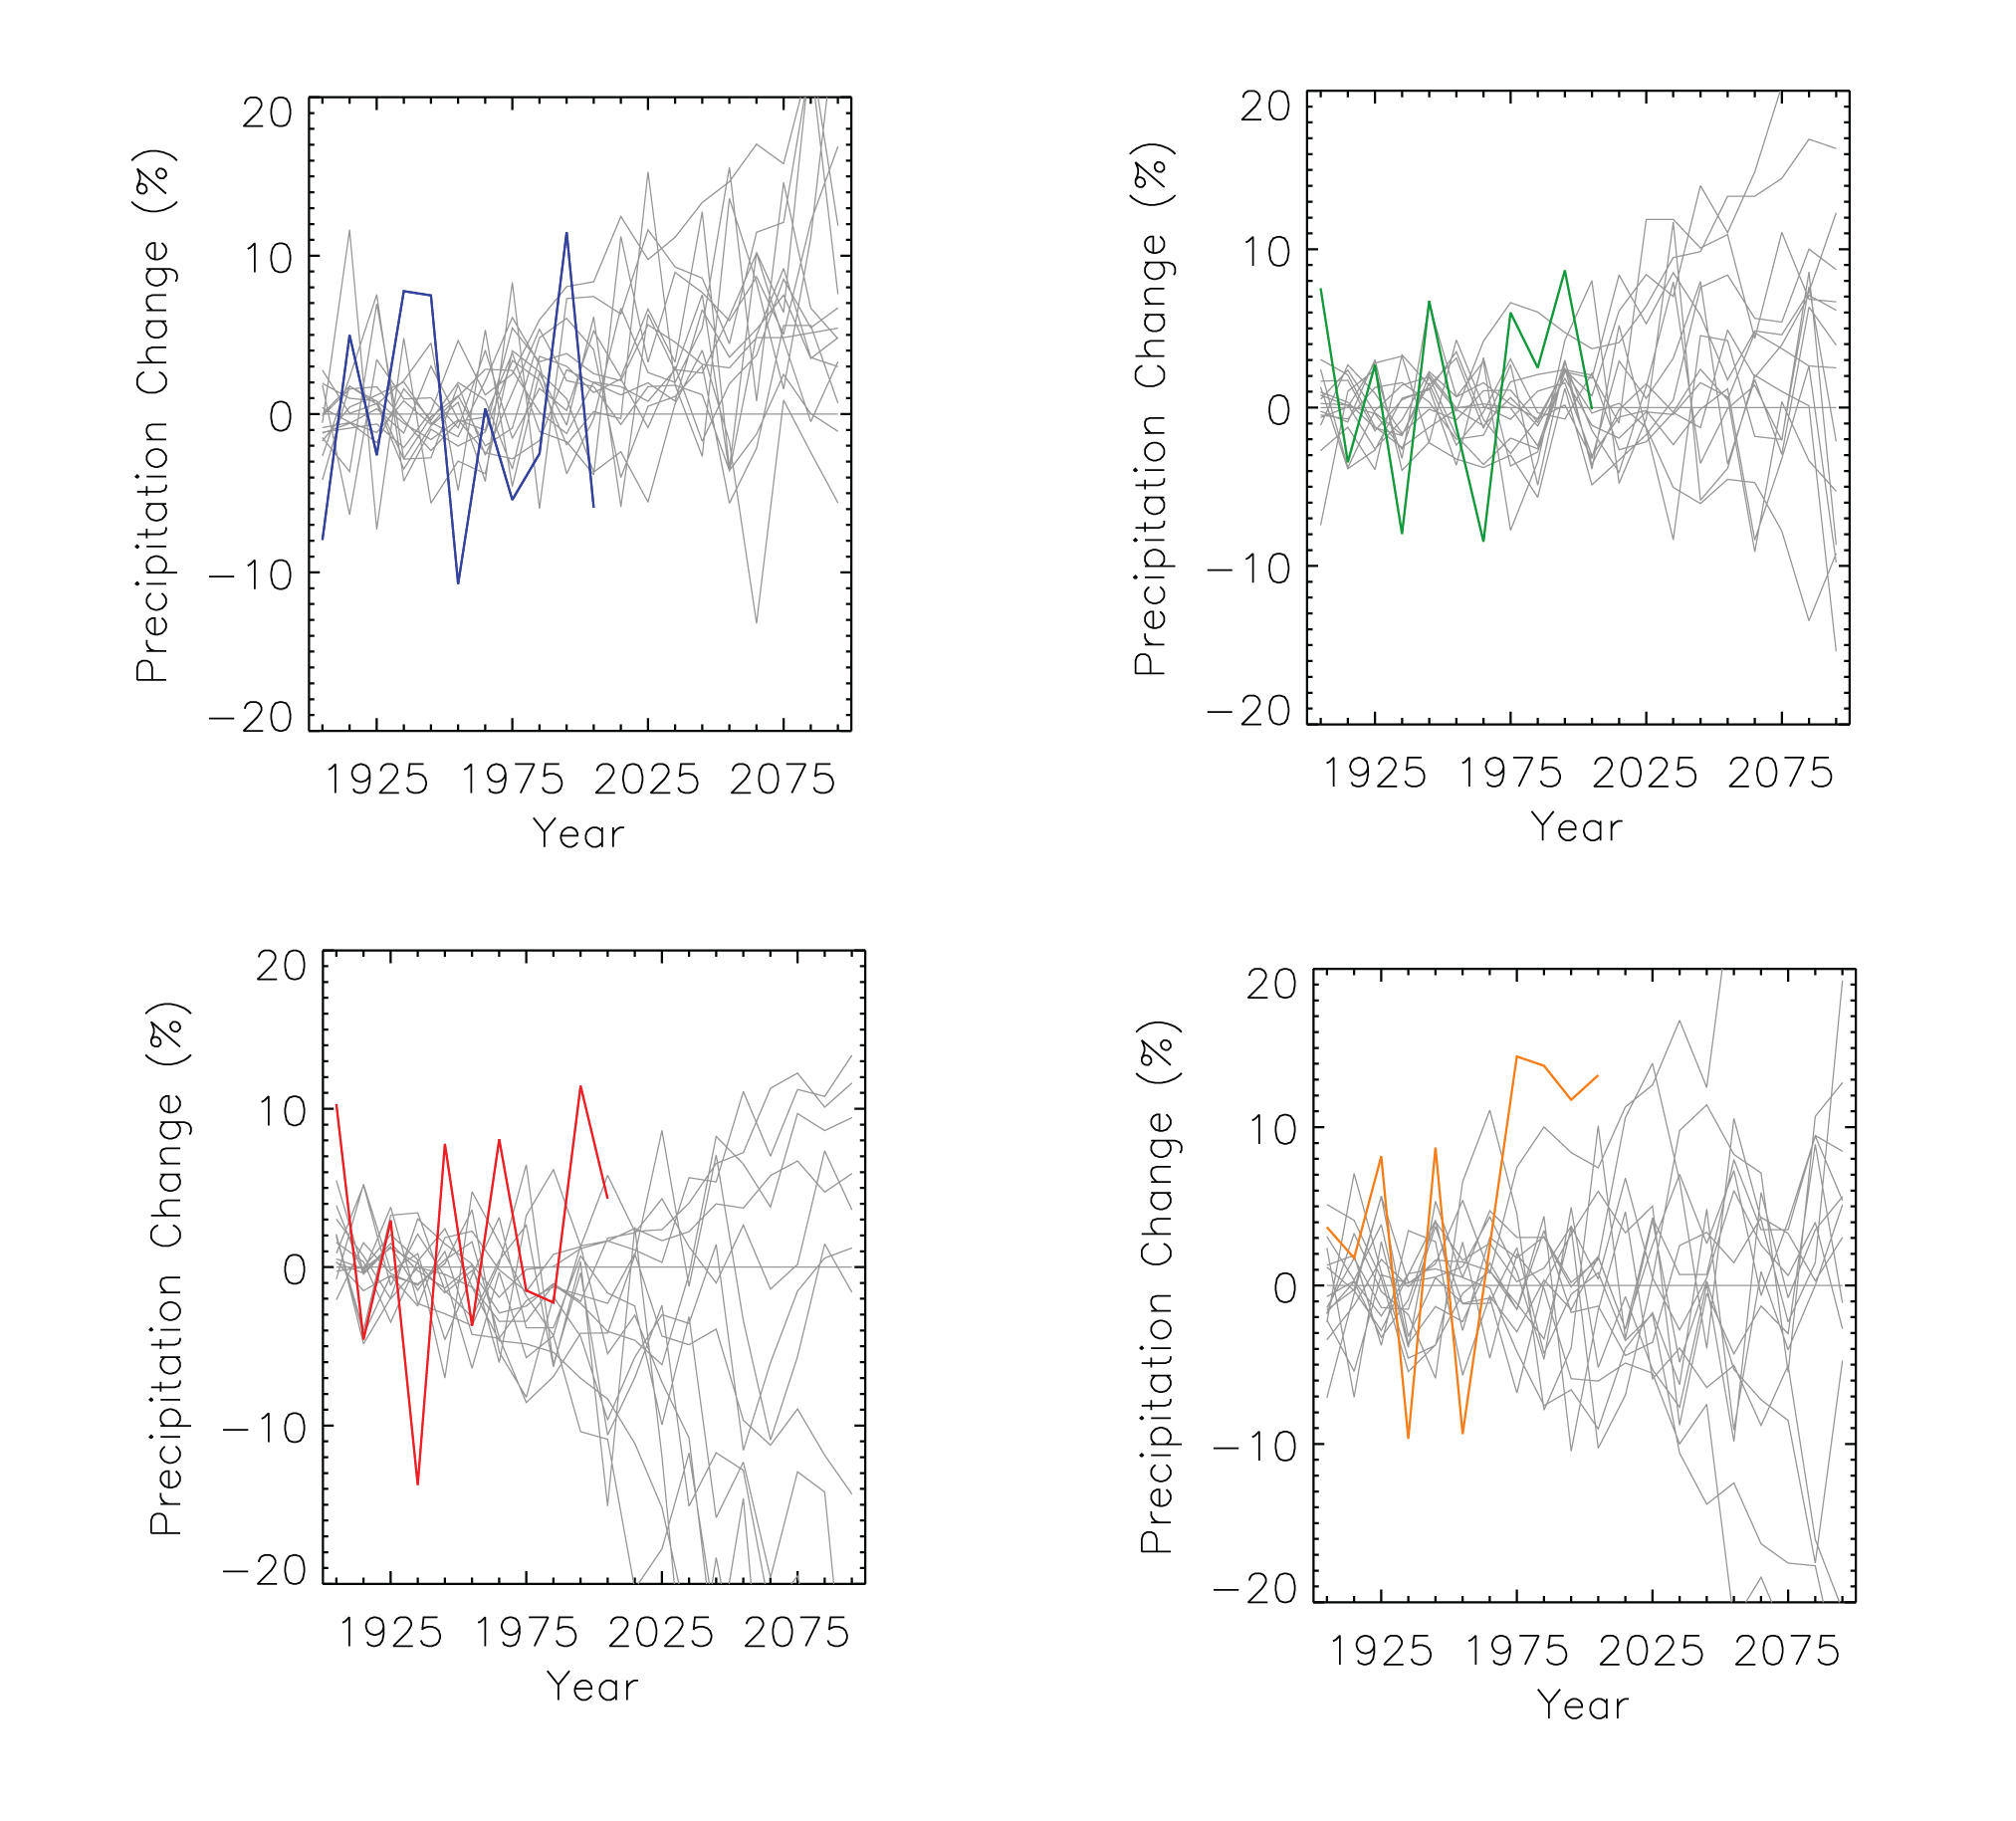
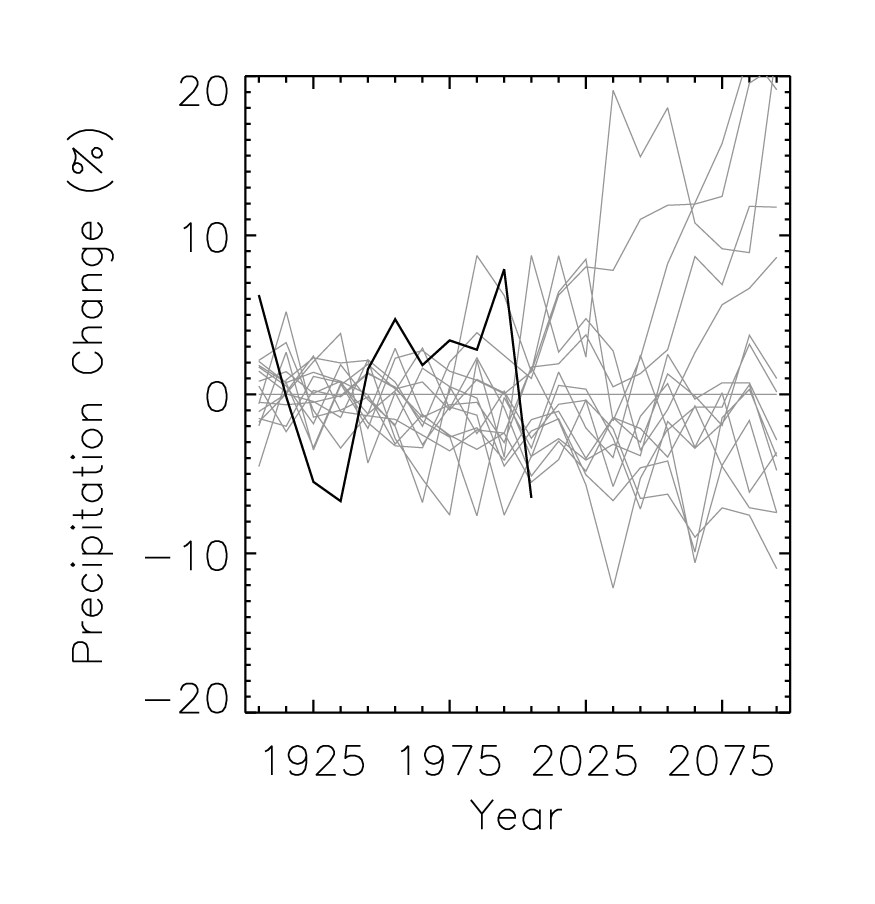
Simulated annual mean precipitation change |
Simulated |
Precipitation |
Great Plains |
Regional Climate Trends and Scenarios for the U.S. National Climate Assessment. Part 4. Climate of the U.S. Great Plains |
NCA 3 |
 |
|
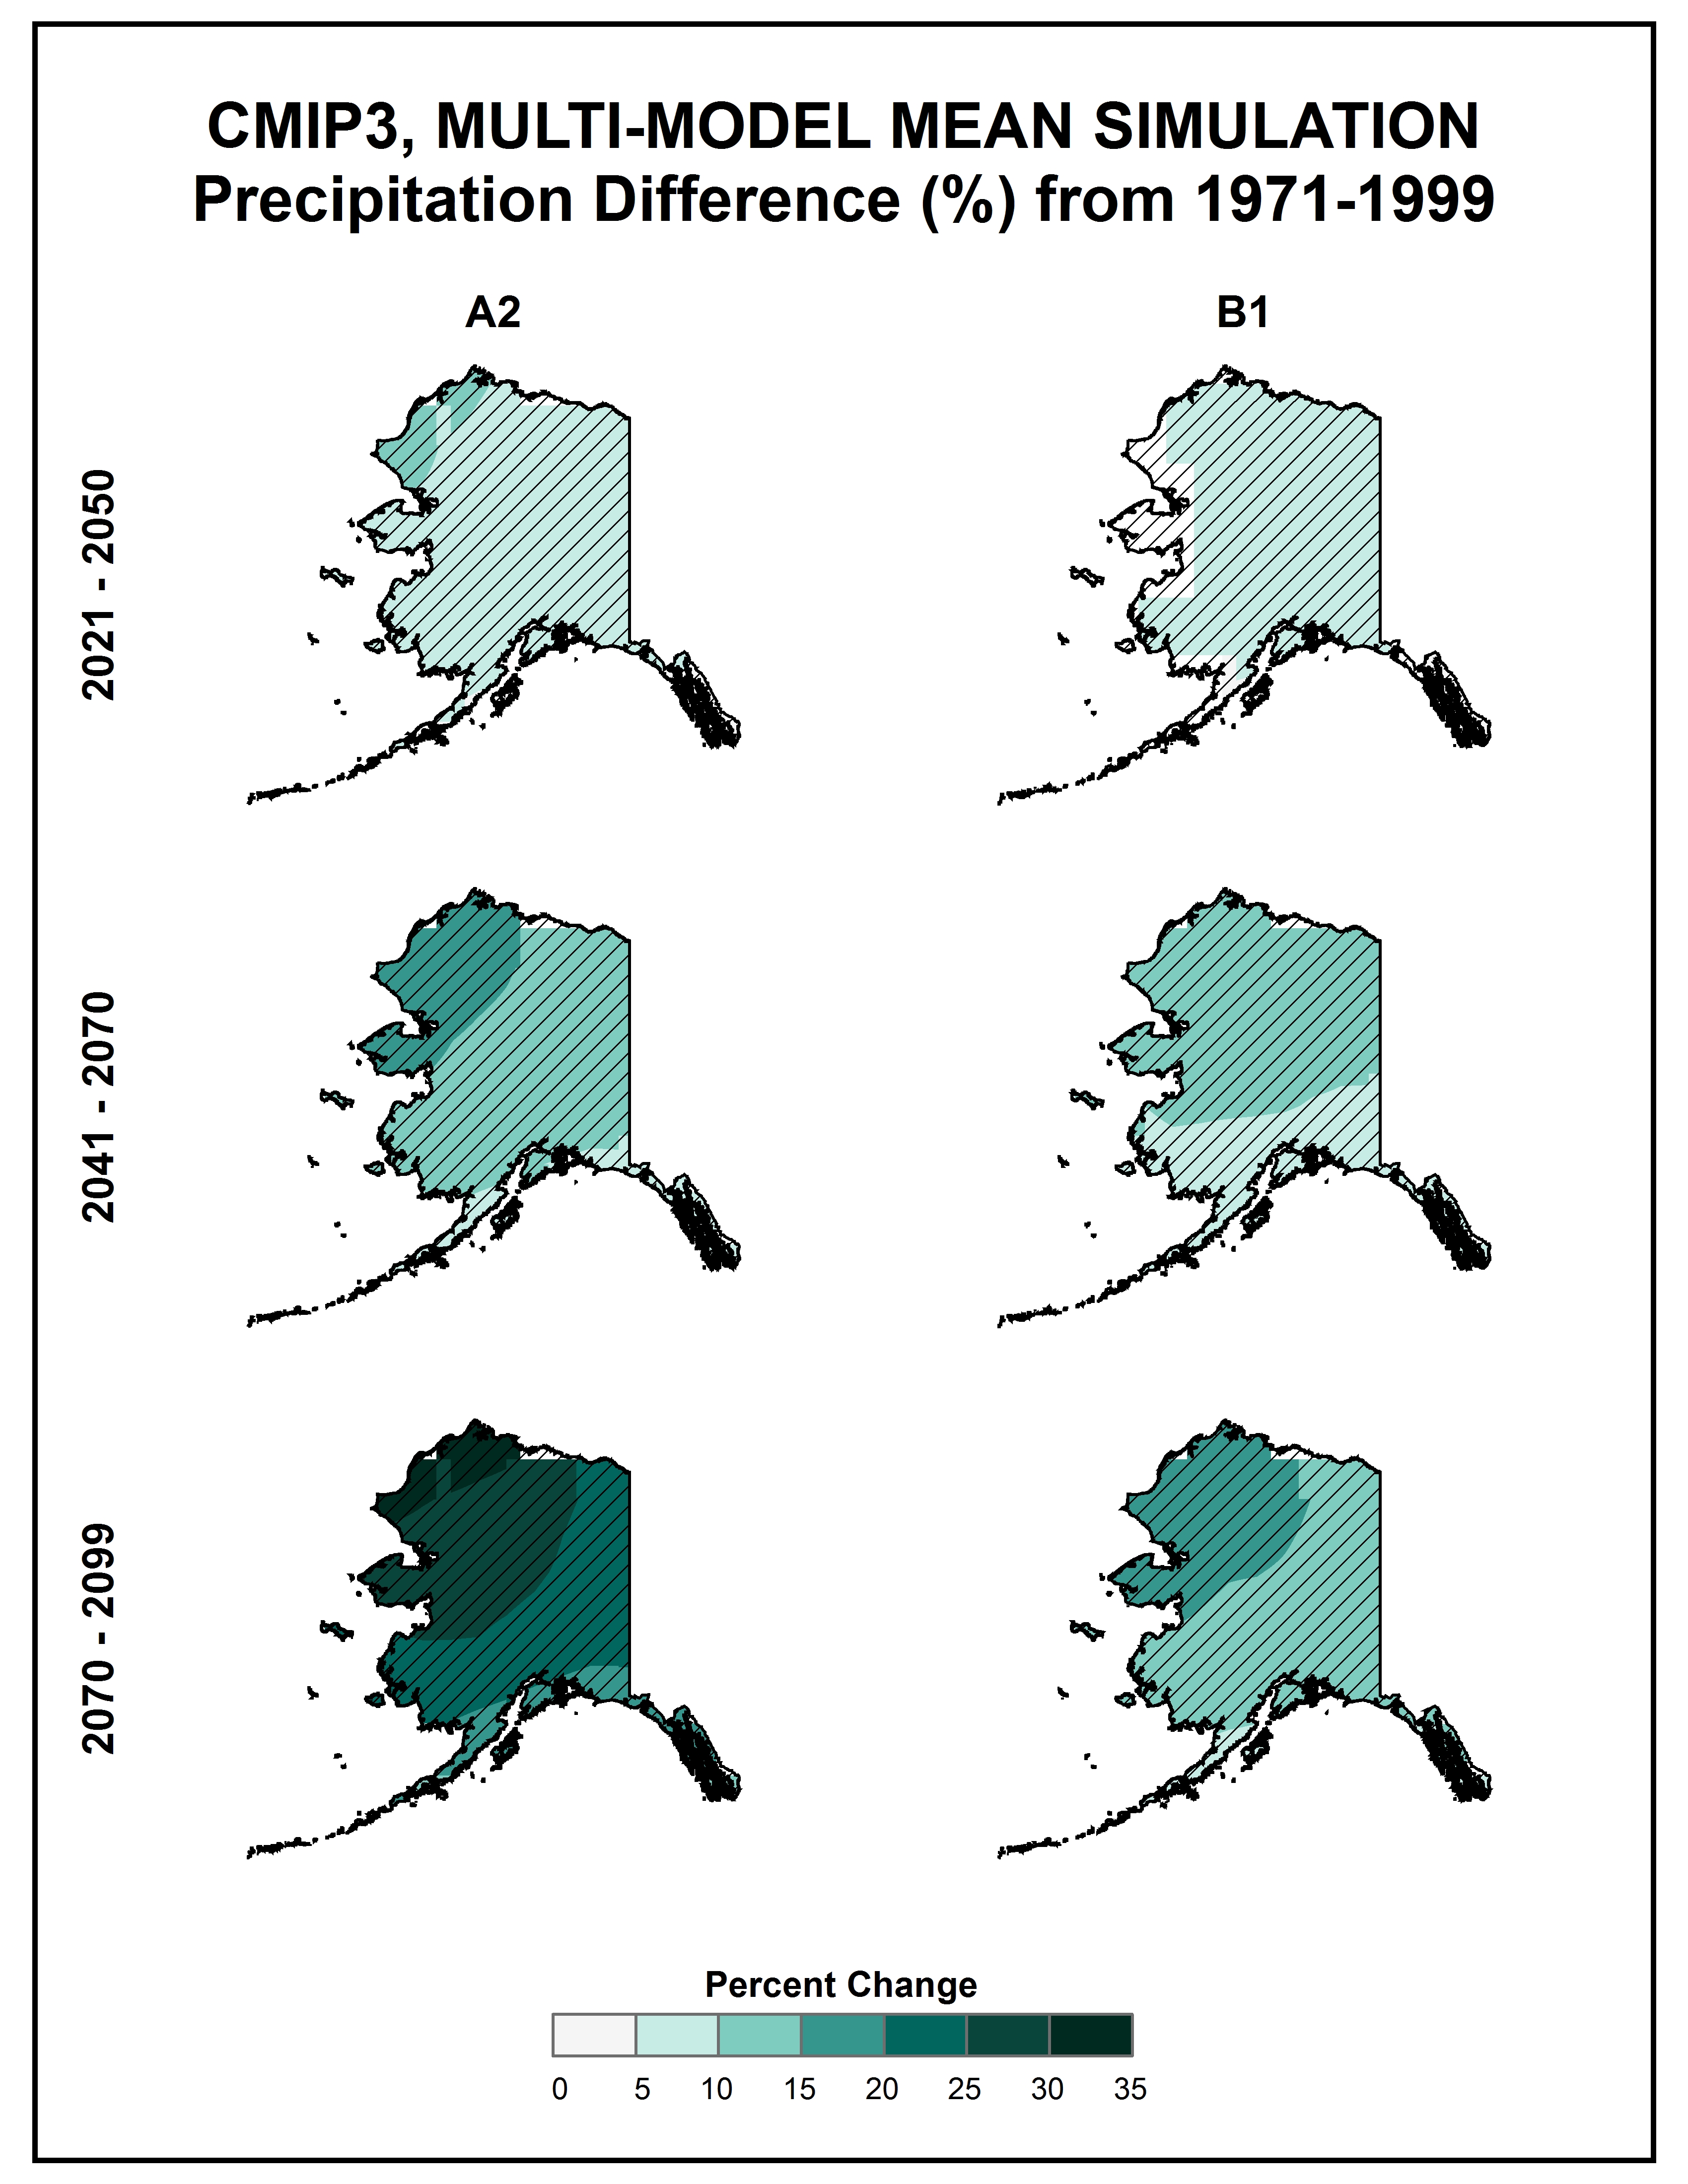
Simulated annual mean precipitation change |
Simulated |
Precipitation |
Alaska and Arctic |
Regional Climate Trends and Scenarios for the U.S. National Climate Assessment. Part 7. Climate of Alaska |
NCA 3 |
 |
|
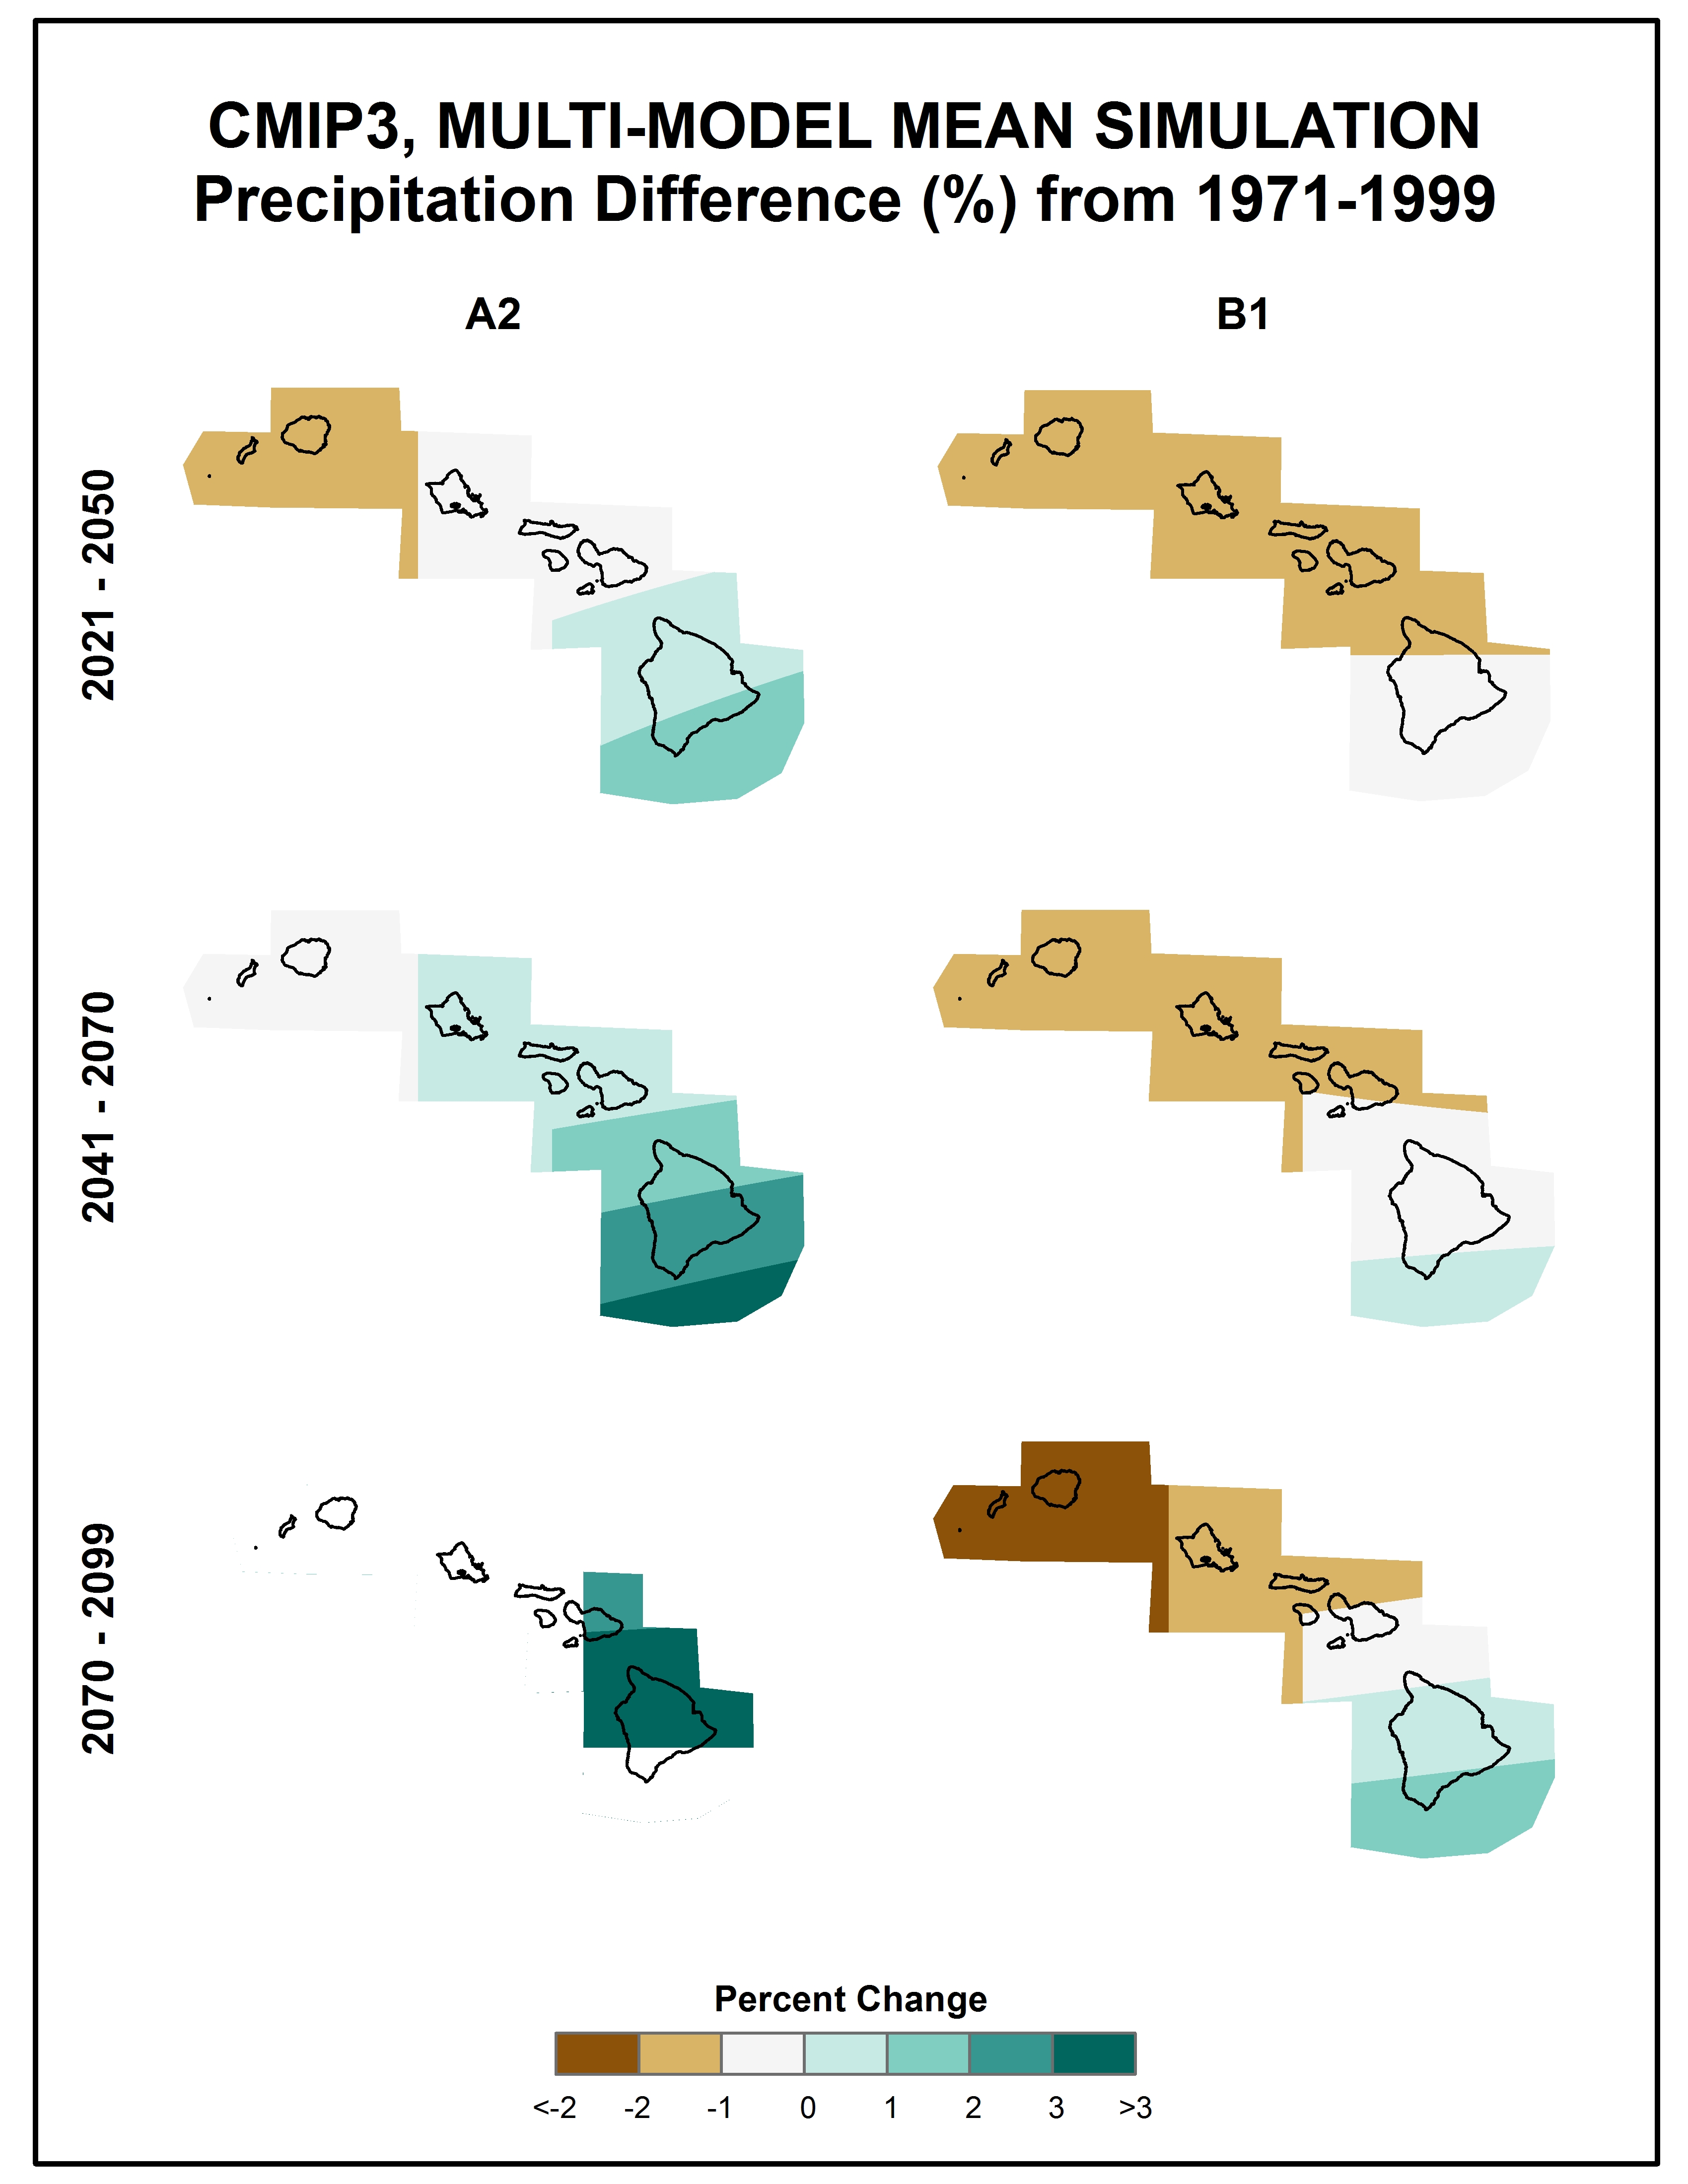
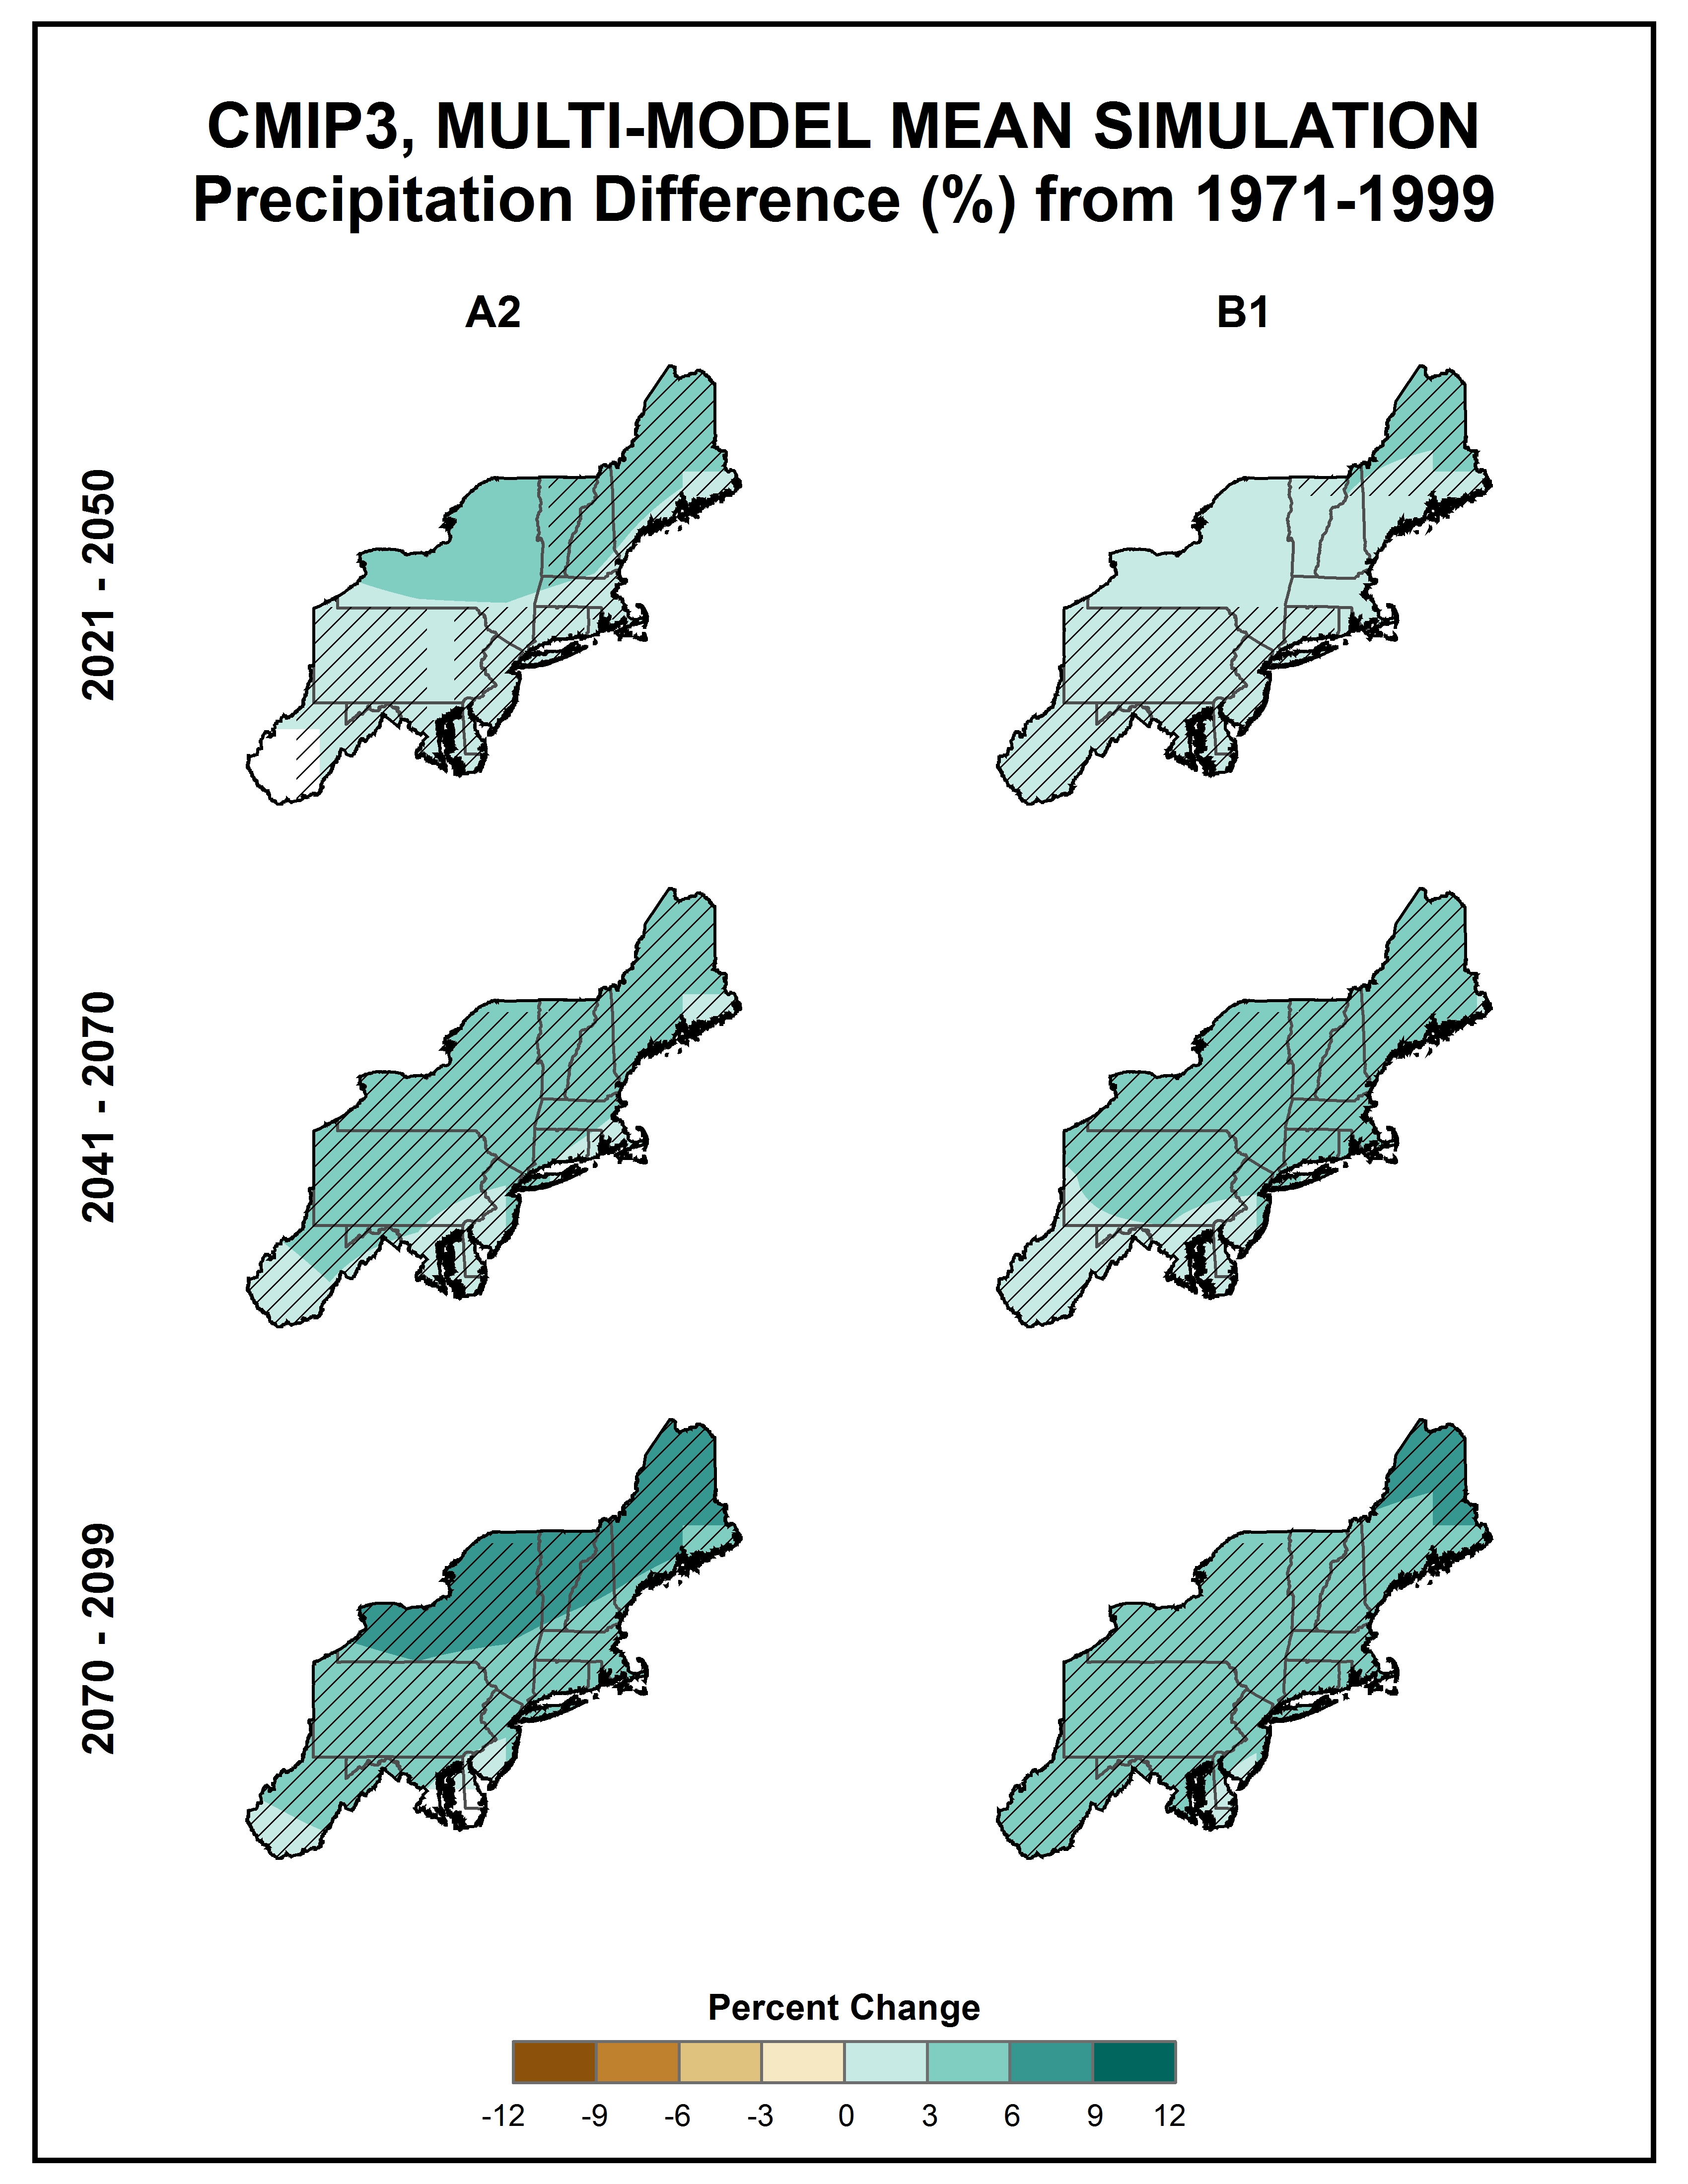
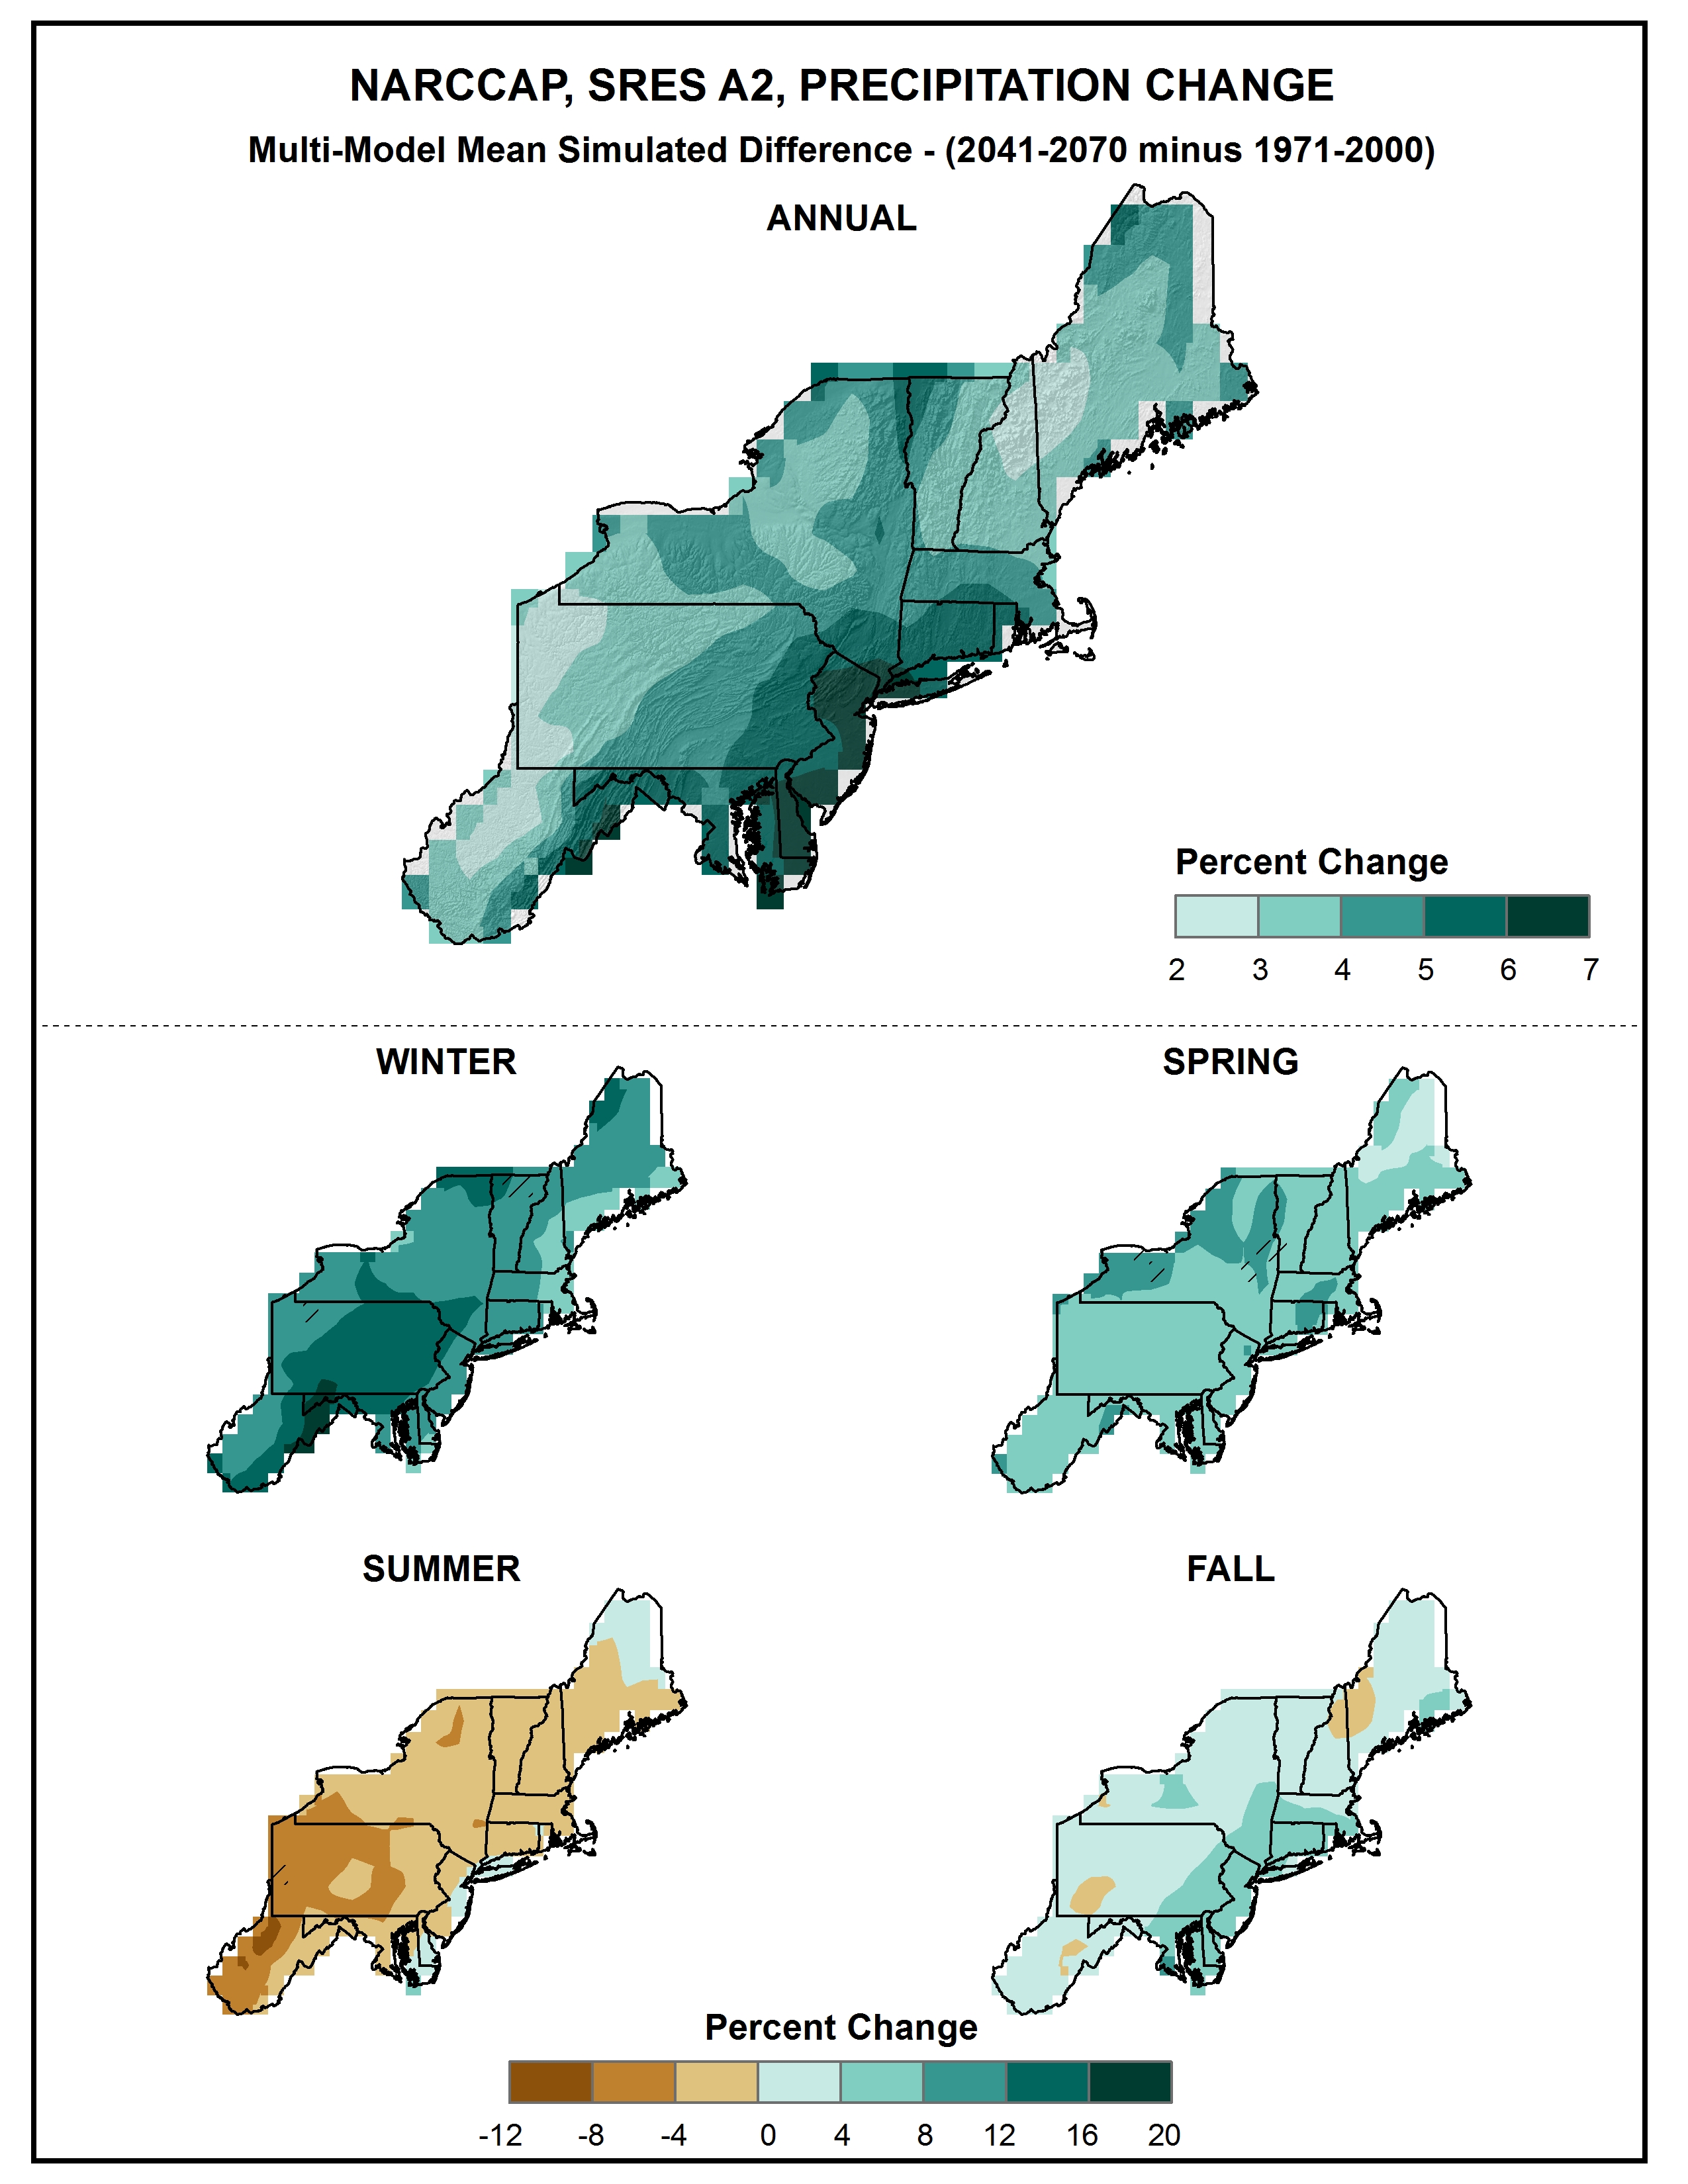
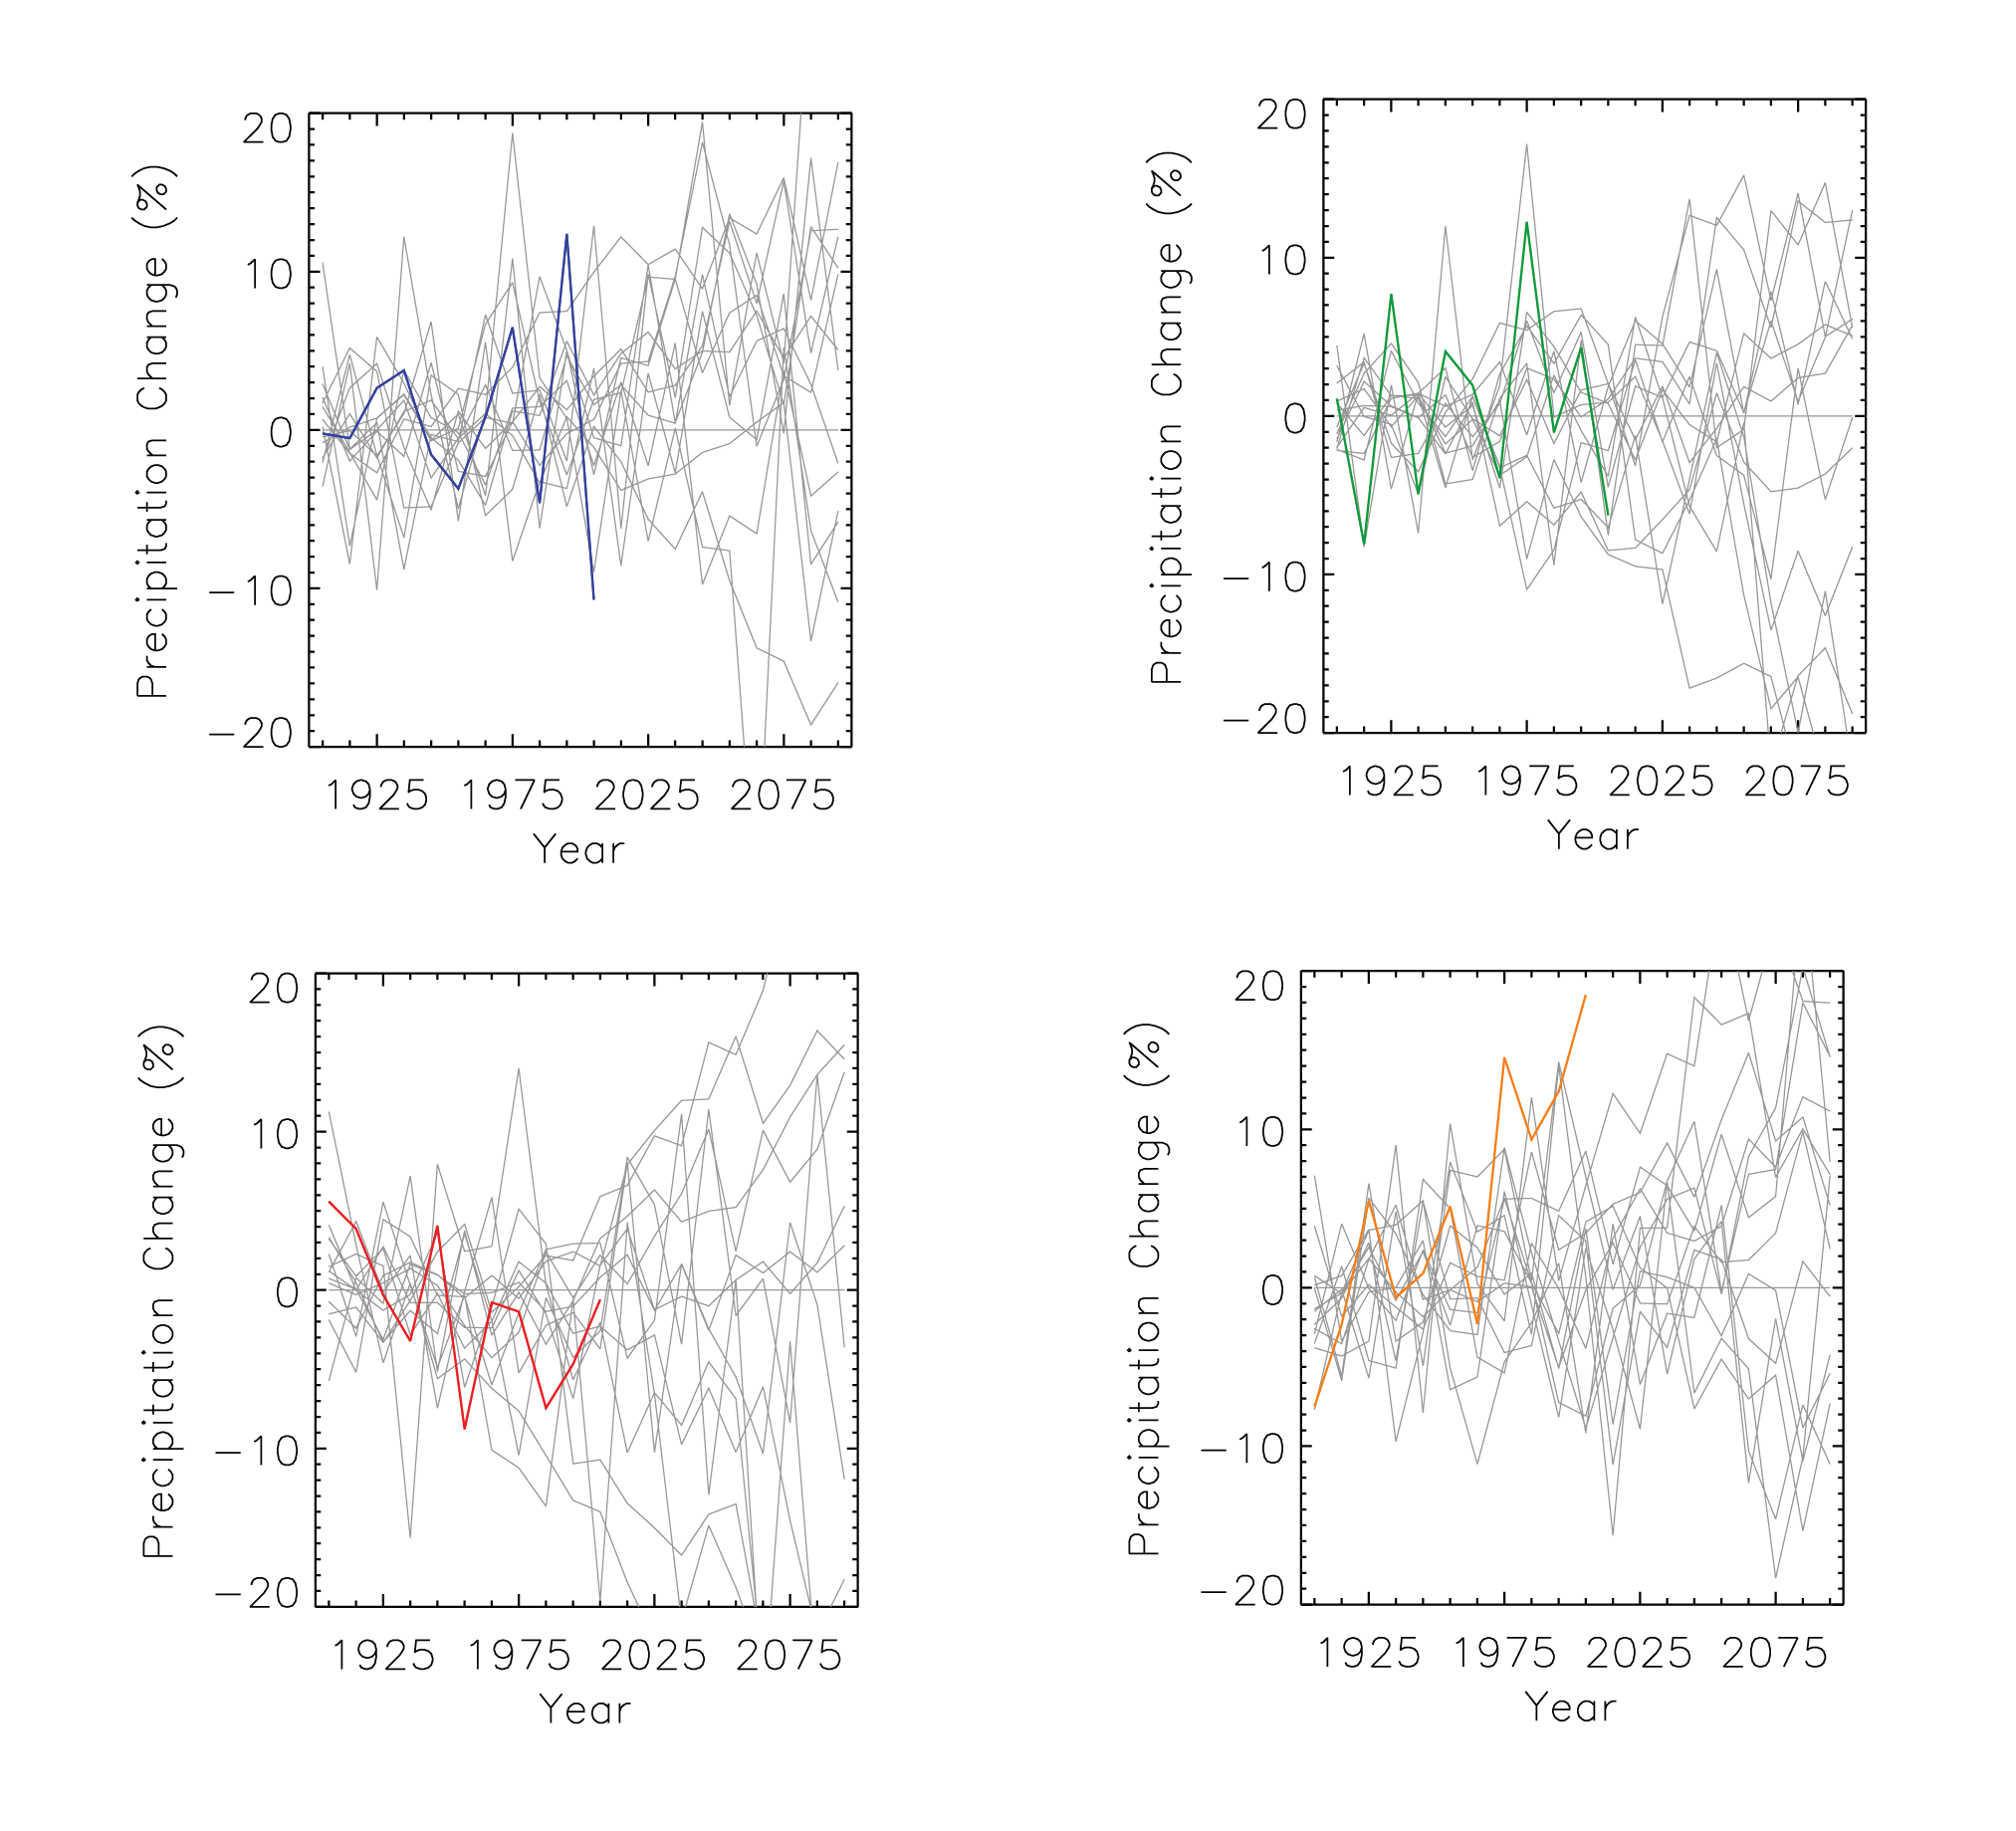
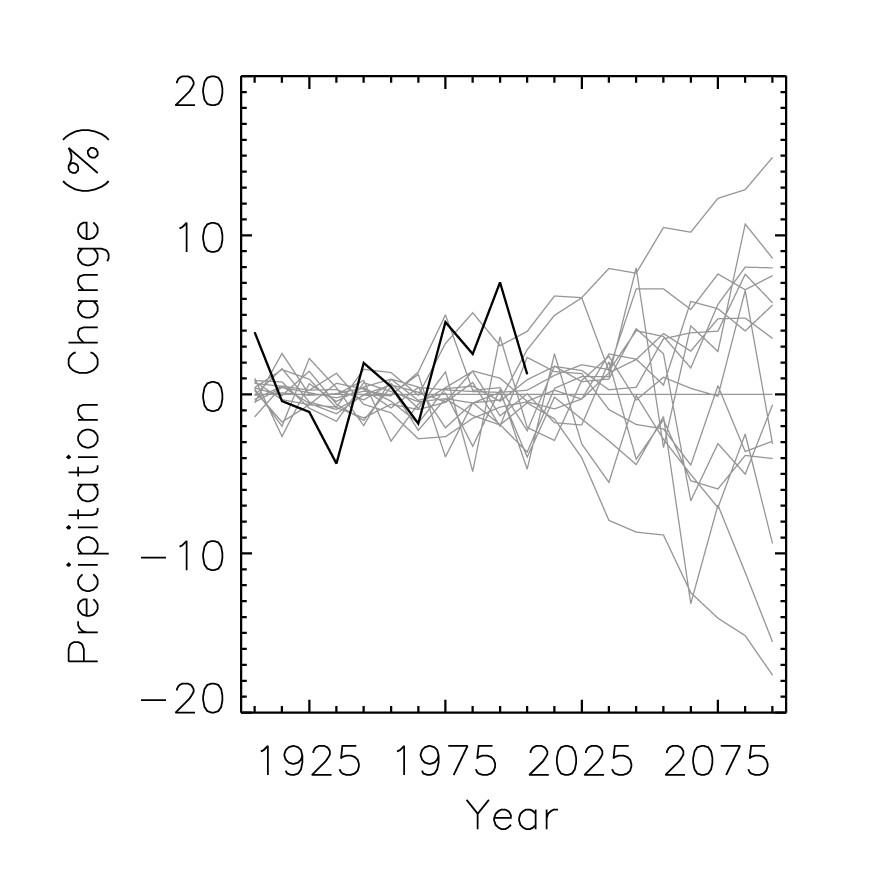
Simulated annual mean precipitation change |
Simulated |
Precipitation |
Northeast |
Regional Climate Trends and Scenarios for the U.S. National Climate Assessment. Part 1. Climate of the Northeast U.S. |
NCA 3 |
 |
|
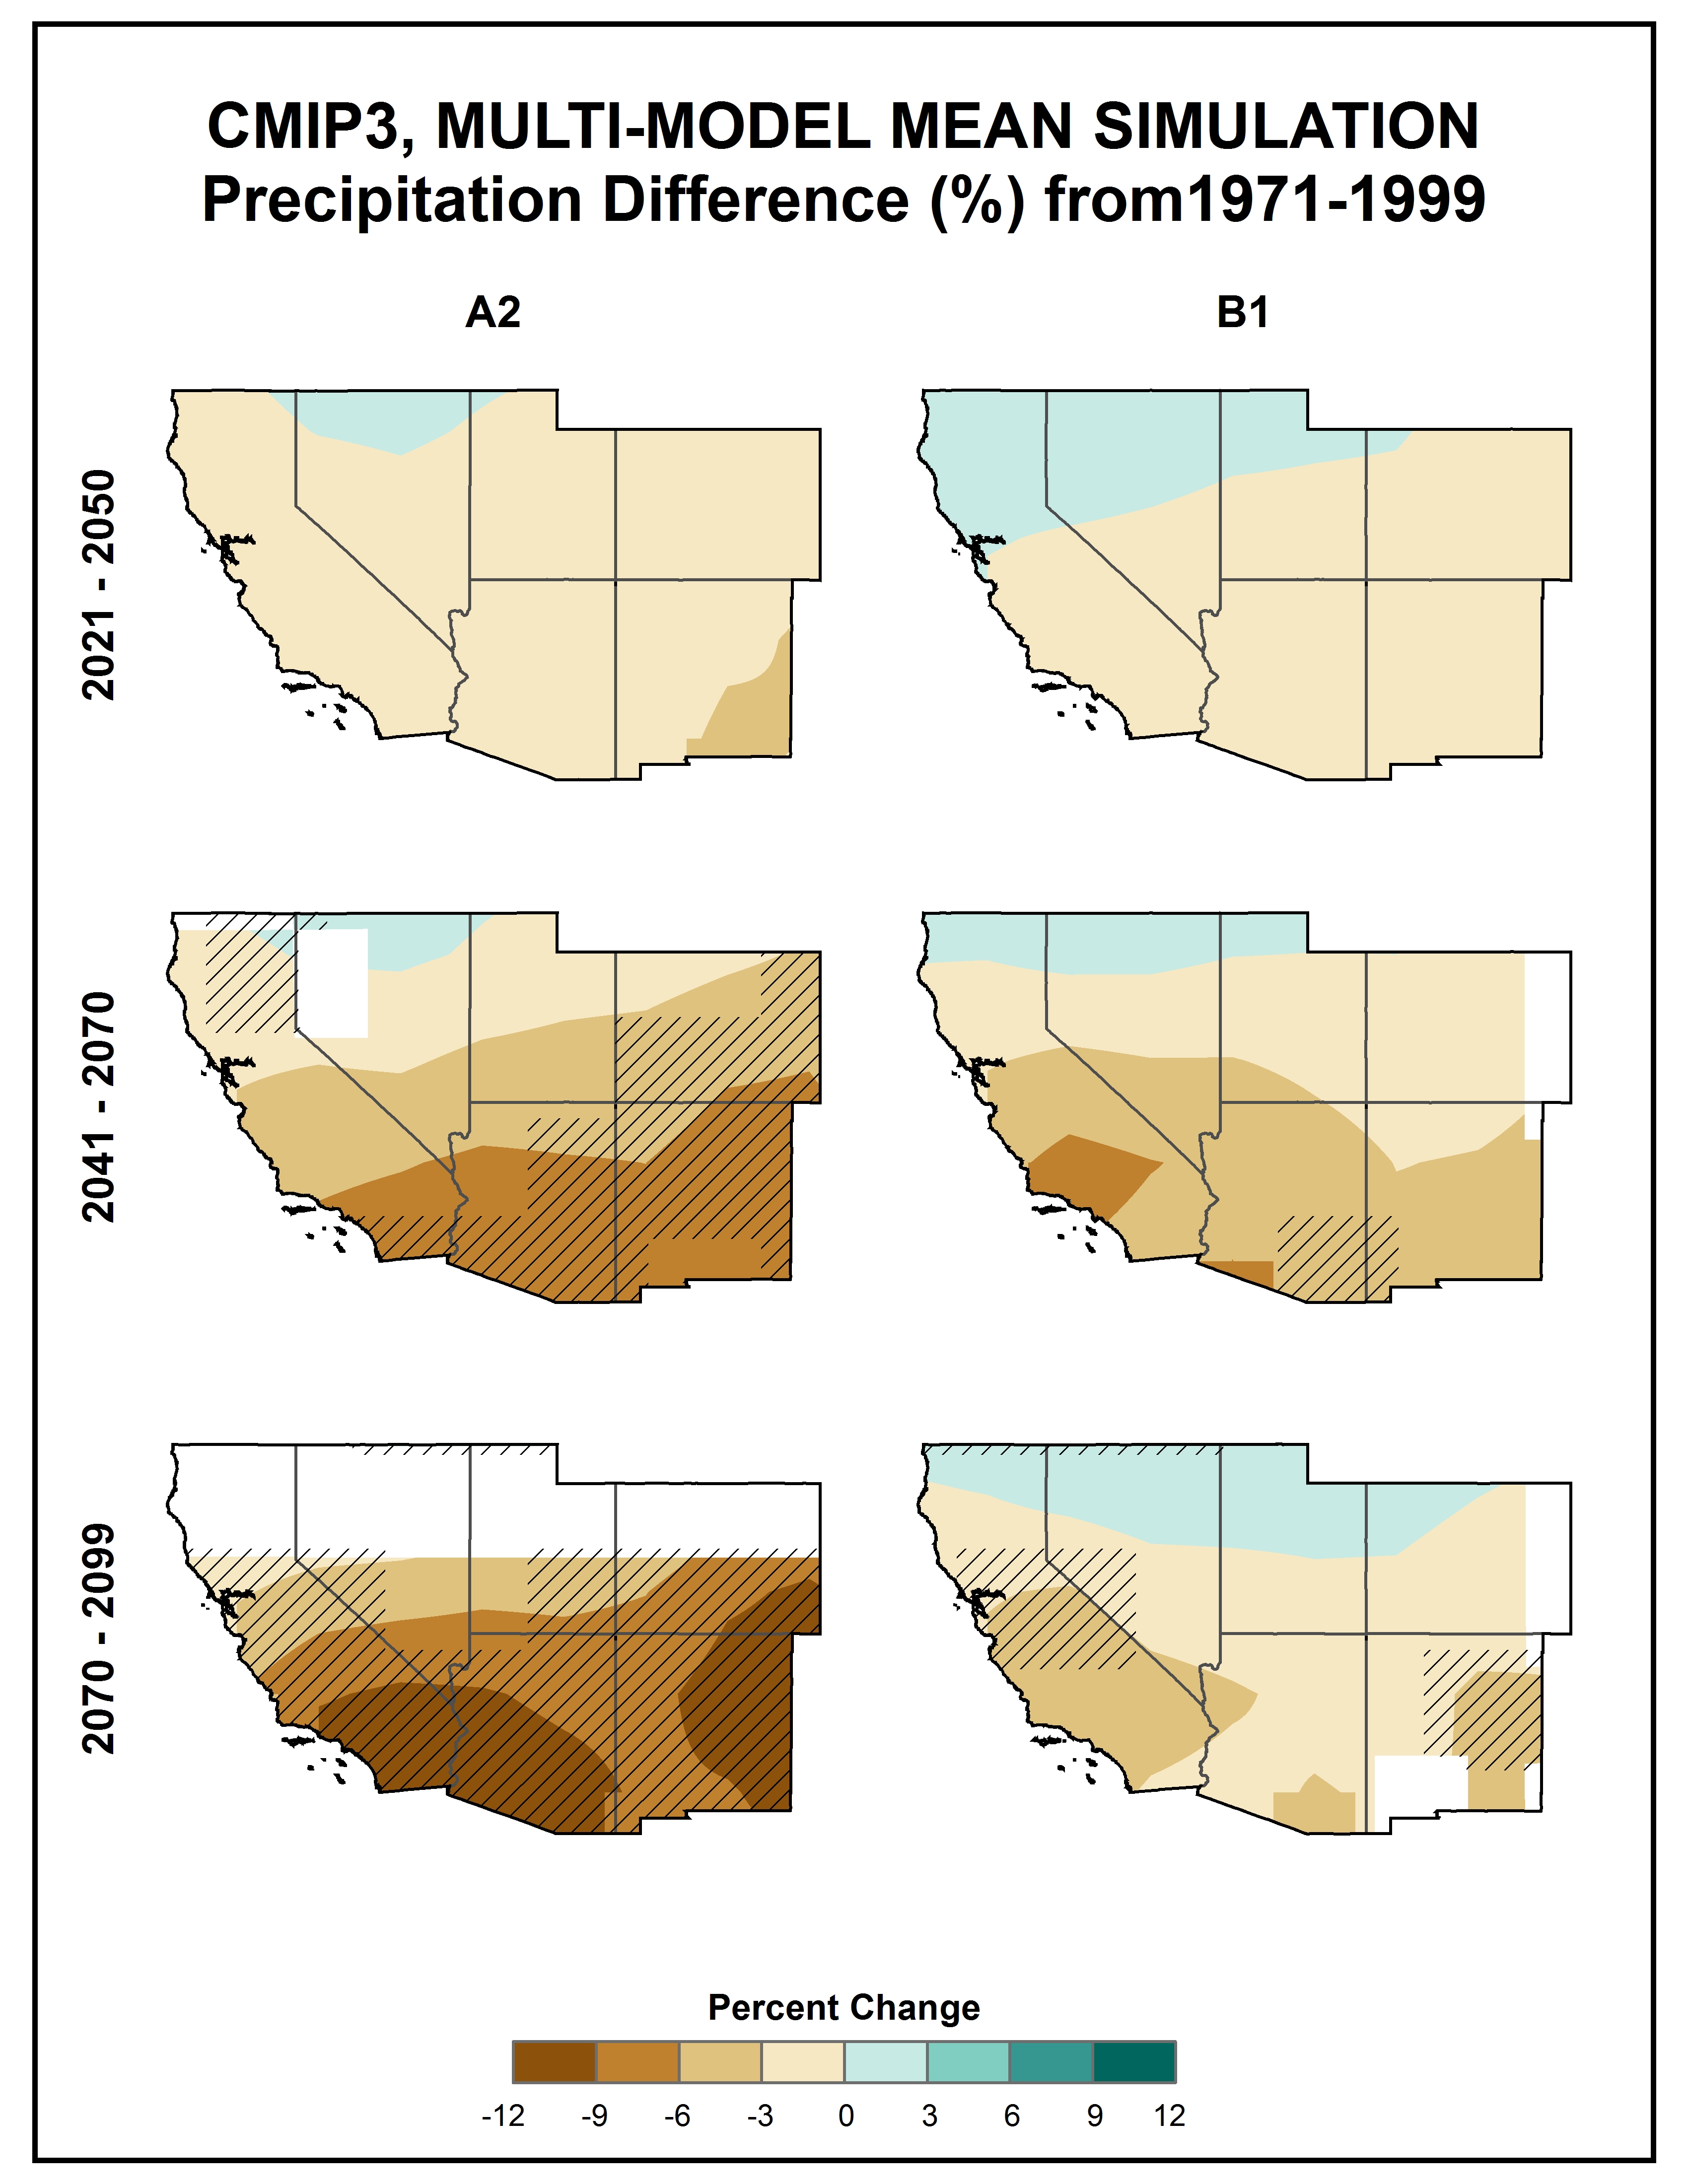
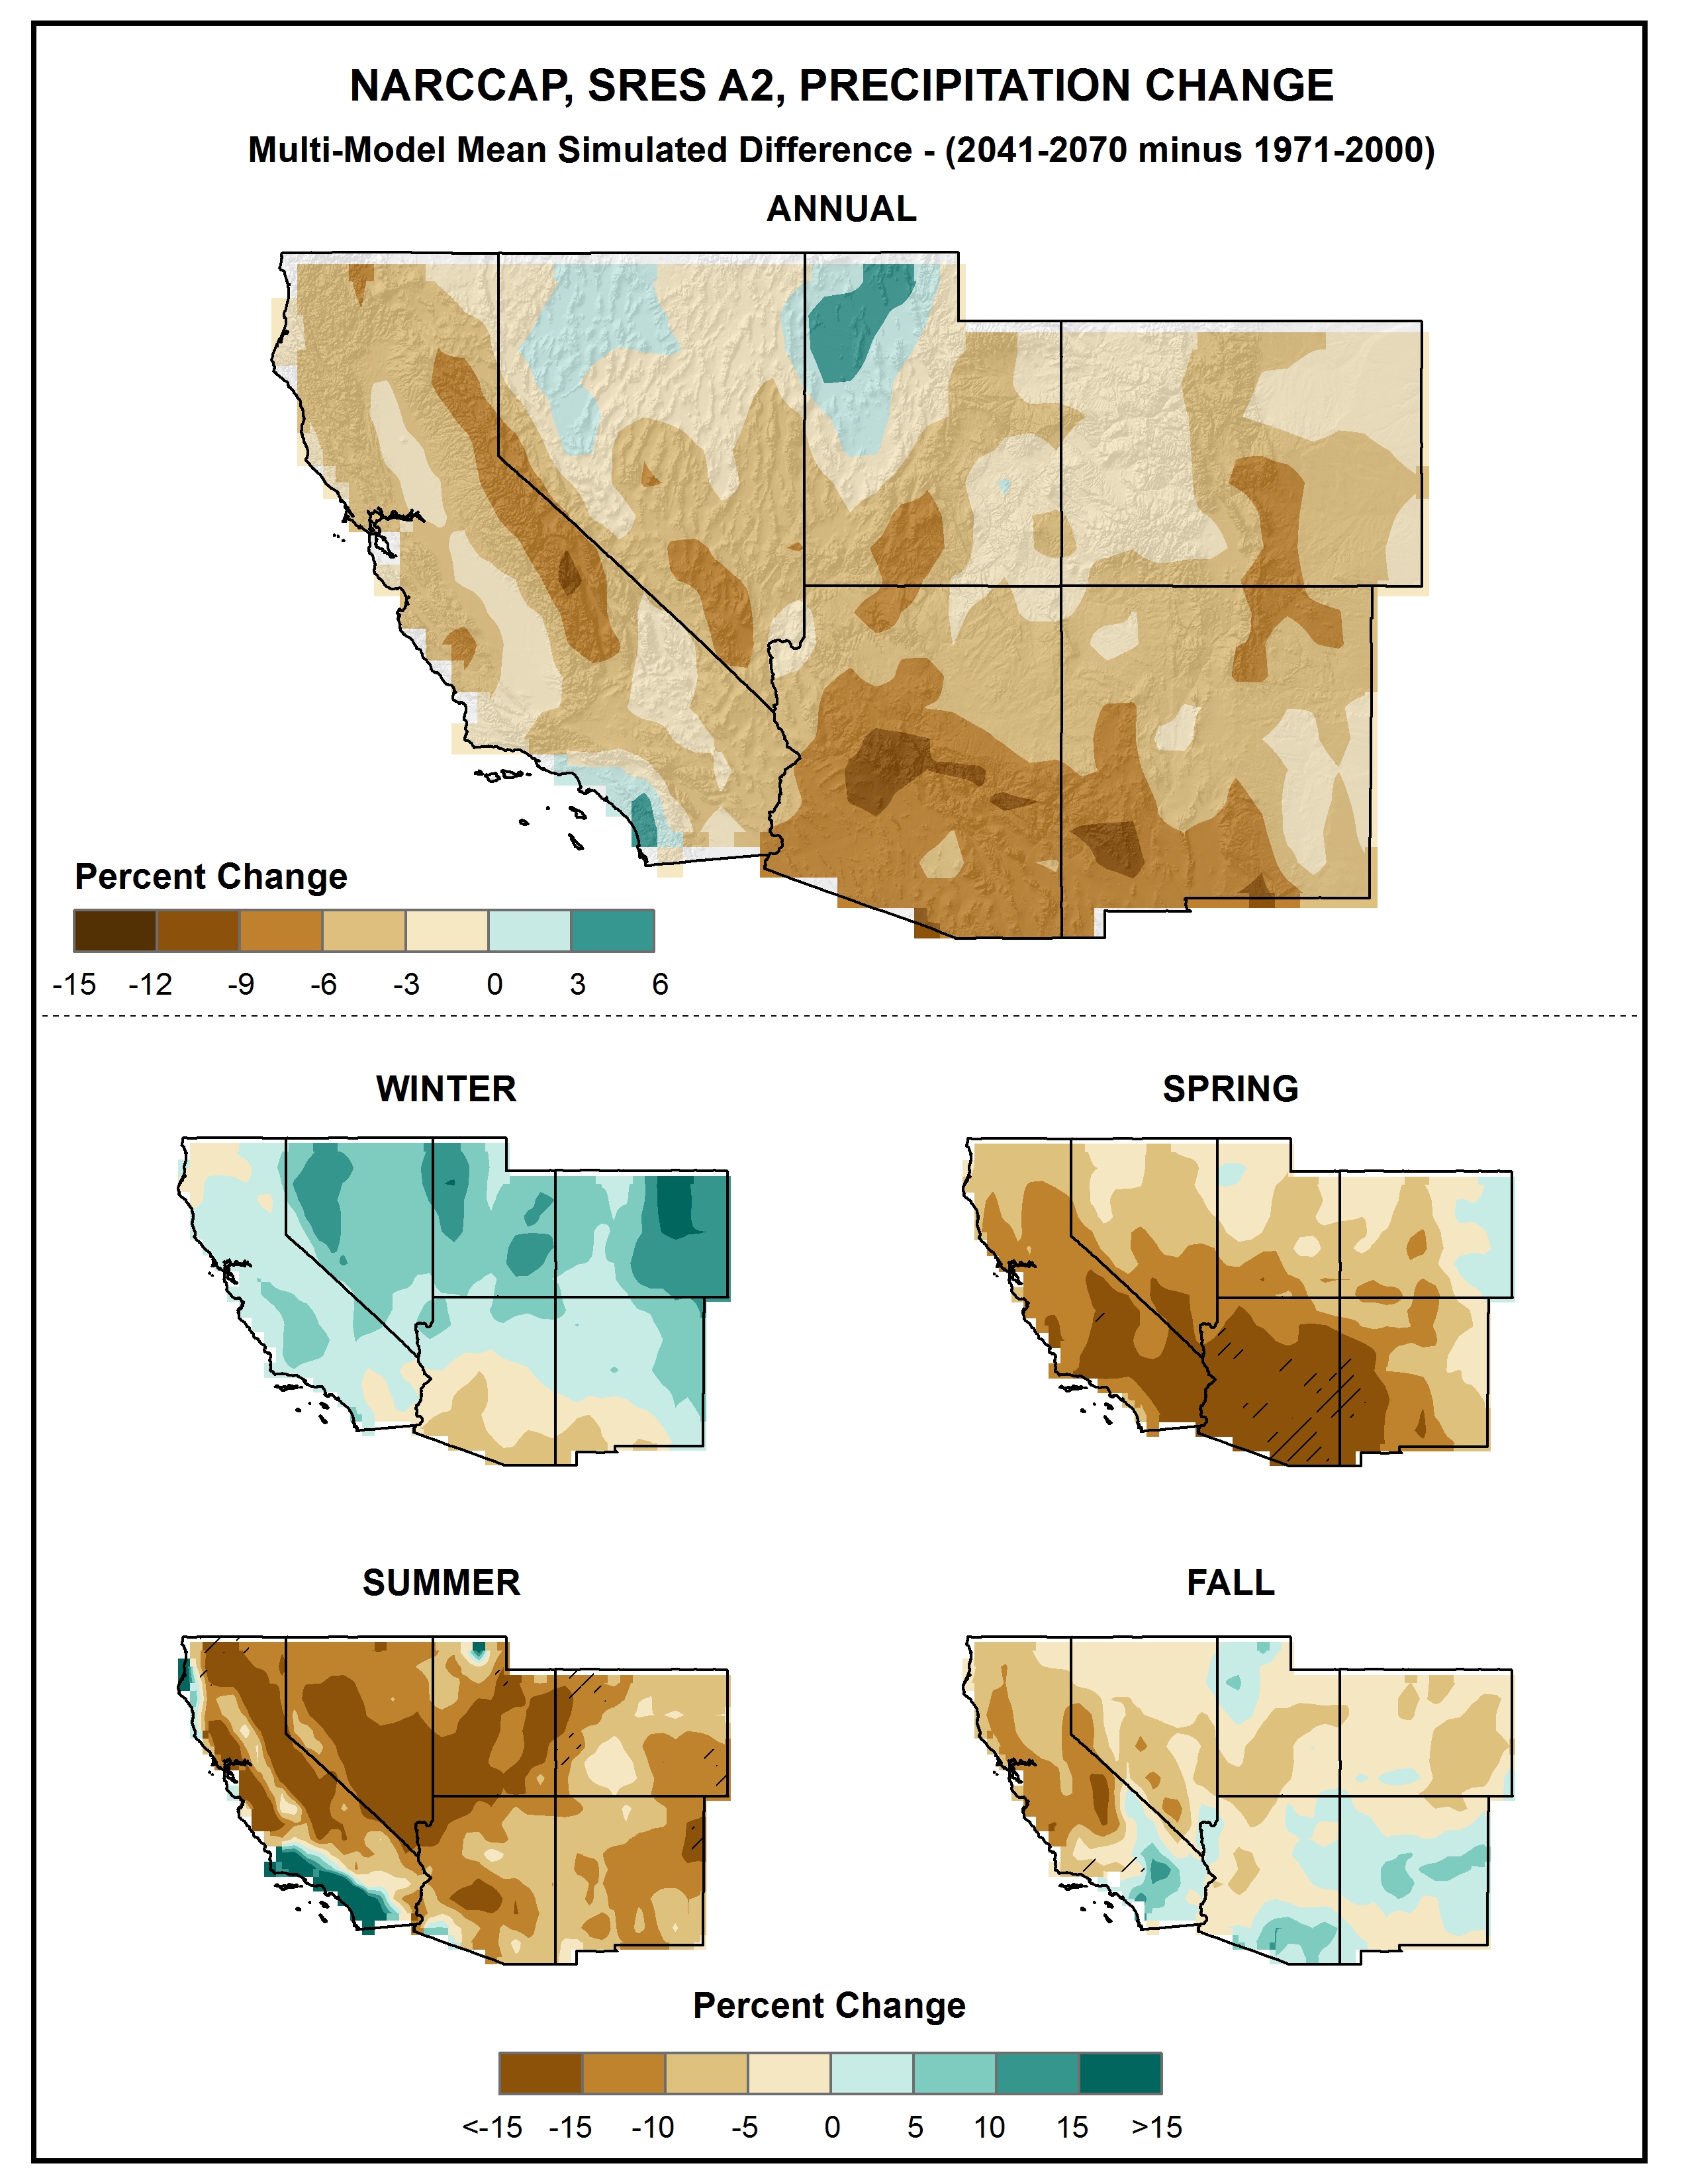
Simulated annual mean precipitation change |
Simulated |
Precipitation |
Southwest |
Regional Climate Trends and Scenarios for the U.S. National Climate Assessment. Part 5. Climate of the Southwest U.S. |
NCA 3 |
 |
|
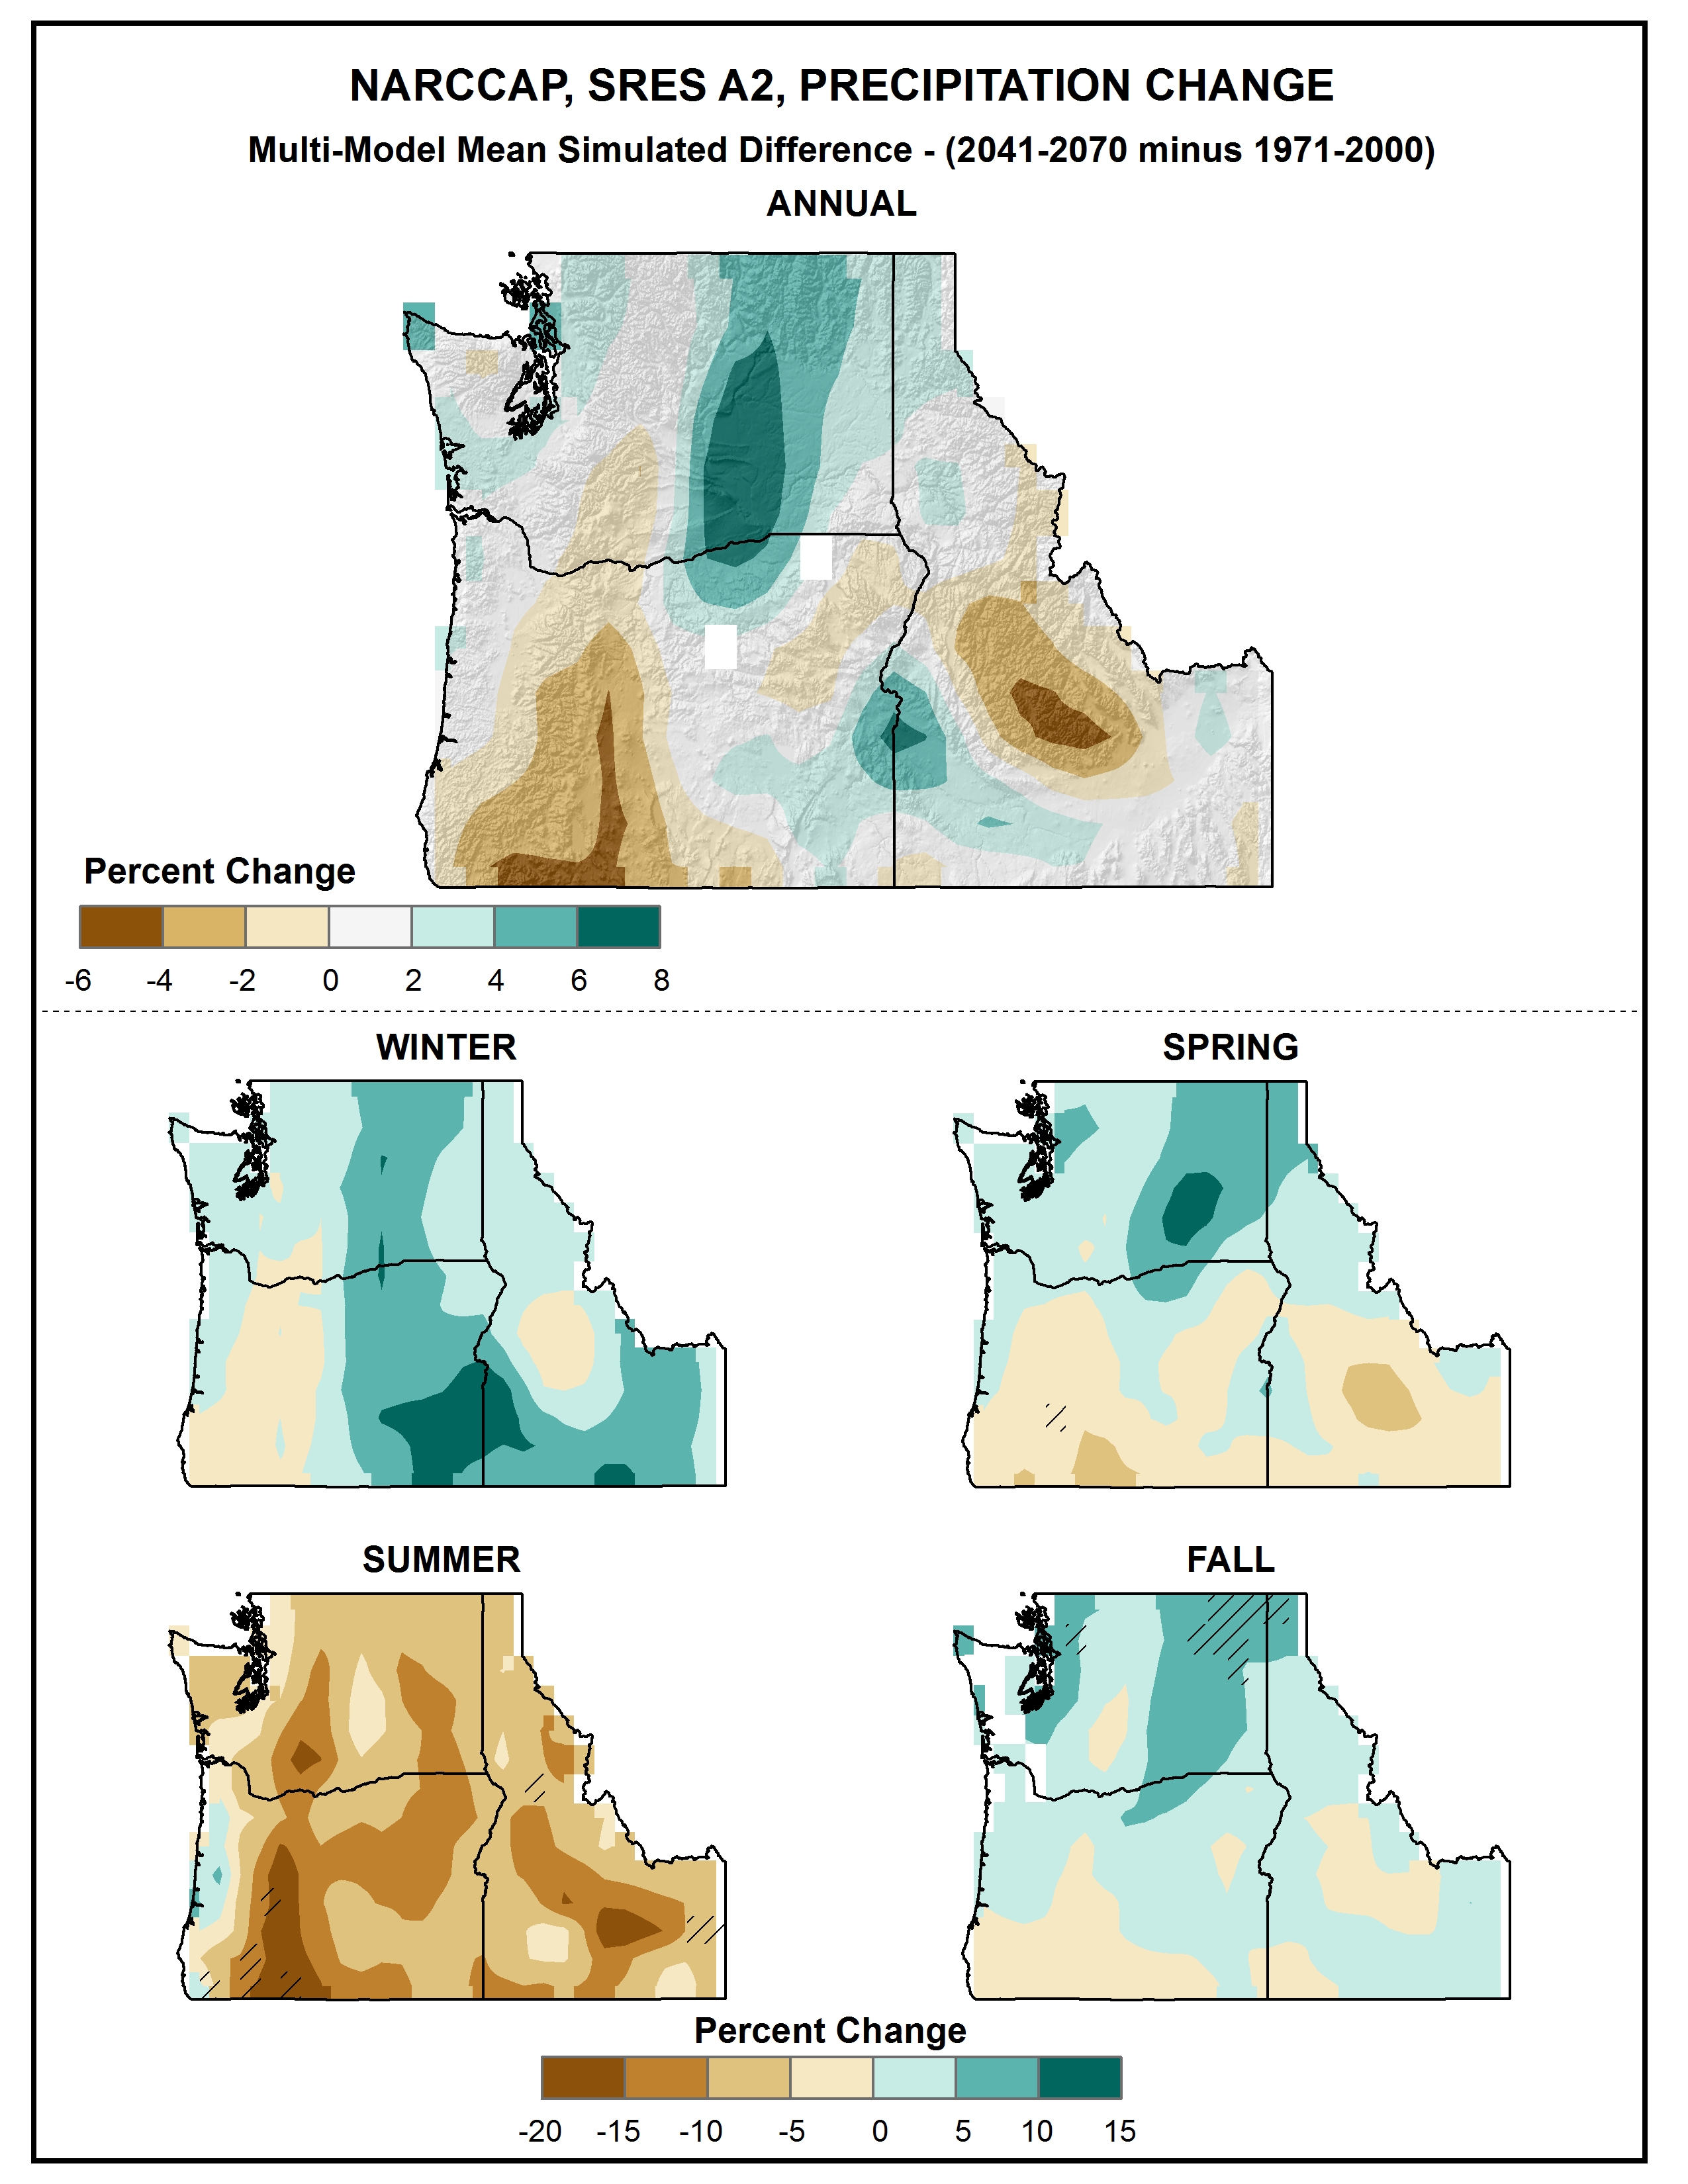
Simulated annual mean precipitation change |
Simulated |
Precipitation |
Northwest |
Regional Climate Trends and Scenarios for the U.S. National Climate Assessment. Part 6. Climate of the Northwest U.S. |
NCA 3 |
 |
|
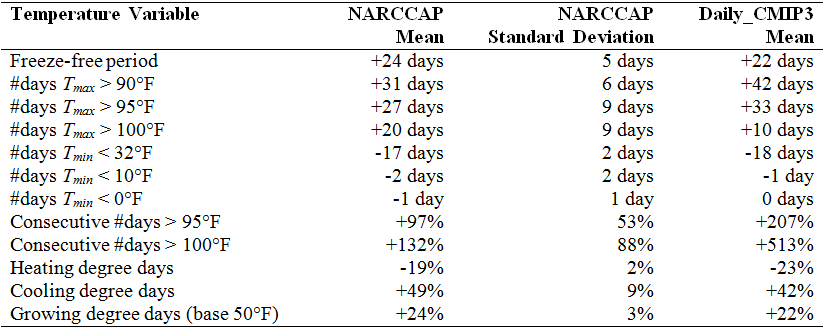
Simulated annual mean change in select temperature variables |
Simulated |
Temperature |
Midwest |
Regional Climate Trends and Scenarios for the U.S. National Climate Assessment. Part 3. Climate of the Midwest U.S. |
NCA 3 |
 |
|
Simulated annual mean change in select temperature variables |
Simulated |
Temperature |
Southeast and Caribbean |
Regional Climate Trends and Scenarios for the U.S. National Climate Assessment. Part 2. Climate of the Southeast U.S. |
NCA 3 |
 |
|
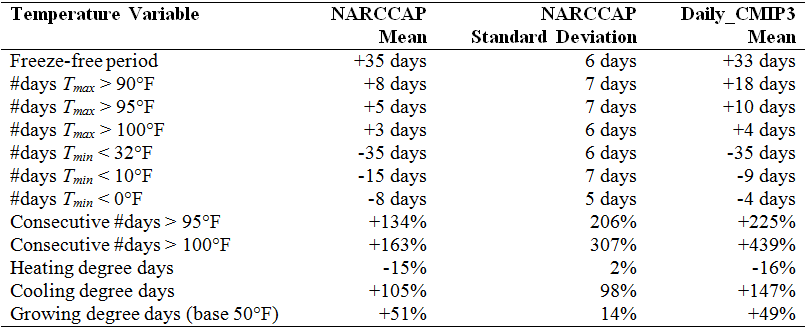
Simulated annual mean change in select temperature variables |
Simulated |
Temperature |
Great Plains |
Regional Climate Trends and Scenarios for the U.S. National Climate Assessment. Part 4. Climate of the U.S. Great Plains |
NCA 3 |
 |
|
Simulated annual mean change in select temperature variables |
Simulated |
Temperature |
Northeast |
Regional Climate Trends and Scenarios for the U.S. National Climate Assessment. Part 1. Climate of the Northeast U.S. |
NCA 3 |
 |
|
Simulated annual mean change in select temperature variables |
Simulated |
Temperature |
Southwest |
Regional Climate Trends and Scenarios for the U.S. National Climate Assessment. Part 5. Climate of the Southwest U.S. |
NCA 3 |
 |
|
Simulated annual mean change in select temperature variables |
Simulated |
Temperature |
Northwest |
Regional Climate Trends and Scenarios for the U.S. National Climate Assessment. Part 6. Climate of the Northwest U.S. |
NCA 3 |
 |
|
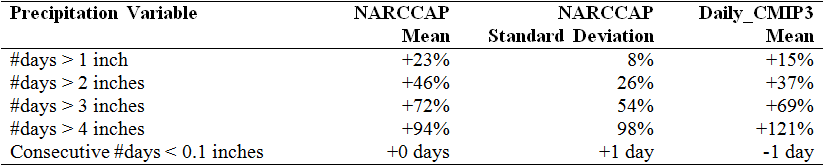
Simulated annual mean change in select precipitation variables |
Simulated |
Precipitation |
Midwest |
Regional Climate Trends and Scenarios for the U.S. National Climate Assessment. Part 3. Climate of the Midwest U.S. |
NCA 3 |
 |
|
Simulated annual mean change in select precipitation variables |
Simulated |
Precipitation |
Southeast and Caribbean |
Regional Climate Trends and Scenarios for the U.S. National Climate Assessment. Part 2. Climate of the Southeast U.S. |
NCA 3 |
 |
|
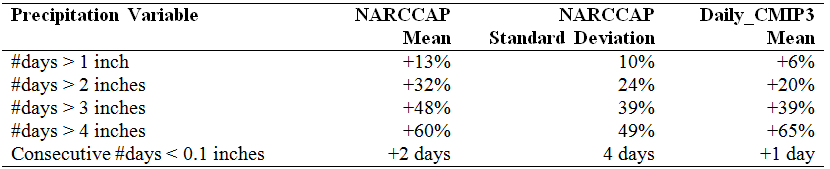
Simulated annual mean change in select precipitation variables |
Simulated |
Precipitation |
Great Plains |
Regional Climate Trends and Scenarios for the U.S. National Climate Assessment. Part 4. Climate of the U.S. Great Plains |
NCA 3 |
 |
|
Simulated annual mean change in select precipitation variables |
Simulated |
Precipitation |
Northeast |
Regional Climate Trends and Scenarios for the U.S. National Climate Assessment. Part 1. Climate of the Northeast U.S. |
NCA 3 |
 |
|
Simulated annual mean change in select precipitation variables |
Simulated |
Precipitation |
Southwest |
Regional Climate Trends and Scenarios for the U.S. National Climate Assessment. Part 5. Climate of the Southwest U.S. |
NCA 3 |
 |
|
Simulated annual mean change in select precipitation variables |
Simulated |
Precipitation |
Northwest |
Regional Climate Trends and Scenarios for the U.S. National Climate Assessment. Part 6. Climate of the Northwest U.S. |
NCA 3 |
 |
|
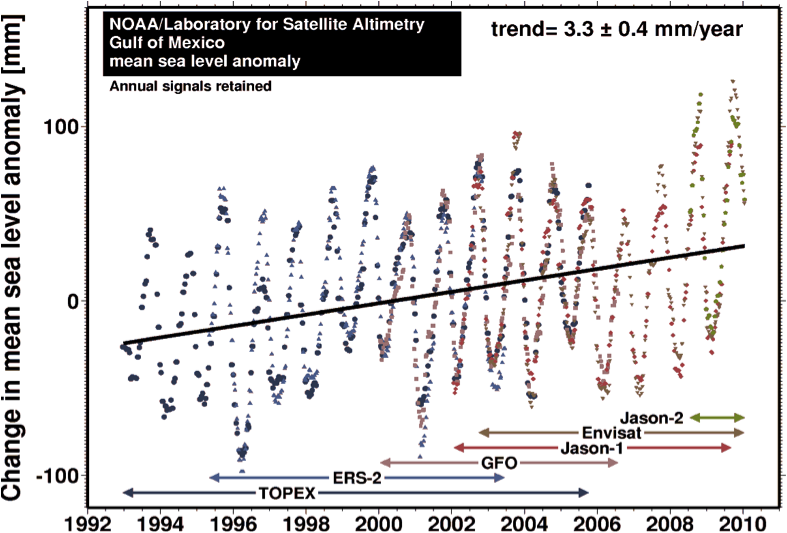
Sea level change in the Gulf of Mexico basin as determined from a combination of six satellite altimetry records (1993 to 2010) |
Observed |
Sea |
Southeast and Caribbean |
Global Sea Level Rise Scenarios for the United States National Climate Assessment |
NCA 3 |
 |
|
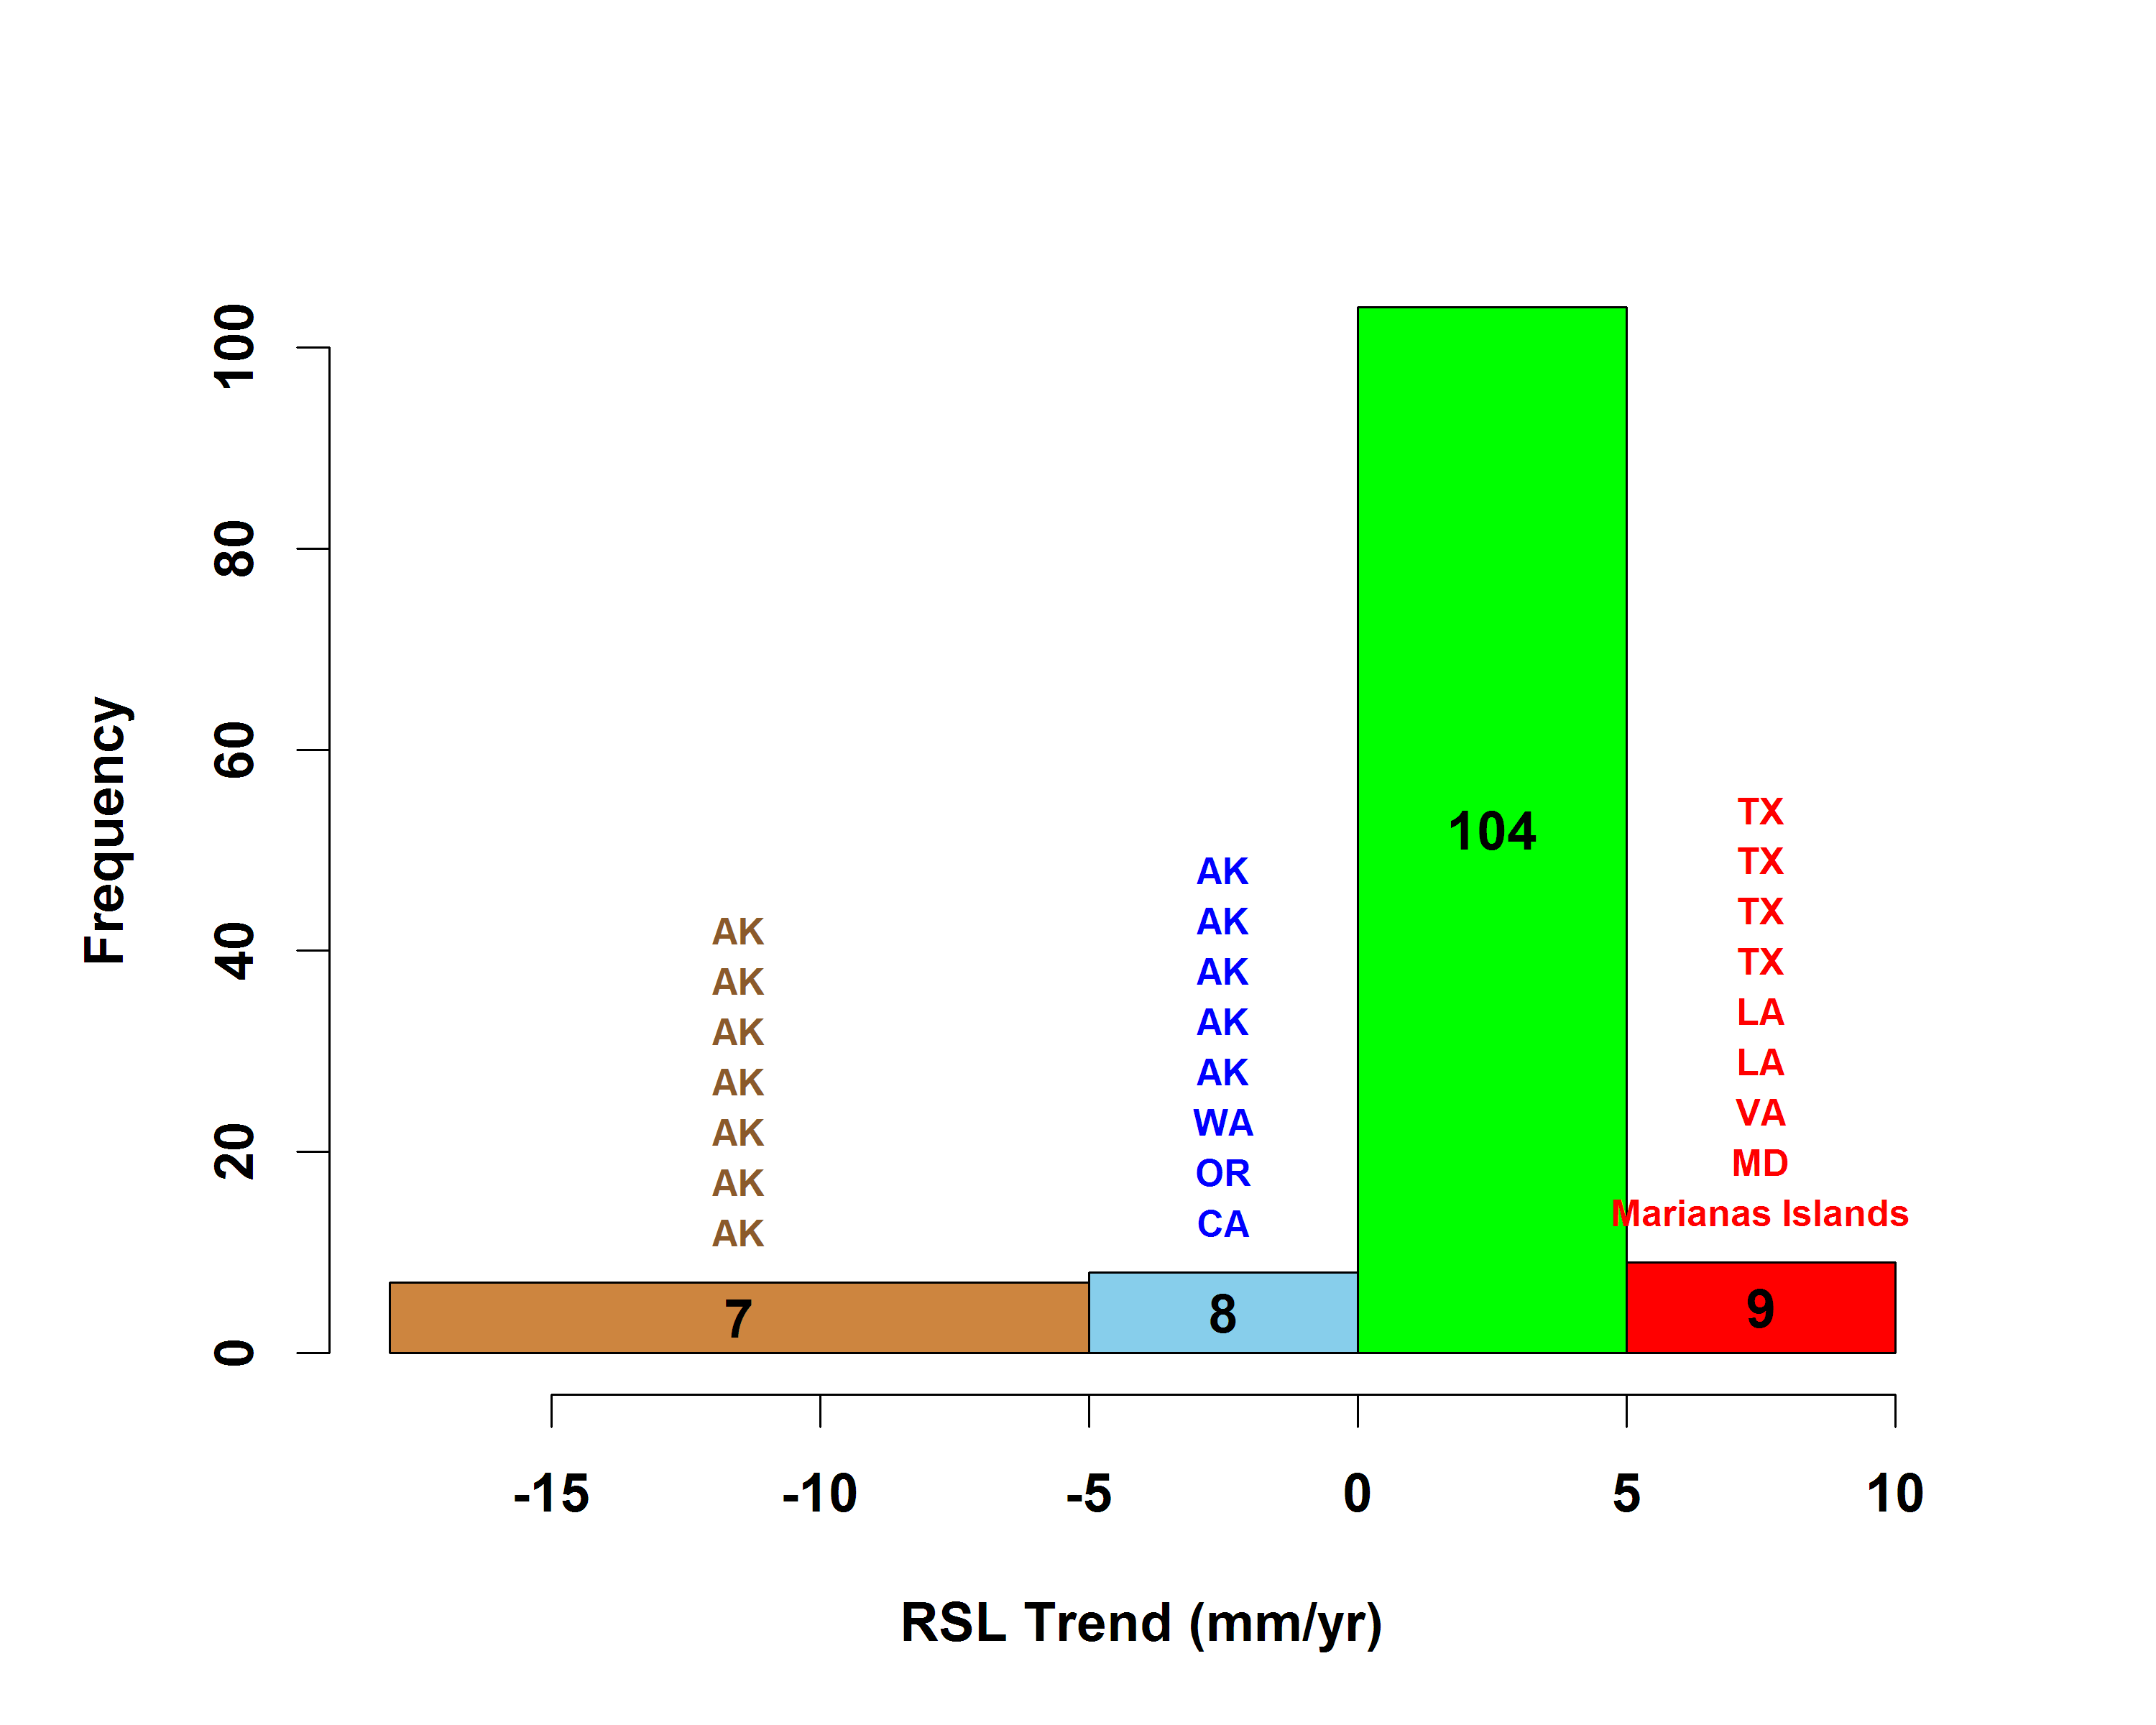
Relative Sea Level (RSL) Variations of the United States (1854 to 2006) |
Observed |
Sea |
National |
Global Sea Level Rise Scenarios for the United States National Climate Assessment |
NCA 3 |
 |
|
Regional average annual percentages of homogeneous snowfall stations exceeding the 90th percentile for the Midwest region |
Observed |
Snow |
Midwest |
Regional Climate Trends and Scenarios for the U.S. National Climate Assessment. Part 3. Climate of the Midwest U.S. |
NCA 3 |
 |
|
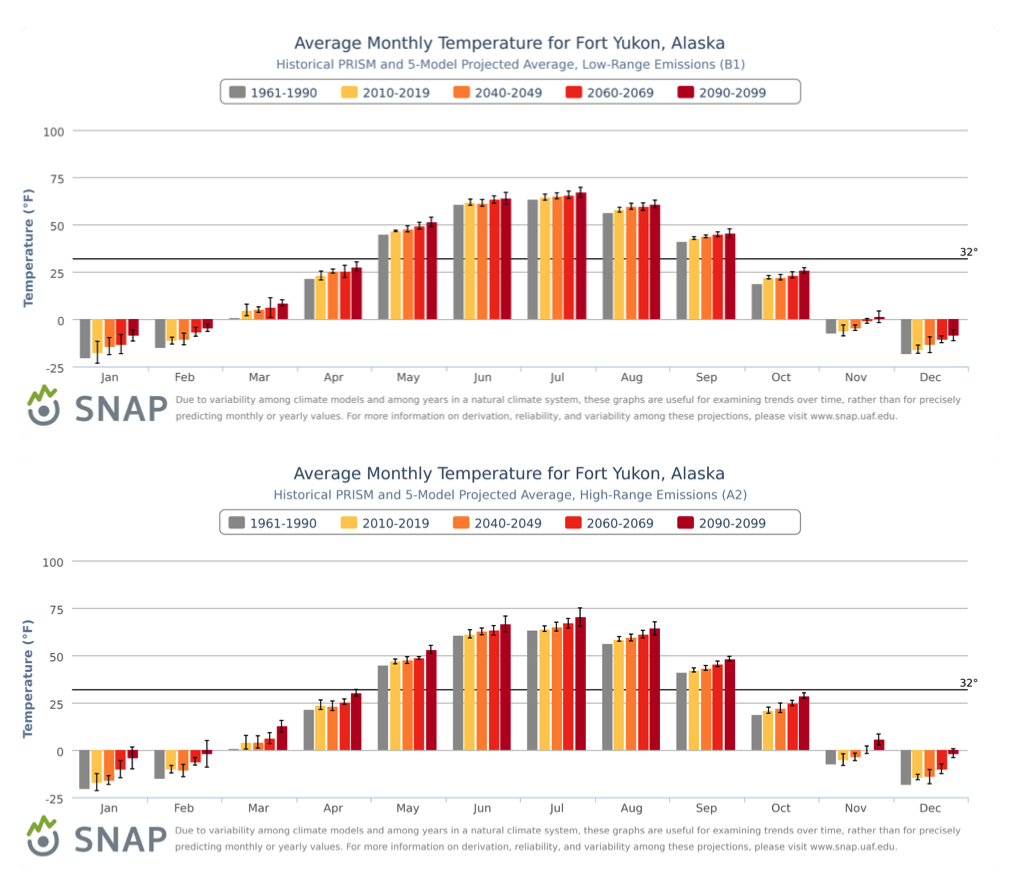
Projections of decadal mean temperature by calendar month for Fort Yukon |
Simulated |
Temperature |
Alaska and Arctic |
Regional Climate Trends and Scenarios for the U.S. National Climate Assessment. Part 7. Climate of Alaska |
NCA 3 |
 |
|
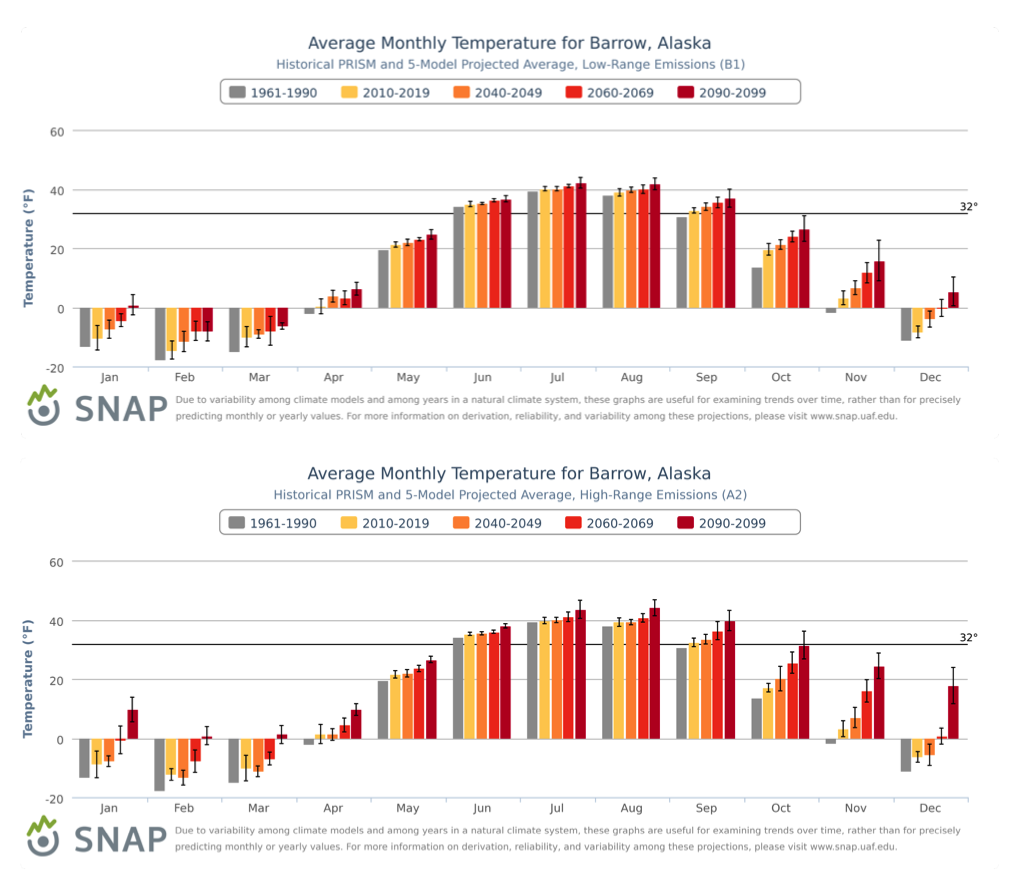
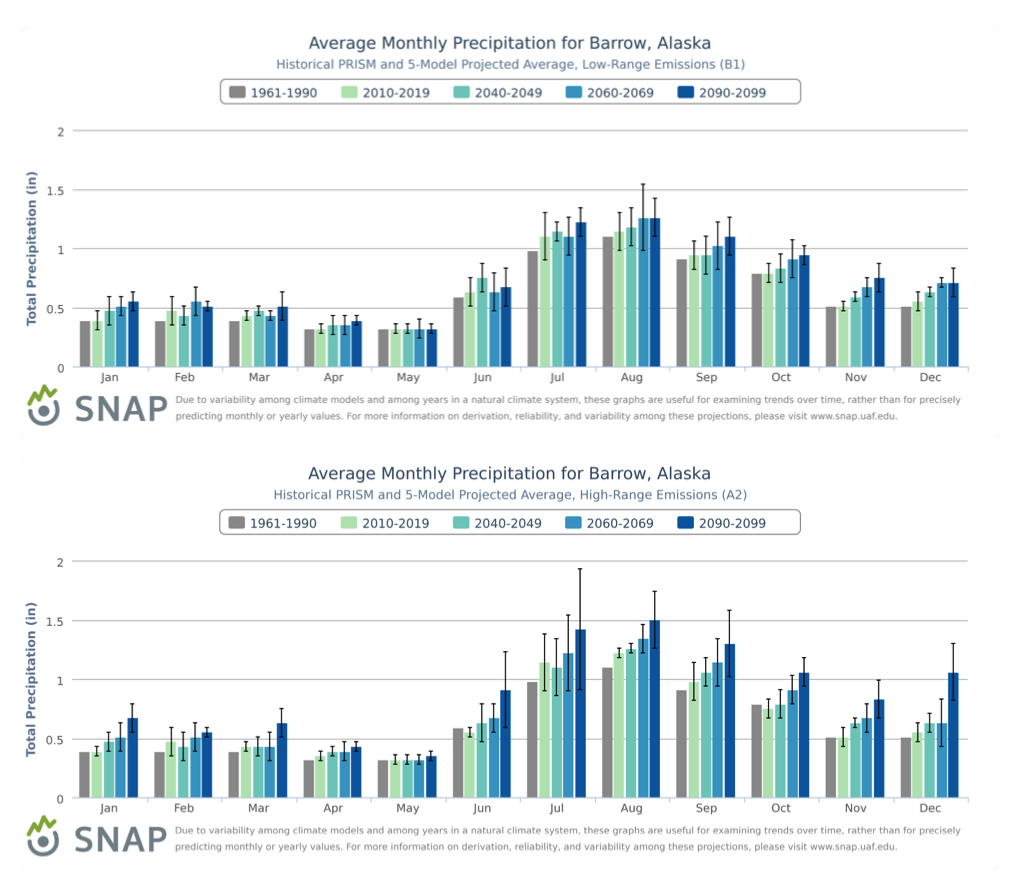
Projections of decadal mean temperature by calendar month for Barrow |
Simulated |
Temperature |
Alaska and Arctic |
Regional Climate Trends and Scenarios for the U.S. National Climate Assessment. Part 7. Climate of Alaska |
NCA 3 |
 |
|
Projections of decadal mean temperature by calendar month for Anchorage |
Simulated |
Temperature |
Alaska and Arctic |
Regional Climate Trends and Scenarios for the U.S. National Climate Assessment. Part 7. Climate of Alaska |
NCA 3 |
 |
|
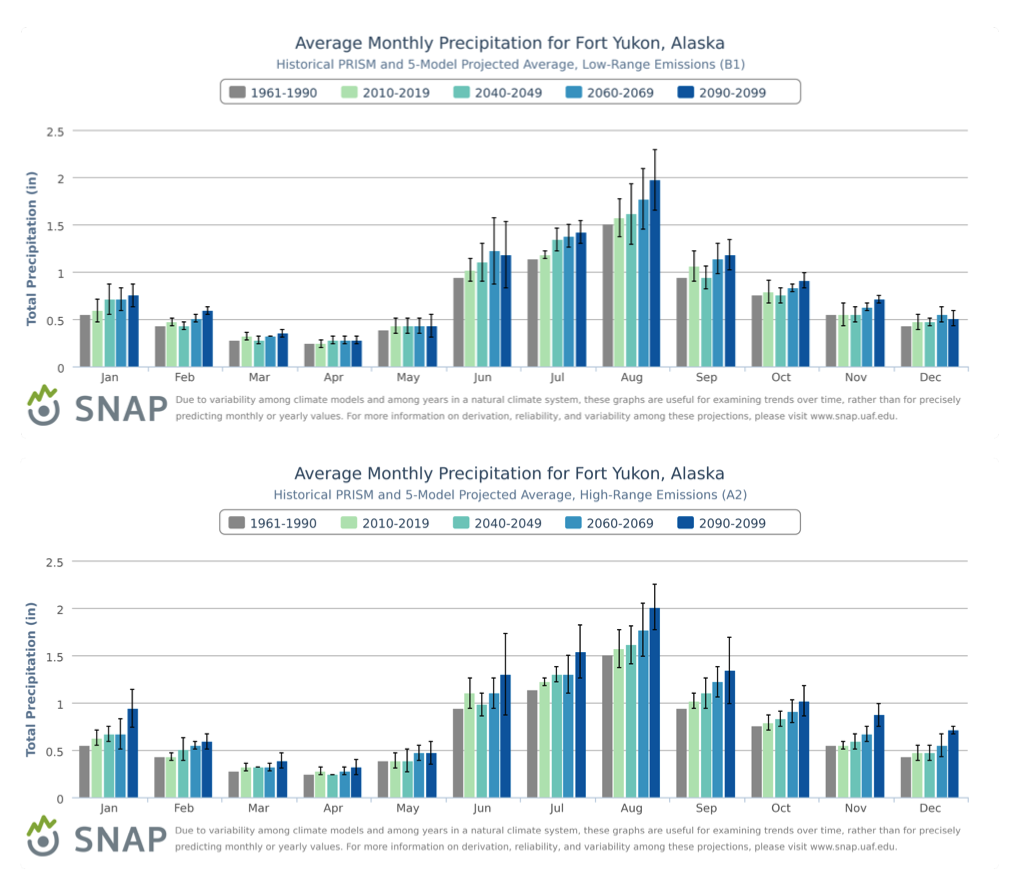
Projections of decadal mean precipitation by calendar month for Fort Yukon |
Simulated |
Precipitation |
Alaska and Arctic |
Regional Climate Trends and Scenarios for the U.S. National Climate Assessment. Part 7. Climate of Alaska |
NCA 3 |
 |
|
Projections of decadal mean precipitation by calendar month for Barrow |
Simulated |
Precipitation |
Alaska and Arctic |
Regional Climate Trends and Scenarios for the U.S. National Climate Assessment. Part 7. Climate of Alaska |
NCA 3 |
 |
|
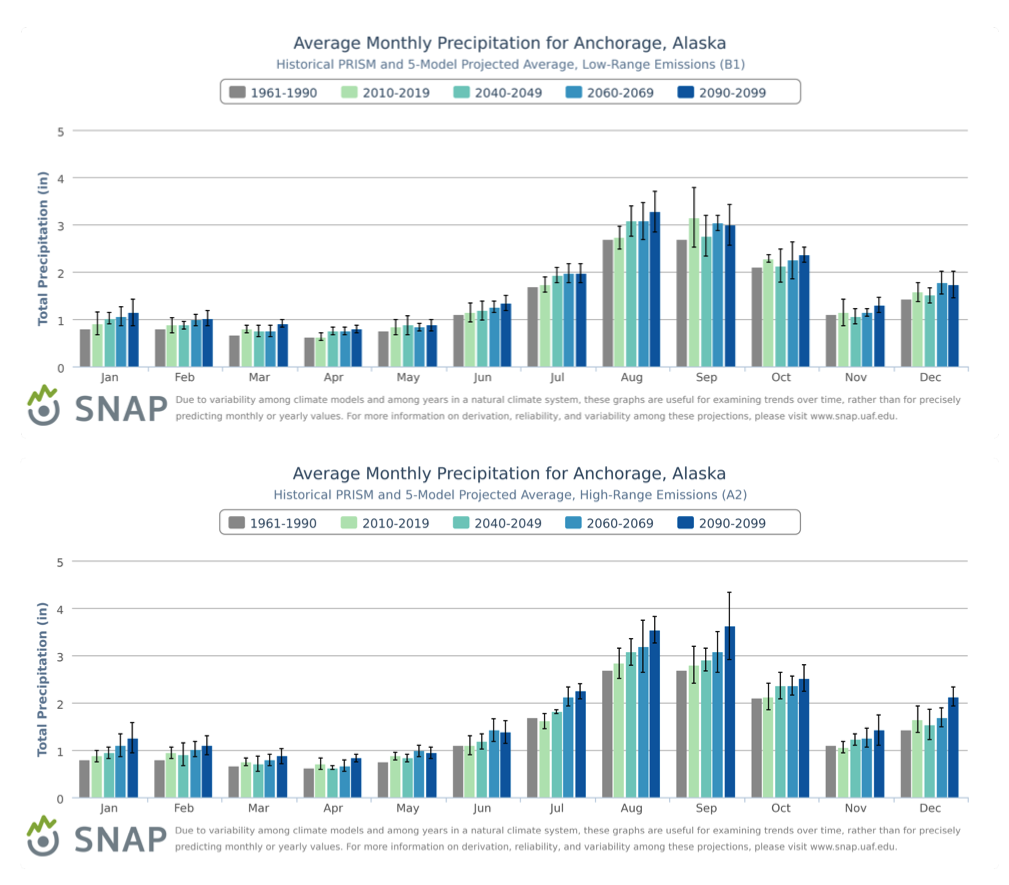
Projections of decadal mean precipitation by calendar month for Anchorage |
Simulated |
Precipitation |
Alaska and Arctic |
Regional Climate Trends and Scenarios for the U.S. National Climate Assessment. Part 7. Climate of Alaska |
NCA 3 |
 |
|
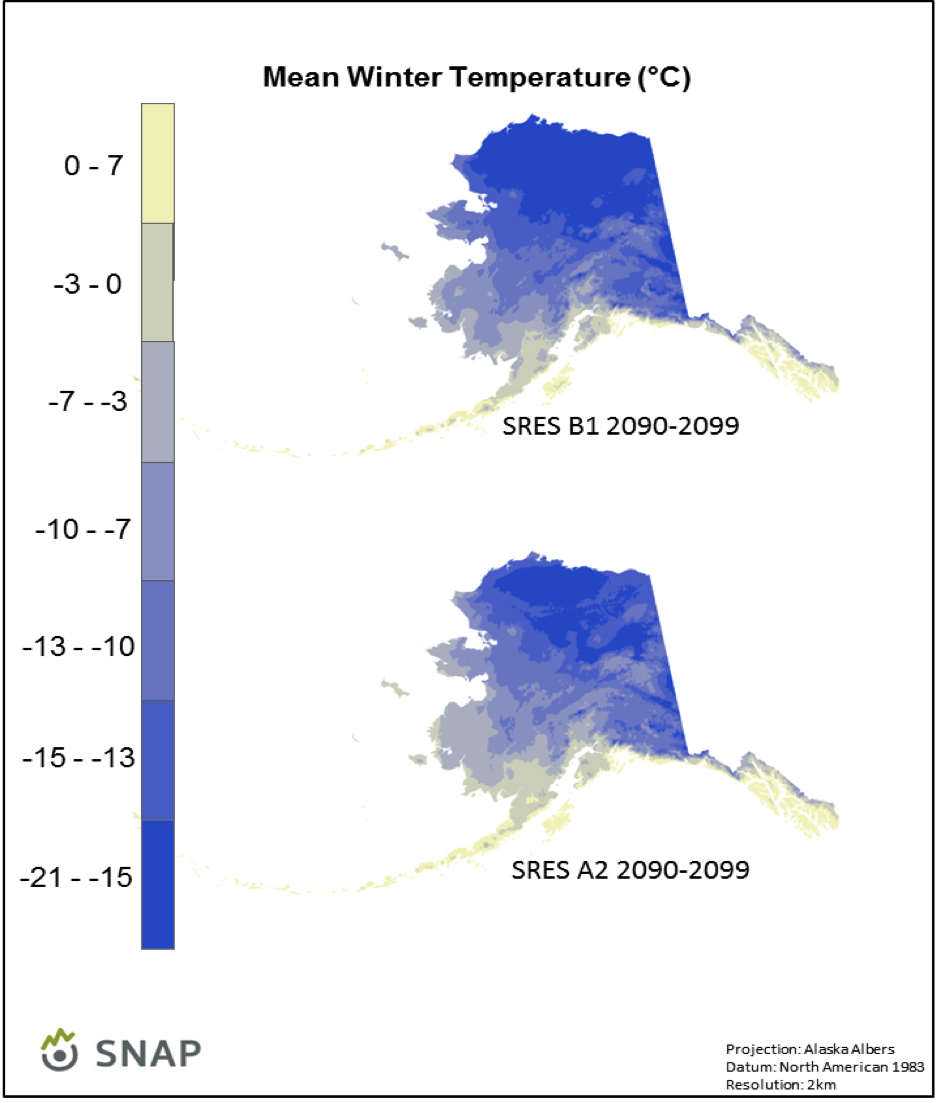
Projected mean winter temperature for Alaska |
Simulated |
Temperature |
Alaska and Arctic |
Regional Climate Trends and Scenarios for the U.S. National Climate Assessment. Part 7. Climate of Alaska |
NCA 3 |
 |
|
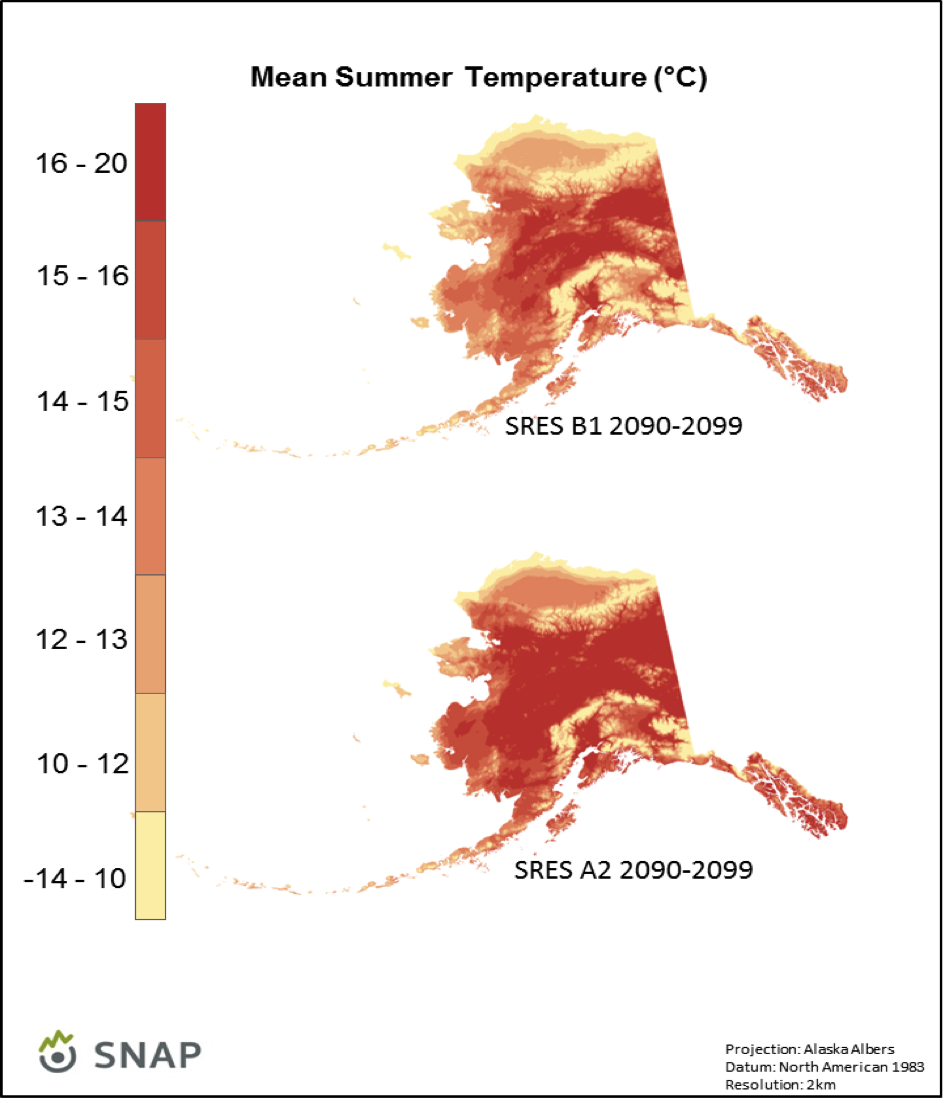
Projected mean summer temperature for Alaska |
Simulated |
Temperature |
Alaska and Arctic |
Regional Climate Trends and Scenarios for the U.S. National Climate Assessment. Part 7. Climate of Alaska |
NCA 3 |
 |
|
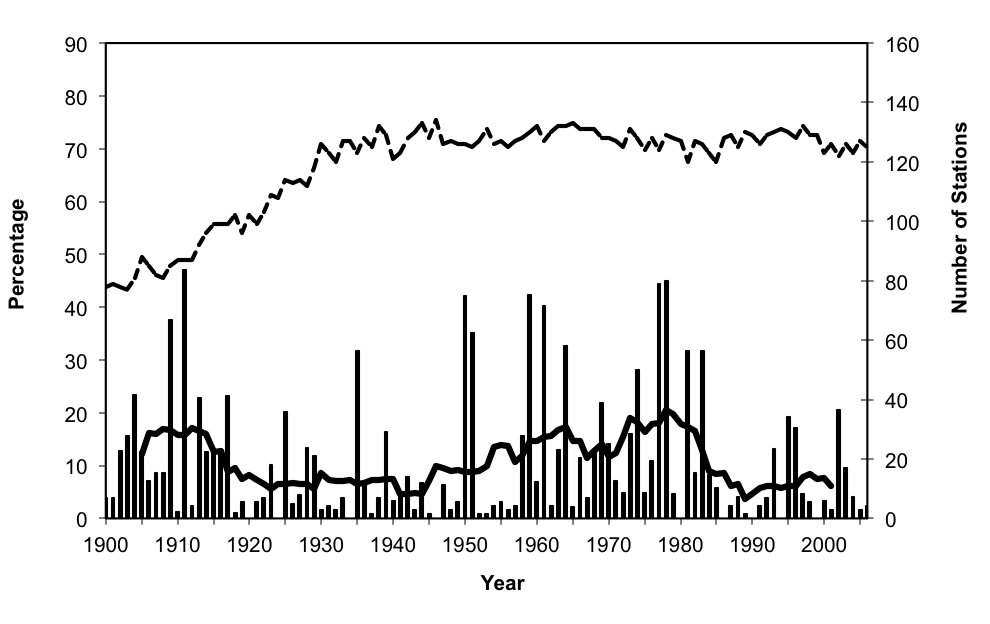
Percent of stations displaying extreme temperatures |
Observed |
Temperature |
Alaska and Arctic |
Regional Climate Trends and Scenarios for the U.S. National Climate Assessment. Part 7. Climate of Alaska |
NCA 3 |
 |
|
Percent of stations dispalying extreme precipitation |
Observed |
Precipitation |
Alaska and Arctic |
Regional Climate Trends and Scenarios for the U.S. National Climate Assessment. Part 7. Climate of Alaska |
NCA 3 |
 |
|
Observed decadal mean seasonal temperature change |
Observed, Simulated |
Temperature |
Midwest |
Regional Climate Trends and Scenarios for the U.S. National Climate Assessment. Part 3. Climate of the Midwest U.S. |
NCA 3 |
 |
|
Observed decadal mean seasonal temperature change |
Observed, Simulated |
Temperature |
Southeast and Caribbean |
Regional Climate Trends and Scenarios for the U.S. National Climate Assessment. Part 2. Climate of the Southeast U.S. |
NCA 3 |
 |
|
Observed decadal mean seasonal temperature change |
Observed, Simulated |
Temperature |
National |
Regional Climate Trends and Scenarios for the U.S. National Climate Assessment. Part 9. Climate of the Contiguous United States |
NCA 3 |
 |
|
Observed decadal mean seasonal temperature change |
Observed, Simulated |
Temperature |
Great Plains |
Regional Climate Trends and Scenarios for the U.S. National Climate Assessment. Part 4. Climate of the U.S. Great Plains |
NCA 3 |
 |
|
Observed decadal mean seasonal temperature change |
Observed, Simulated |
Temperature |
Northeast |
Regional Climate Trends and Scenarios for the U.S. National Climate Assessment. Part 1. Climate of the Northeast U.S. |
NCA 3 |
 |
|
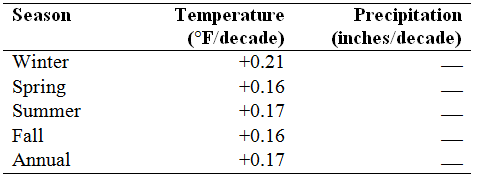
Observed decadal mean seasonal temperature change |
Observed, Simulated |
Temperature |
Southwest |
Regional Climate Trends and Scenarios for the U.S. National Climate Assessment. Part 5. Climate of the Southwest U.S. |
NCA 3 |
 |
|
Observed decadal mean seasonal temperature change |
Observed, Simulated |
Temperature |
Northwest |
Regional Climate Trends and Scenarios for the U.S. National Climate Assessment. Part 6. Climate of the Northwest U.S. |
NCA 3 |
 |
|
Observed decadal mean seasonal precipitation change |
Observed, Simulated |
Precipitation |
Midwest |
Regional Climate Trends and Scenarios for the U.S. National Climate Assessment. Part 3. Climate of the Midwest U.S. |
NCA 3 |
 |
|
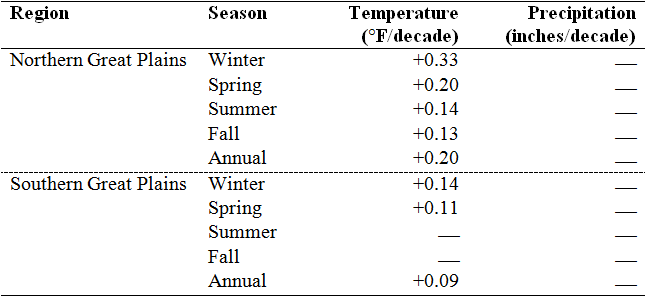
Observed decadal mean seasonal precipitation change |
Observed, Simulated |
Precipitation |
Southeast and Caribbean |
Regional Climate Trends and Scenarios for the U.S. National Climate Assessment. Part 2. Climate of the Southeast U.S. |
NCA 3 |
 |
|
Observed decadal mean seasonal precipitation change |
Observed, Simulated |
Precipitation |
National |
Regional Climate Trends and Scenarios for the U.S. National Climate Assessment. Part 9. Climate of the Contiguous United States |
NCA 3 |
 |
|
Observed decadal mean seasonal precipitation change |
Observed, Simulated |
Precipitation |
Great Plains |
Regional Climate Trends and Scenarios for the U.S. National Climate Assessment. Part 4. Climate of the U.S. Great Plains |
NCA 3 |
 |
|
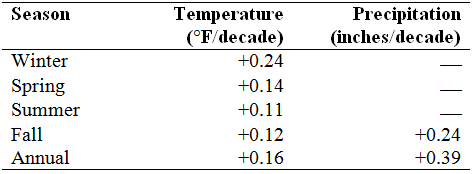
Observed decadal mean seasonal precipitation change |
Observed, Simulated |
Precipitation |
Northeast |
Regional Climate Trends and Scenarios for the U.S. National Climate Assessment. Part 1. Climate of the Northeast U.S. |
NCA 3 |
 |
|
Observed decadal mean seasonal precipitation change |
Observed, Simulated |
Precipitation |
Southwest |
Regional Climate Trends and Scenarios for the U.S. National Climate Assessment. Part 5. Climate of the Southwest U.S. |
NCA 3 |
 |
|
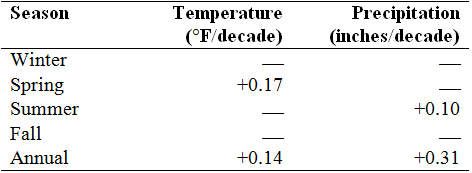
Observed decadal mean seasonal precipitation change |
Observed, Simulated |
Precipitation |
Northwest |
Regional Climate Trends and Scenarios for the U.S. National Climate Assessment. Part 6. Climate of the Northwest U.S. |
NCA 3 |
 |
|
Observed decadal mean annual temperature change |
Observed, Simulated |
Temperature |
Midwest |
Regional Climate Trends and Scenarios for the U.S. National Climate Assessment. Part 3. Climate of the Midwest U.S. |
NCA 3 |
 |
|
Observed decadal mean annual temperature change |
Observed, Simulated |
Temperature |
Southeast and Caribbean |
Regional Climate Trends and Scenarios for the U.S. National Climate Assessment. Part 2. Climate of the Southeast U.S. |
NCA 3 |
 |
|
Observed decadal mean annual temperature change |
Observed, Simulated |
Temperature |
National |
Regional Climate Trends and Scenarios for the U.S. National Climate Assessment. Part 9. Climate of the Contiguous United States |
NCA 3 |
 |
|
Observed decadal mean annual temperature change |
Observed, Simulated |
Temperature |
Great Plains |
Regional Climate Trends and Scenarios for the U.S. National Climate Assessment. Part 4. Climate of the U.S. Great Plains |
NCA 3 |
 |
|
Observed decadal mean annual temperature change |
Observed, Simulated |
Temperature |
Northeast |
Regional Climate Trends and Scenarios for the U.S. National Climate Assessment. Part 1. Climate of the Northeast U.S. |
NCA 3 |
 |
|
Observed decadal mean annual temperature change |
Observed, Simulated |
Temperature |
Southwest |
Regional Climate Trends and Scenarios for the U.S. National Climate Assessment. Part 5. Climate of the Southwest U.S. |
NCA 3 |
 |
|
Observed decadal mean annual temperature change |
Observed, Simulated |
Temperature |
Northwest |
Regional Climate Trends and Scenarios for the U.S. National Climate Assessment. Part 6. Climate of the Northwest U.S. |
NCA 3 |
 |
|
Observed decadal mean annual precipitation change |
Observed, Simulated |
Precipitation |
Midwest |
Regional Climate Trends and Scenarios for the U.S. National Climate Assessment. Part 3. Climate of the Midwest U.S. |
NCA 3 |
 |
|
Observed decadal mean annual precipitation change |
Observed, Simulated |
Precipitation |
Southeast and Caribbean |
Regional Climate Trends and Scenarios for the U.S. National Climate Assessment. Part 2. Climate of the Southeast U.S. |
NCA 3 |
 |
|
Observed decadal mean annual precipitation change |
Observed, Simulated |
Precipitation |
National |
Regional Climate Trends and Scenarios for the U.S. National Climate Assessment. Part 9. Climate of the Contiguous United States |
NCA 3 |
 |
|
Observed decadal mean annual precipitation change |
Observed, Simulated |
Precipitation |
Great Plains |
Regional Climate Trends and Scenarios for the U.S. National Climate Assessment. Part 4. Climate of the U.S. Great Plains |
NCA 3 |
 |
|
Observed decadal mean annual precipitation change |
Observed, Simulated |
Precipitation |
Northeast |
Regional Climate Trends and Scenarios for the U.S. National Climate Assessment. Part 1. Climate of the Northeast U.S. |
NCA 3 |
 |
|
Observed decadal mean annual precipitation change |
Observed, Simulated |
Precipitation |
Southwest |
Regional Climate Trends and Scenarios for the U.S. National Climate Assessment. Part 5. Climate of the Southwest U.S. |
NCA 3 |
 |
|
Observed decadal mean annual precipitation change |
Observed, Simulated |
Precipitation |
Northwest |
Regional Climate Trends and Scenarios for the U.S. National Climate Assessment. Part 6. Climate of the Northwest U.S. |
NCA 3 |
 |
|
Number of US tide gauges reflecting RSL variations |
Observed |
Sea |
National |
Global Sea Level Rise Scenarios for the United States National Climate Assessment |
NCA 3 |
 |
|
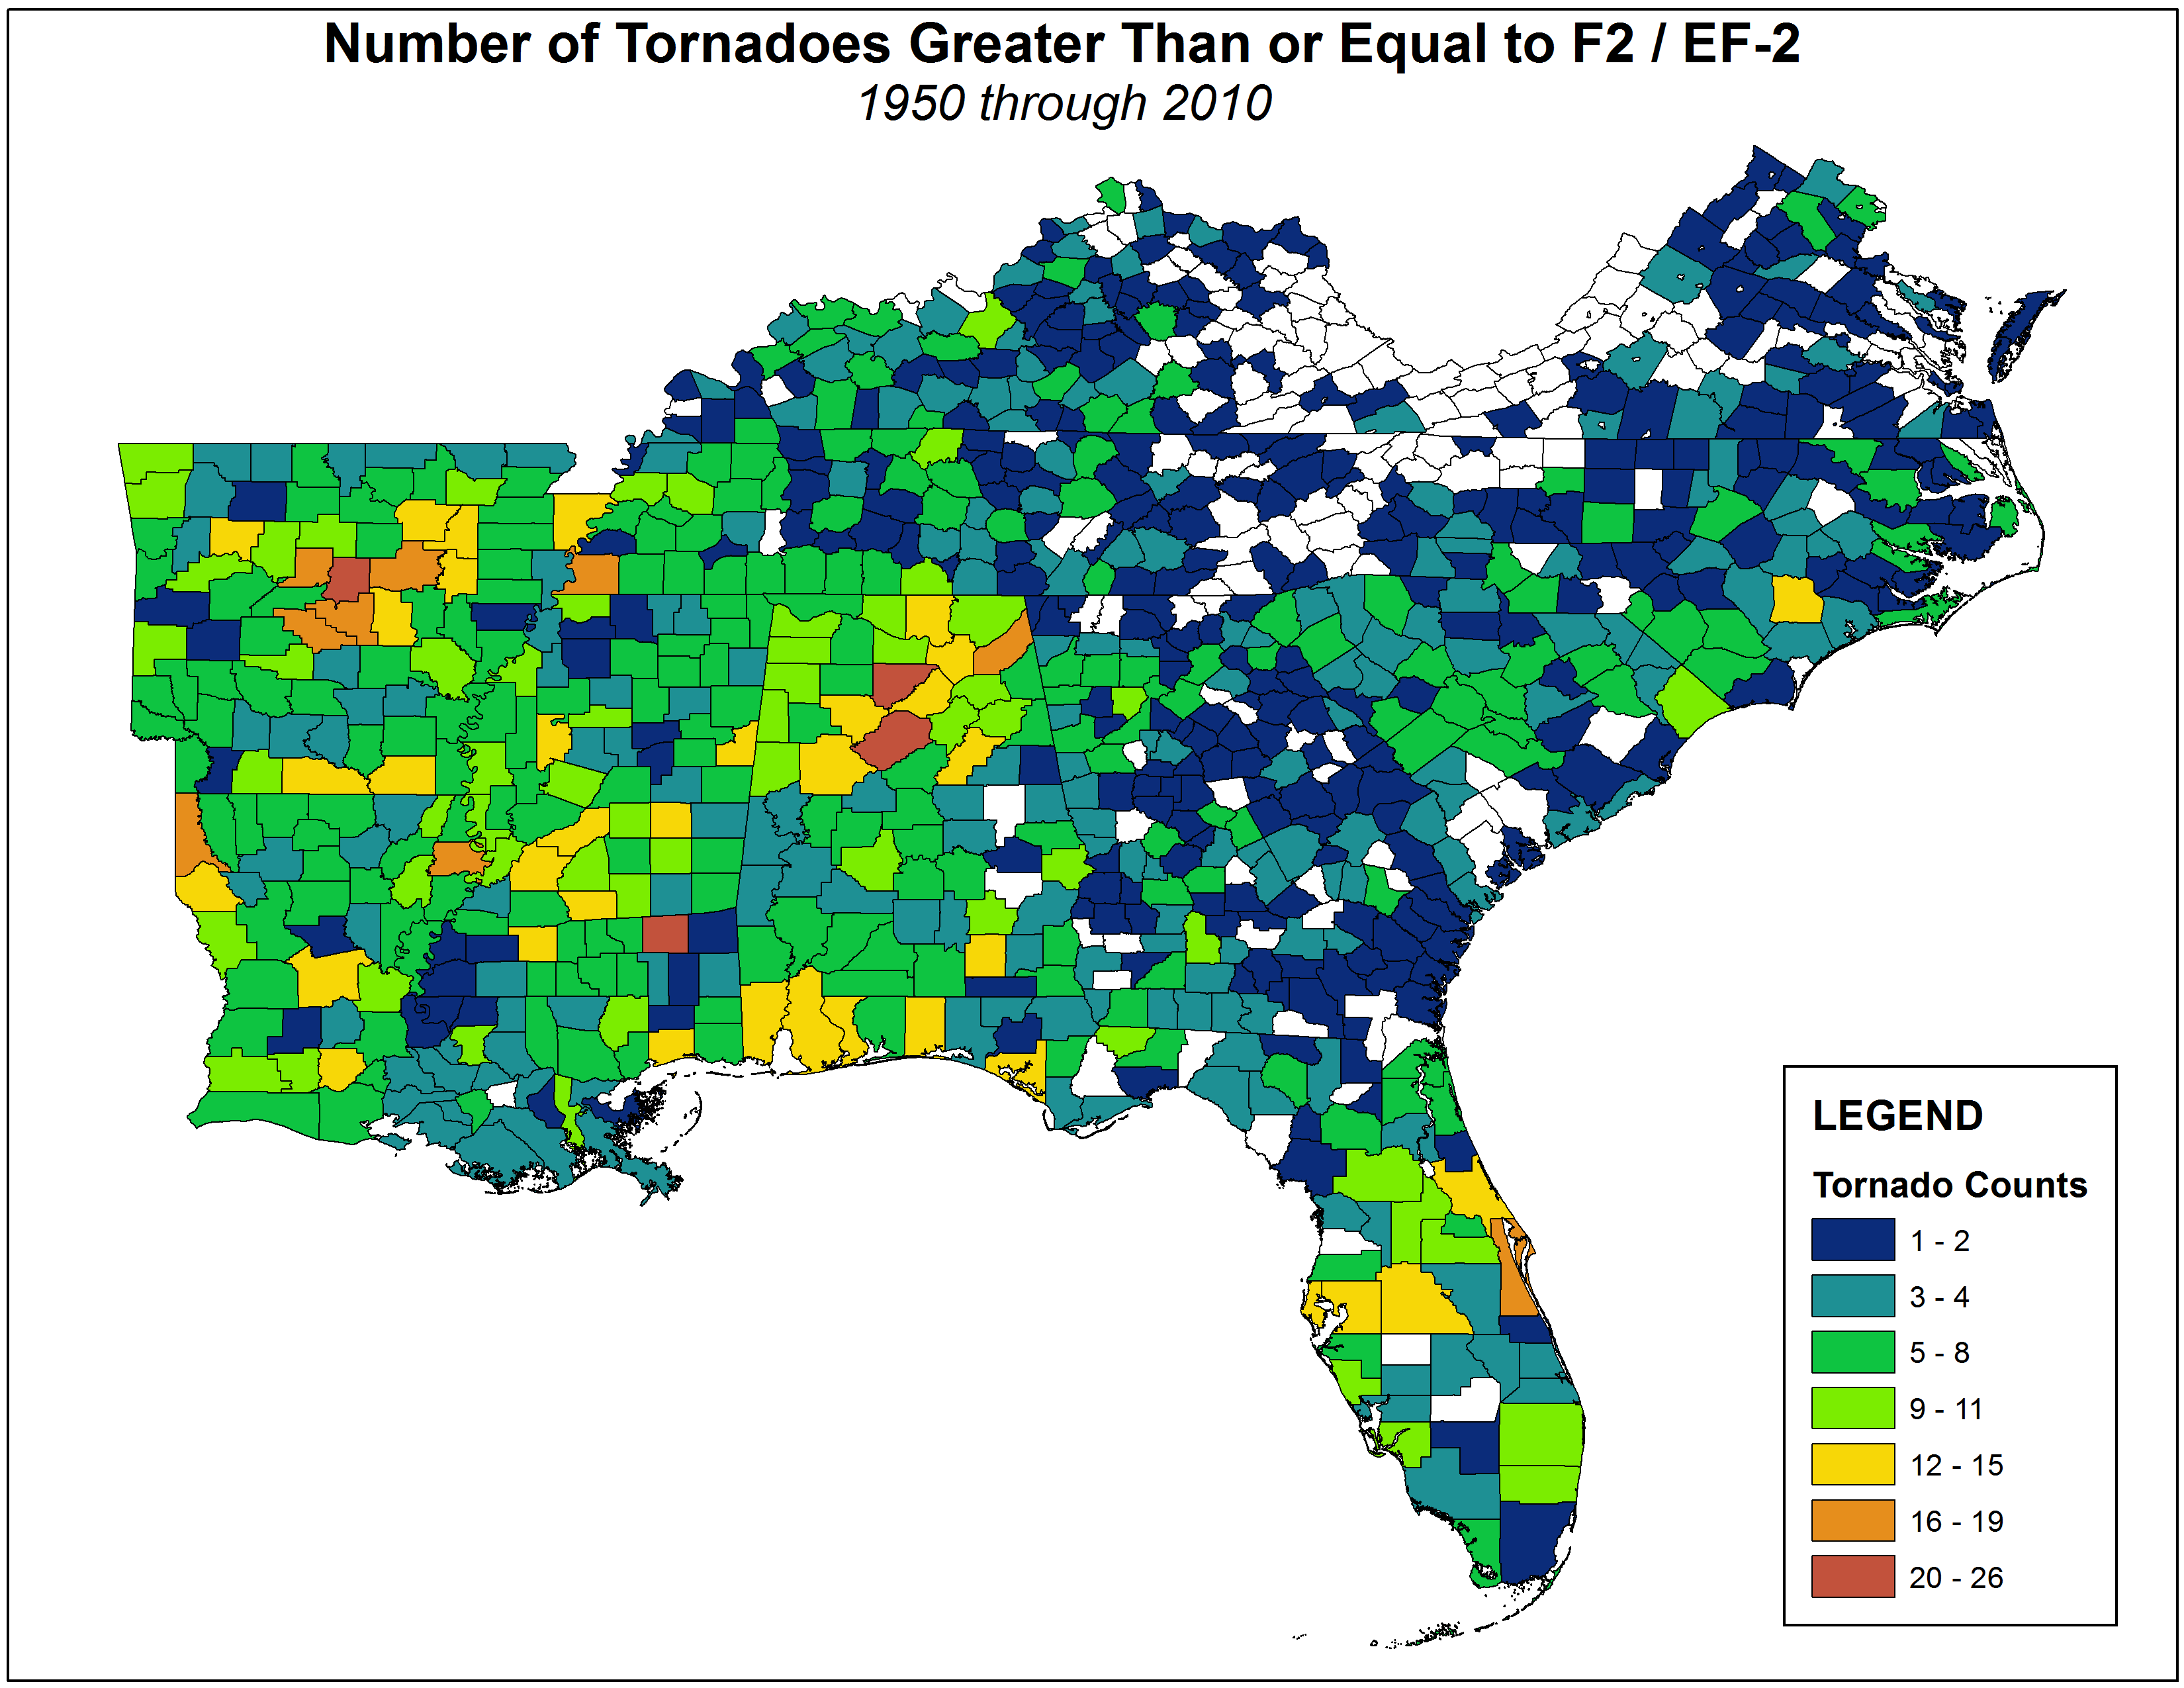
Number of tornadoes greater than or equal to F2/EF-2 |
Observed |
Tornadoes |
Southeast and Caribbean |
Regional Climate Trends and Scenarios for the U.S. National Climate Assessment. Part 2. Climate of the Southeast U.S. |
NCA 3 |
 |
|
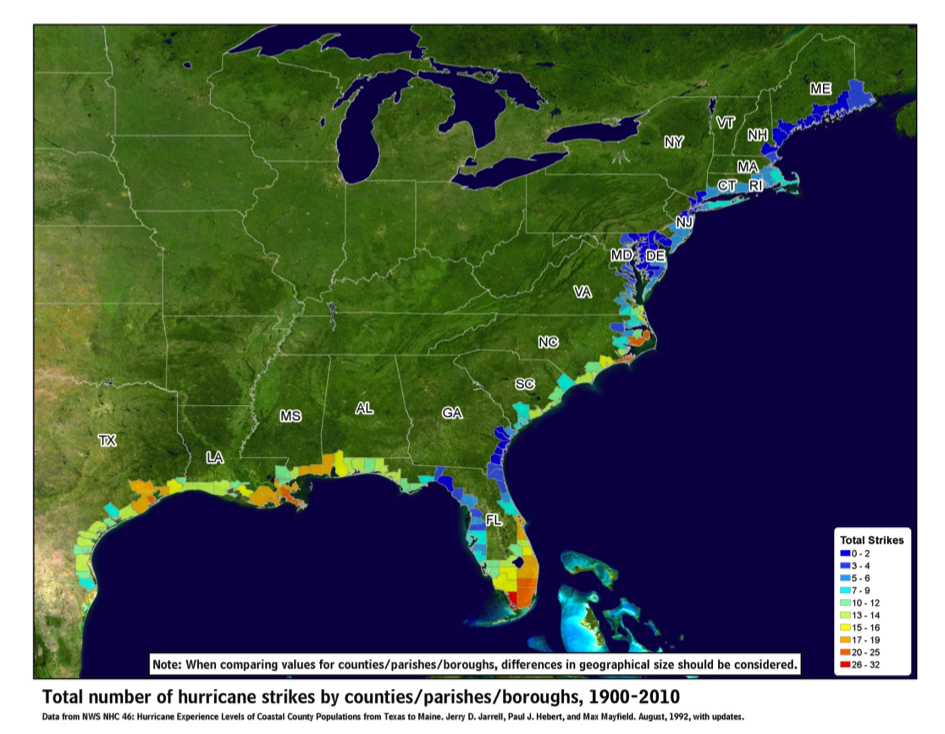
Number of hurricane strikes per county along the Northeast coast |
Observed |
Tropical Cyclones |
National |
Regional Climate Trends and Scenarios for the U.S. National Climate Assessment. Part 9. Climate of the Contiguous United States |
NCA 3 |
 |
|
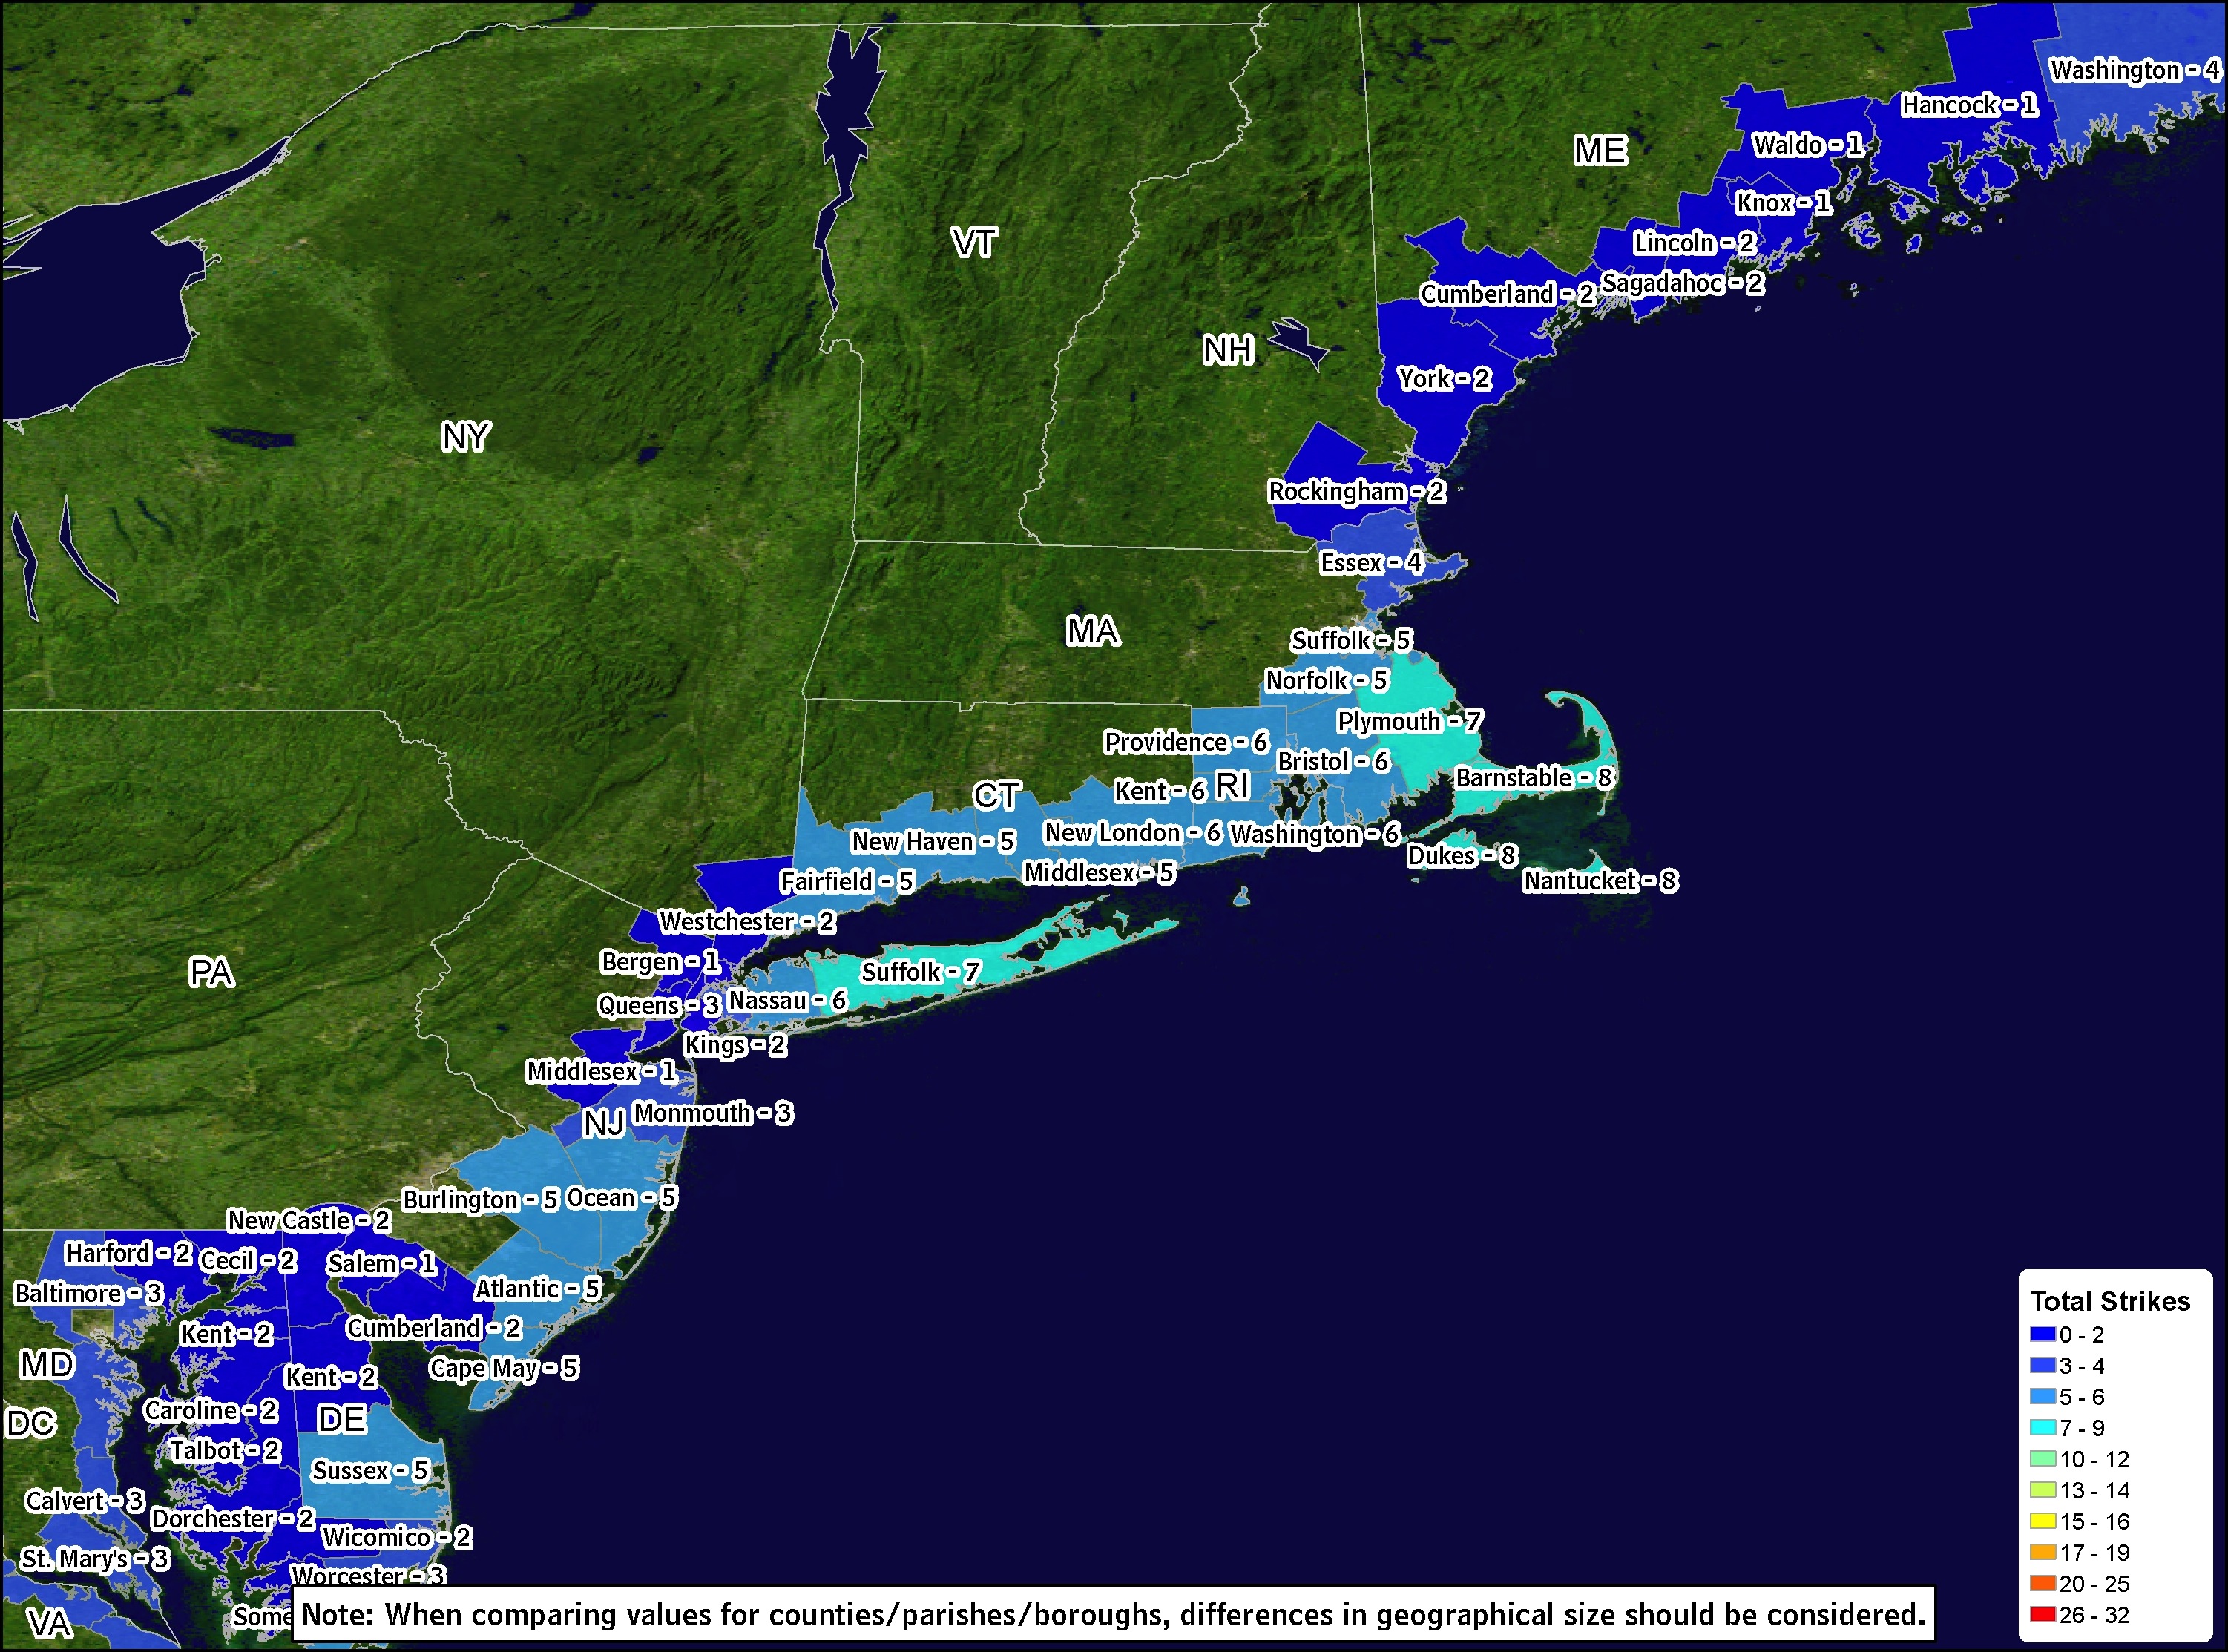
Number of hurricane strikes per county along the Northeast coast |
Observed |
Tropical Cyclones |
Northeast |
Regional Climate Trends and Scenarios for the U.S. National Climate Assessment. Part 1. Climate of the Northeast U.S. |
NCA 3 |
 |
|
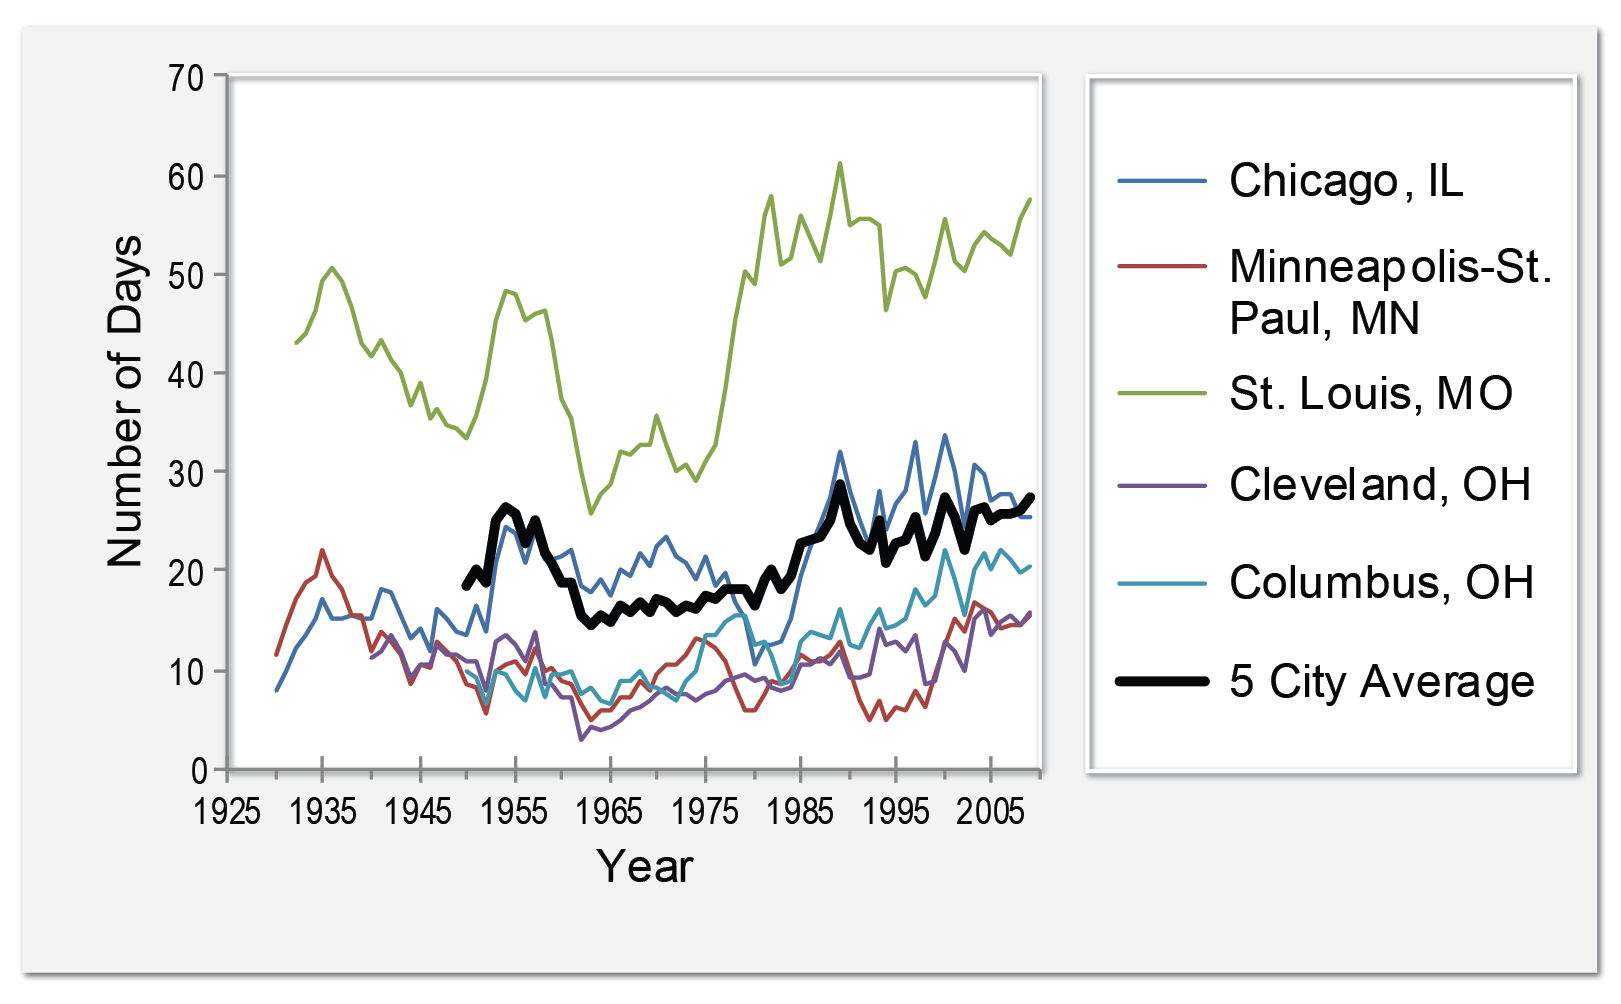
Number of days with minimum temperatures equal to or exceeding 70F at 5 large Midwestern cities |
Observed |
Temperature |
Midwest |
Regional Climate Trends and Scenarios for the U.S. National Climate Assessment. Part 3. Climate of the Midwest U.S. |
NCA 3 |
 |
|
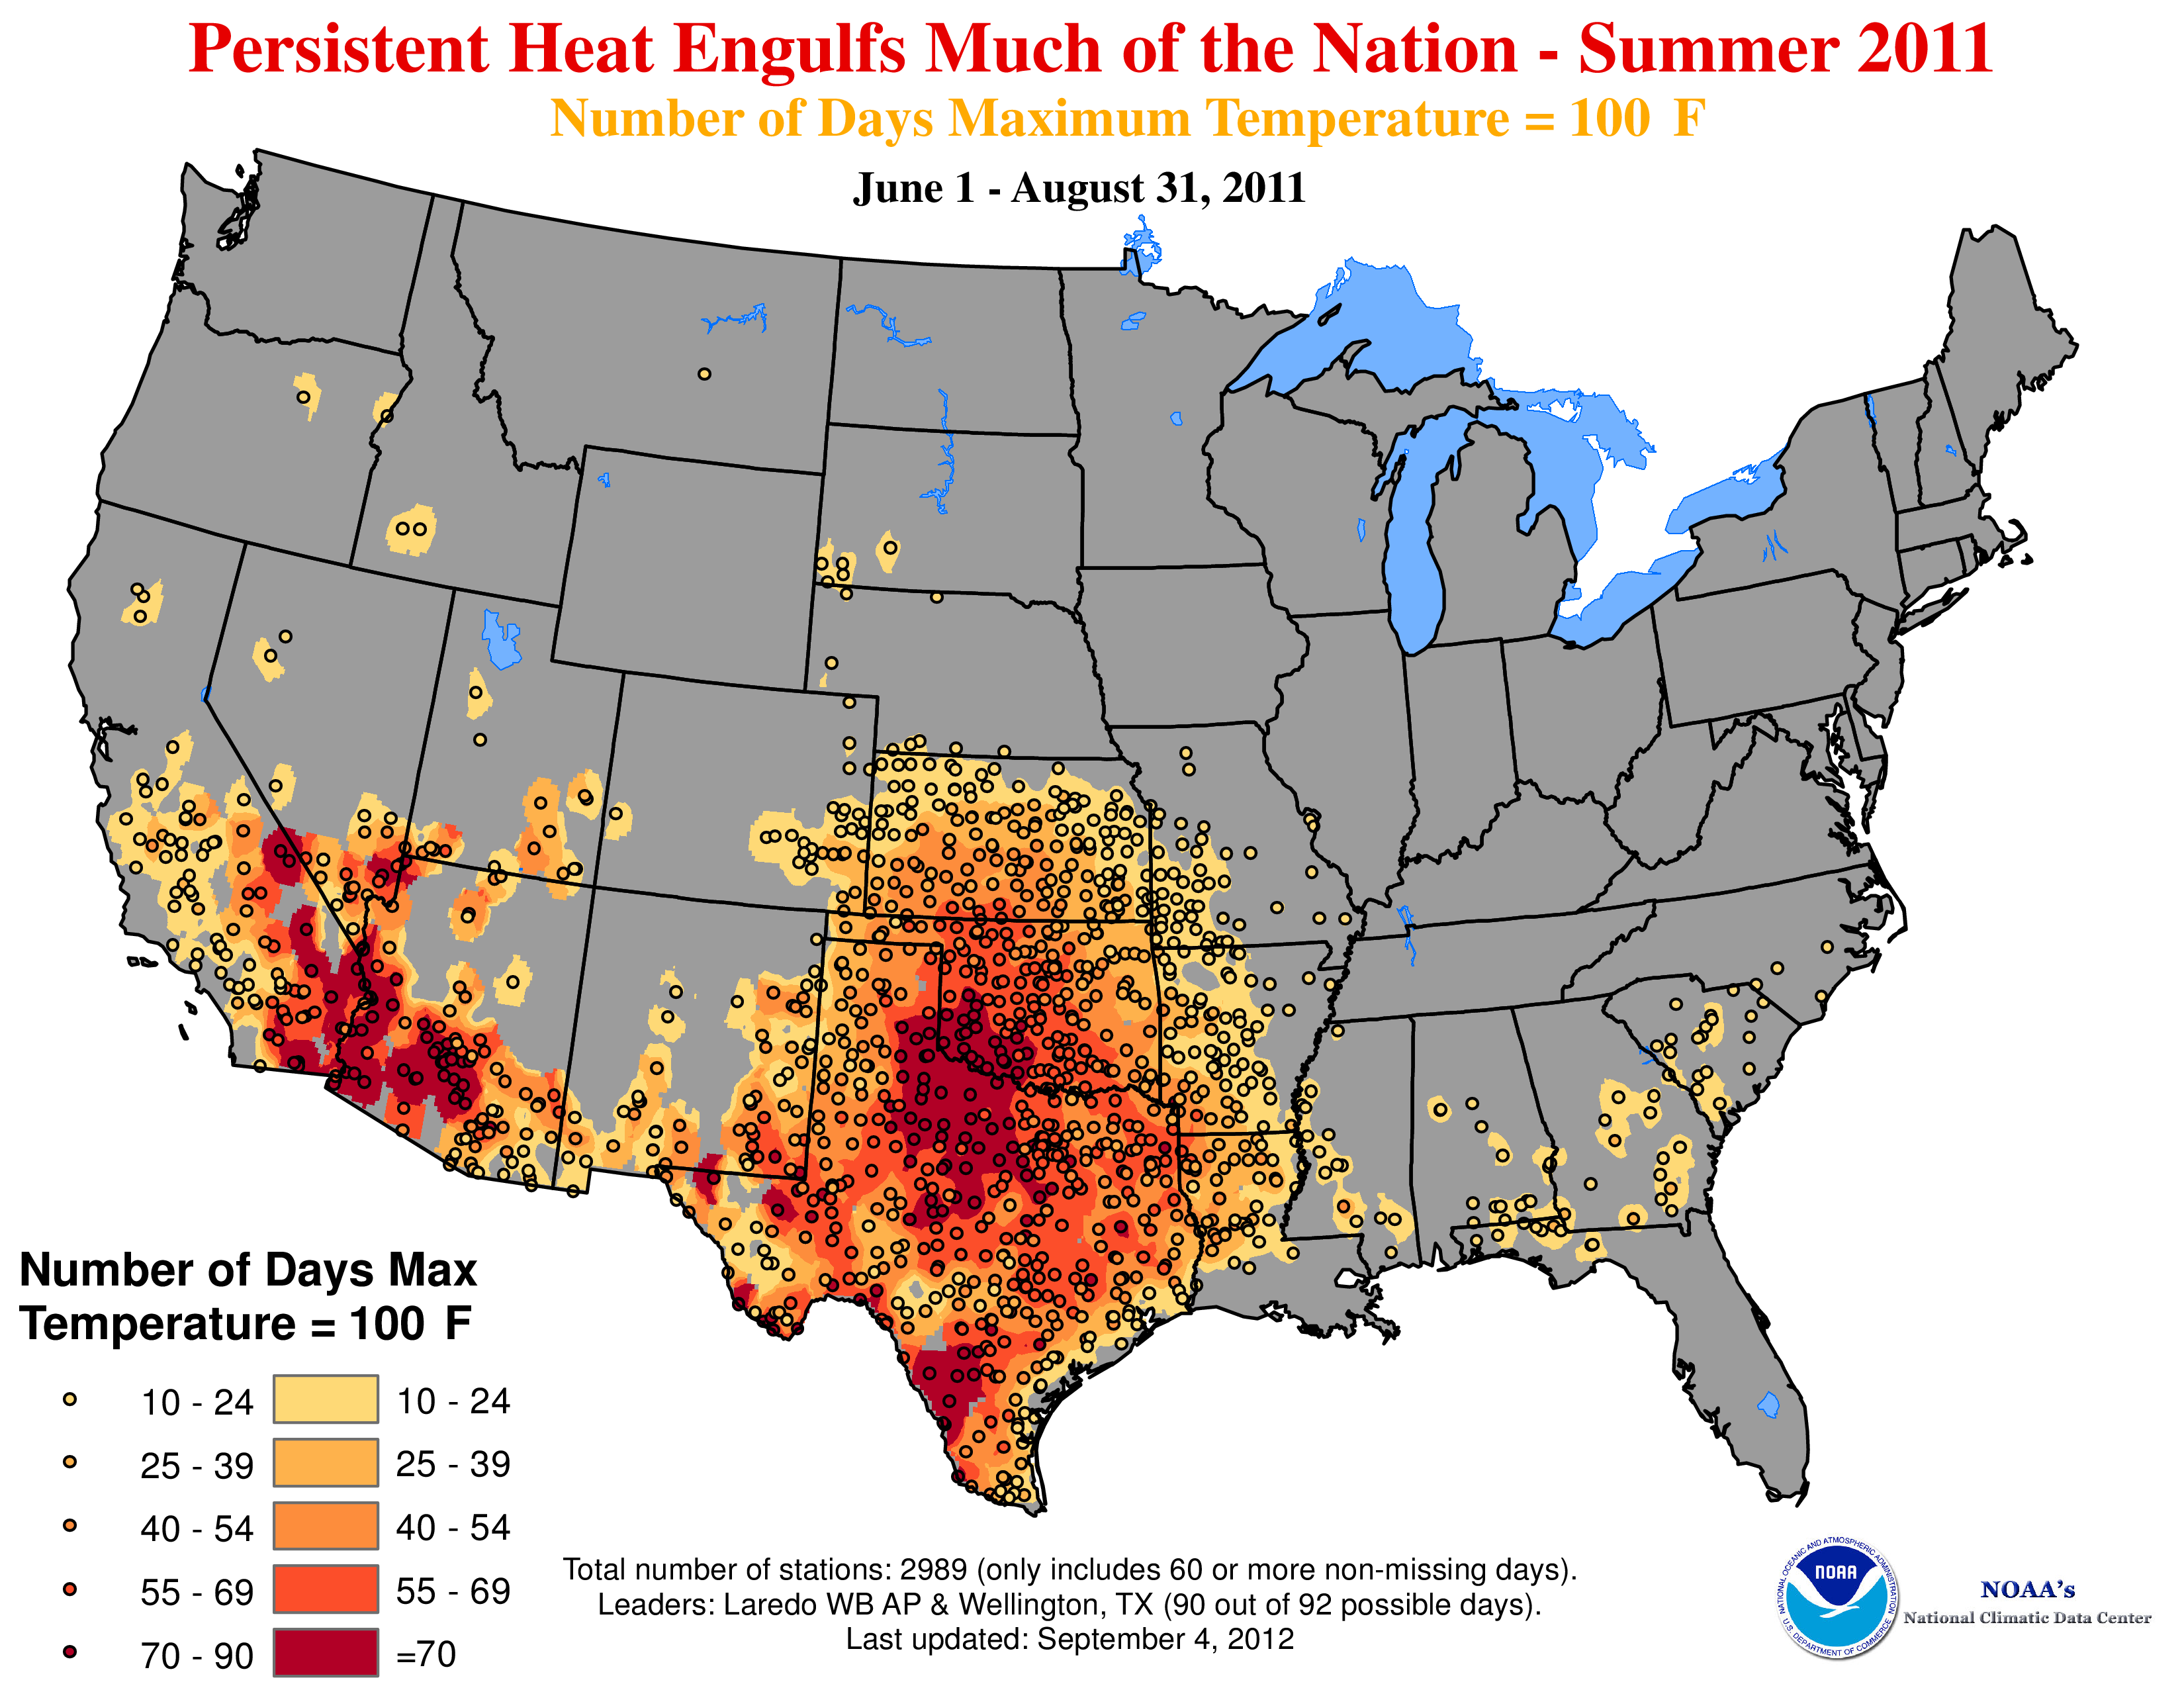
Number of days with maximum temperature exceeding 100F |
Observed |
Temperature |
National |
Regional Climate Trends and Scenarios for the U.S. National Climate Assessment. Part 9. Climate of the Contiguous United States |
NCA 3 |
 |
|
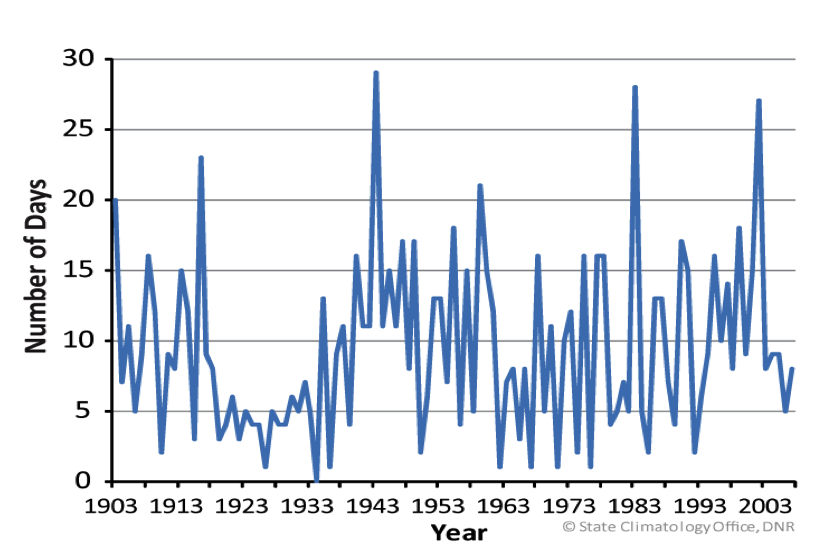
Number of days with maximum temperature exceeding 100F |
Observed |
Temperature |
Great Plains |
Regional Climate Trends and Scenarios for the U.S. National Climate Assessment. Part 4. Climate of the U.S. Great Plains |
NCA 3 |
 |
|
Number of days with late afternoon dewpoint equal to or exceeding 70F at Minneapolis-St. Paul |
Observed |
Temperature |
Midwest |
Regional Climate Trends and Scenarios for the U.S. National Climate Assessment. Part 3. Climate of the Midwest U.S. |
NCA 3 |
 |
|
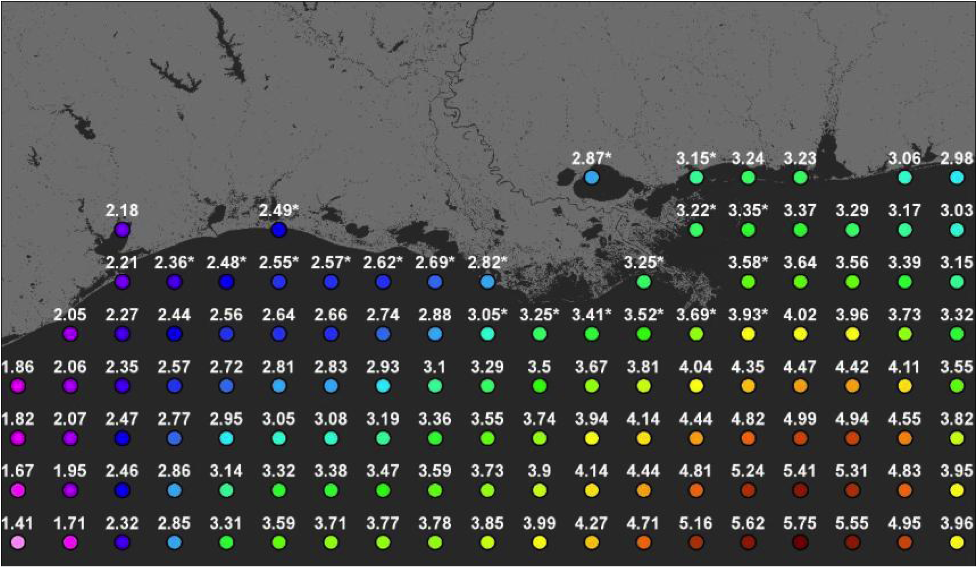
Northcentral Gulf of Mexico satellite altimetry record (1993 to 2011) |
Observed |
Sea |
Southeast and Caribbean |
Global Sea Level Rise Scenarios for the United States National Climate Assessment |
NCA 3 |
 |
|
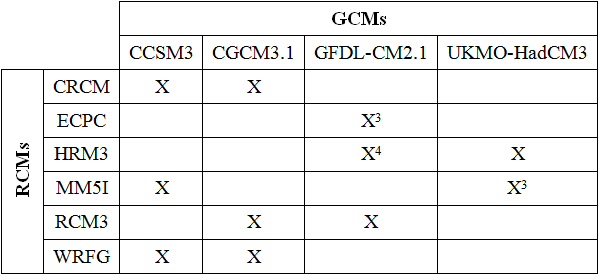
NARCCAP Models Listing |
Simulated |
|
Southeast and Caribbean |
Regional Climate Trends and Scenarios for the U.S. National Climate Assessment. Part 2. Climate of the Southeast U.S. |
NCA 3 |
 |
|
NARCCAP Models Listing |
Simulated |
|
Great Plains |
Regional Climate Trends and Scenarios for the U.S. National Climate Assessment. Part 4. Climate of the U.S. Great Plains |
NCA 3 |
 |
|
NARCCAP Models Listing |
Simulated |
|
National |
Regional Climate Trends and Scenarios for the U.S. National Climate Assessment. Part 9. Climate of the Contiguous United States |
NCA 3 |
 |
|
NARCCAP Models Listing |
Simulated |
|
Northeast |
Regional Climate Trends and Scenarios for the U.S. National Climate Assessment. Part 1. Climate of the Northeast U.S. |
NCA 3 |
 |
|
NARCCAP Models Listing |
Simulated |
|
Southwest |
Regional Climate Trends and Scenarios for the U.S. National Climate Assessment. Part 5. Climate of the Southwest U.S. |
NCA 3 |
 |
|
NARCCAP Models Listing |
Simulated |
|
Northwest |
Regional Climate Trends and Scenarios for the U.S. National Climate Assessment. Part 6. Climate of the Northwest U.S. |
NCA 3 |
 |
|
NARCCAP Models Listing |
Simulated |
|
Midwest |
Regional Climate Trends and Scenarios for the U.S. National Climate Assessment. Part 3. Climate of the Midwest U.S. |
NCA 3 |
 |
|
Morganza Floodway opened in Louisiana |
Observed |
Rivers |
Southeast and Caribbean |
Regional Climate Trends and Scenarios for the U.S. National Climate Assessment. Part 2. Climate of the Southeast U.S. |
NCA 3 |
 |
|
Monthly rainfall over the main Hawaiian Islands from the regional WRF-ARW model |
Observed, Simulated |
Precipitation |
Hawaii and Pacific Islands |
Regional Climate Trends and Scenarios for the U.S. National Climate Assessment. Part 8. Climate of the Pacific Islands |
NCA 3 |
 |
|
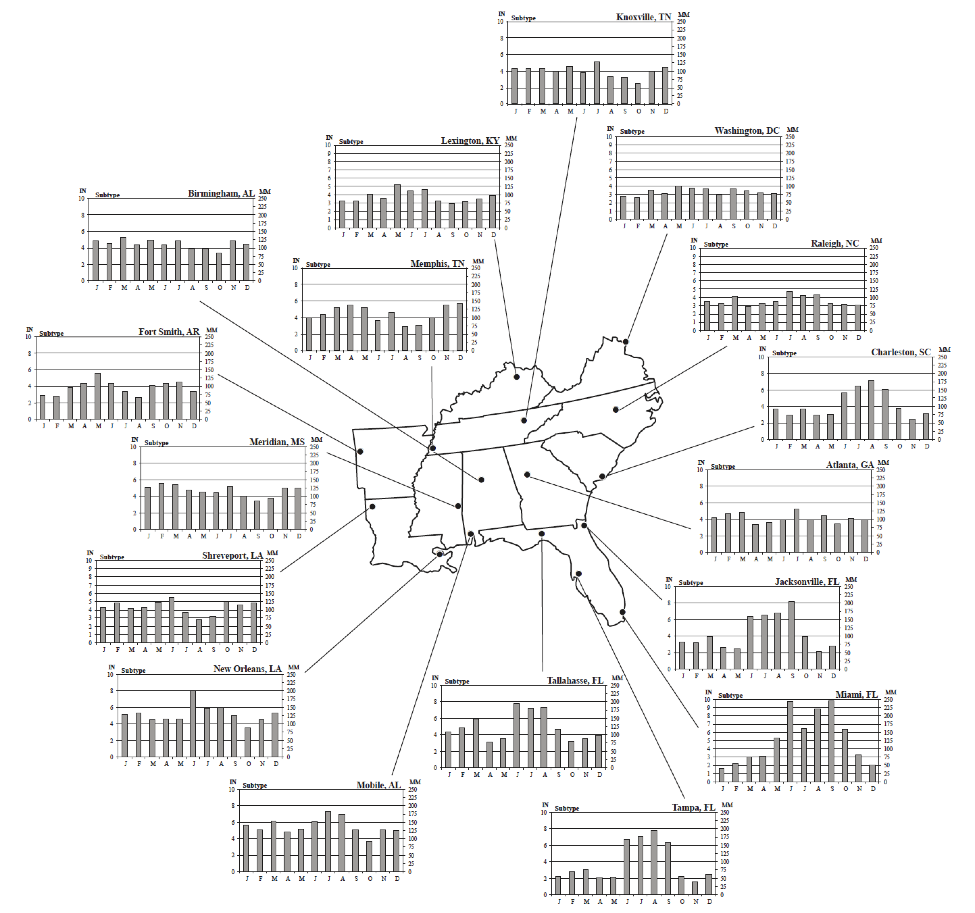
Monthly precipitation normals |
Observed |
Precipitation |
Southeast and Caribbean |
Regional Climate Trends and Scenarios for the U.S. National Climate Assessment. Part 2. Climate of the Southeast U.S. |
NCA 3 |
 |
|
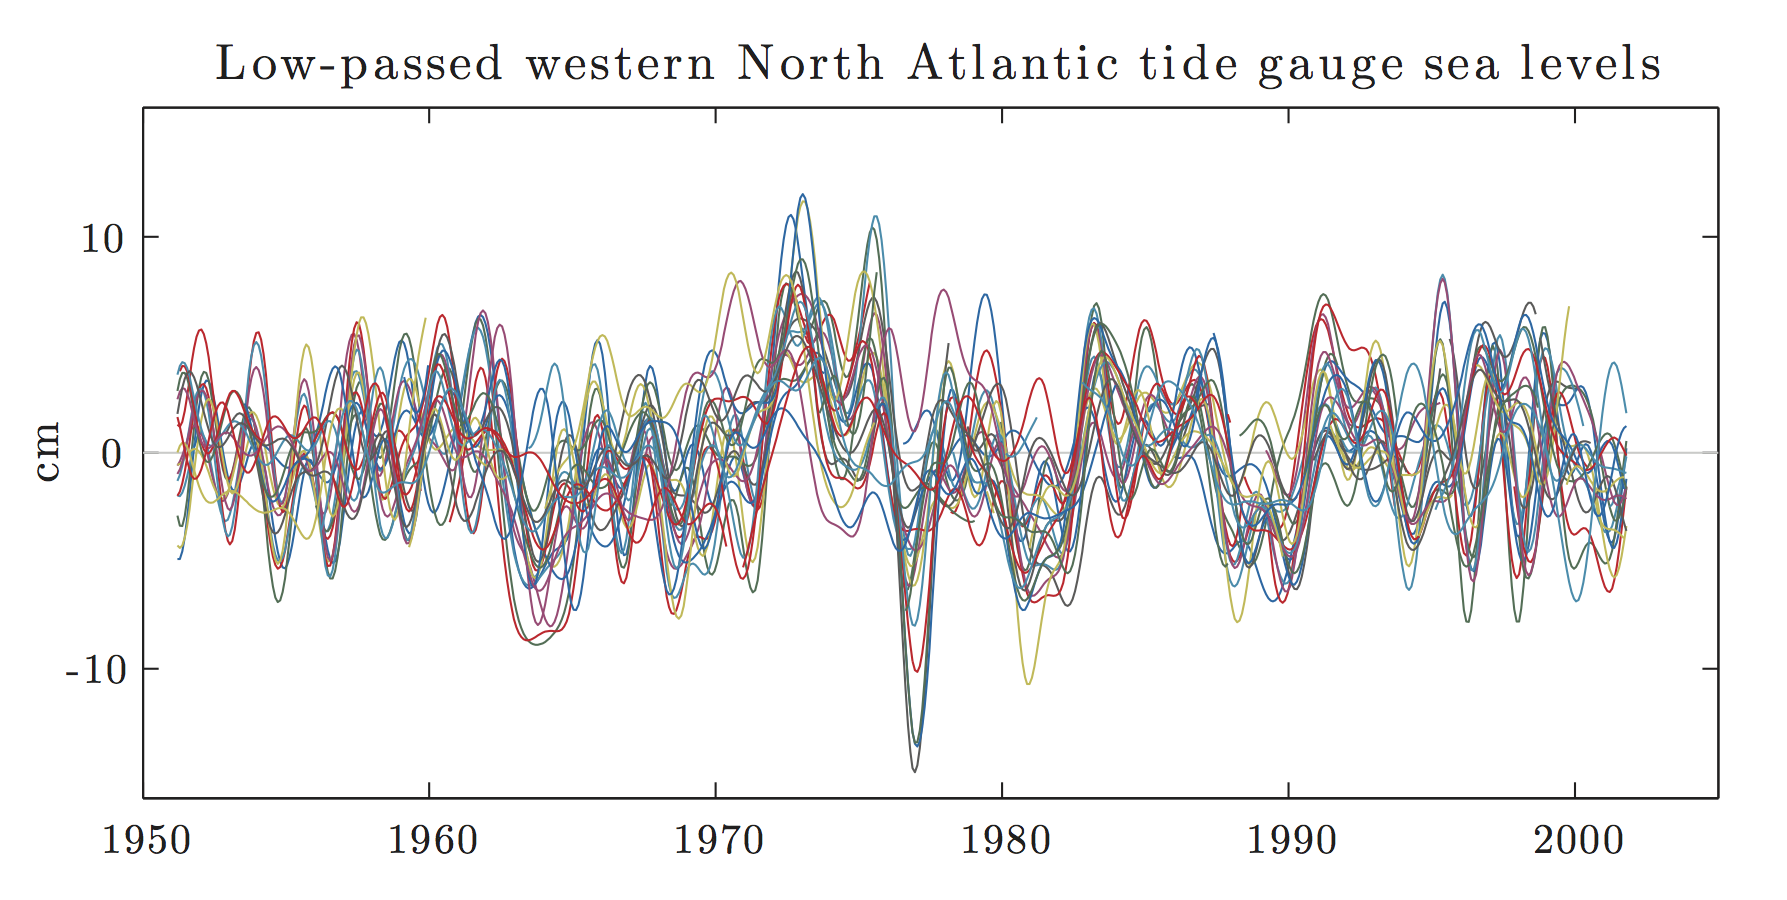
Monthly mean tide gauge sea levels from the Gulf of Mexico (Galveston, TX) to the western North Atlantic (Wilmington, DE) |
Observed |
Sea |
Southeast and Caribbean |
Global Sea Level Rise Scenarios for the United States National Climate Assessment |
NCA 3 |
 |
|
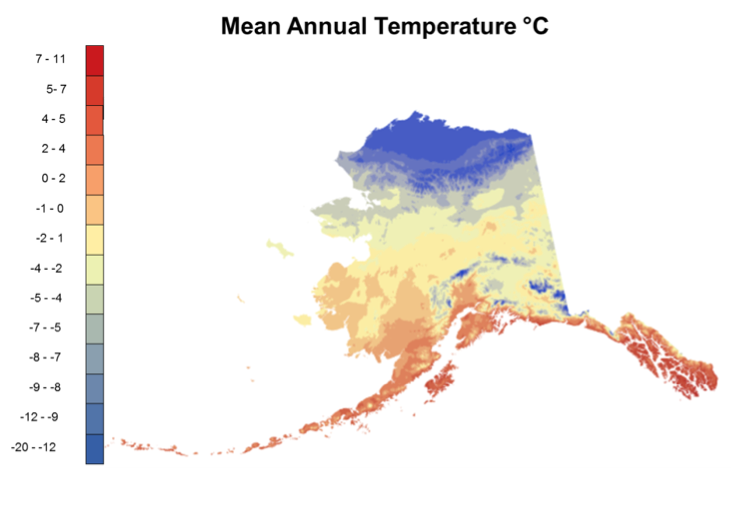
Mean annual temperature in Alaska |
Observed |
Temperature |
Alaska and Arctic |
Regional Climate Trends and Scenarios for the U.S. National Climate Assessment. Part 7. Climate of Alaska |
NCA 3 |
 |
|
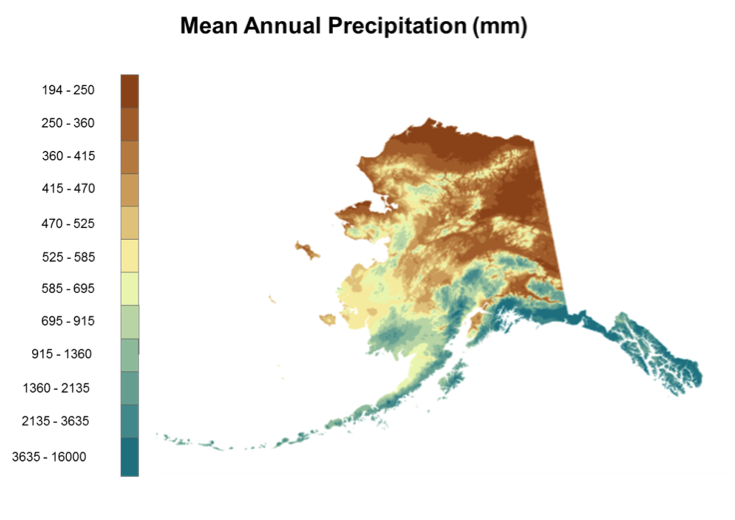
Mean annual precipitation in Alaska |
Observed |
Precipitation |
Alaska and Arctic |
Regional Climate Trends and Scenarios for the U.S. National Climate Assessment. Part 7. Climate of Alaska |
NCA 3 |
 |
|
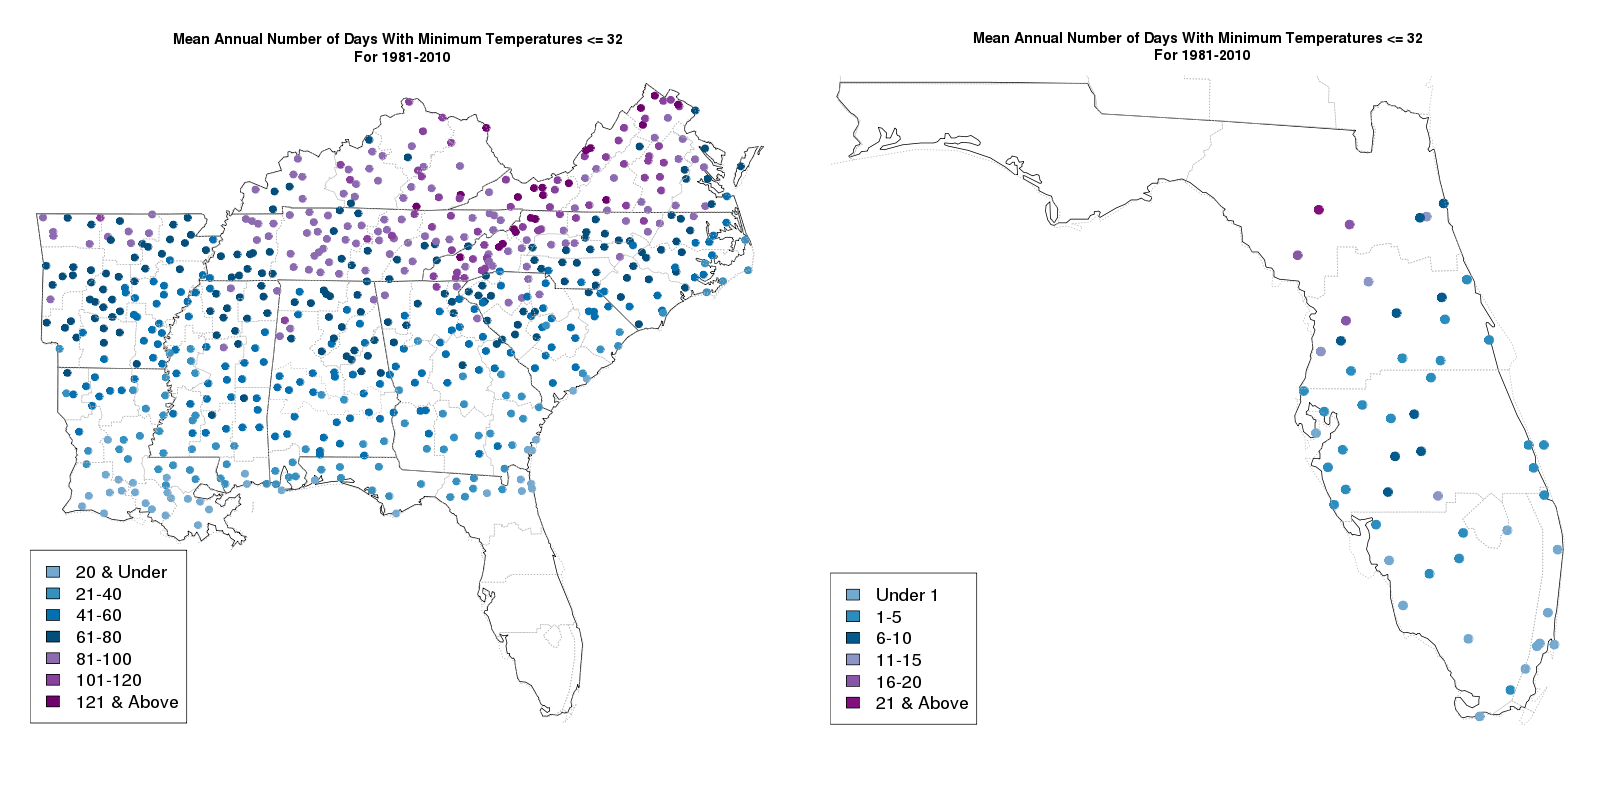
Mean annual number of days with a minimum temperature <= 32F |
Observed |
Temperature |
Southeast and Caribbean |
Regional Climate Trends and Scenarios for the U.S. National Climate Assessment. Part 2. Climate of the Southeast U.S. |
NCA 3 |
 |
|
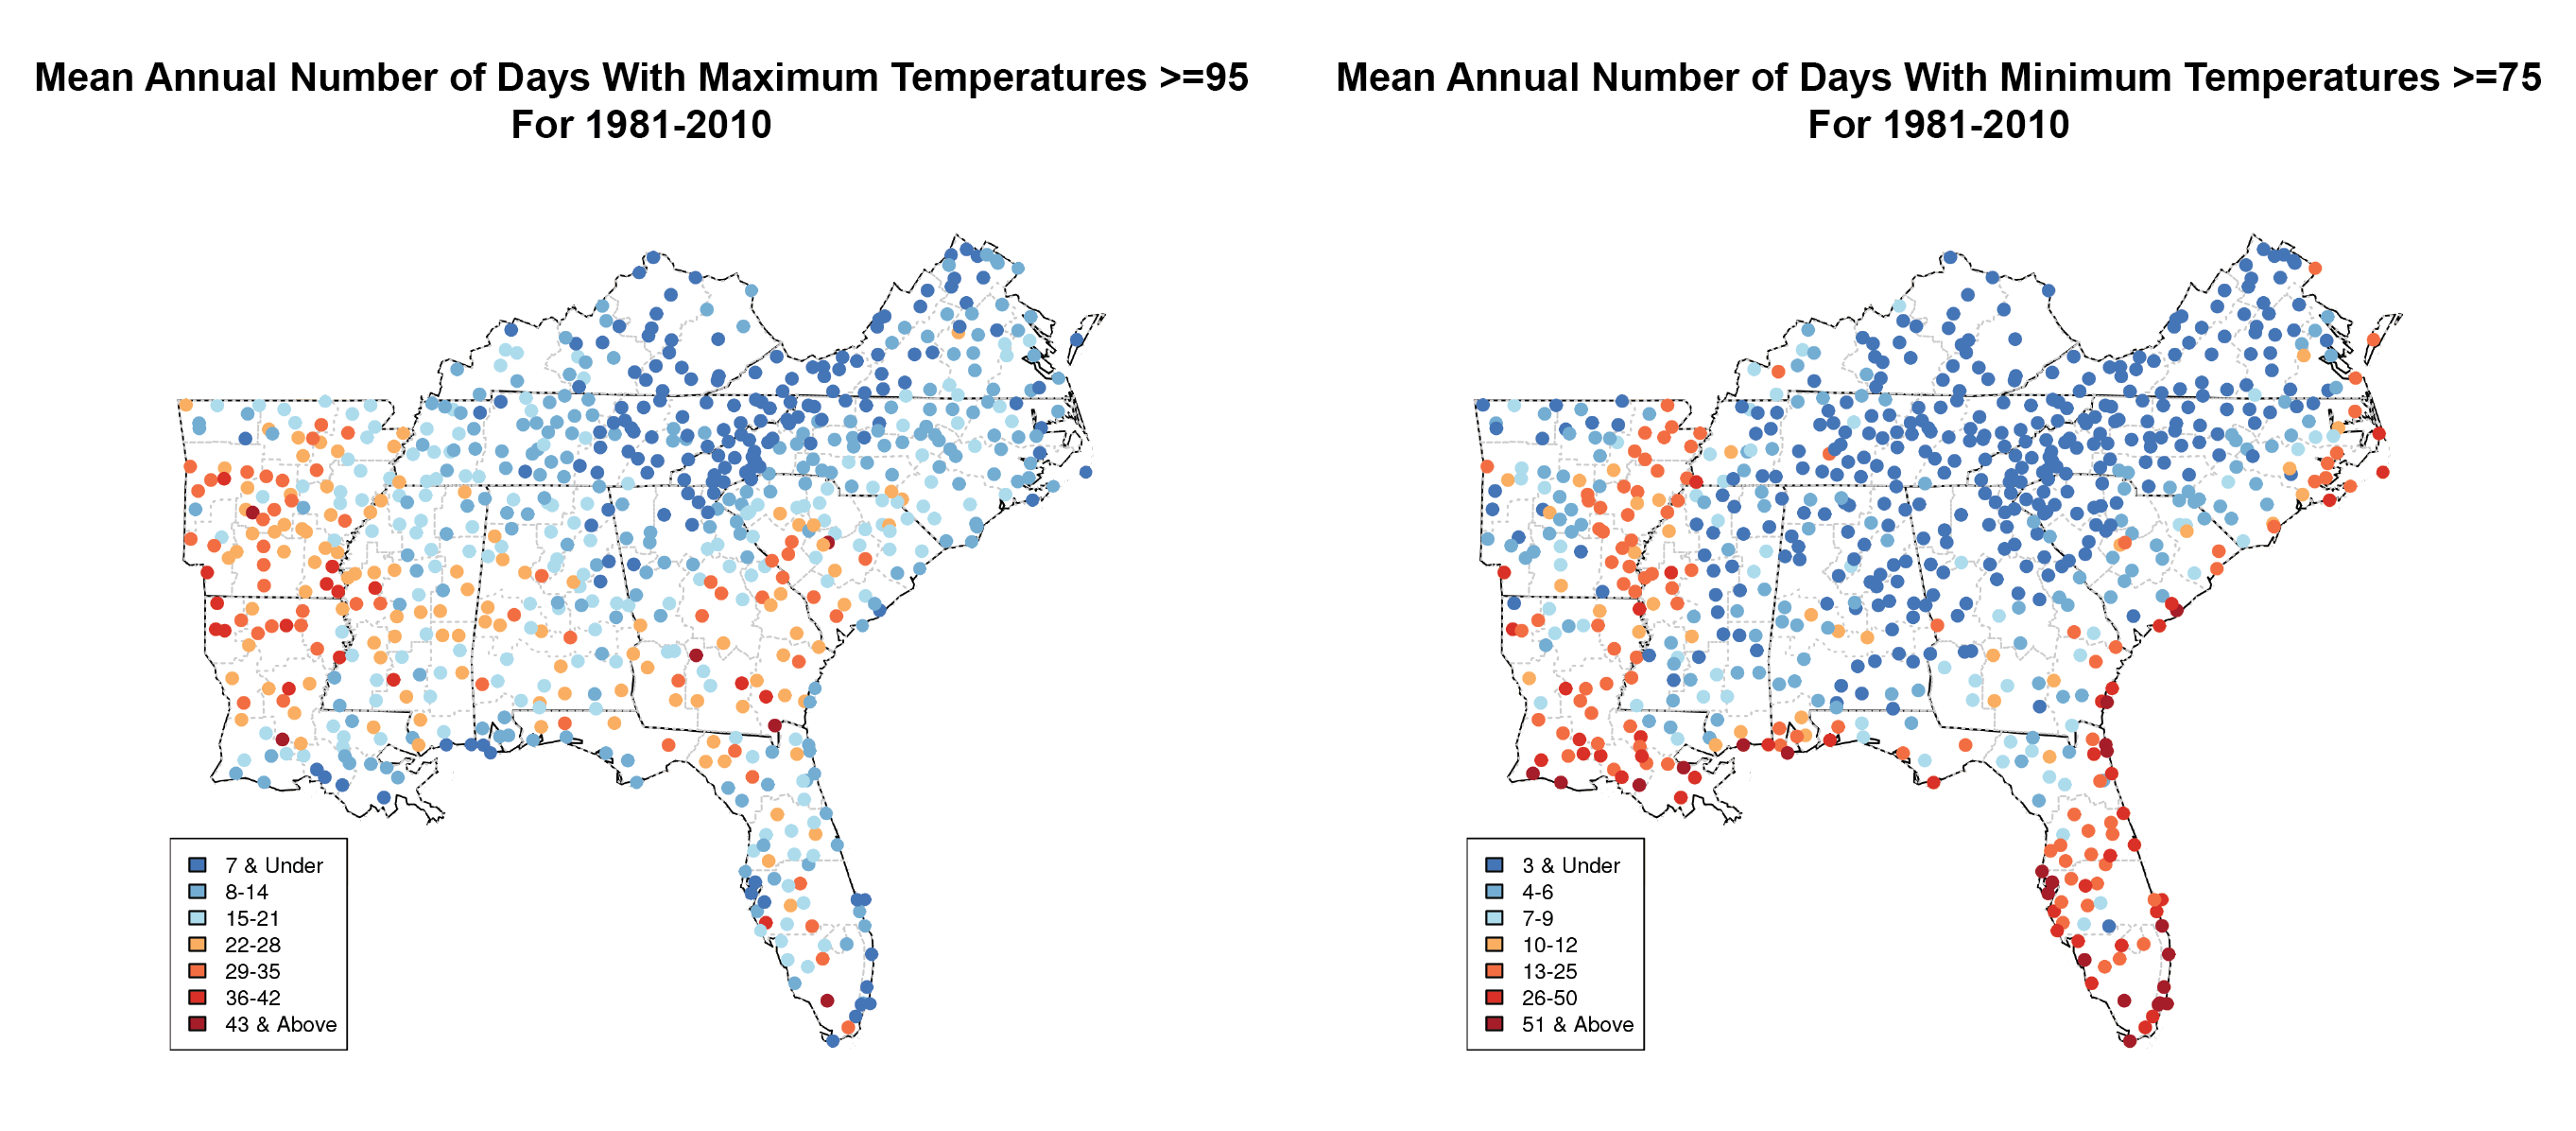
Mean annual number of days with a maximum temperature >=95F and a minimum temperature >=75F |
Observed |
Temperature |
Southeast and Caribbean |
Regional Climate Trends and Scenarios for the U.S. National Climate Assessment. Part 2. Climate of the Southeast U.S. |
NCA 3 |
 |
|
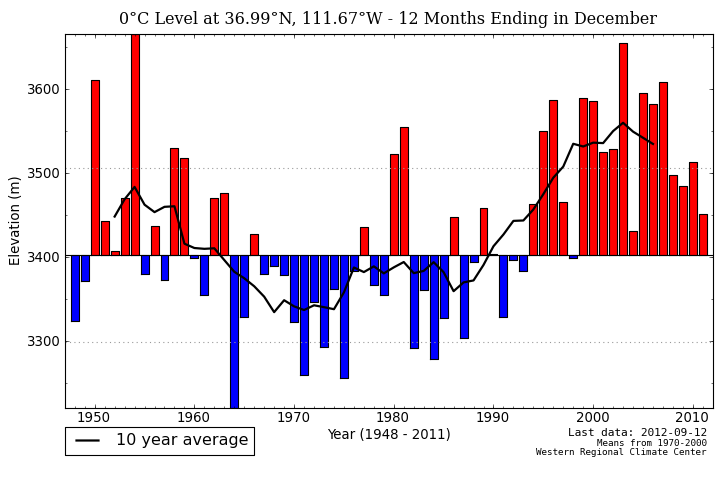
Mean annual freezing level in the center of the Southwest |
Observed |
Temperature |
Southwest |
Regional Climate Trends and Scenarios for the U.S. National Climate Assessment. Part 5. Climate of the Southwest U.S. |
NCA 3 |
 |
|
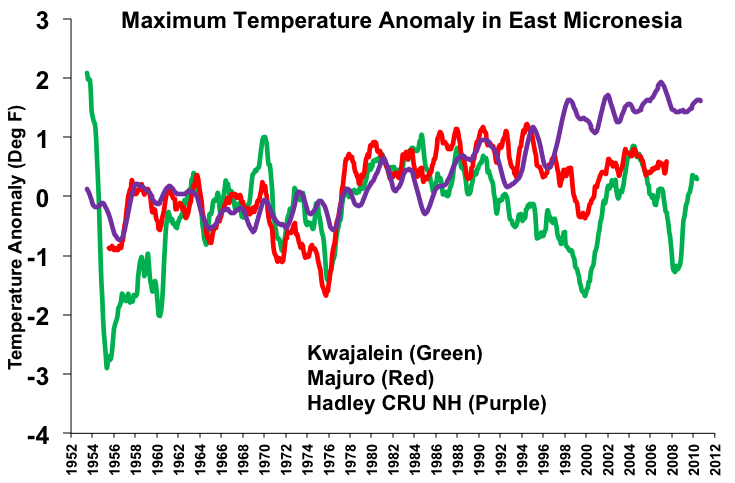
Maximum temperature anomaly in East Micronesia |
Observed |
Temperature |
Hawaii and Pacific Islands |
Regional Climate Trends and Scenarios for the U.S. National Climate Assessment. Part 8. Climate of the Pacific Islands |
NCA 3 |
 |
|
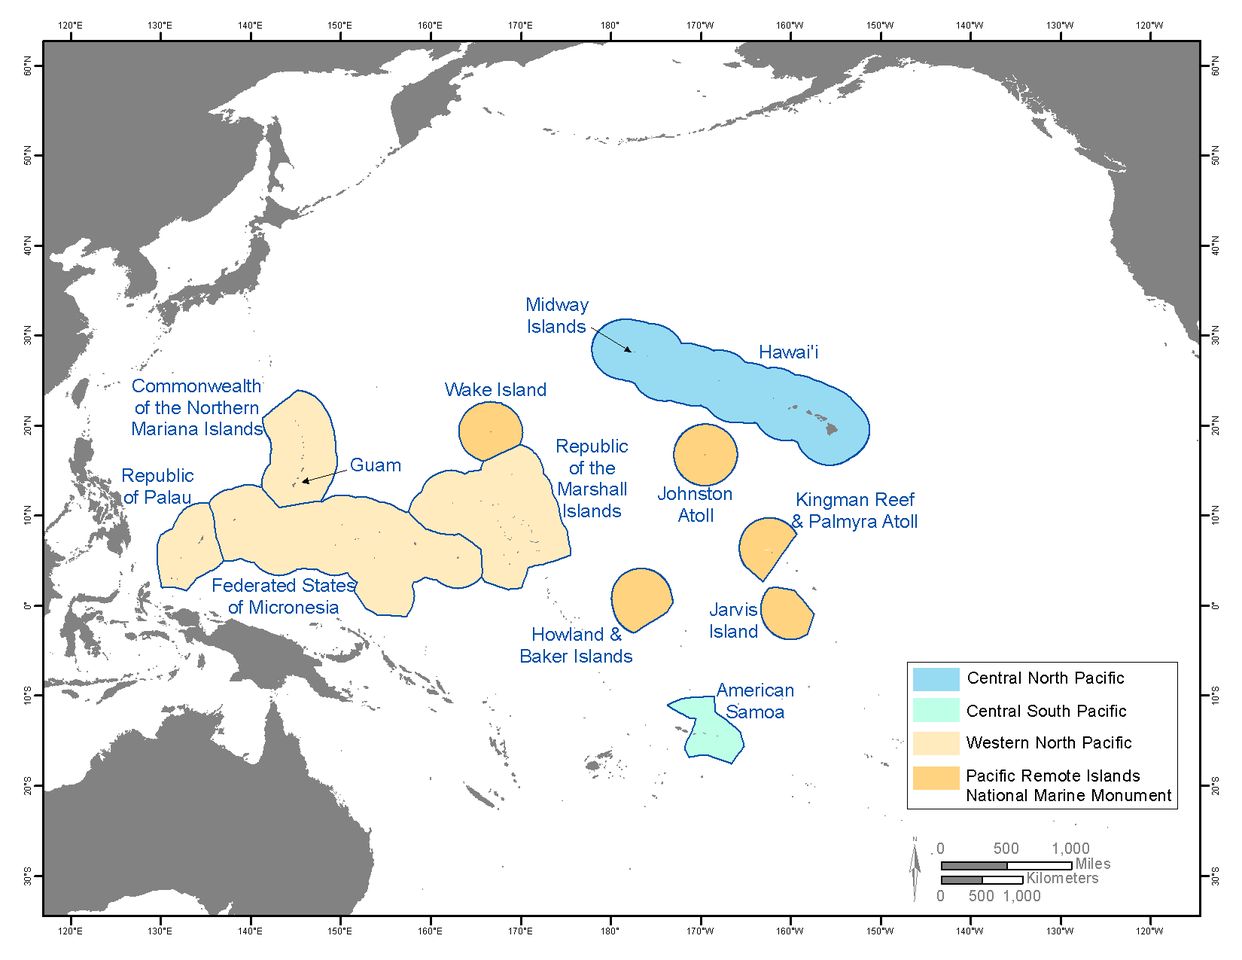
Map of the Pacific Islands region and sub-regions |
Observed |
|
Hawaii and Pacific Islands |
Regional Climate Trends and Scenarios for the U.S. National Climate Assessment. Part 8. Climate of the Pacific Islands |
NCA 3 |
 |
|
Long-term change in ice-cover duration for Lake Mendota, WI |
Observed |
Ice |
National |
Regional Climate Trends and Scenarios for the U.S. National Climate Assessment. Part 9. Climate of the Contiguous United States |
NCA 3 |
 |
|
Long-term change in ice-cover duration for Lake Mendota, WI |
Observed |
Ice |
Midwest |
Regional Climate Trends and Scenarios for the U.S. National Climate Assessment. Part 3. Climate of the Midwest U.S. |
NCA 3 |
 |
|
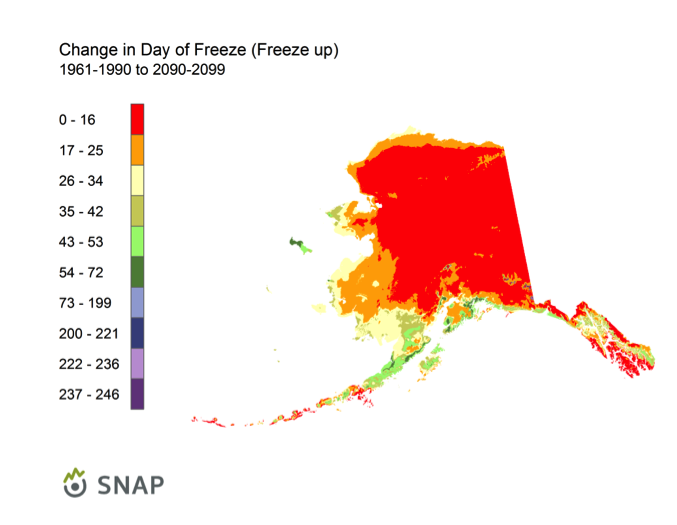
IPCC model simulations of change in date of the first autumn freeze for Alaska |
Simulated |
Temperature |
Alaska and Arctic |
Regional Climate Trends and Scenarios for the U.S. National Climate Assessment. Part 7. Climate of Alaska |
NCA 3 |
 |
|
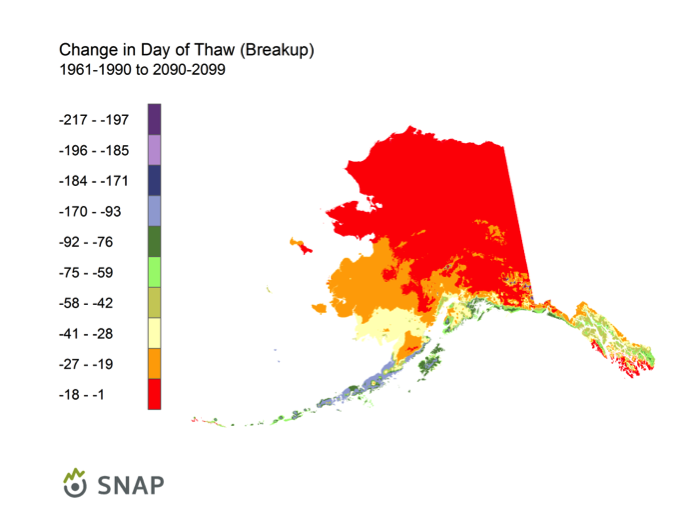
IPCC model simulations of change in date of the final spring freeze for Alaska |
Simulated |
Temperature |
Alaska and Arctic |
Regional Climate Trends and Scenarios for the U.S. National Climate Assessment. Part 7. Climate of Alaska |
NCA 3 |
 |
|
Information on U.S. billion dollar disasters |
Observed |
Disasters |
National |
Regional Climate Trends and Scenarios for the U.S. National Climate Assessment. Part 9. Climate of the Contiguous United States |
NCA 3 |
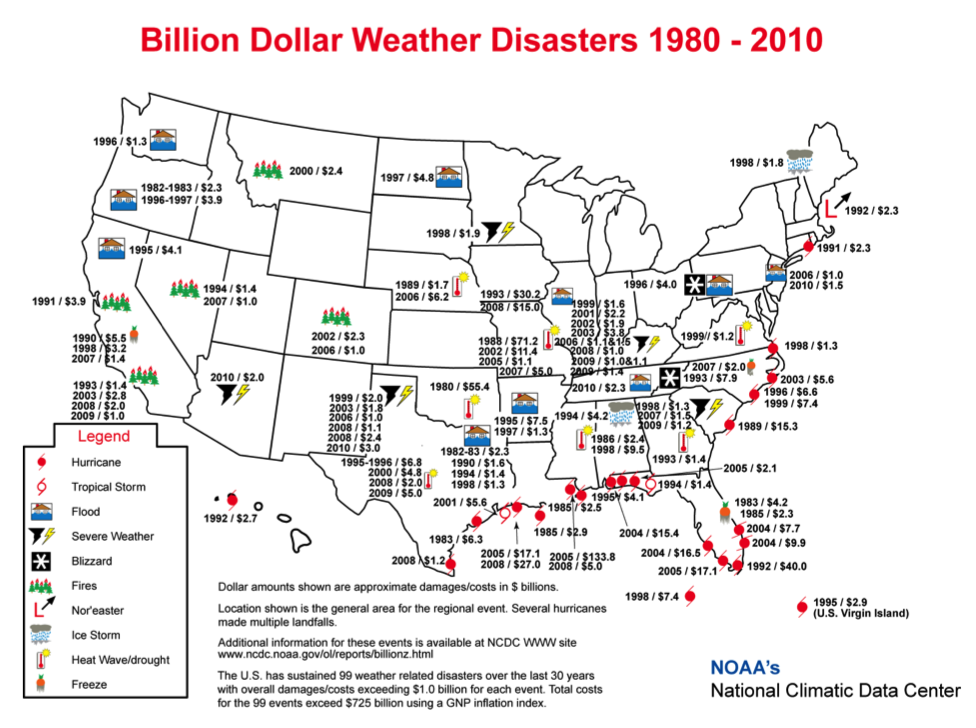 |
|
Hydrographs of lake levels for each of the Great Lakes |
Observed |
Lakes |
National |
Regional Climate Trends and Scenarios for the U.S. National Climate Assessment. Part 9. Climate of the Contiguous United States |
NCA 3 |
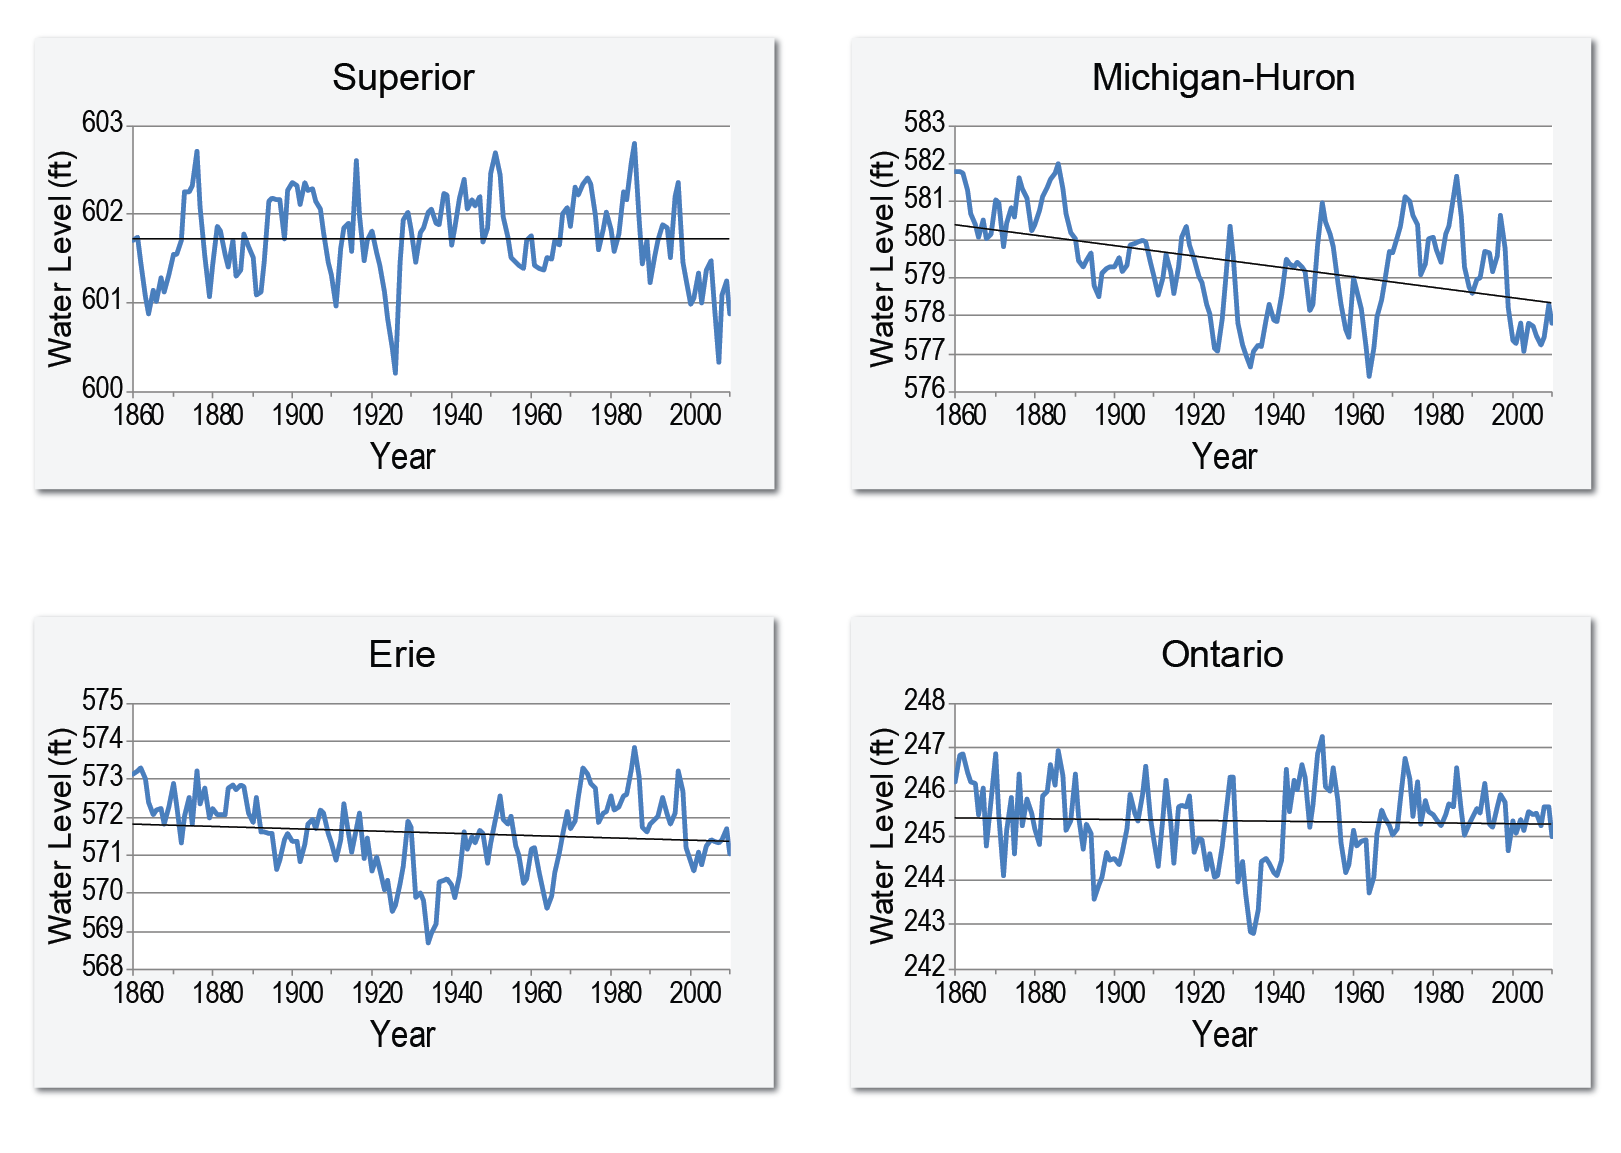 |
|
Hydrographs of lake levels for each of the Great Lakes |
Observed |
Lakes |
Midwest |
Regional Climate Trends and Scenarios for the U.S. National Climate Assessment. Part 3. Climate of the Midwest U.S. |
NCA 3 |
 |
|
Great Salt Lake elevation |
Observed |
Lakes |
National |
Regional Climate Trends and Scenarios for the U.S. National Climate Assessment. Part 9. Climate of the Contiguous United States |
NCA 3 |
 |
|
Great Salt Lake elevation |
Observed |
Lakes |
Southwest |
Regional Climate Trends and Scenarios for the U.S. National Climate Assessment. Part 5. Climate of the Southwest U.S. |
NCA 3 |
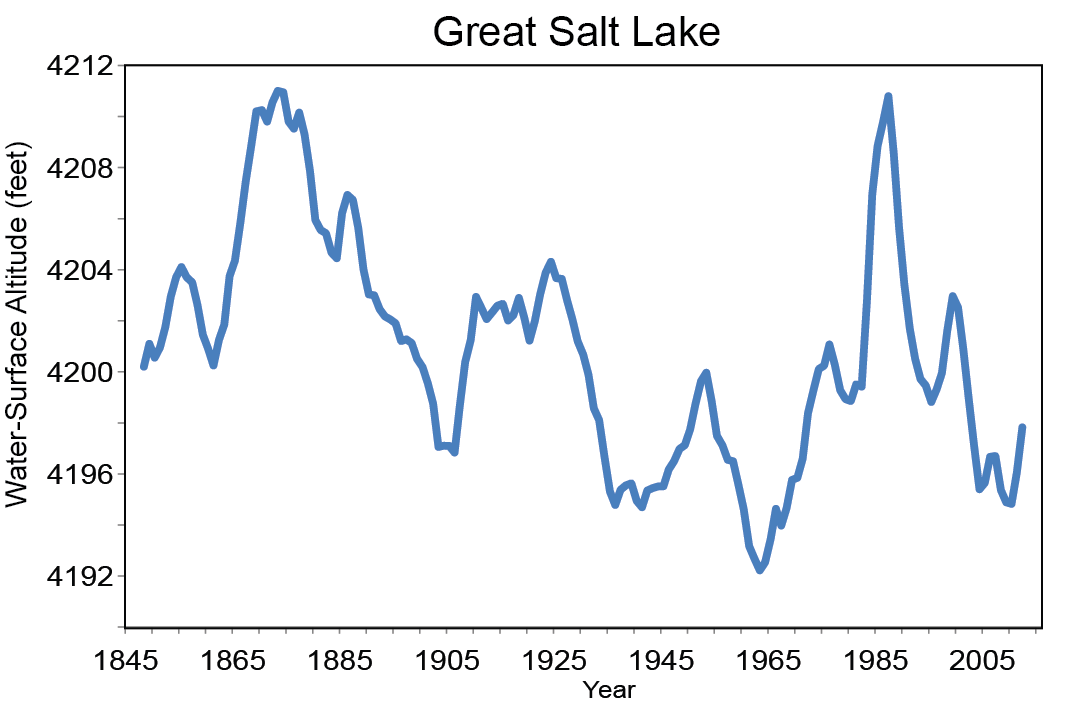 |
|
Global mean sea level rise scenarios |
Observed, Simulated |
Sea |
Global |
Global Sea Level Rise Scenarios for the United States National Climate Assessment |
NCA 3 |
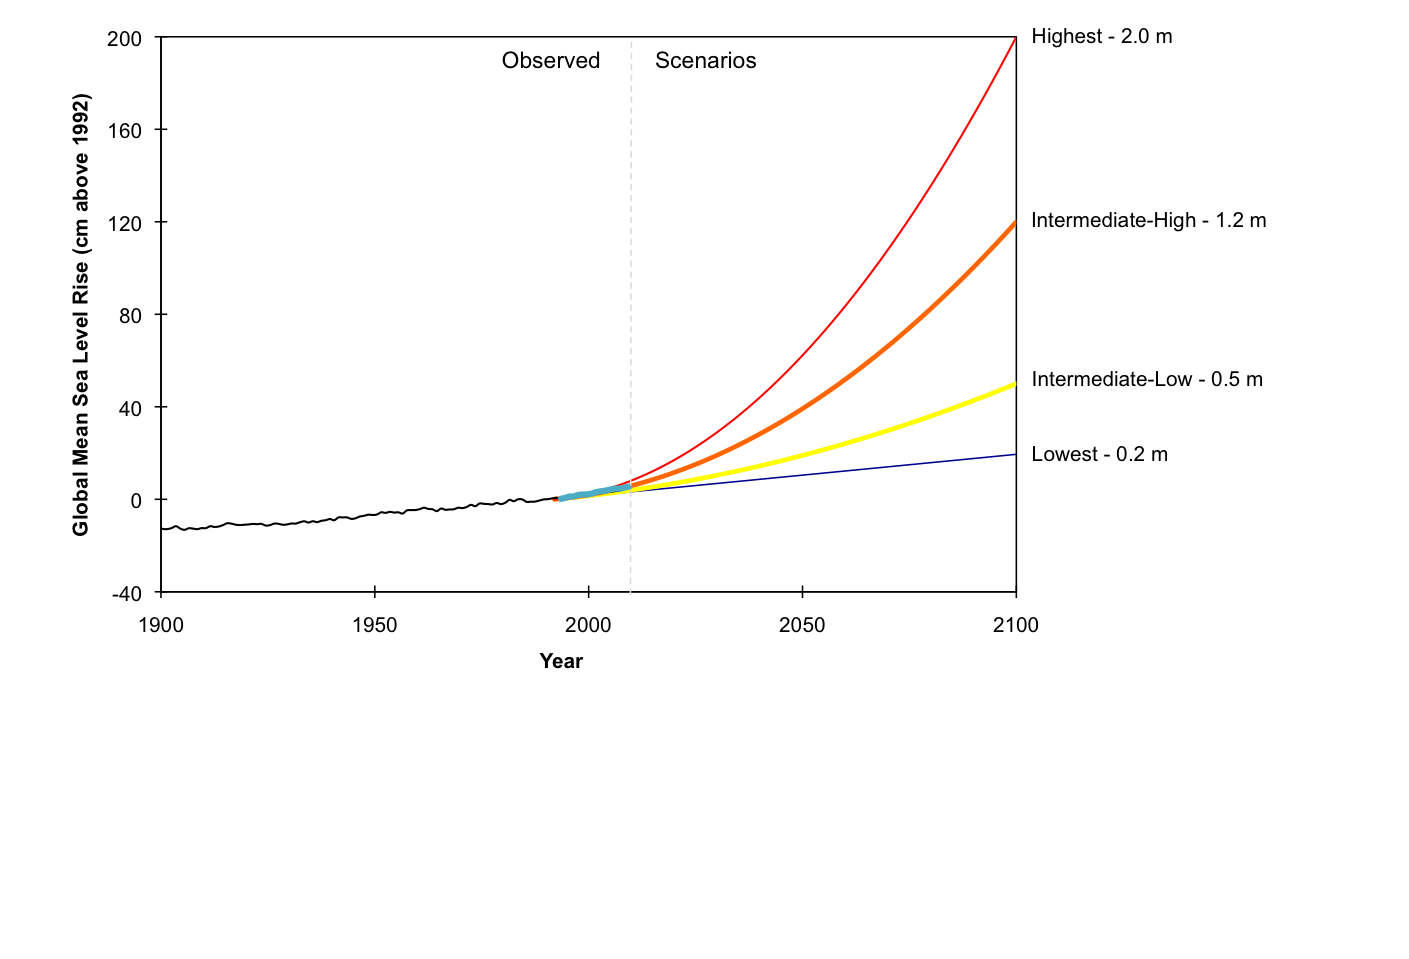 |
|
Geographic variability in the rate of global sea level change (1992 to 2010) based on three satellite records: TOPEX, Jason 1 and Jason 2 |
Observed |
Sea |
Global |
Global Sea Level Rise Scenarios for the United States National Climate Assessment |
NCA 3 |
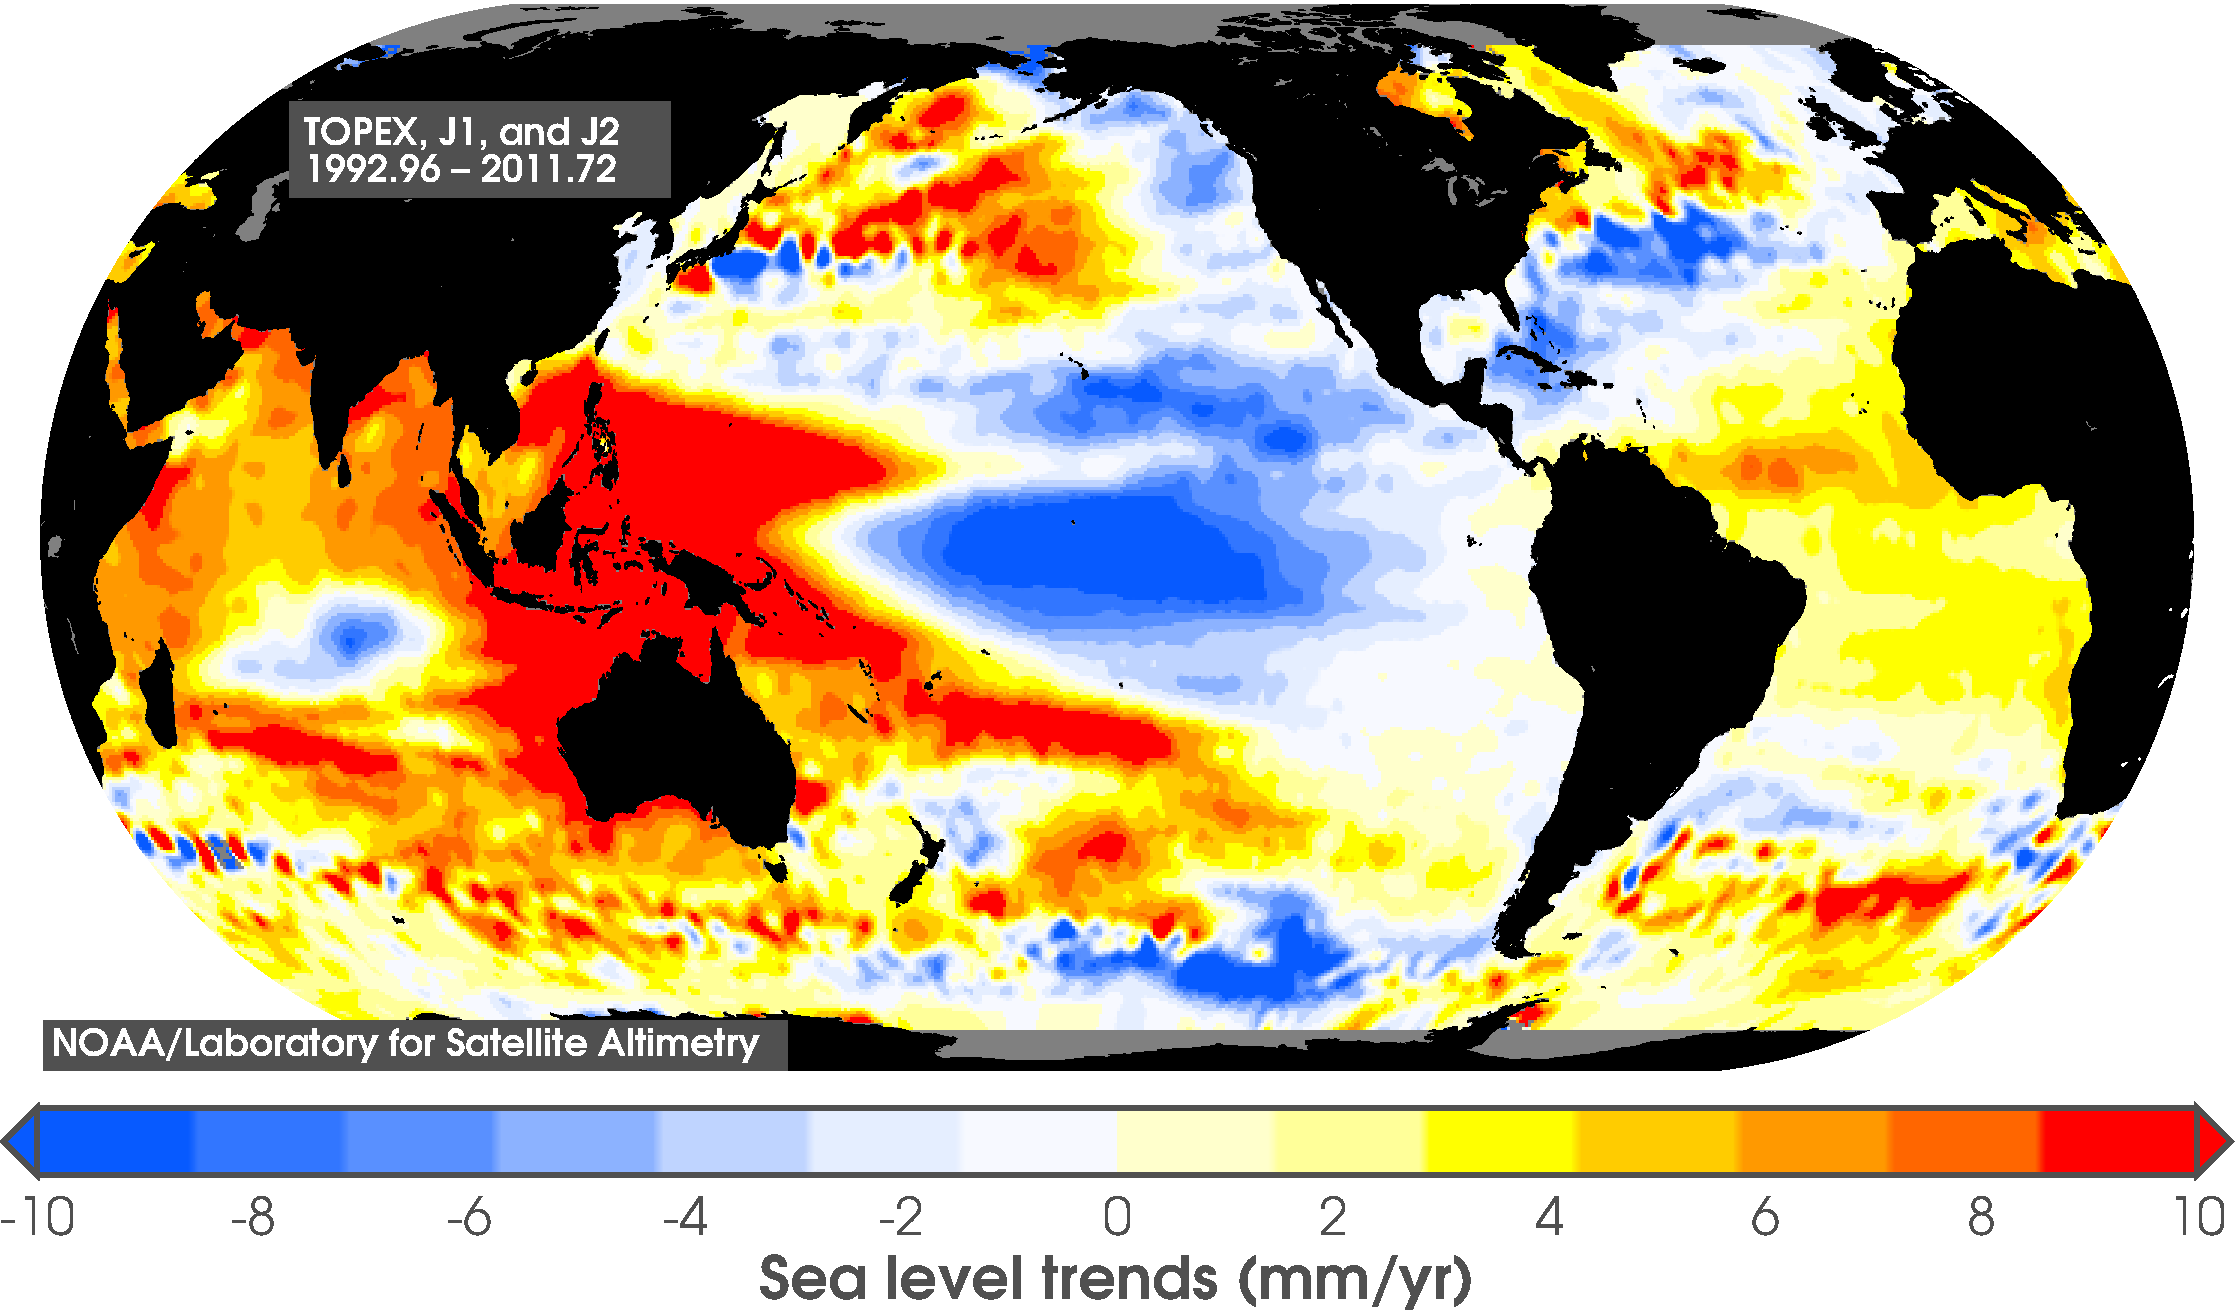 |
|
Fraction of the mean annual total precipitation from the top 10 wettest days in a year for the Midwest region. |
Observed |
Precipitation |
Midwest |
Regional Climate Trends and Scenarios for the U.S. National Climate Assessment. Part 3. Climate of the Midwest U.S. |
NCA 3 |
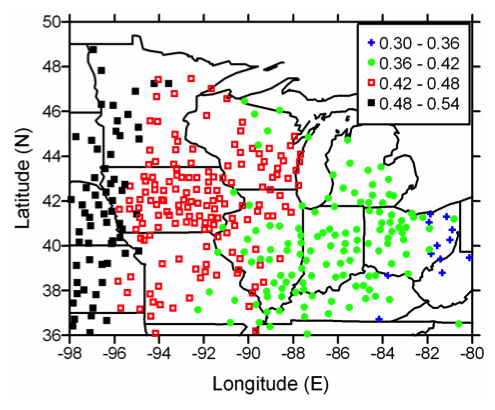 |
|
Extent of sea ice |
Observed |
Ice |
Alaska and Arctic |
Regional Climate Trends and Scenarios for the U.S. National Climate Assessment. Part 7. Climate of Alaska |
NCA 3 |
 |
|
End of century (~2090 – 2100) estimates for global mean sea level rise in meters |
Simulated |
Sea |
Global |
Global Sea Level Rise Scenarios for the United States National Climate Assessment |
NCA 3 |
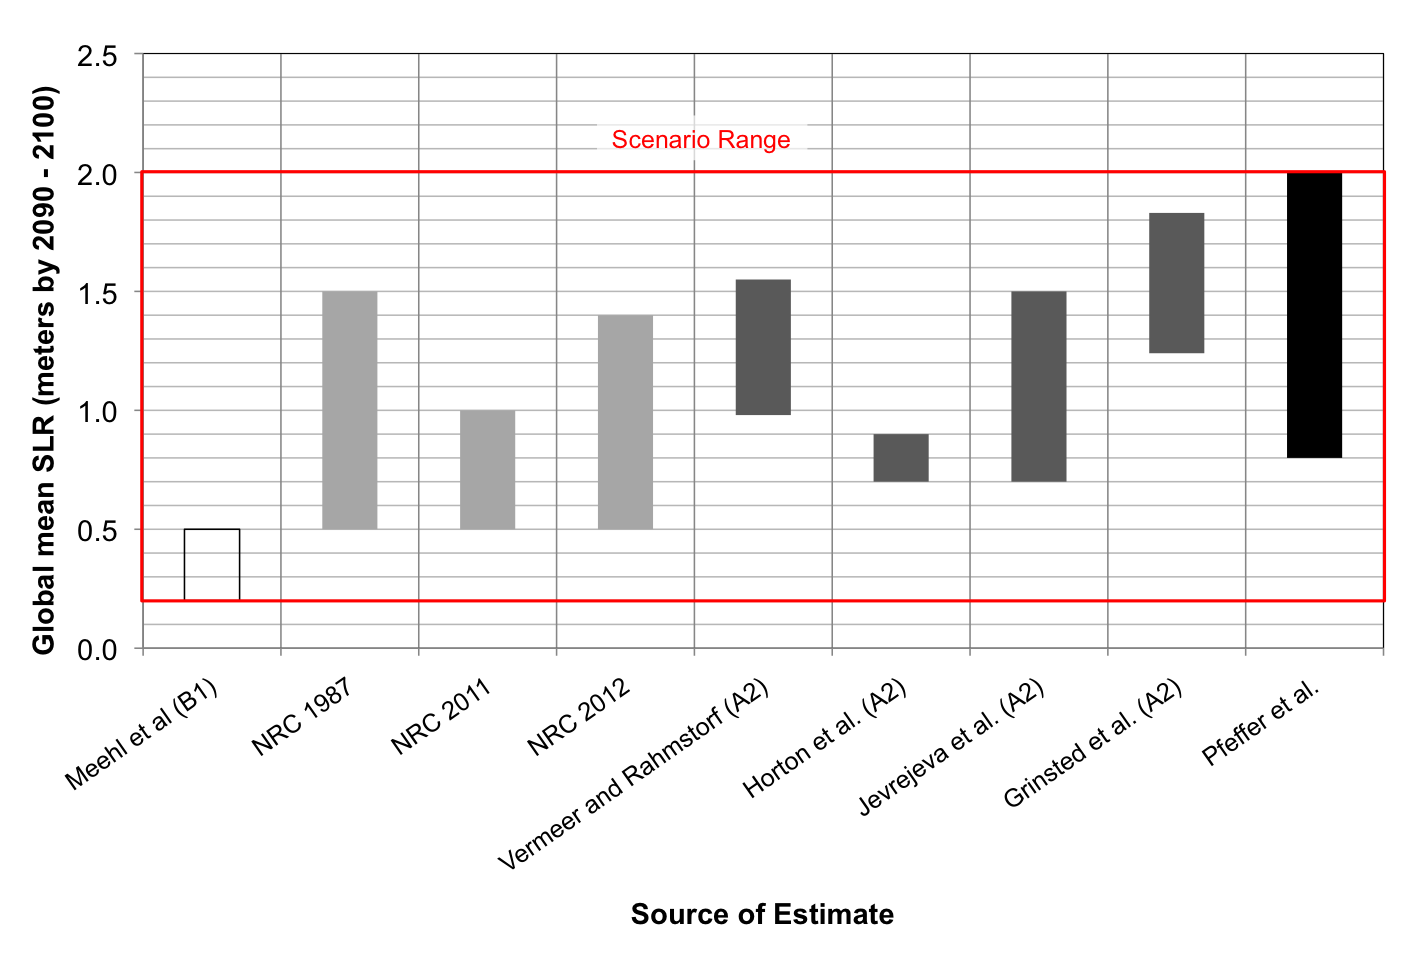 |
|
Distribution of the simulated change in seasonal mean precipitation |
Simulated |
Precipitation |
Midwest |
Regional Climate Trends and Scenarios for the U.S. National Climate Assessment. Part 3. Climate of the Midwest U.S. |
NCA 3 |
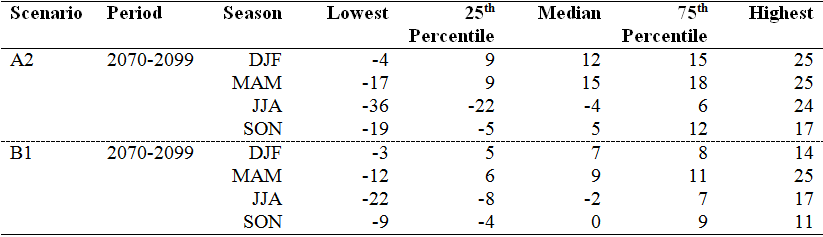 |
|
Distribution of the simulated change in seasonal mean precipitation |
Simulated |
Precipitation |
Southeast and Caribbean |
Regional Climate Trends and Scenarios for the U.S. National Climate Assessment. Part 2. Climate of the Southeast U.S. |
NCA 3 |
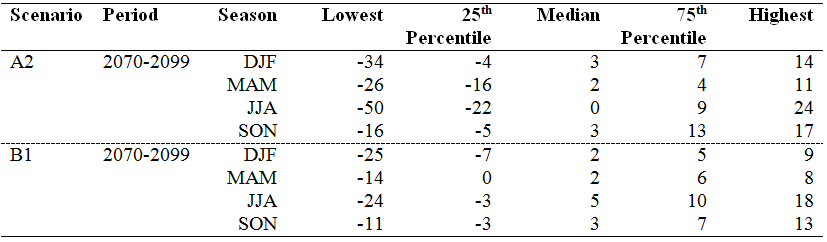 |
|
Distribution of the simulated change in seasonal mean precipitation |
Simulated |
Precipitation |
Great Plains |
Regional Climate Trends and Scenarios for the U.S. National Climate Assessment. Part 4. Climate of the U.S. Great Plains |
NCA 3 |
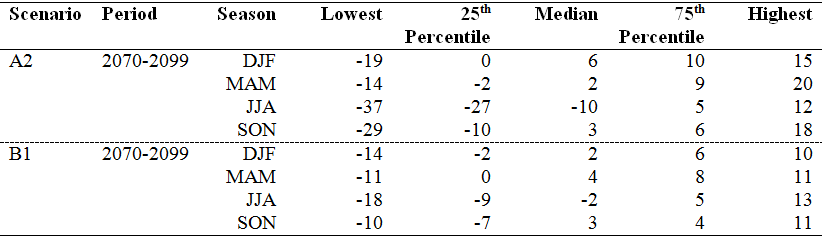 |
|
Distribution of the simulated change in seasonal mean precipitation |
Simulated |
Precipitation |
Alaska and Arctic |
Regional Climate Trends and Scenarios for the U.S. National Climate Assessment. Part 7. Climate of Alaska |
NCA 3 |
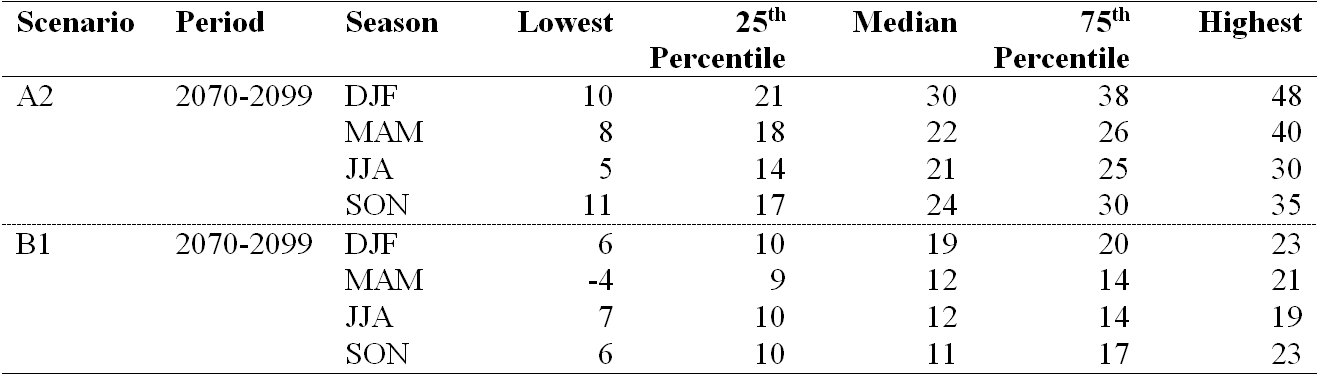 |
|
Distribution of the simulated change in seasonal mean precipitation |
Simulated |
Precipitation |
Northeast |
Regional Climate Trends and Scenarios for the U.S. National Climate Assessment. Part 1. Climate of the Northeast U.S. |
NCA 3 |
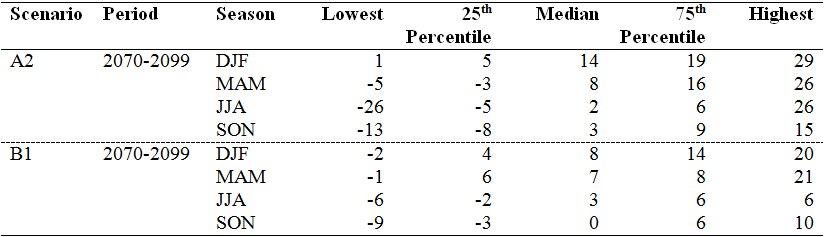 |
|
Distribution of the simulated change in seasonal mean precipitation |
Simulated |
Precipitation |
Southwest |
Regional Climate Trends and Scenarios for the U.S. National Climate Assessment. Part 5. Climate of the Southwest U.S. |
NCA 3 |
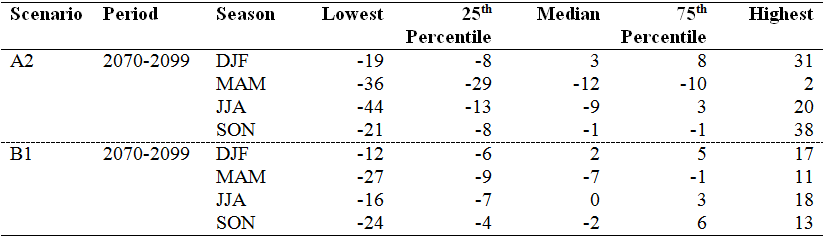 |
|
Distribution of the simulated change in seasonal mean precipitation |
Simulated |
Precipitation |
Northwest |
Regional Climate Trends and Scenarios for the U.S. National Climate Assessment. Part 6. Climate of the Northwest U.S. |
NCA 3 |
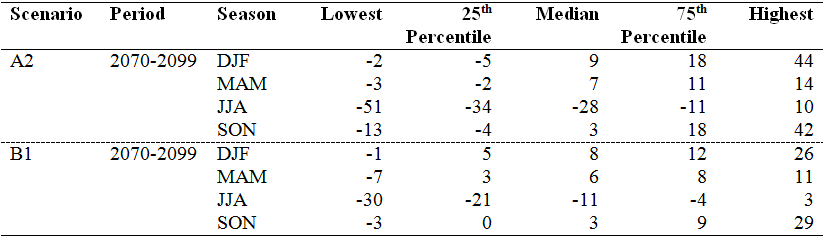 |
|
Distribution of the simulated change in annual mean temperature |
Simulated |
Temperature |
Midwest |
Regional Climate Trends and Scenarios for the U.S. National Climate Assessment. Part 3. Climate of the Midwest U.S. |
NCA 3 |
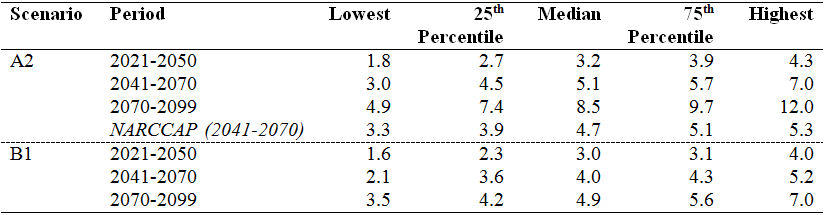 |
|
Distribution of the simulated change in annual mean temperature |
Simulated |
Temperature |
Southeast and Caribbean |
Regional Climate Trends and Scenarios for the U.S. National Climate Assessment. Part 2. Climate of the Southeast U.S. |
NCA 3 |
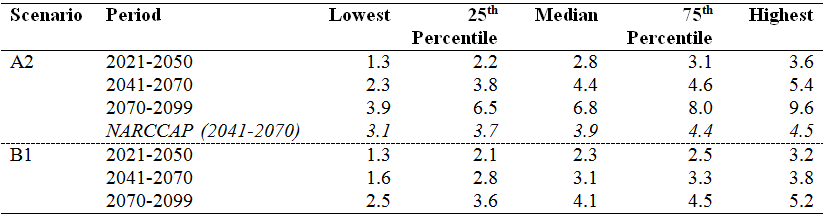 |
|
Distribution of the simulated change in annual mean temperature |
Simulated |
Temperature |
National |
Regional Climate Trends and Scenarios for the U.S. National Climate Assessment. Part 9. Climate of the Contiguous United States |
NCA 3 |
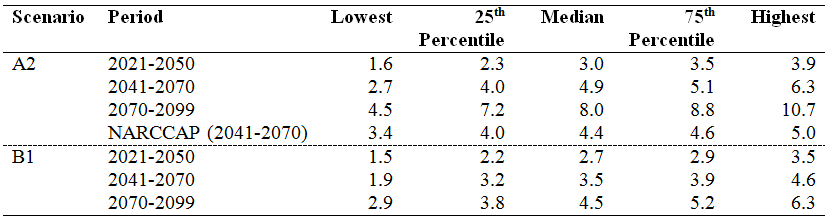 |
|
Distribution of the simulated change in annual mean temperature |
Simulated |
Temperature |
Great Plains |
Regional Climate Trends and Scenarios for the U.S. National Climate Assessment. Part 4. Climate of the U.S. Great Plains |
NCA 3 |
 |
|
Distribution of the simulated change in annual mean temperature |
Simulated |
Temperature |
Alaska and Arctic |
Regional Climate Trends and Scenarios for the U.S. National Climate Assessment. Part 7. Climate of Alaska |
NCA 3 |
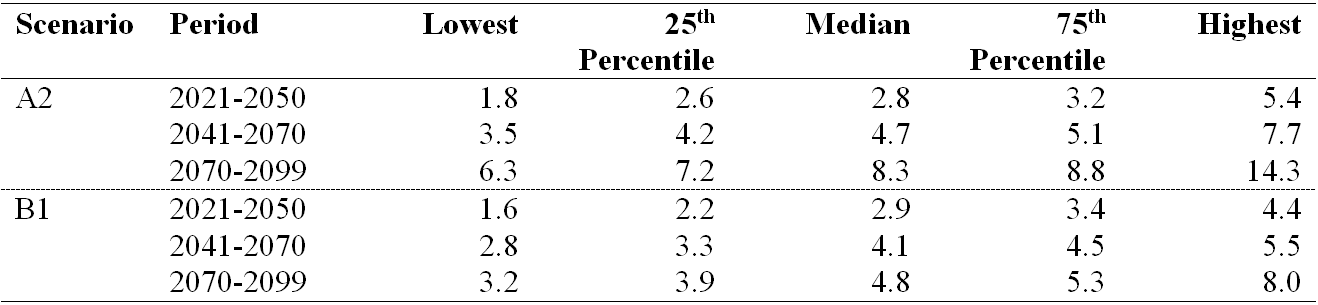 |
|
Distribution of the simulated change in annual mean temperature |
Simulated |
Temperature |
Northeast |
Regional Climate Trends and Scenarios for the U.S. National Climate Assessment. Part 1. Climate of the Northeast U.S. |
NCA 3 |
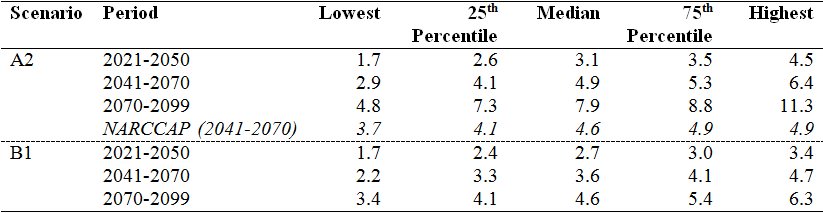 |
|
Distribution of the simulated change in annual mean temperature |
Simulated |
Temperature |
Southwest |
Regional Climate Trends and Scenarios for the U.S. National Climate Assessment. Part 5. Climate of the Southwest U.S. |
NCA 3 |
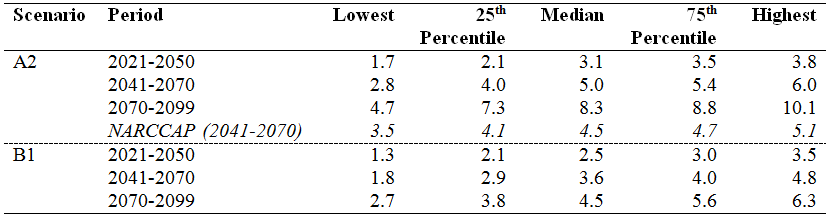 |
|
Distribution of the simulated change in annual mean temperature |
Simulated |
Temperature |
Northwest |
Regional Climate Trends and Scenarios for the U.S. National Climate Assessment. Part 6. Climate of the Northwest U.S. |
NCA 3 |
 |
|
Distribution of the simulated change in annual mean precipitation |
Simulated |
Precipitation |
Midwest |
Regional Climate Trends and Scenarios for the U.S. National Climate Assessment. Part 3. Climate of the Midwest U.S. |
NCA 3 |
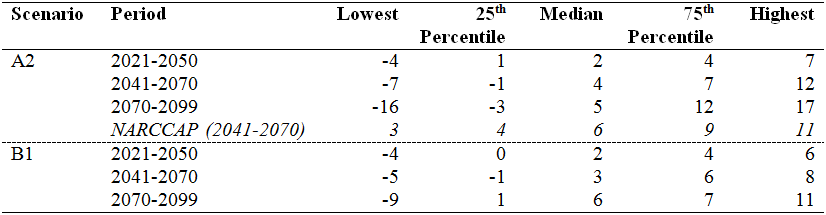 |
|
Distribution of the simulated change in annual mean precipitation |
Simulated |
Precipitation |
Southeast and Caribbean |
Regional Climate Trends and Scenarios for the U.S. National Climate Assessment. Part 2. Climate of the Southeast U.S. |
NCA 3 |
 |
|
Distribution of the simulated change in annual mean precipitation |
Simulated |
Precipitation |
Great Plains |
Regional Climate Trends and Scenarios for the U.S. National Climate Assessment. Part 4. Climate of the U.S. Great Plains |
NCA 3 |
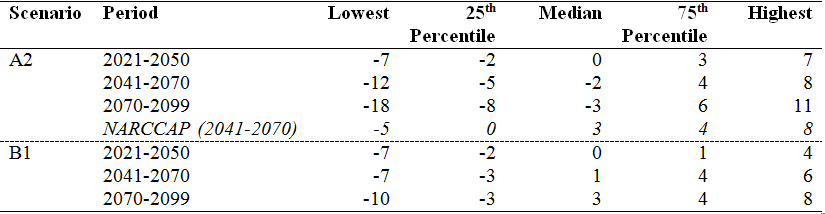 |
|
Distribution of the simulated change in annual mean precipitation |
Simulated |
Precipitation |
Alaska and Arctic |
Regional Climate Trends and Scenarios for the U.S. National Climate Assessment. Part 7. Climate of Alaska |
NCA 3 |
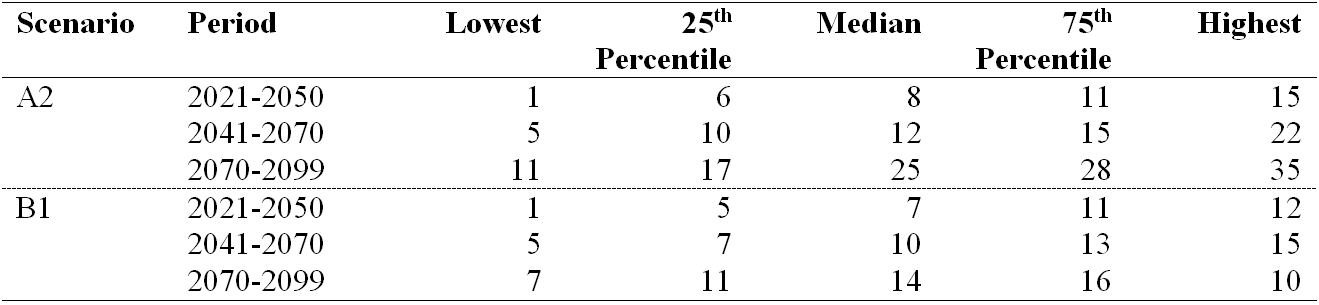 |
|
Distribution of the simulated change in annual mean precipitation |
Simulated |
Precipitation |
Northeast |
Regional Climate Trends and Scenarios for the U.S. National Climate Assessment. Part 1. Climate of the Northeast U.S. |
NCA 3 |
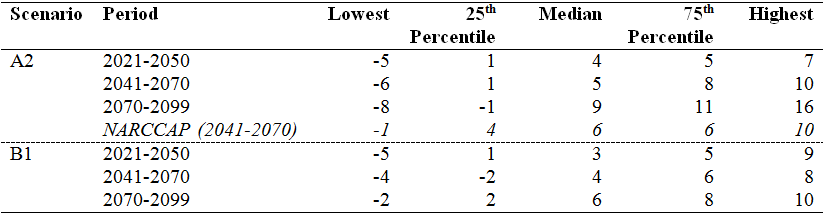 |
|
Distribution of the simulated change in annual mean precipitation |
Simulated |
Precipitation |
Southwest |
Regional Climate Trends and Scenarios for the U.S. National Climate Assessment. Part 5. Climate of the Southwest U.S. |
NCA 3 |
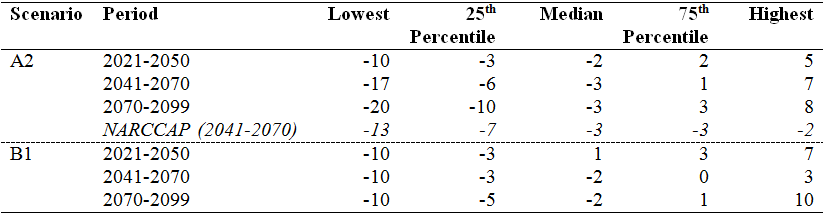 |
|
Distribution of the simulated change in annual mean precipitation |
Simulated |
Precipitation |
Northwest |
Regional Climate Trends and Scenarios for the U.S. National Climate Assessment. Part 6. Climate of the Northwest U.S. |
NCA 3 |
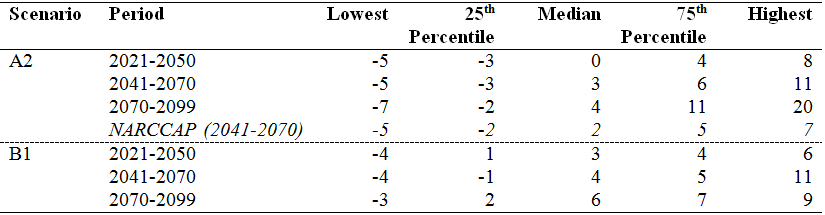 |
|
Difference in cumulative number of days with precipitation >= 4 inches |
Observed |
Precipitation |
Southeast and Caribbean |
Regional Climate Trends and Scenarios for the U.S. National Climate Assessment. Part 2. Climate of the Southeast U.S. |
NCA 3 |
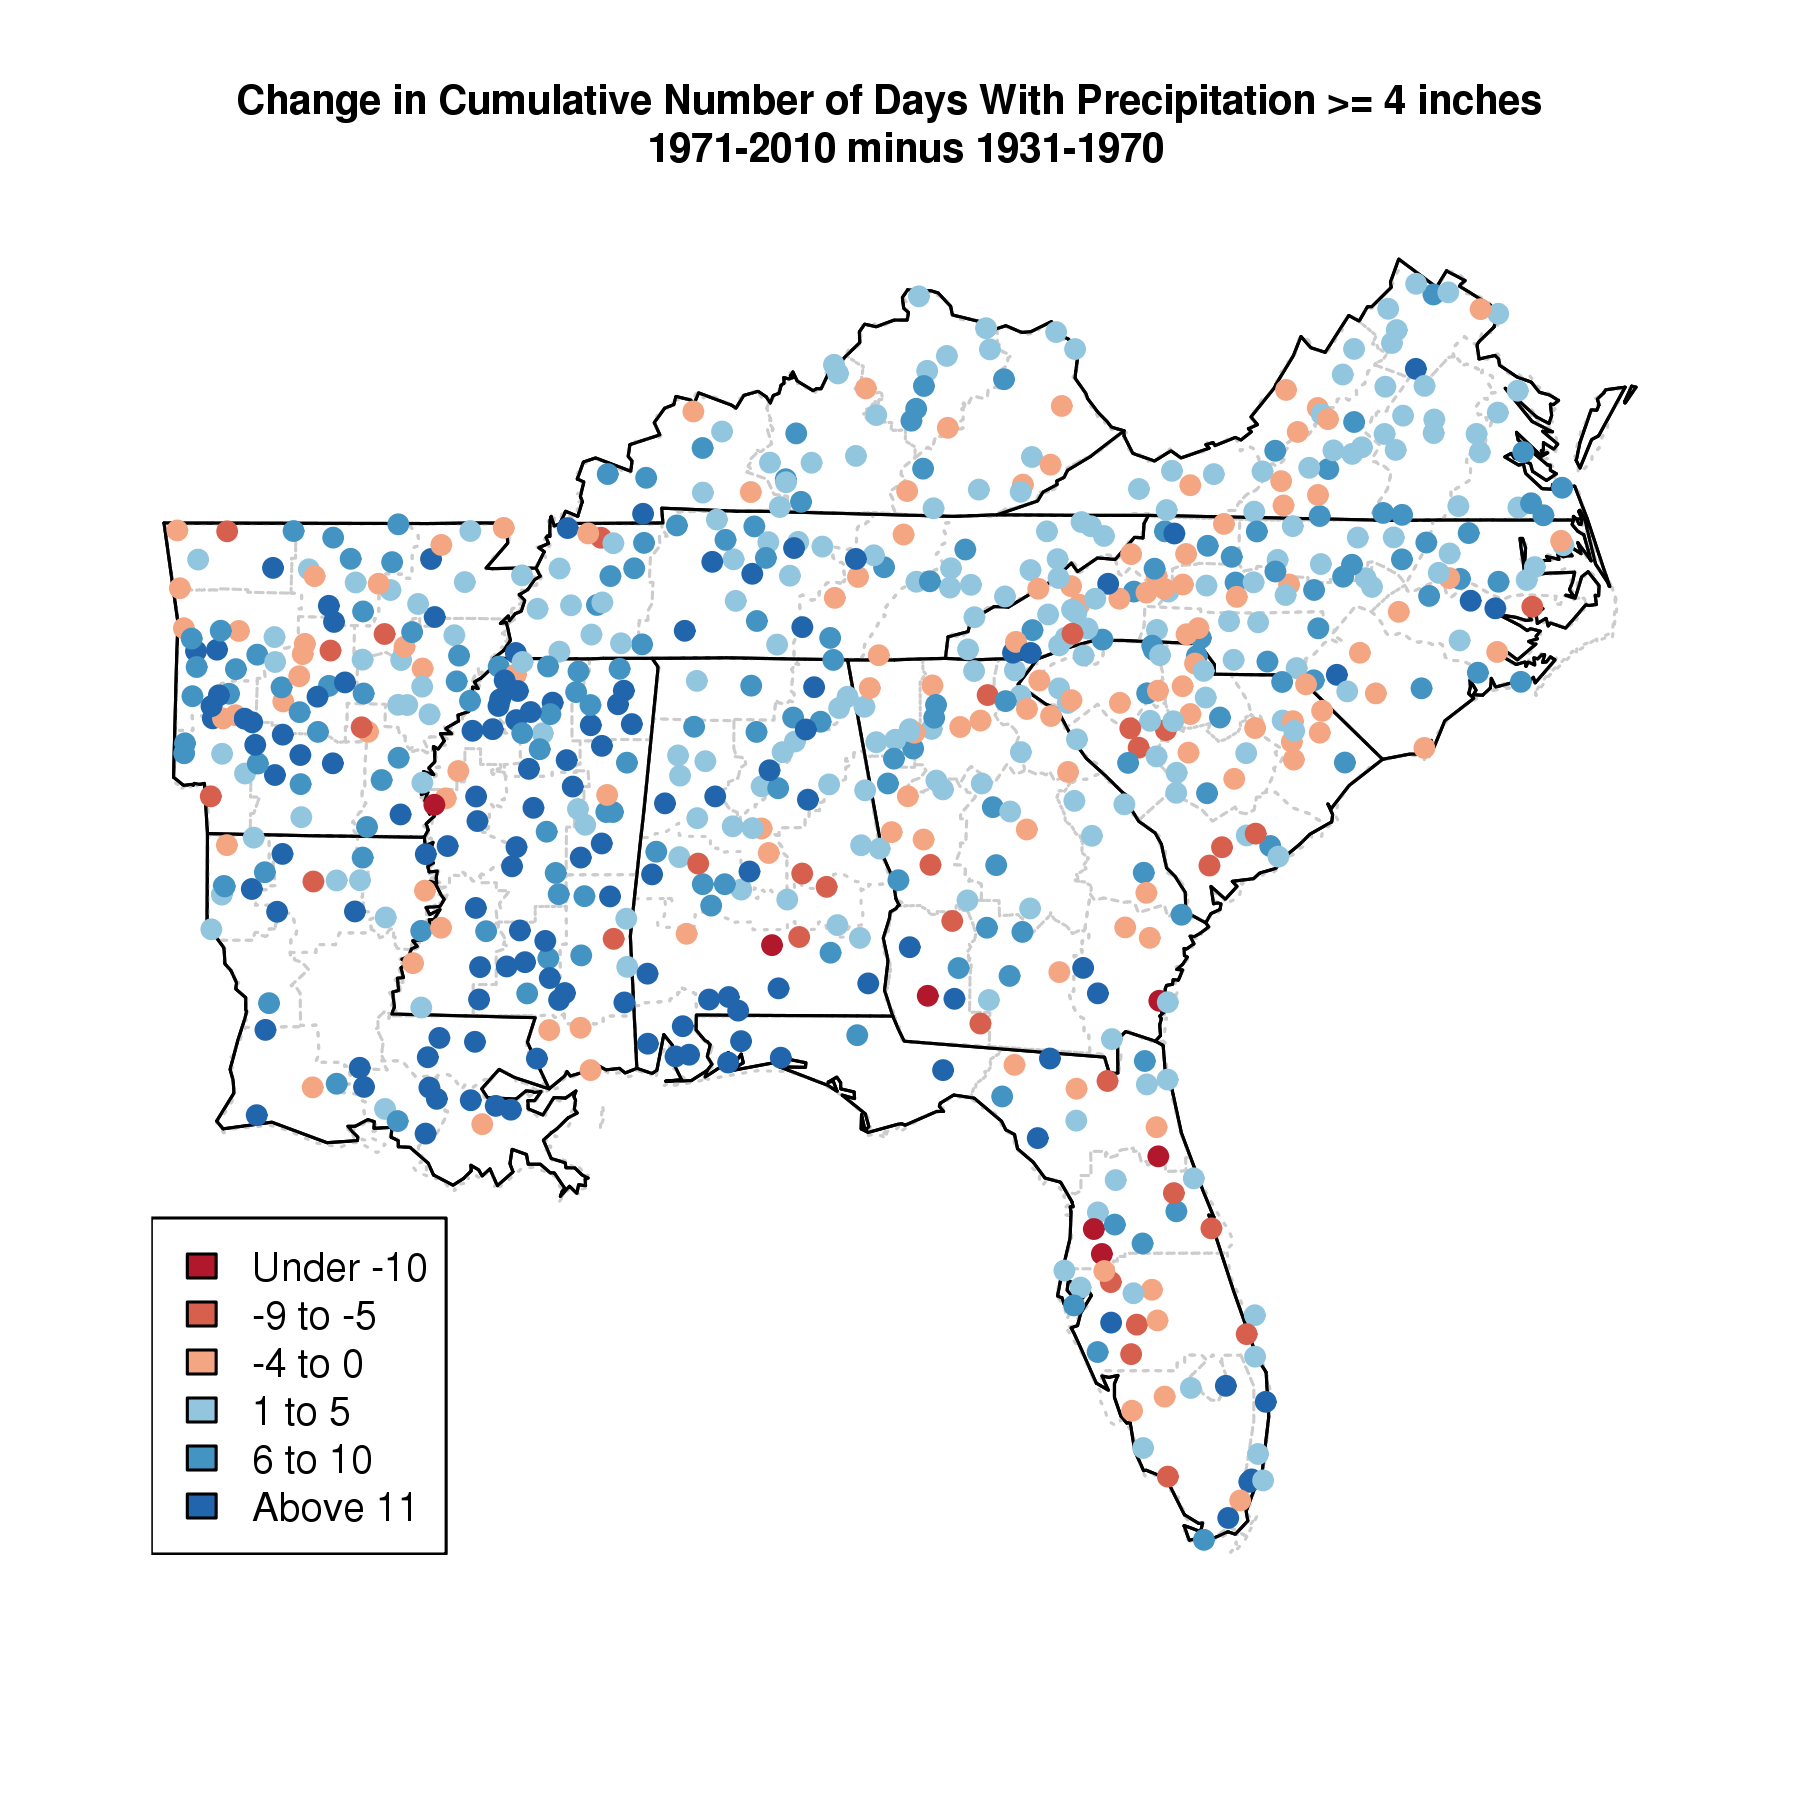 |
|
Difference in cumulative number of days with precipitation >= 2 inches |
Observed |
Precipitation |
Southeast and Caribbean |
Regional Climate Trends and Scenarios for the U.S. National Climate Assessment. Part 2. Climate of the Southeast U.S. |
NCA 3 |
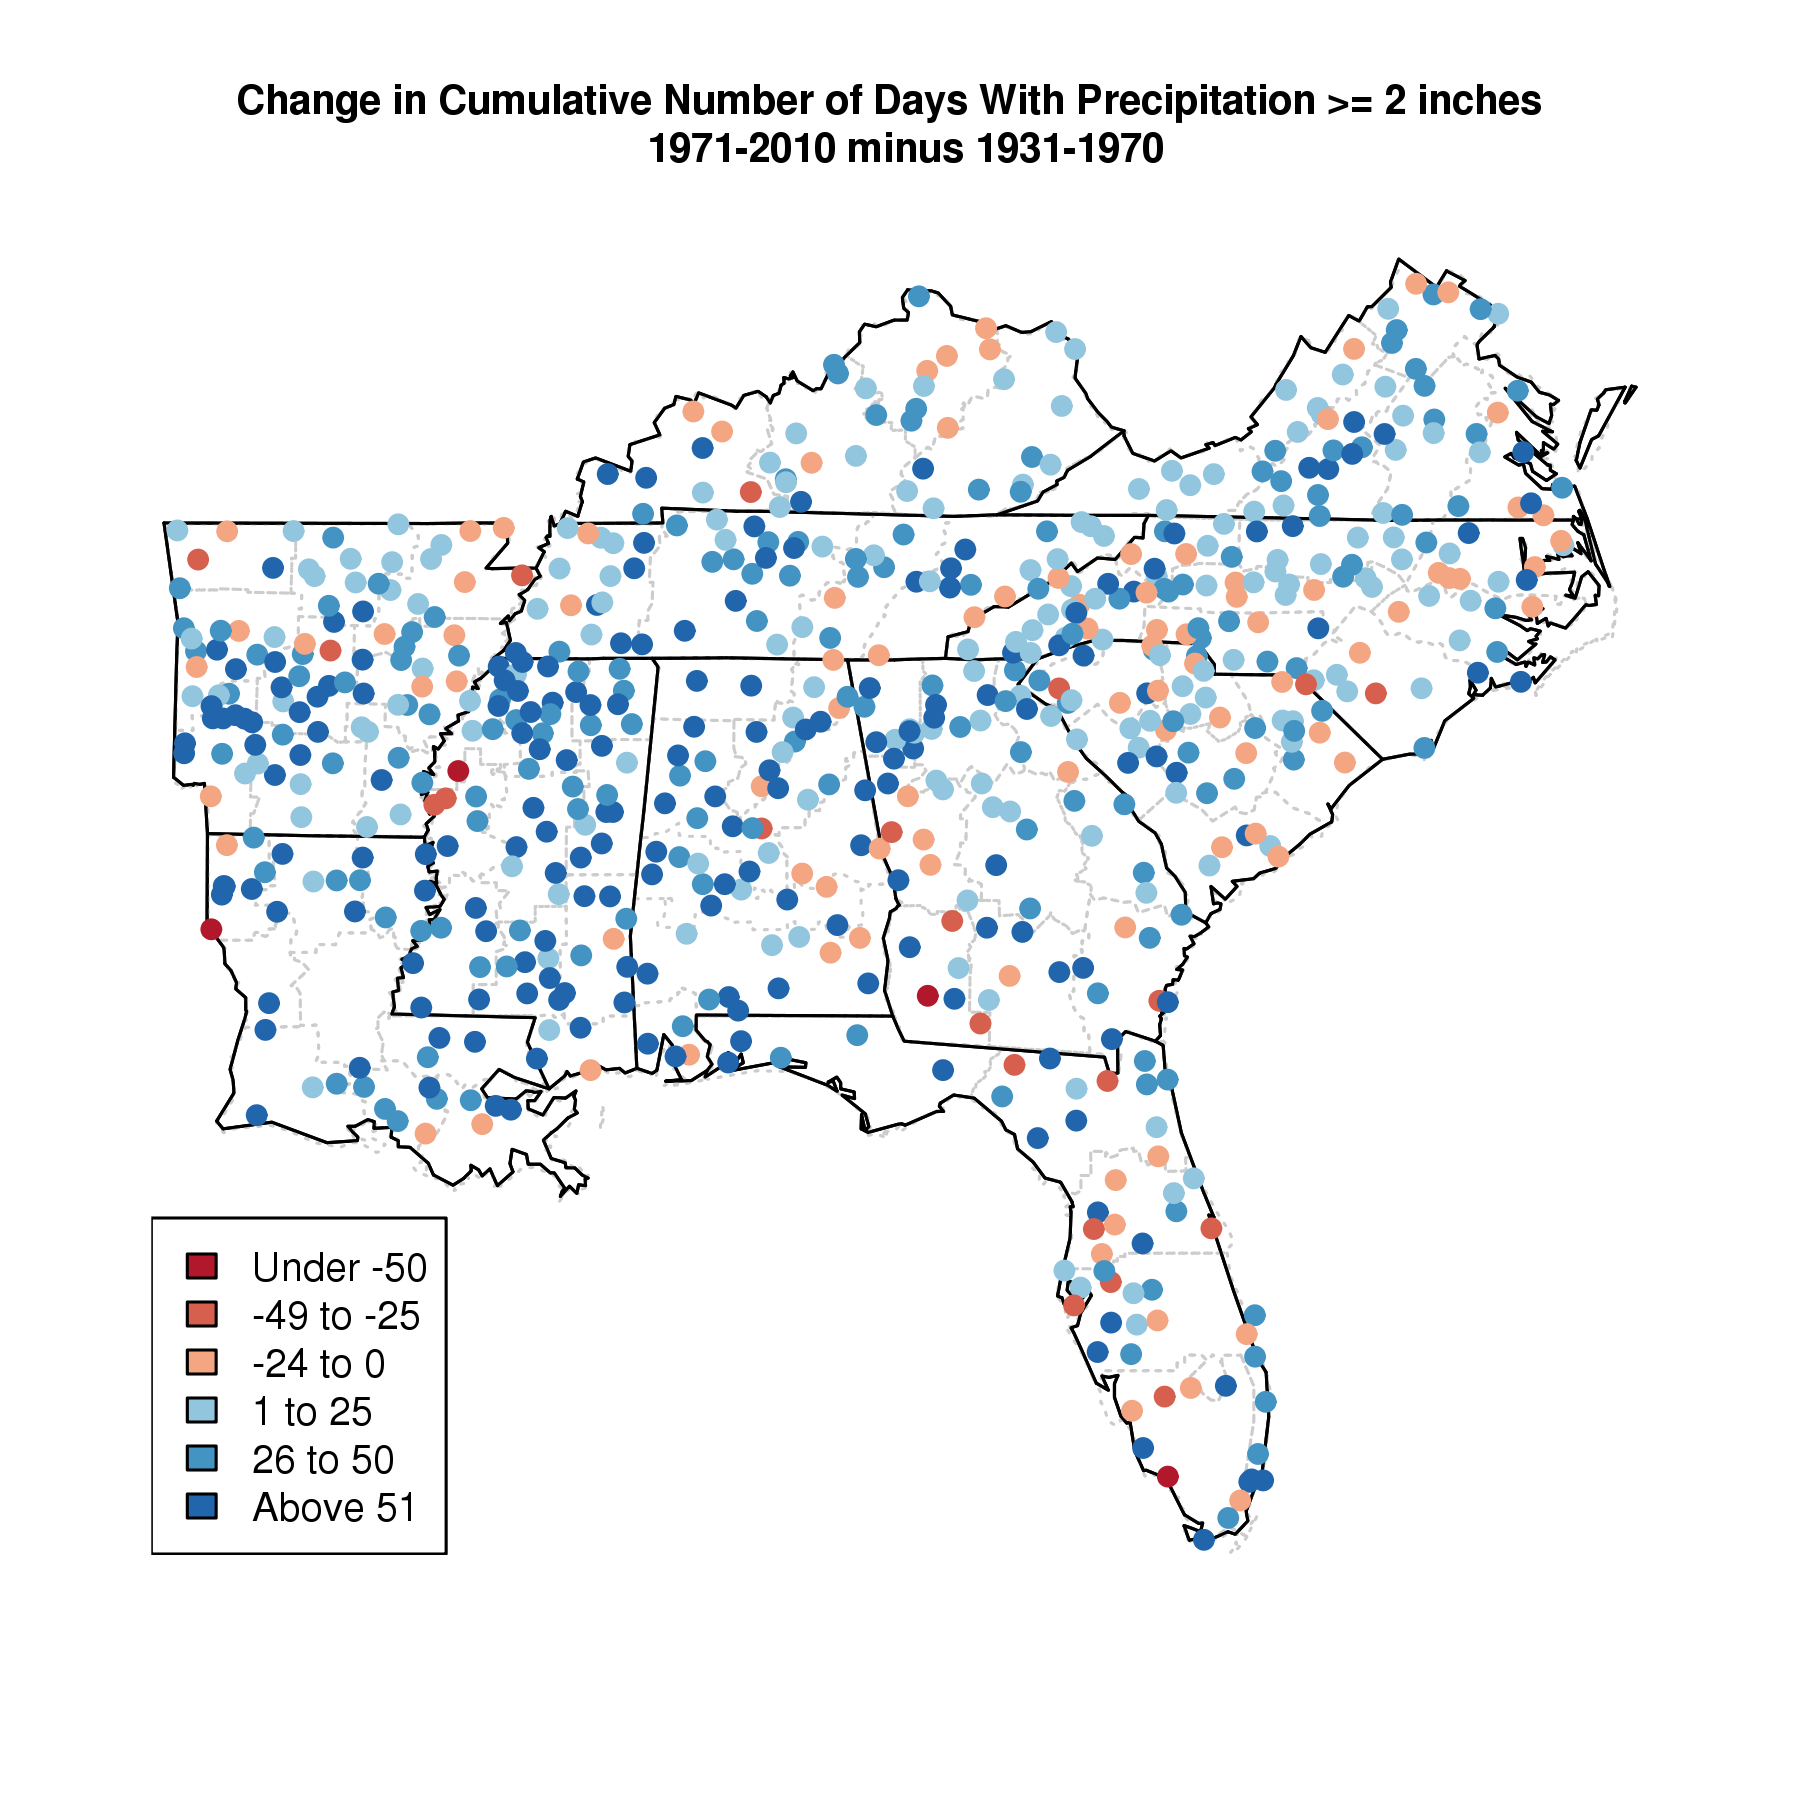 |
|
Difference in cumulative number of days with a minimum temperature >=75F |
Observed |
Temperature |
Southeast and Caribbean |
Regional Climate Trends and Scenarios for the U.S. National Climate Assessment. Part 2. Climate of the Southeast U.S. |
NCA 3 |
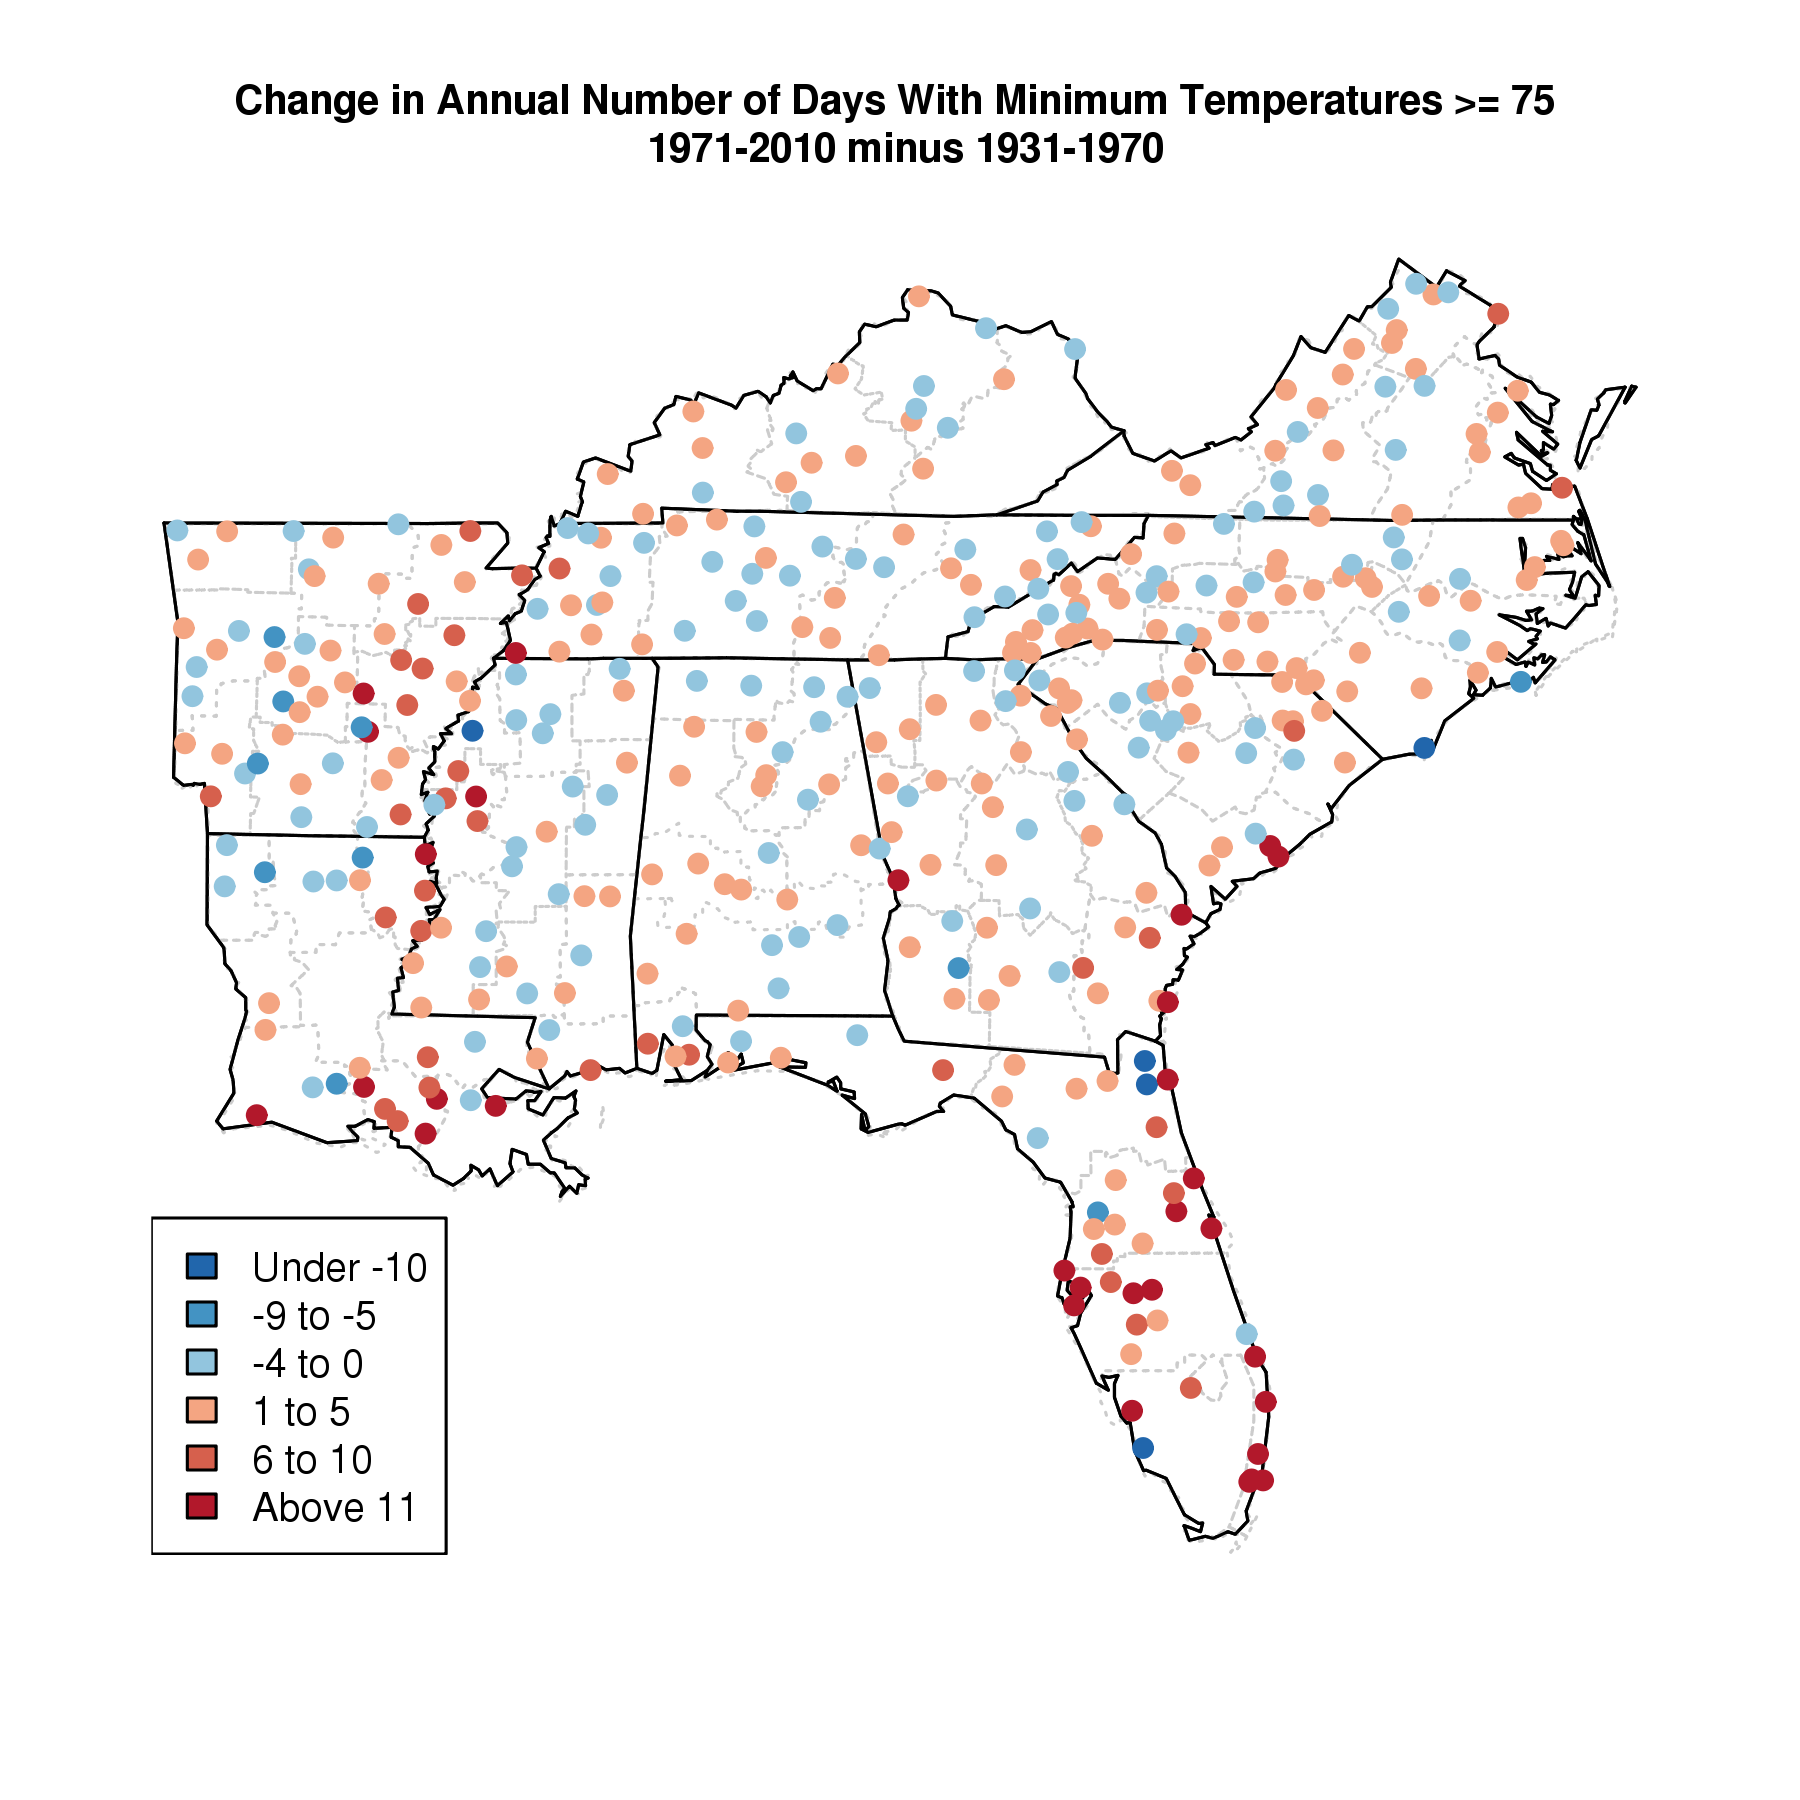 |
|
Difference in cumulative number of days with a minimum temperature <=32F |
Observed |
Temperature |
Southeast and Caribbean |
Regional Climate Trends and Scenarios for the U.S. National Climate Assessment. Part 2. Climate of the Southeast U.S. |
NCA 3 |
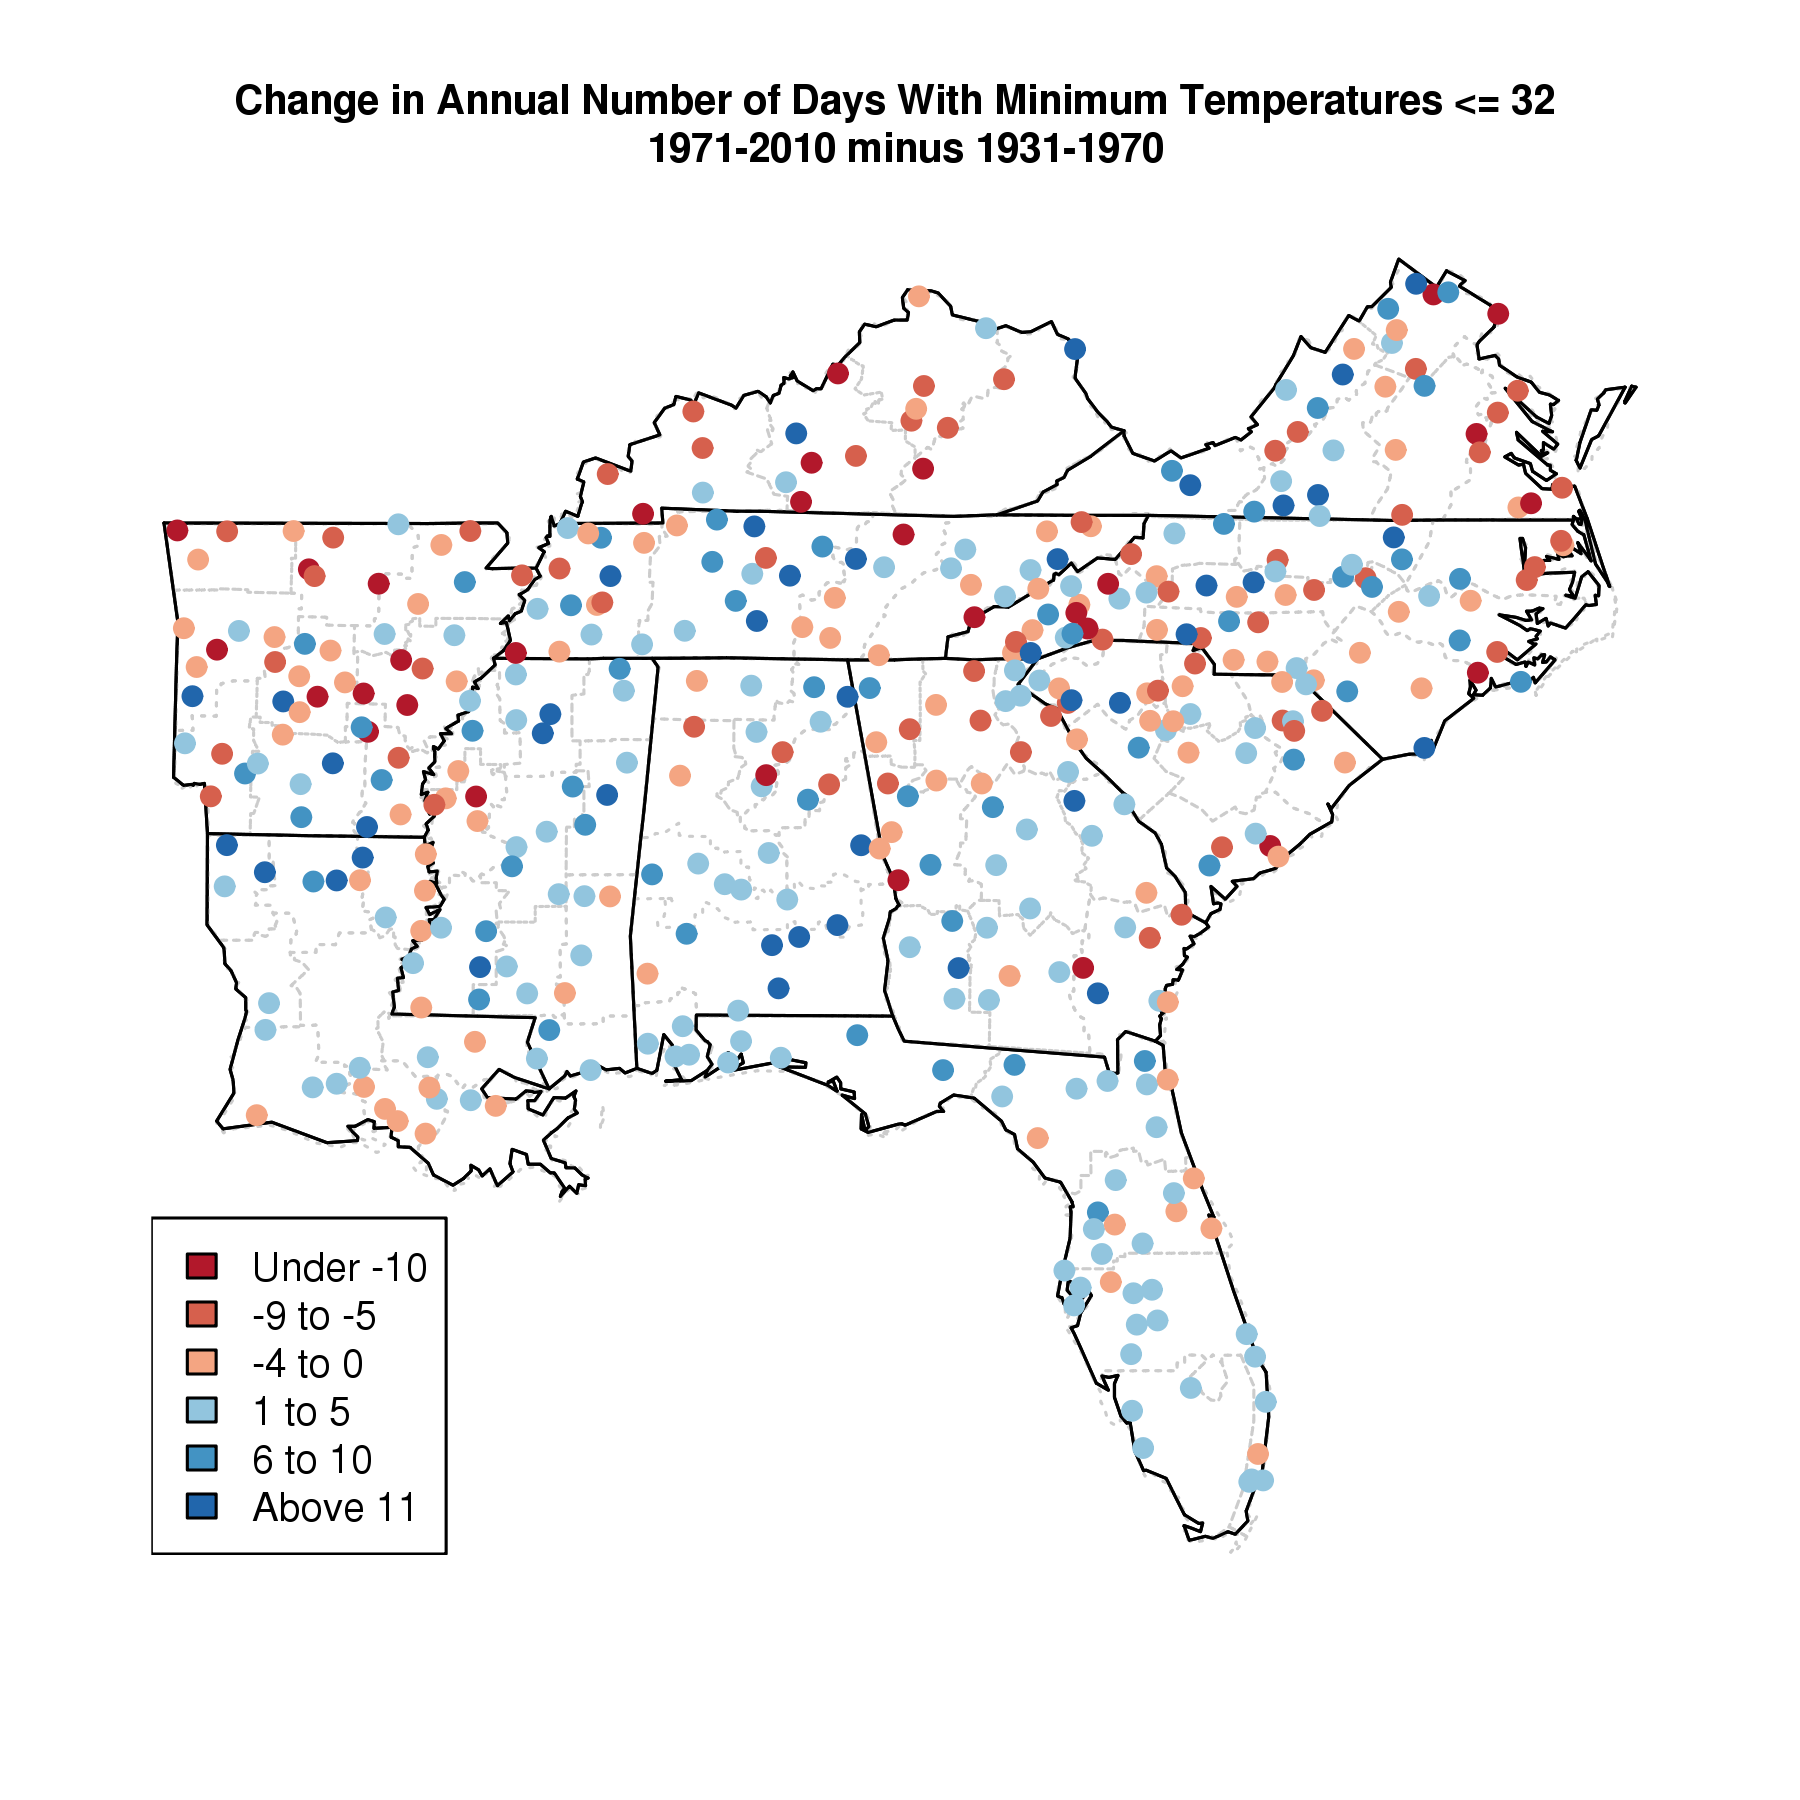 |
|
Difference in cumulative number of days with a minimum temperature <=10F |
Observed |
Temperature |
Southeast and Caribbean |
Regional Climate Trends and Scenarios for the U.S. National Climate Assessment. Part 2. Climate of the Southeast U.S. |
NCA 3 |
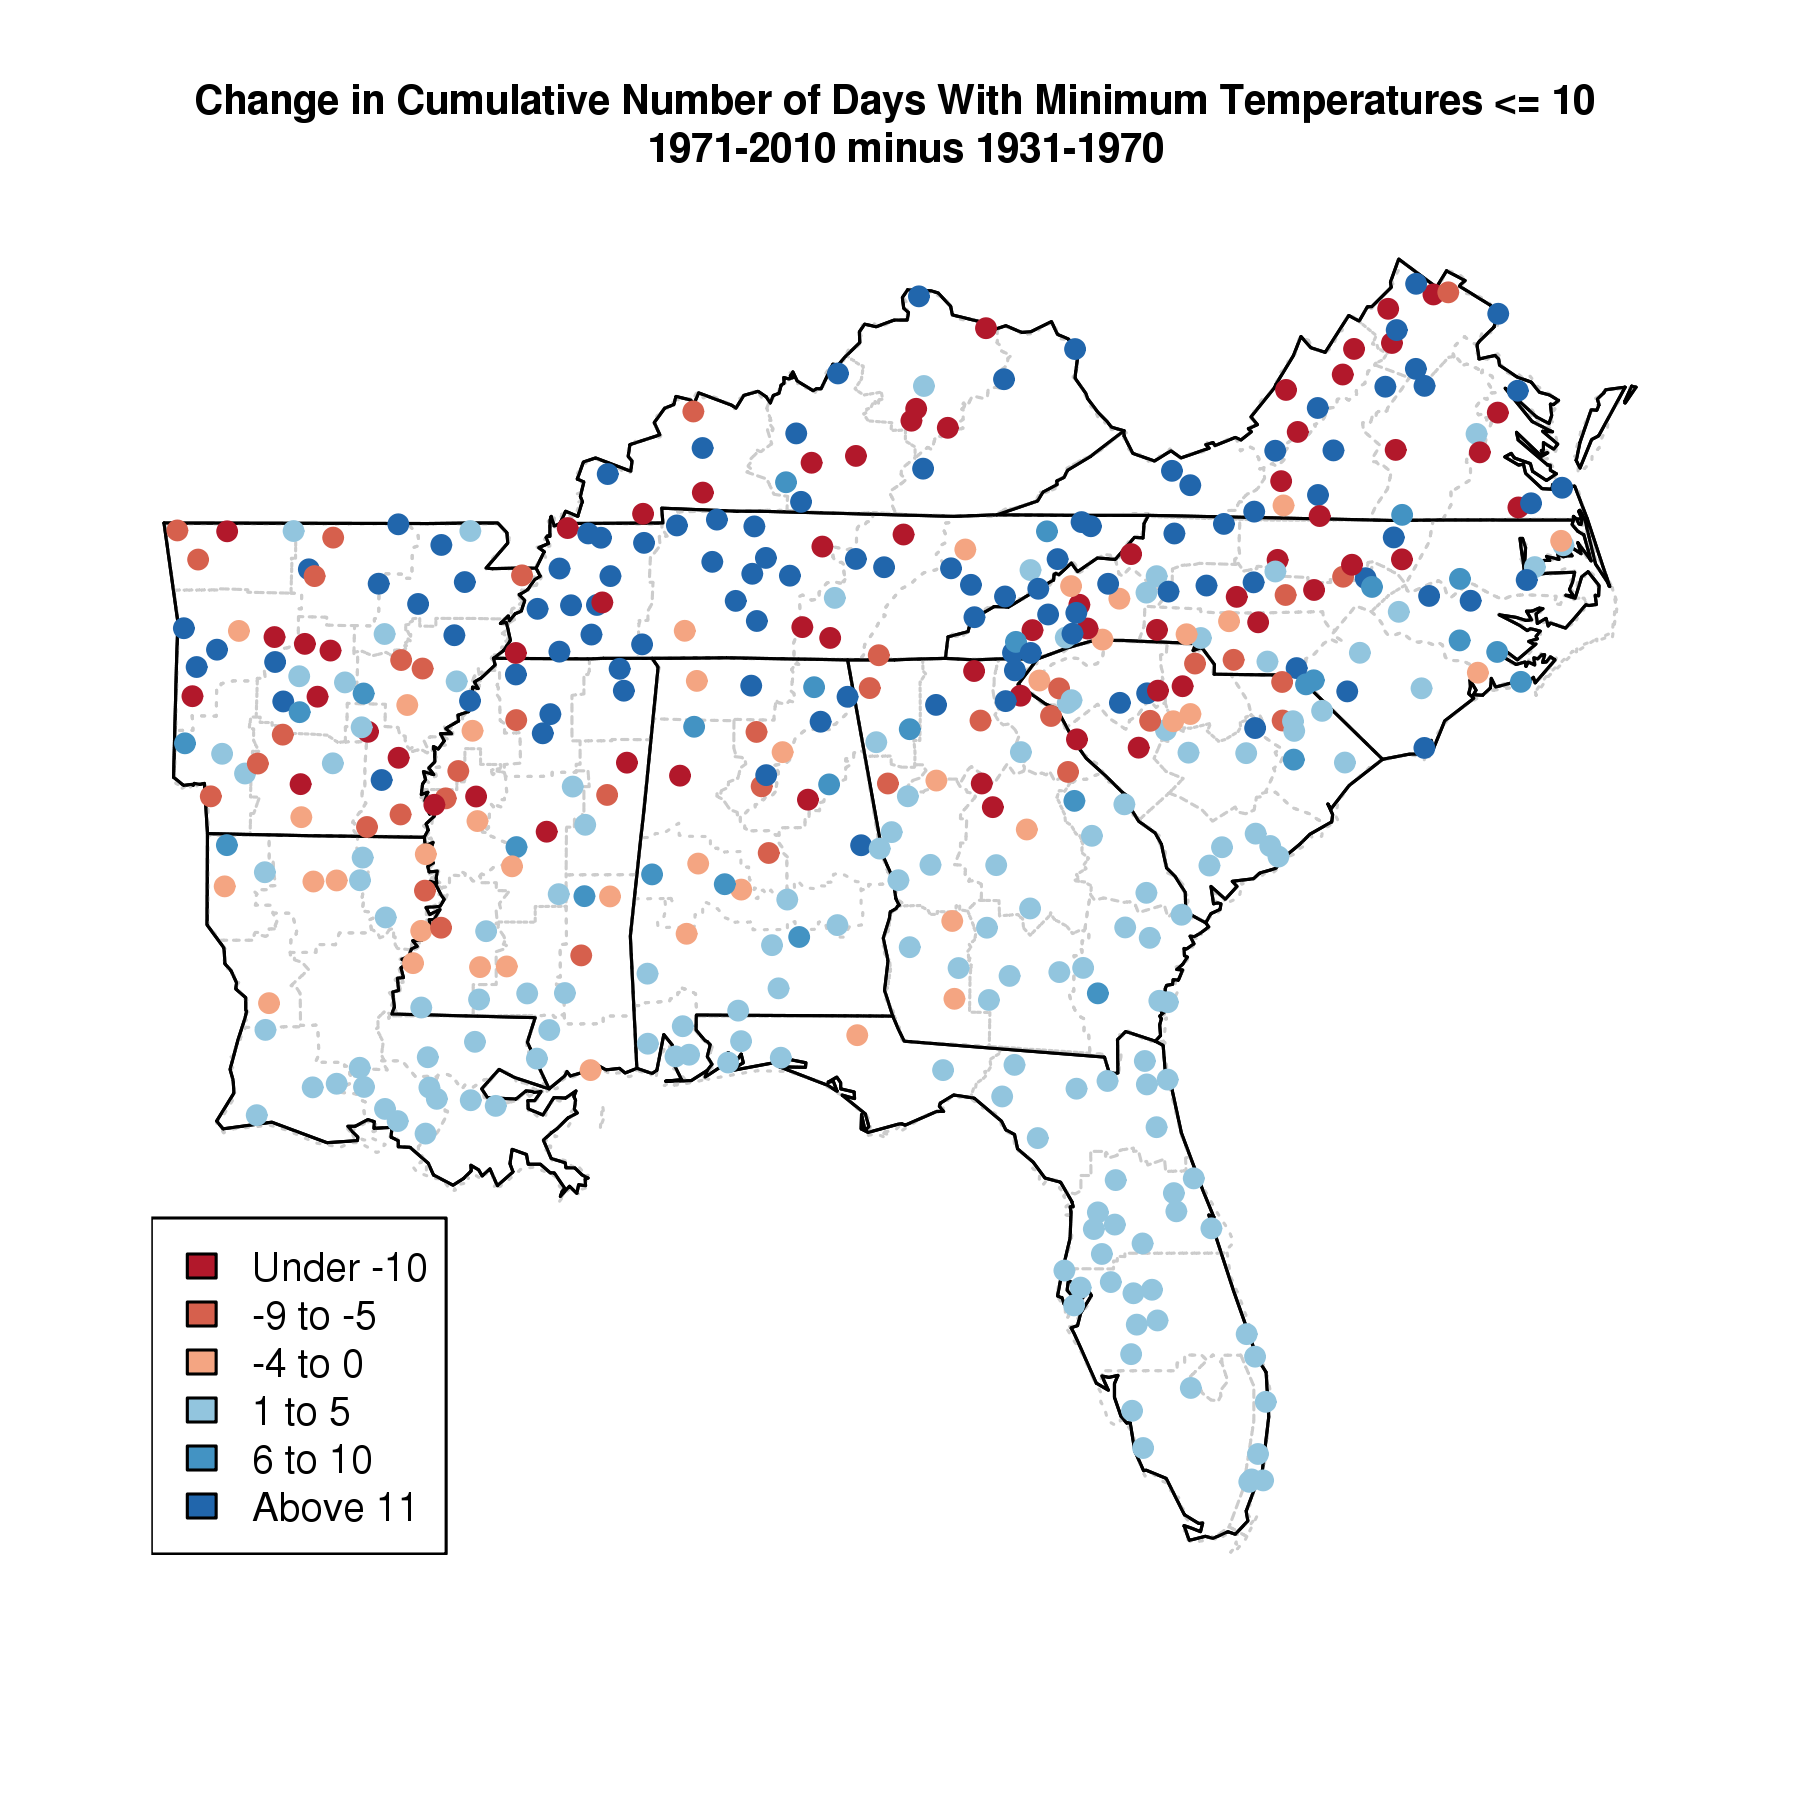 |
|
Difference in cumulative number of days with a maximum temperature >=95F |
Observed |
Temperature |
Southeast and Caribbean |
Regional Climate Trends and Scenarios for the U.S. National Climate Assessment. Part 2. Climate of the Southeast U.S. |
NCA 3 |
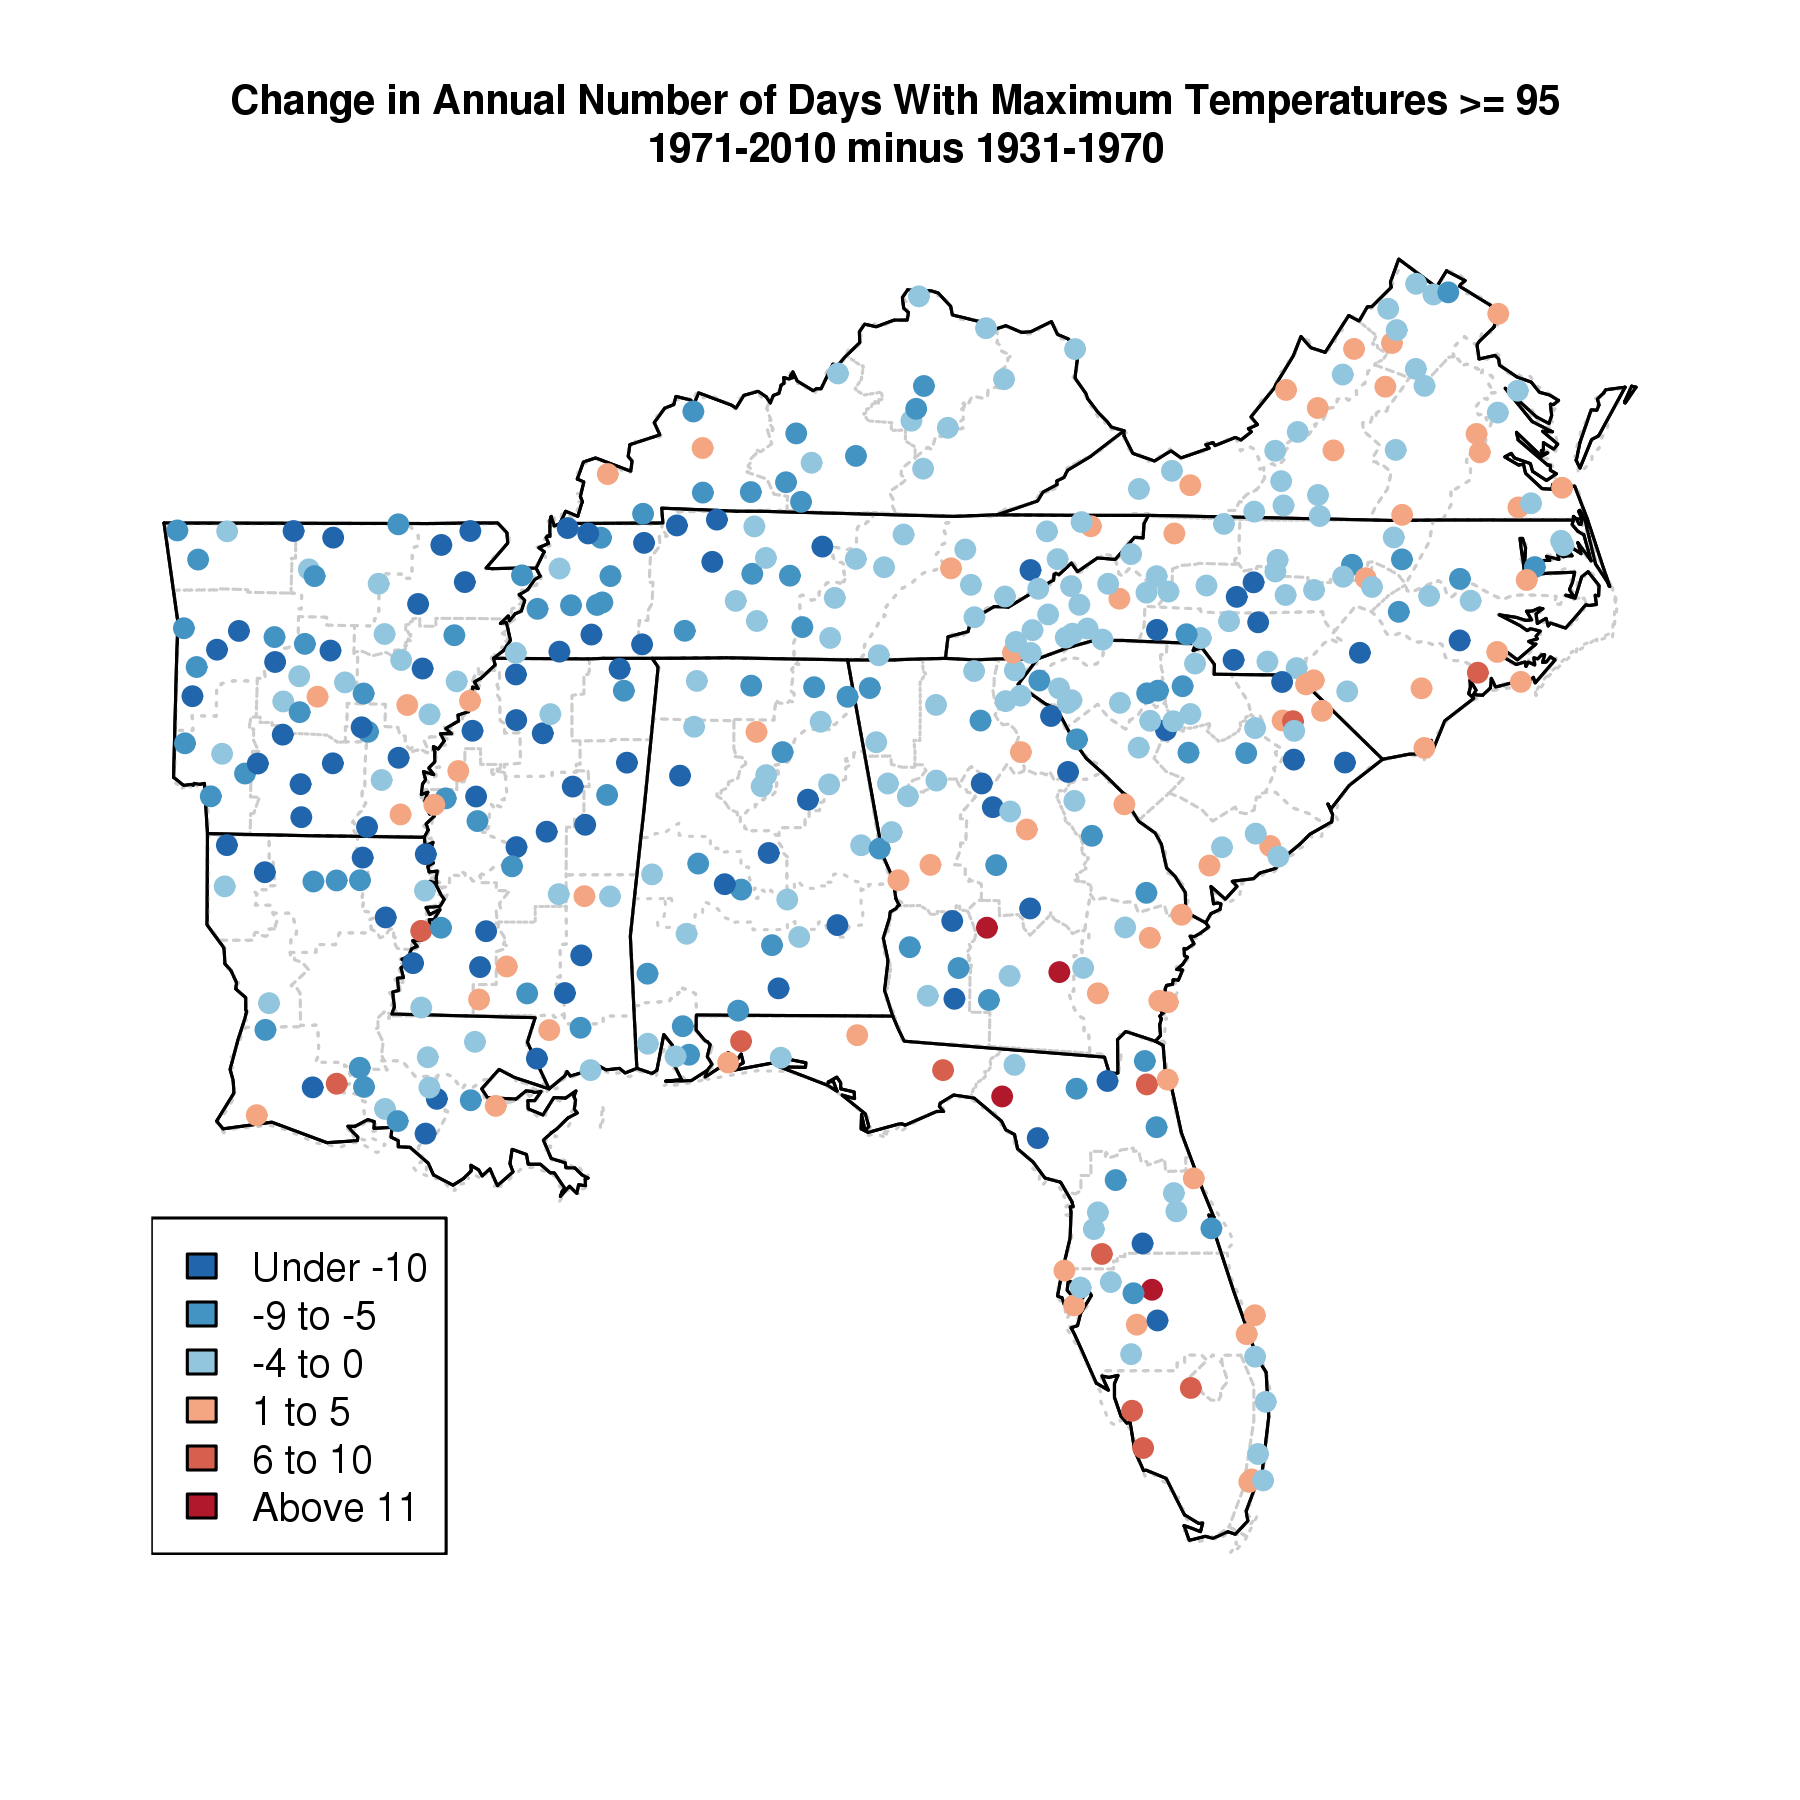 |
|
Devils Lake, ND elevation change |
Observed |
Lakes |
Great Plains |
Regional Climate Trends and Scenarios for the U.S. National Climate Assessment. Part 4. Climate of the U.S. Great Plains |
NCA 3 |
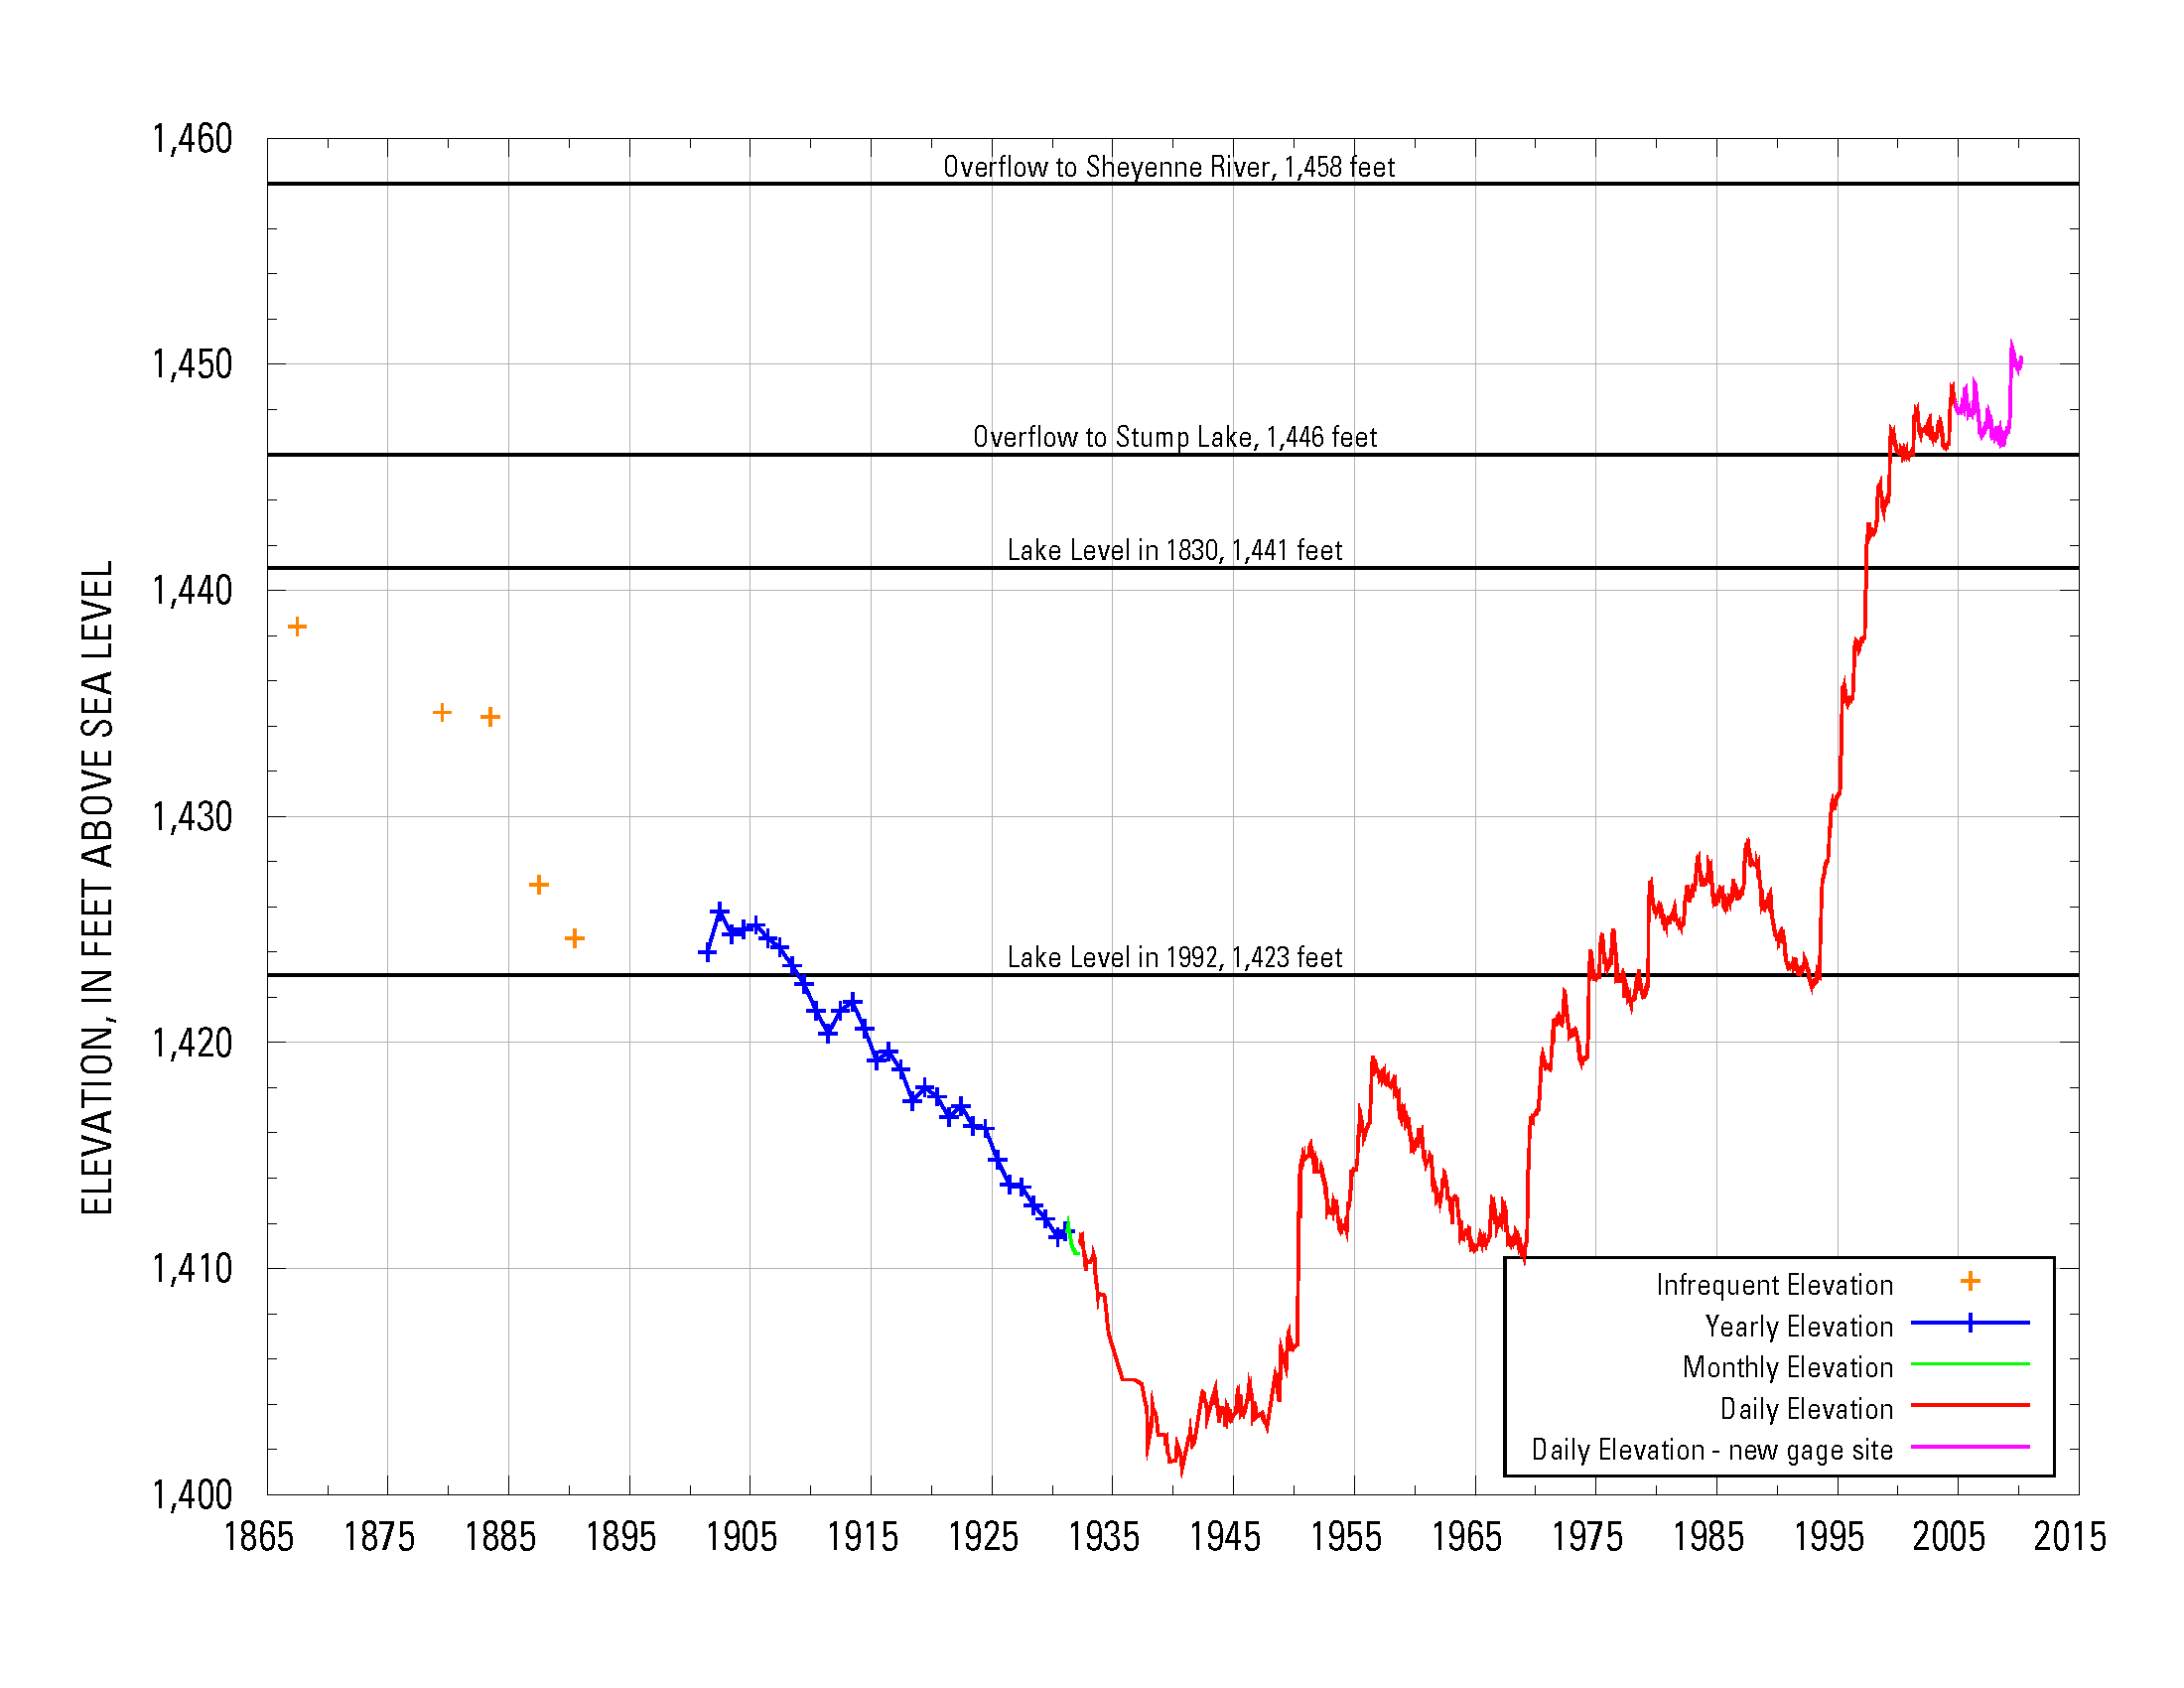 |
|
Developing sea level scenarios |
Observed |
Sea |
Global |
Global Sea Level Rise Scenarios for the United States National Climate Assessment |
NCA 3 |
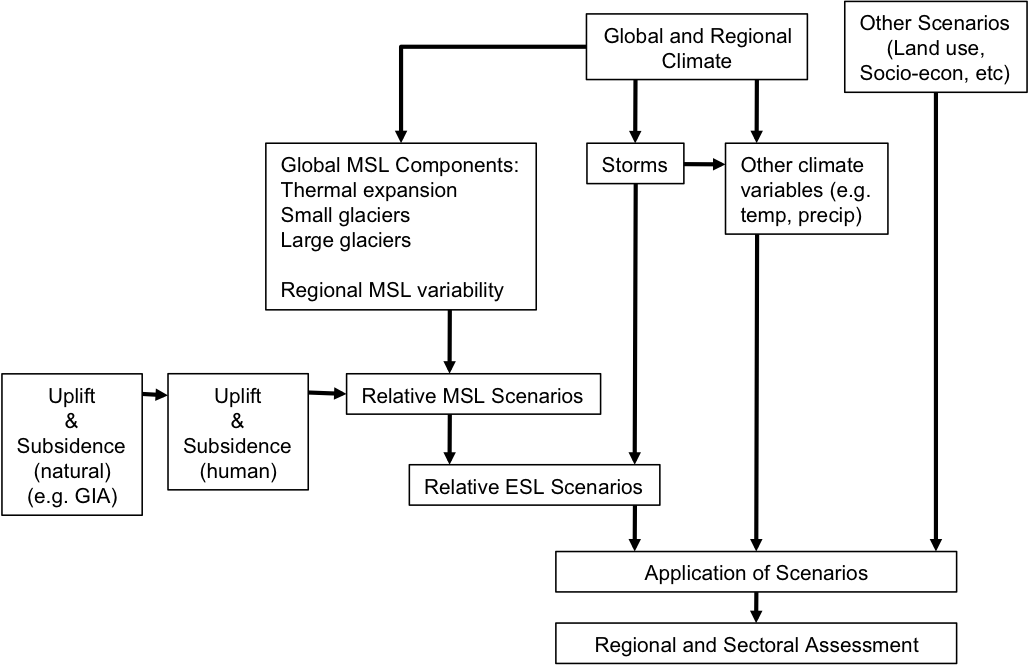 |
|
Decadal time series of heat wave indices |
Observed |
Temperature |
National |
Regional Climate Trends and Scenarios for the U.S. National Climate Assessment. Part 9. Climate of the Contiguous United States |
NCA 3 |
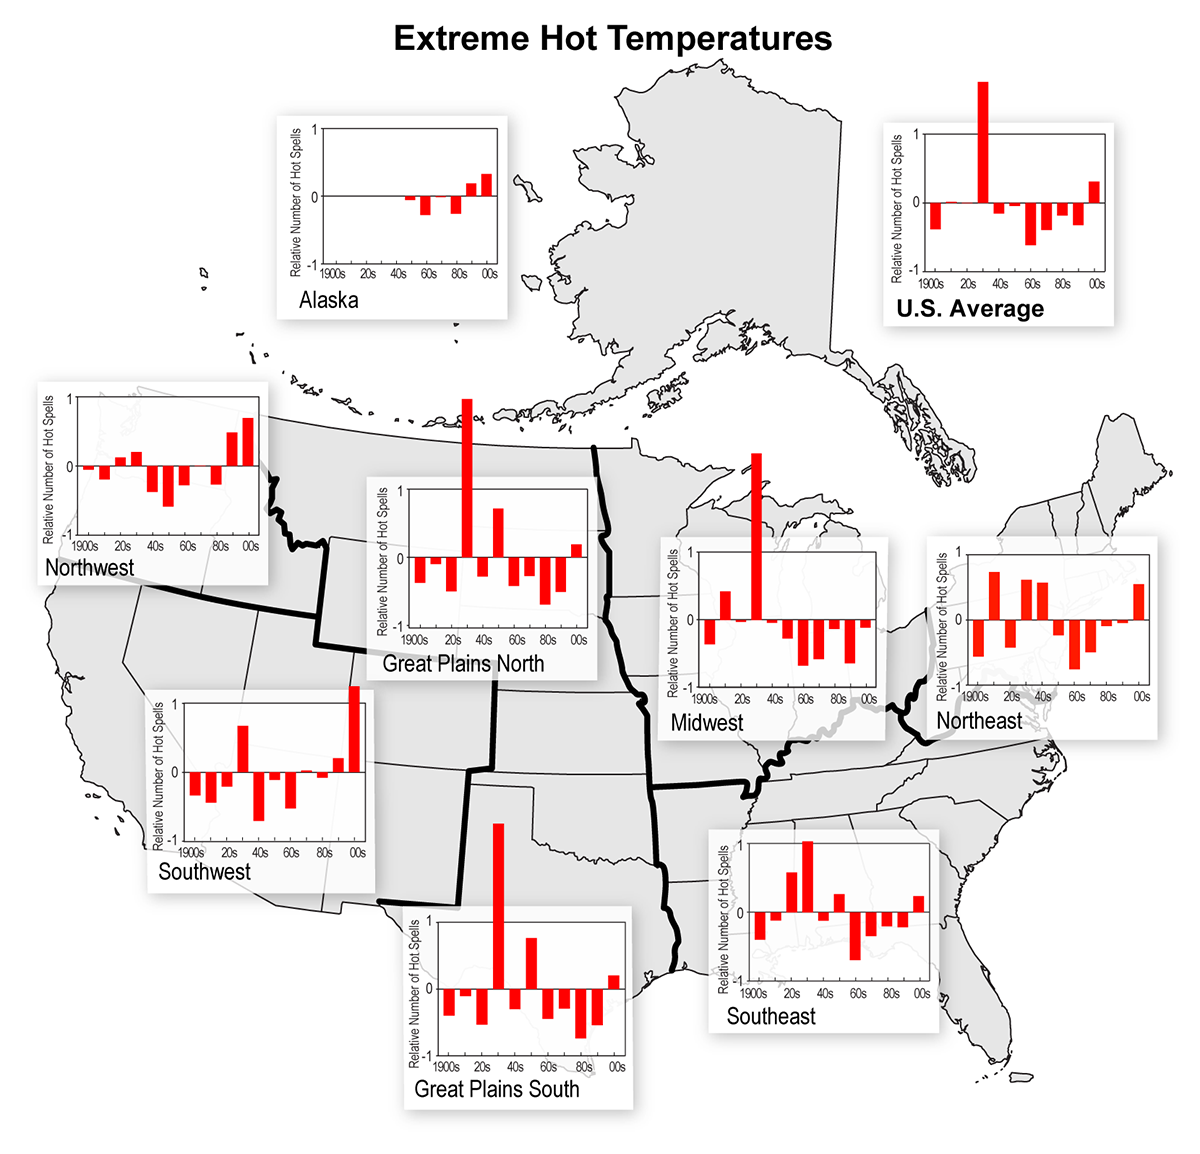 |
|
Decadal time series of cold wave indices |
Observed |
Temperature |
National |
Regional Climate Trends and Scenarios for the U.S. National Climate Assessment. Part 9. Climate of the Contiguous United States |
NCA 3 |
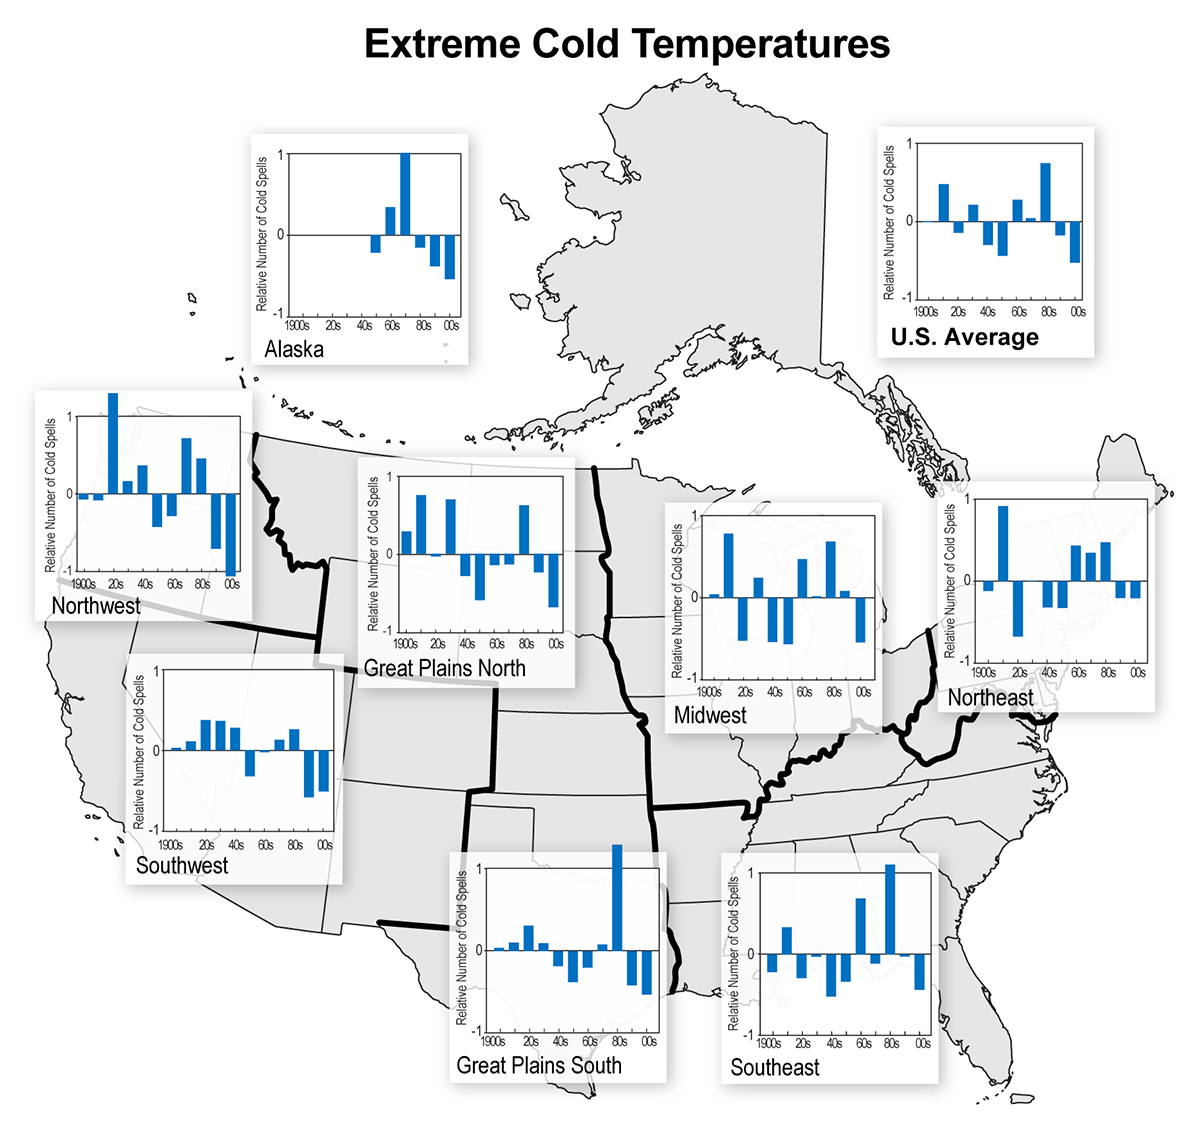 |
|
Decadal time series of an extreme precipitation index |
Observed |
Precipitation |
National |
Regional Climate Trends and Scenarios for the U.S. National Climate Assessment. Part 9. Climate of the Contiguous United States |
NCA 3 |
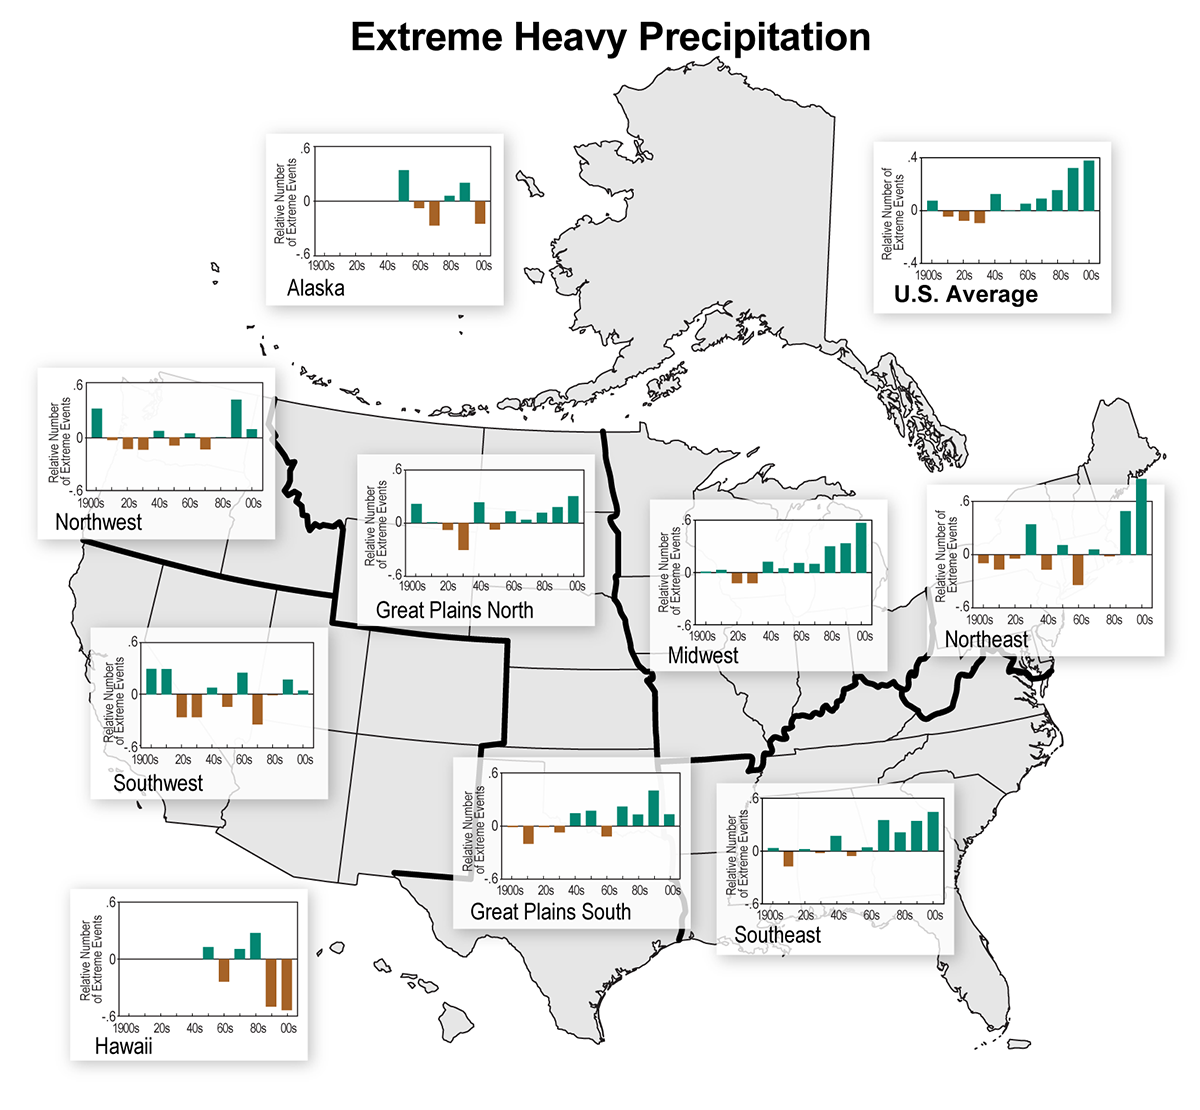 |
|
Decadal mean growing season length for Alaska |
Simulated |
Temperature |
Alaska and Arctic |
Regional Climate Trends and Scenarios for the U.S. National Climate Assessment. Part 7. Climate of Alaska |
NCA 3 |
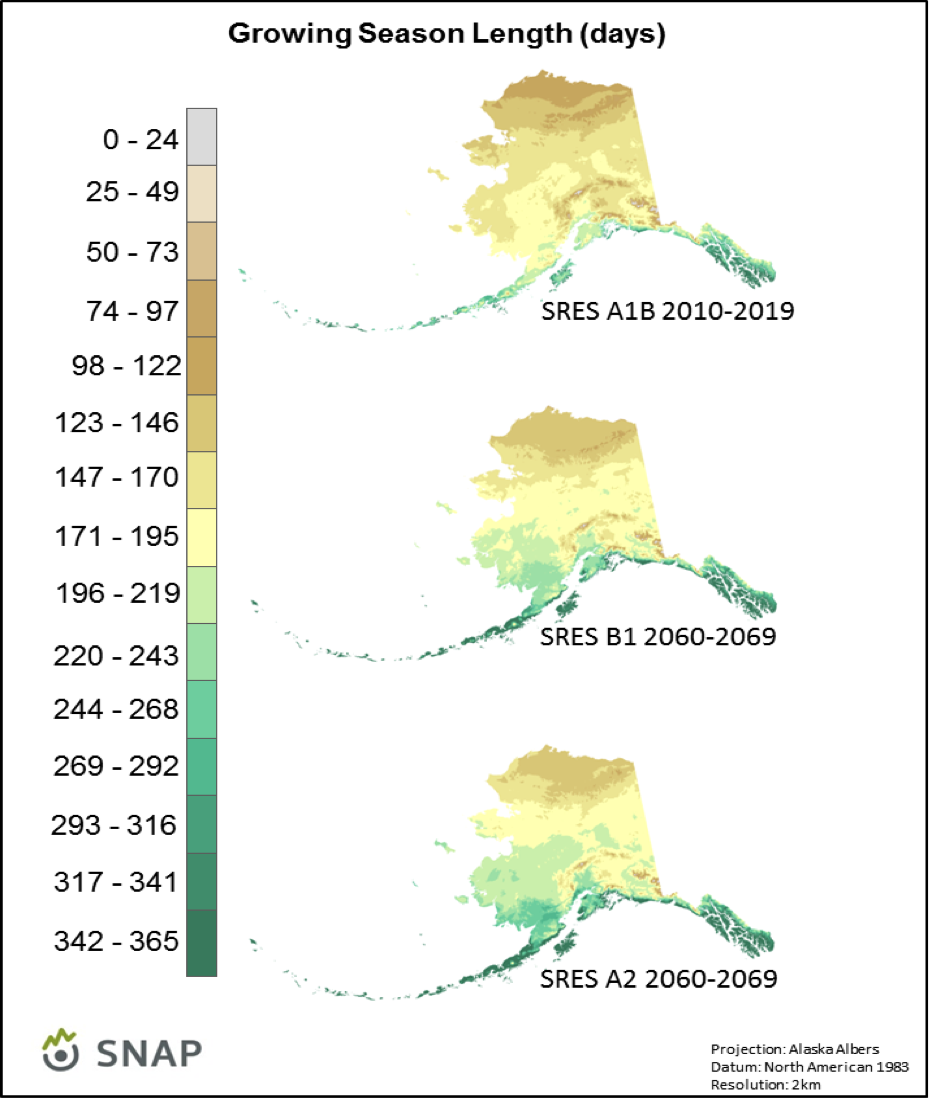 |
|
Decadal mean annual temperature for Alaska |
Simulated |
Temperature |
Alaska and Arctic |
Regional Climate Trends and Scenarios for the U.S. National Climate Assessment. Part 7. Climate of Alaska |
NCA 3 |
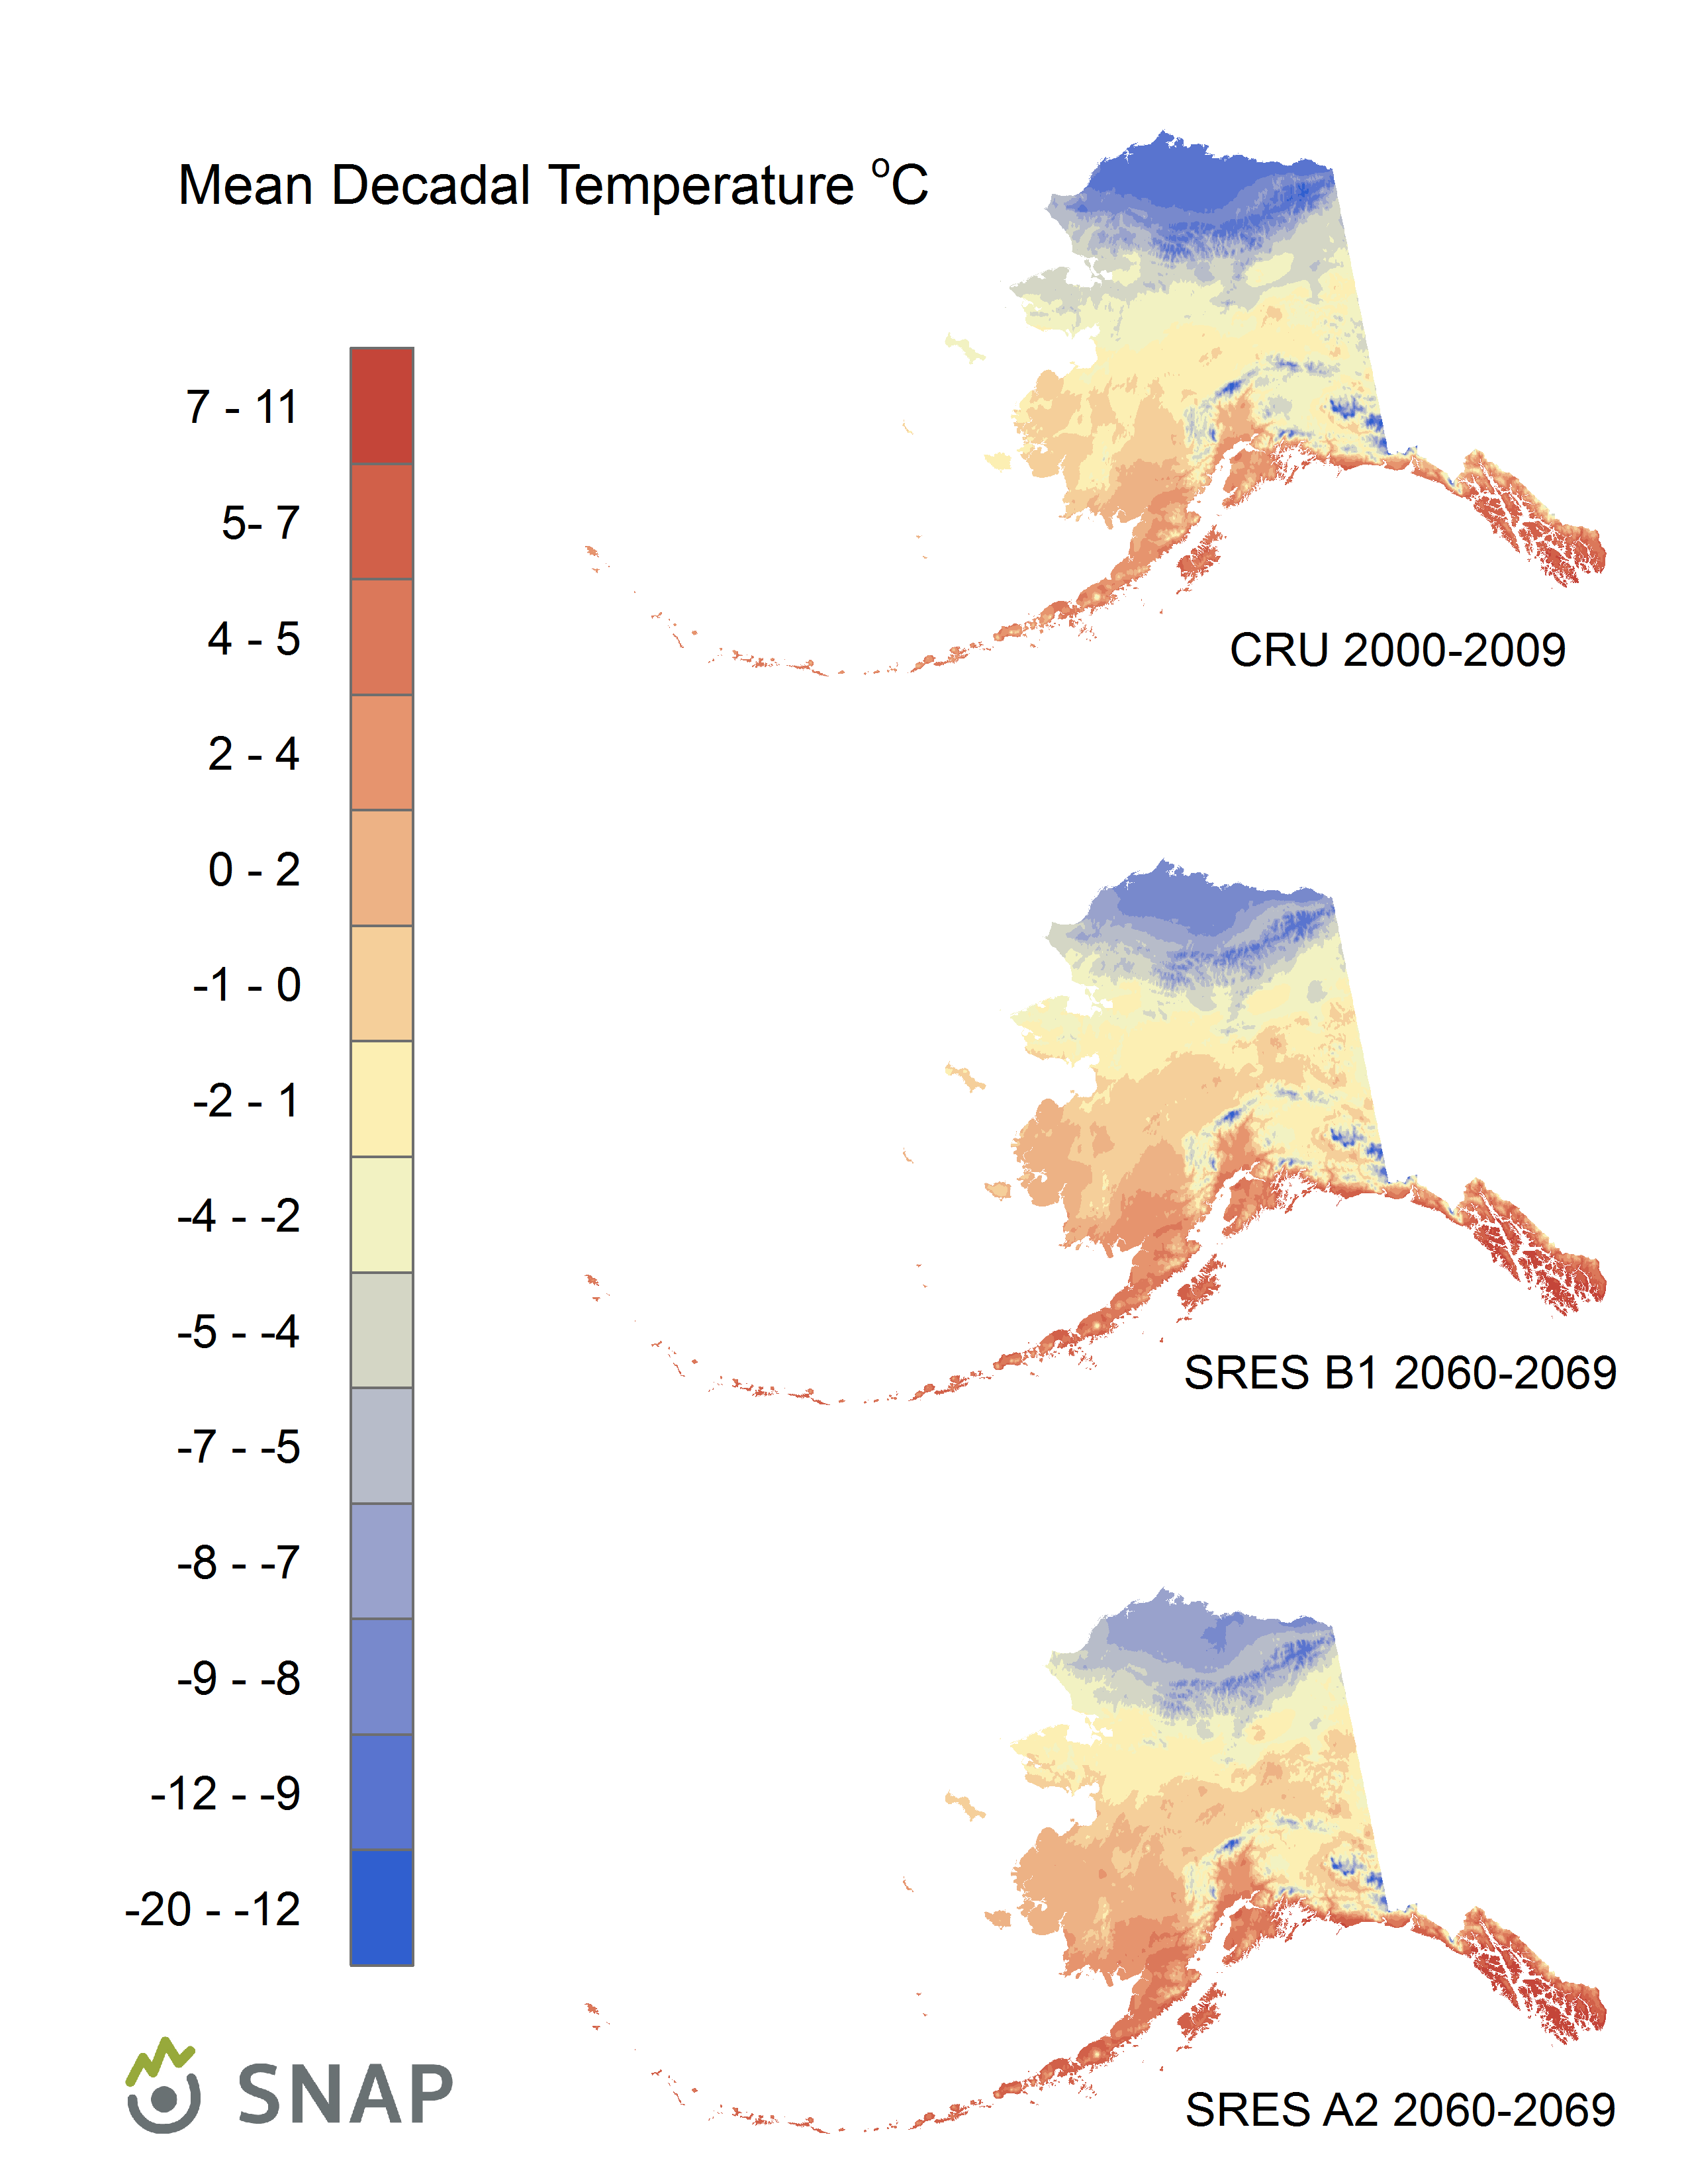 |
|
Decadal mean annual precipitation for Alaska |
Simulated |
Precipitation |
Alaska and Arctic |
Regional Climate Trends and Scenarios for the U.S. National Climate Assessment. Part 7. Climate of Alaska |
NCA 3 |
 |
|
Date of ice-in on the main portion of Lake Champlain |
Observed |
Ice |
National |
Regional Climate Trends and Scenarios for the U.S. National Climate Assessment. Part 9. Climate of the Contiguous United States |
NCA 3 |
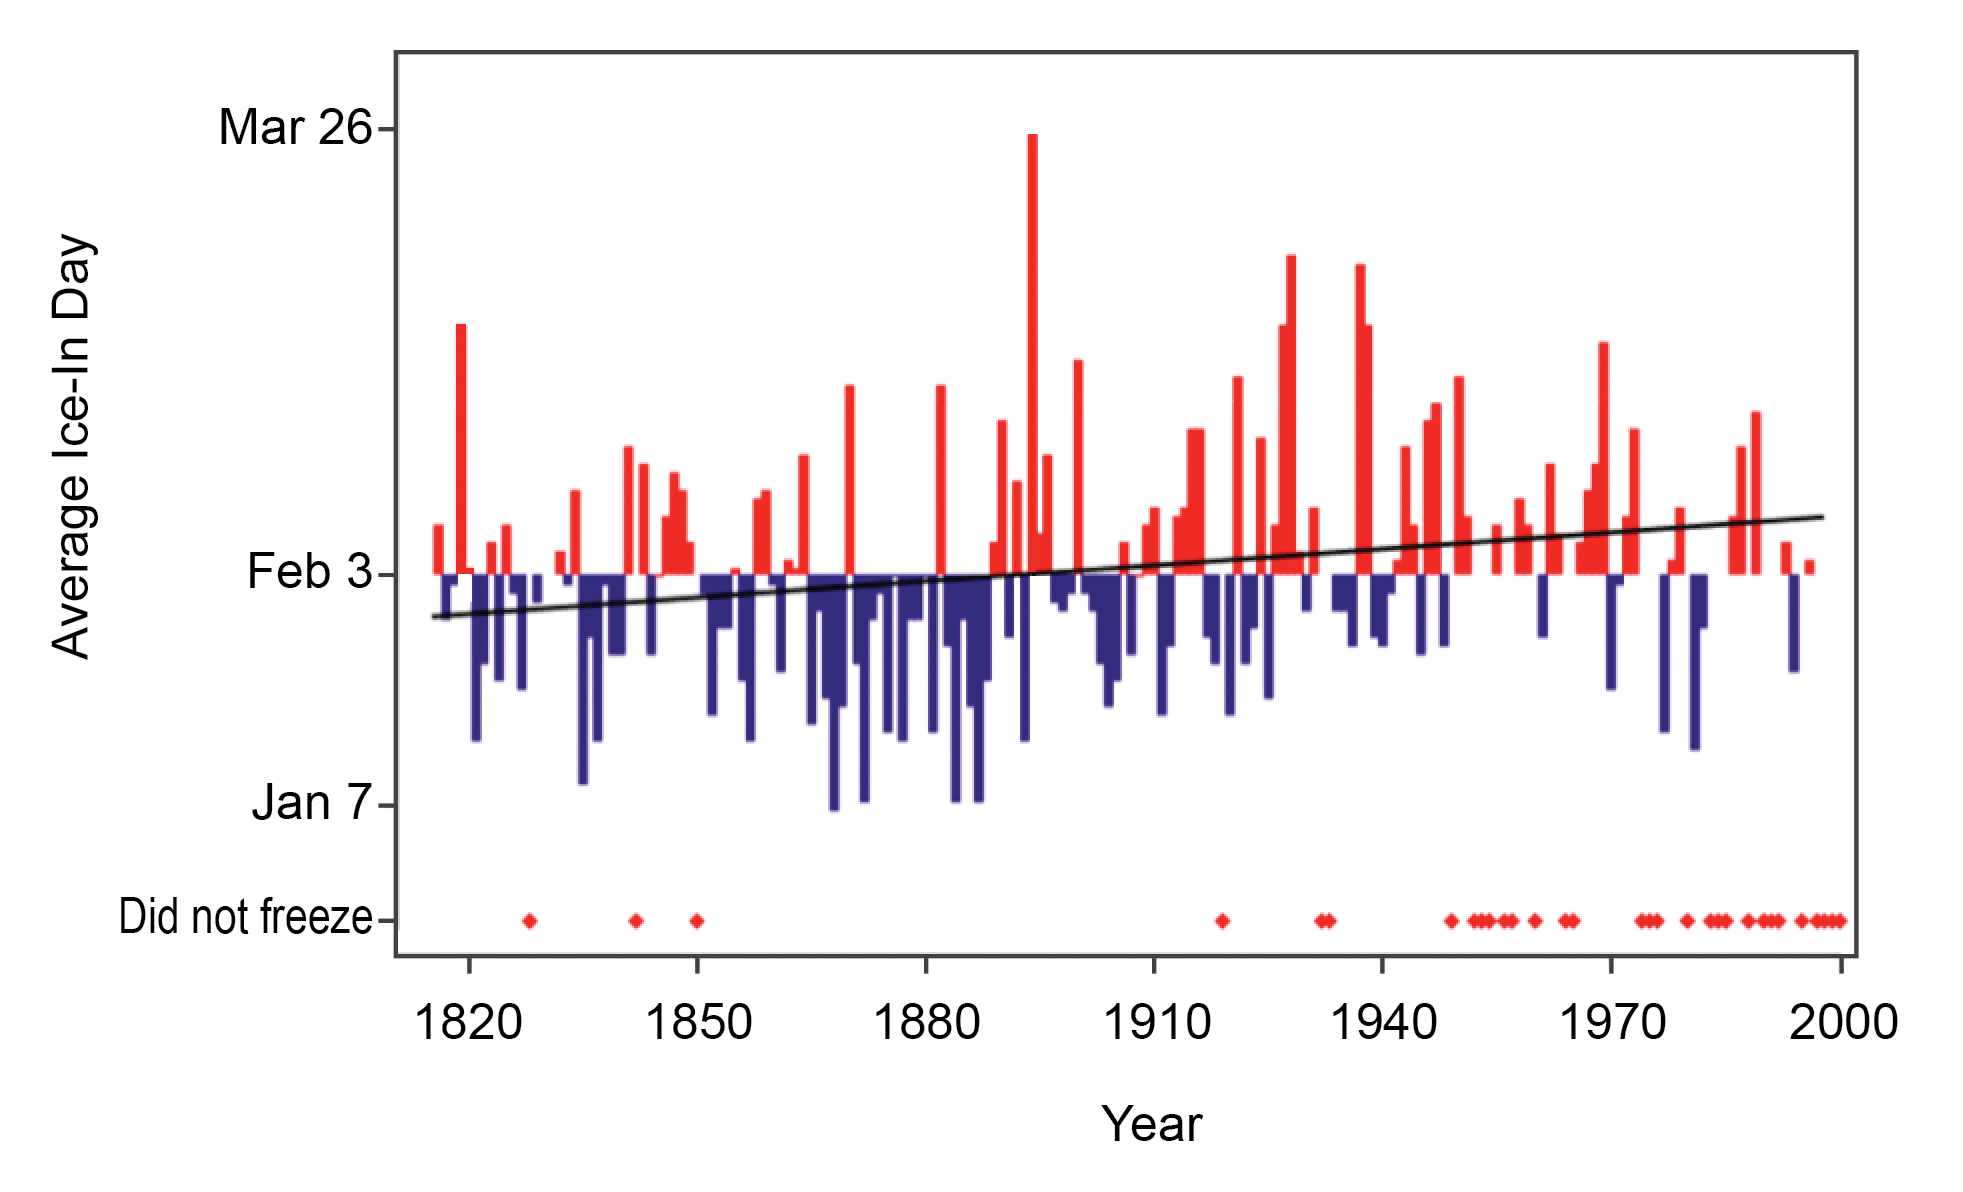 |
|
Date of ice-in on the main portion of Lake Champlain |
Observed |
Ice |
Northeast |
Regional Climate Trends and Scenarios for the U.S. National Climate Assessment. Part 1. Climate of the Northeast U.S. |
NCA 3 |
 |
|
Contribution of GIA to net changes in RSL |
Simulated |
Sea |
National |
Global Sea Level Rise Scenarios for the United States National Climate Assessment |
NCA 3 |
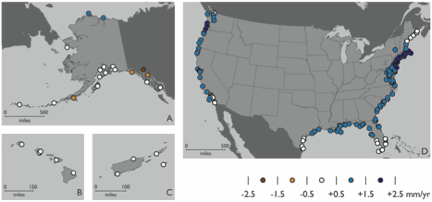 |
|
CMIP3 Models Listing |
Simulated |
|
Alaska and Arctic |
Regional Climate Trends and Scenarios for the U.S. National Climate Assessment. Part 7. Climate of Alaska |
NCA 3 |
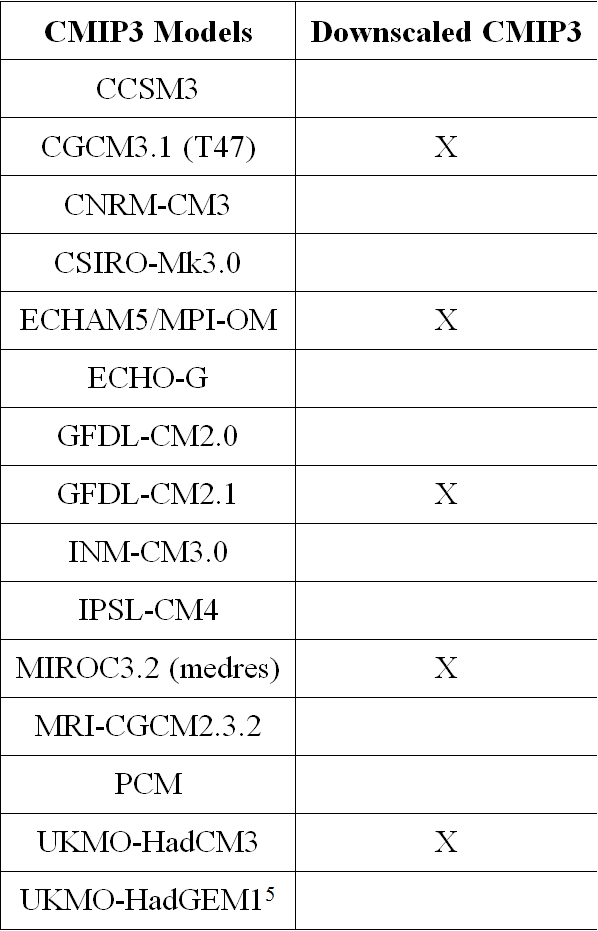 |
|
CMIP3 Models Listing |
Simulated |
|
Northeast |
Regional Climate Trends and Scenarios for the U.S. National Climate Assessment. Part 1. Climate of the Northeast U.S. |
NCA 3 |
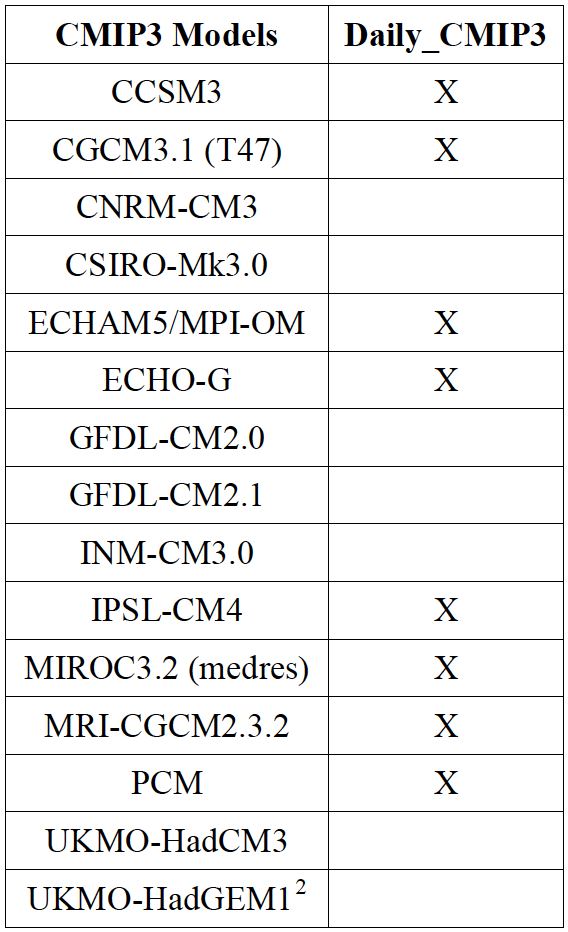 |
|
CMIP3 Models Listing |
Simulated |
|
Southeast and Caribbean |
Regional Climate Trends and Scenarios for the U.S. National Climate Assessment. Part 2. Climate of the Southeast U.S. |
NCA 3 |
 |
|
CMIP3 Models Listing |
Simulated |
|
Midwest |
Regional Climate Trends and Scenarios for the U.S. National Climate Assessment. Part 3. Climate of the Midwest U.S. |
NCA 3 |
 |
|
CMIP3 Models Listing |
Simulated |
|
Great Plains |
Regional Climate Trends and Scenarios for the U.S. National Climate Assessment. Part 4. Climate of the U.S. Great Plains |
NCA 3 |
 |
|
CMIP3 Models Listing |
Simulated |
|
Southwest |
Regional Climate Trends and Scenarios for the U.S. National Climate Assessment. Part 5. Climate of the Southwest U.S. |
NCA 3 |
 |
|
CMIP3 Models Listing |
Simulated |
|
Northwest |
Regional Climate Trends and Scenarios for the U.S. National Climate Assessment. Part 6. Climate of the Northwest U.S. |
NCA 3 |
 |
|
Causes of sea level change |
Observed |
Sea |
Global |
Global Sea Level Rise Scenarios for the United States National Climate Assessment |
NCA 3 |
 |
|
Average winter temperature for the Midwest region |
Observed |
Temperature |
Midwest |
Regional Climate Trends and Scenarios for the U.S. National Climate Assessment. Part 3. Climate of the Midwest U.S. |
NCA 3 |
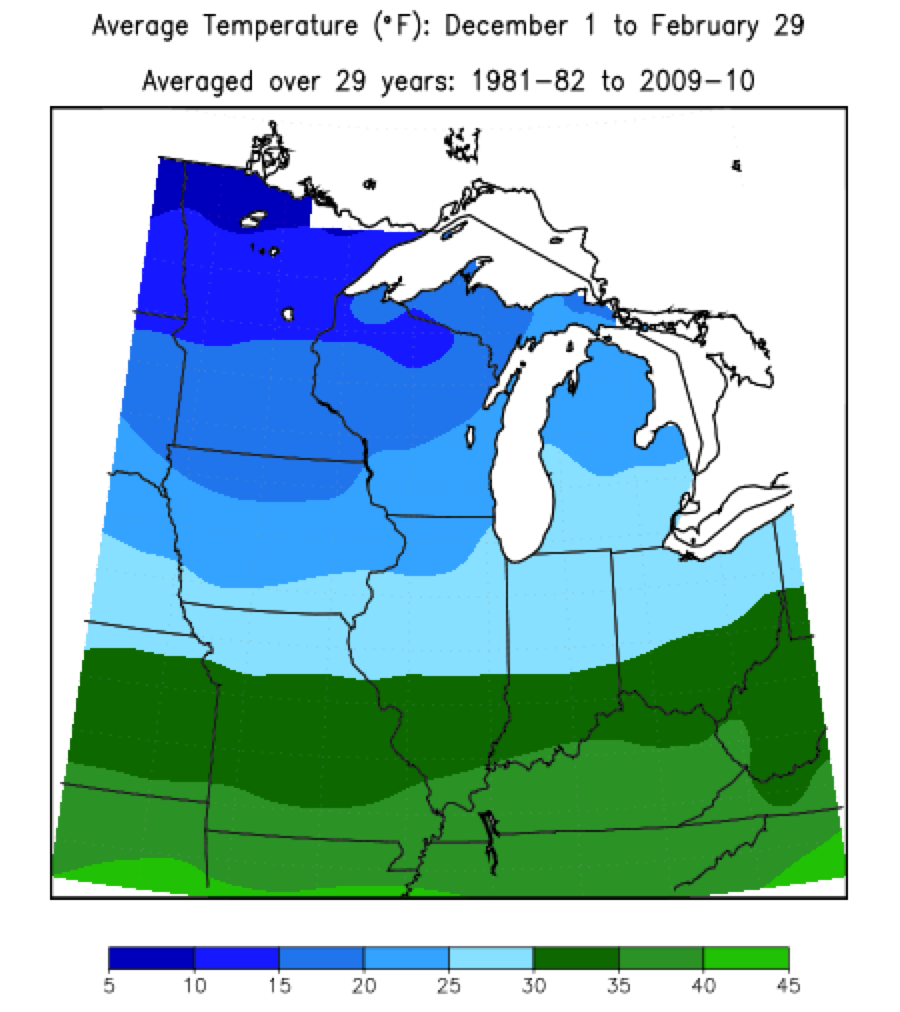 |
|
Average seasonal accumulated precipitation for the Midwest region |
Observed |
Precipitation |
Midwest |
Regional Climate Trends and Scenarios for the U.S. National Climate Assessment. Part 3. Climate of the Midwest U.S. |
NCA 3 |
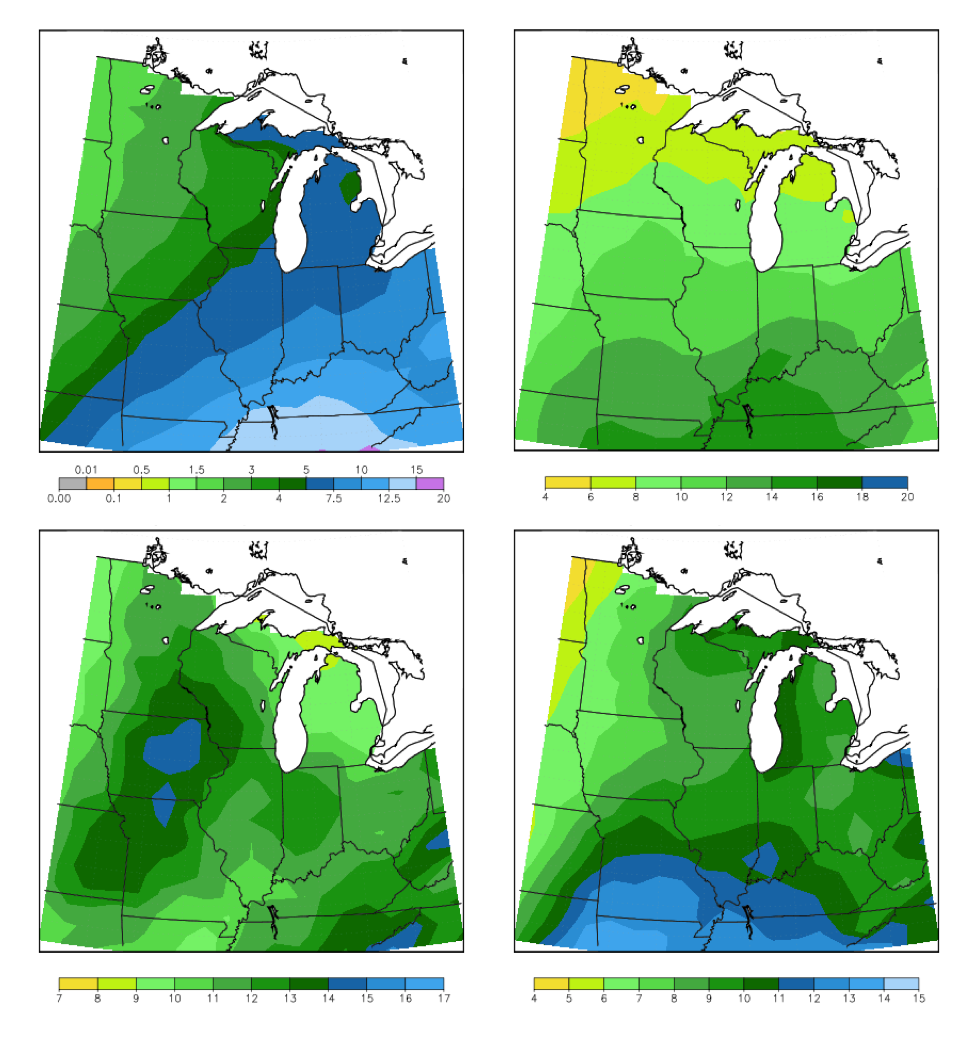 |
|
Average number of modified growing degree days for the Midwest region |
Observed |
Temperature |
Midwest |
Regional Climate Trends and Scenarios for the U.S. National Climate Assessment. Part 3. Climate of the Midwest U.S. |
NCA 3 |
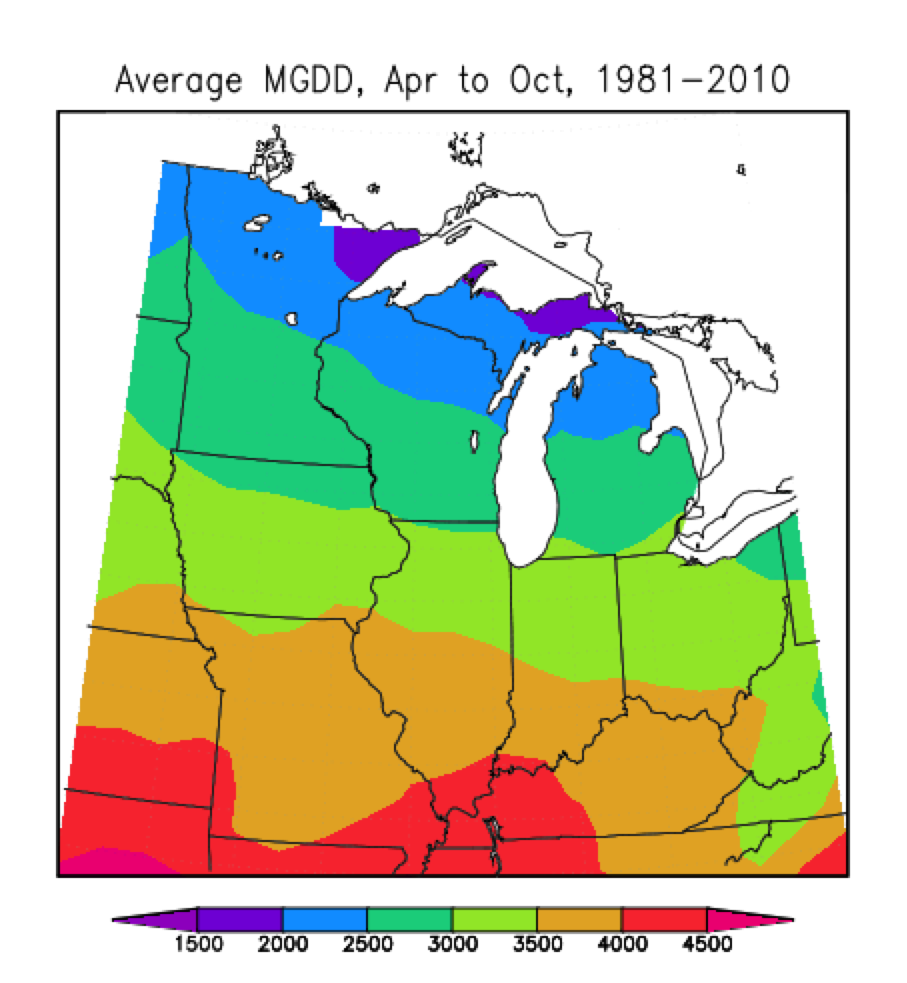 |
|
Average ice-out dates for Minnesota lakes |
Observed |
Ice |
Midwest |
Regional Climate Trends and Scenarios for the U.S. National Climate Assessment. Part 3. Climate of the Midwest U.S. |
NCA 3 |
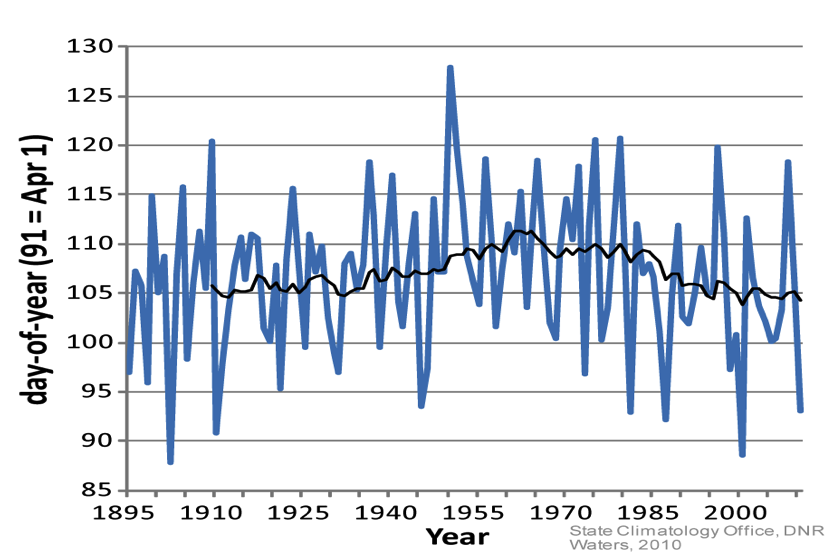 |
|
Average daily July maximum temperature |
Simulated |
Temperature |
Southeast and Caribbean |
Regional Climate Trends and Scenarios for the U.S. National Climate Assessment. Part 2. Climate of the Southeast U.S. |
NCA 3 |
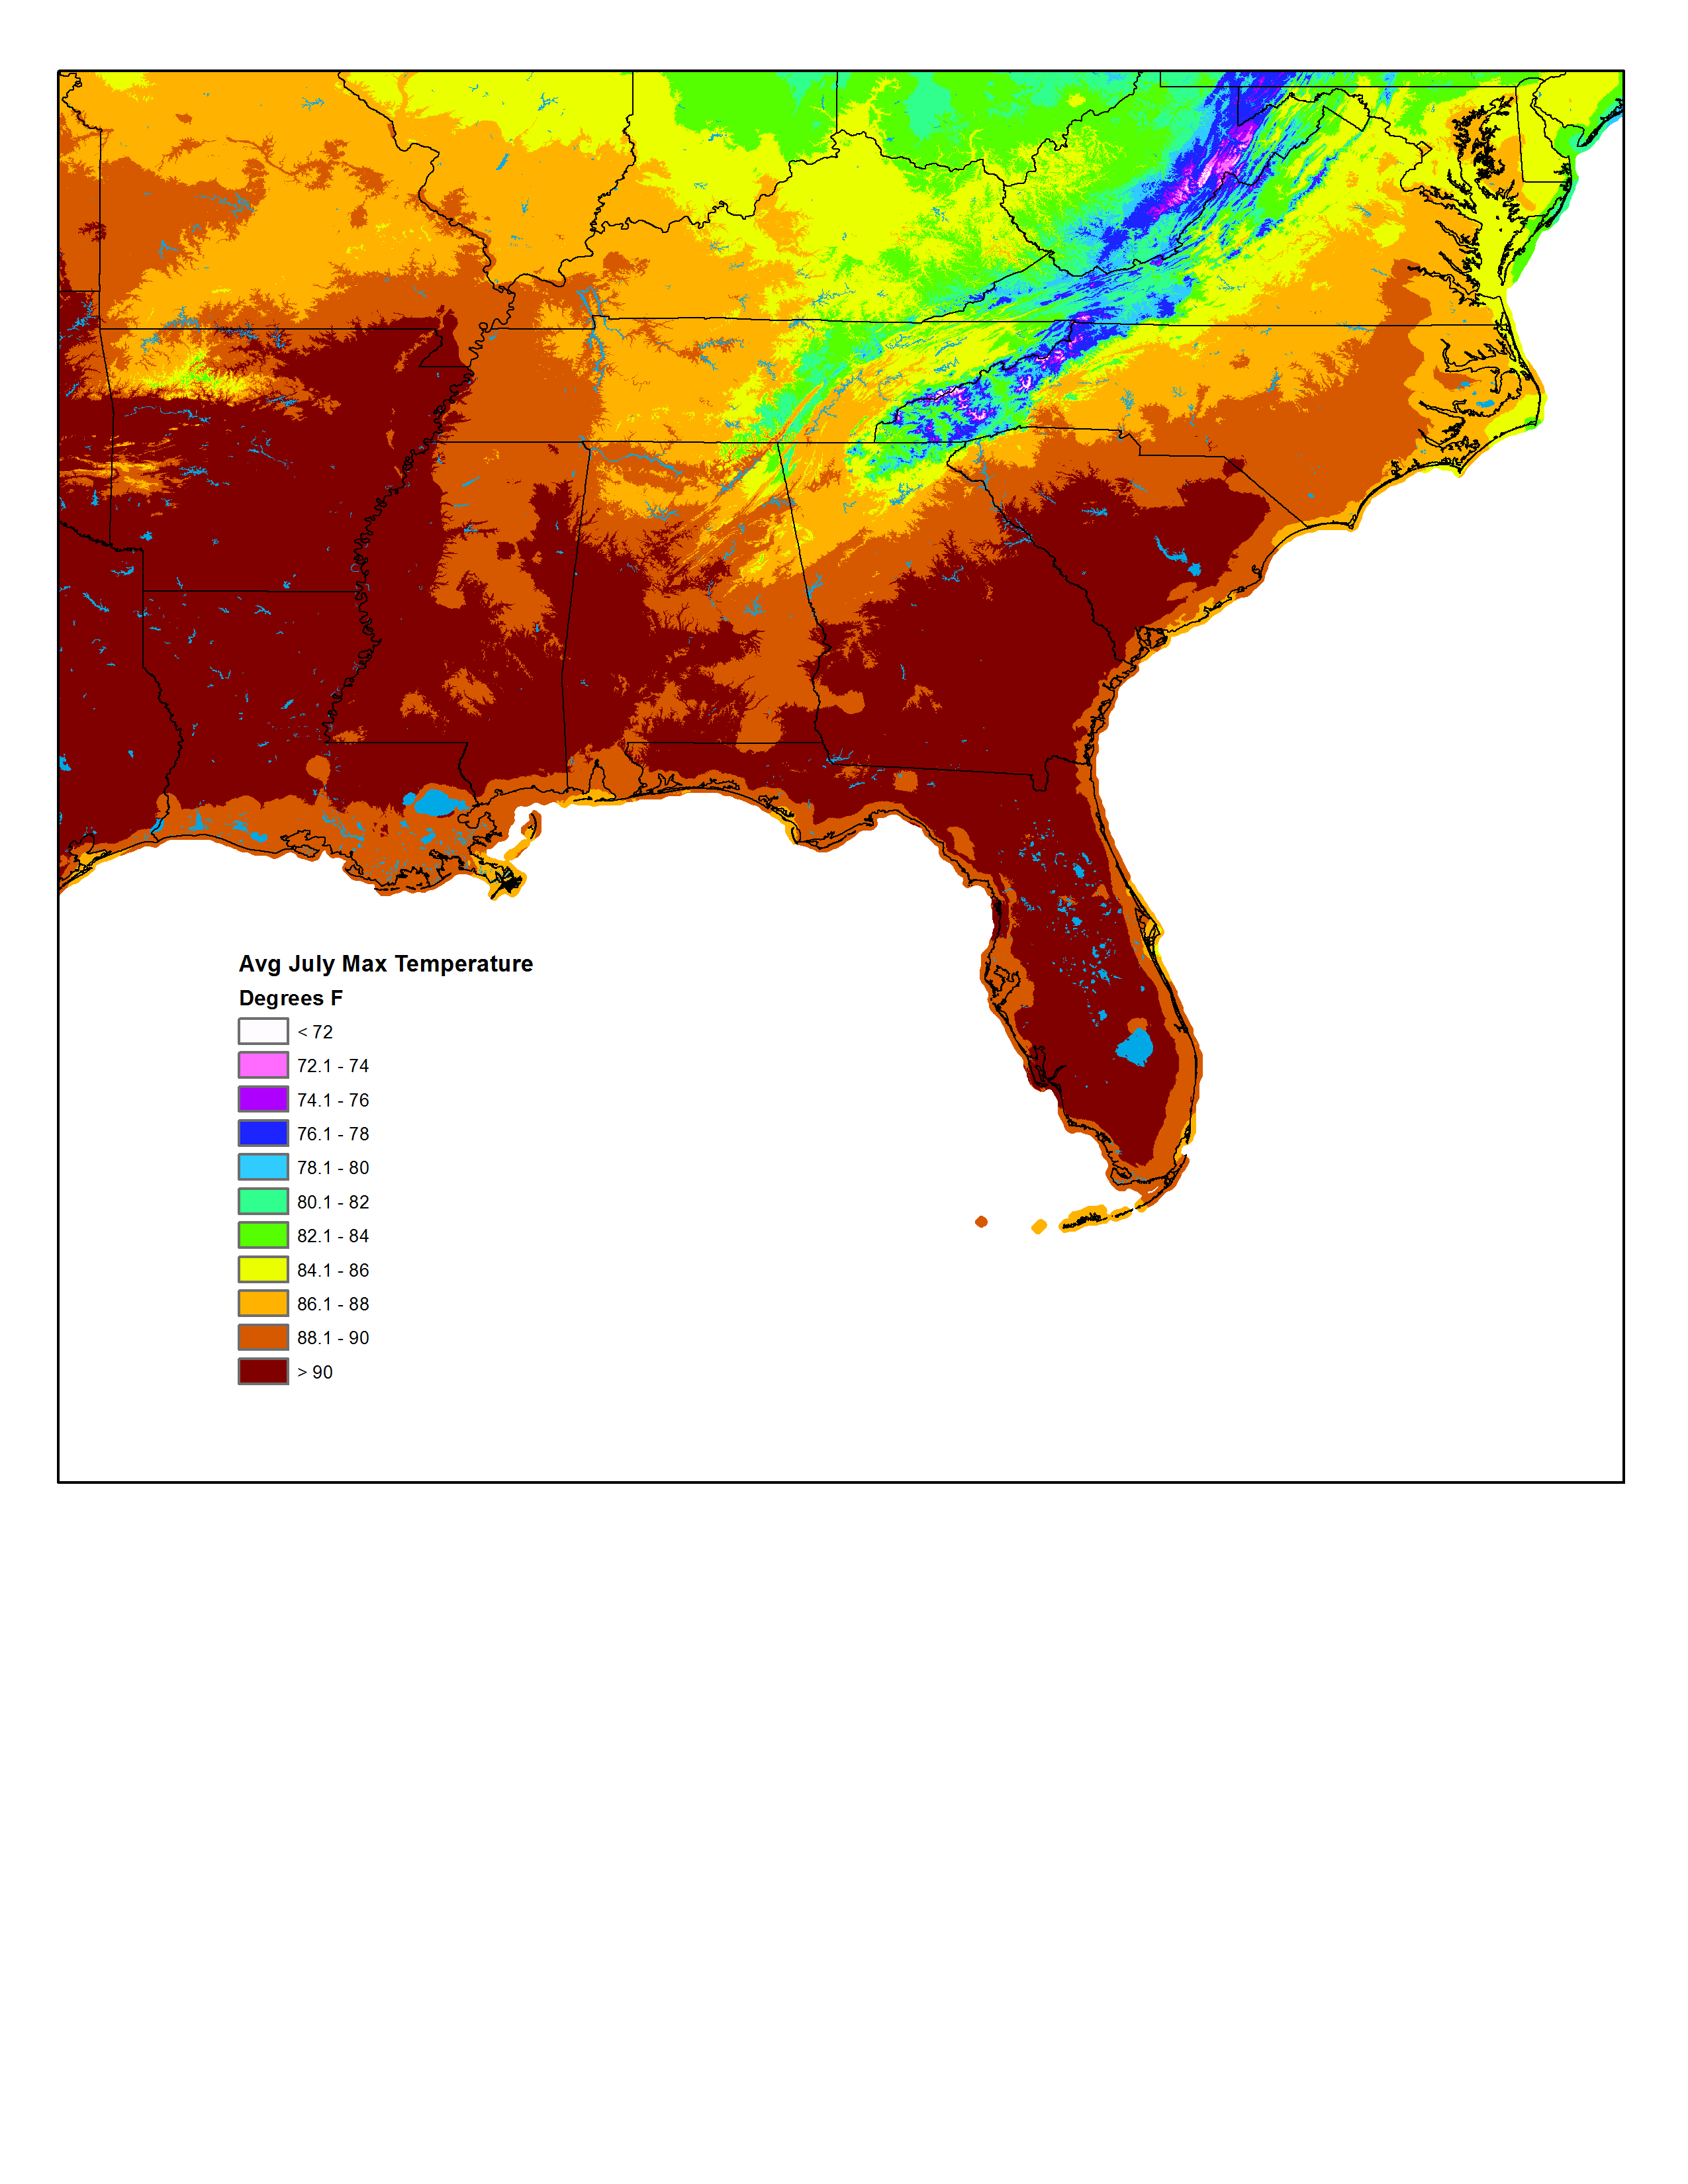 |
|
Average daily January minimum temperature |
Simulated |
Temperature |
Southeast and Caribbean |
Regional Climate Trends and Scenarios for the U.S. National Climate Assessment. Part 2. Climate of the Southeast U.S. |
NCA 3 |
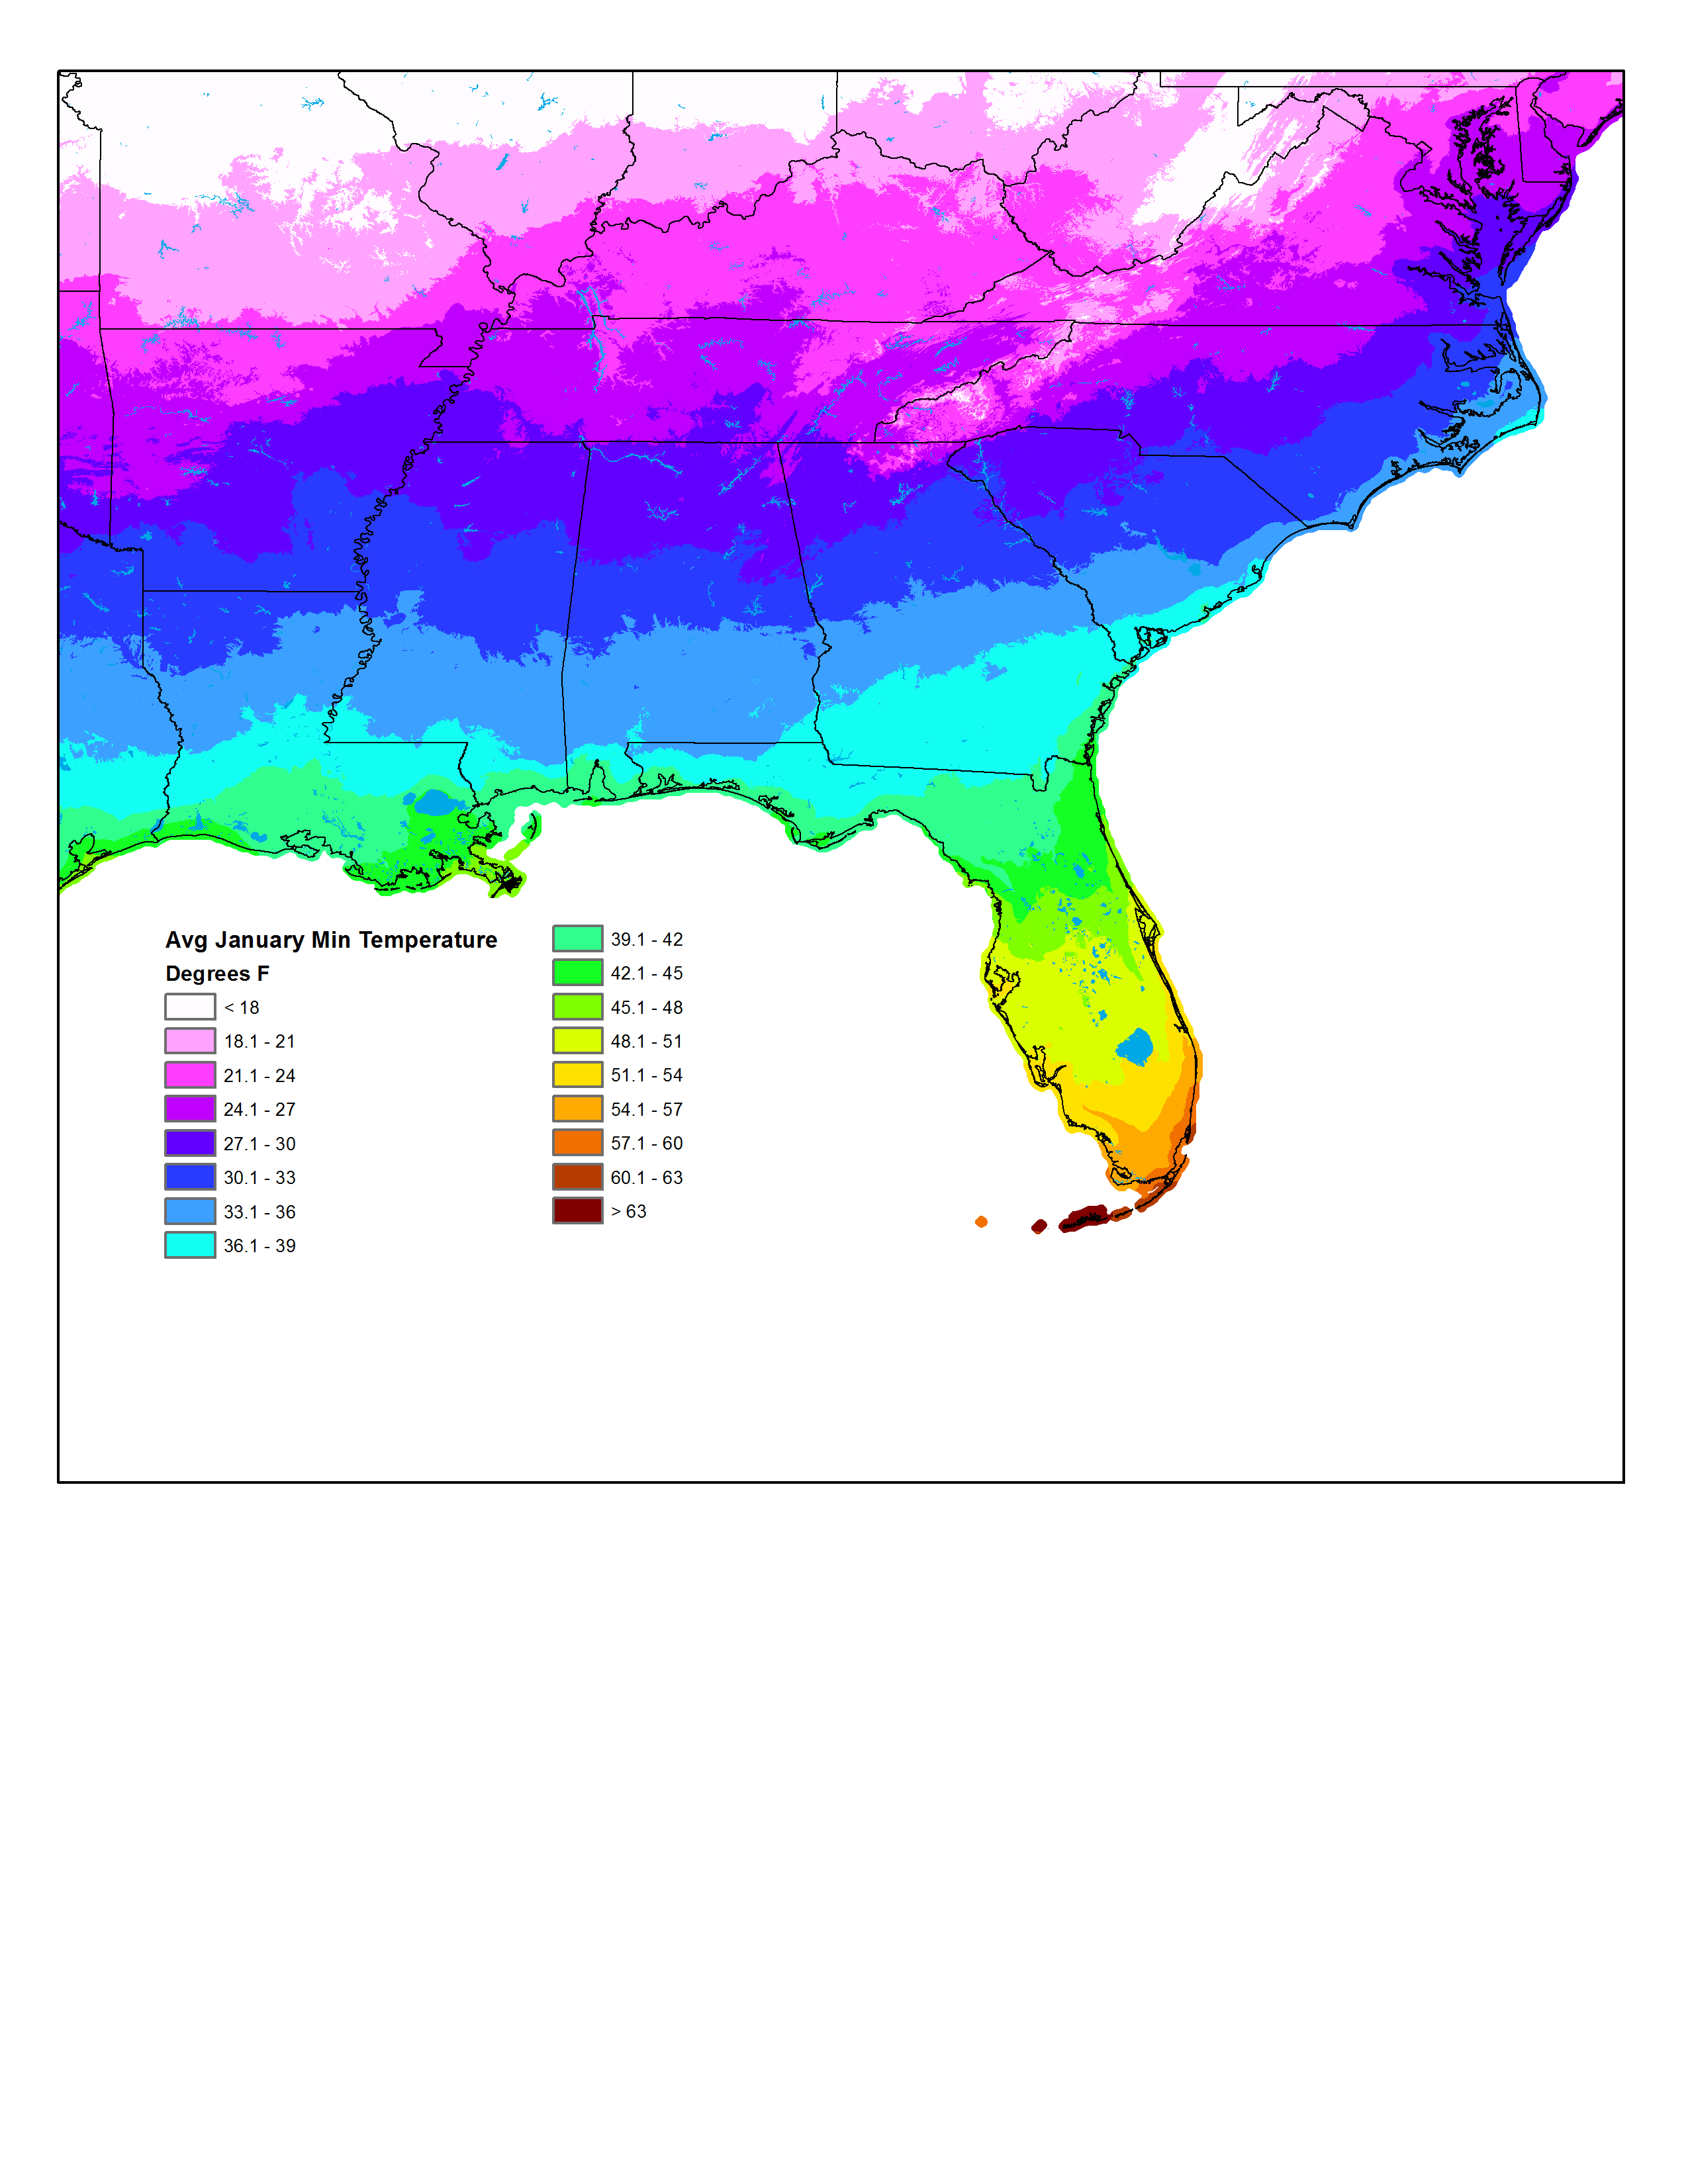 |
|
Average annual temperature |
Observed |
Temperature |
National |
Regional Climate Trends and Scenarios for the U.S. National Climate Assessment. Part 9. Climate of the Contiguous United States |
NCA 3 |
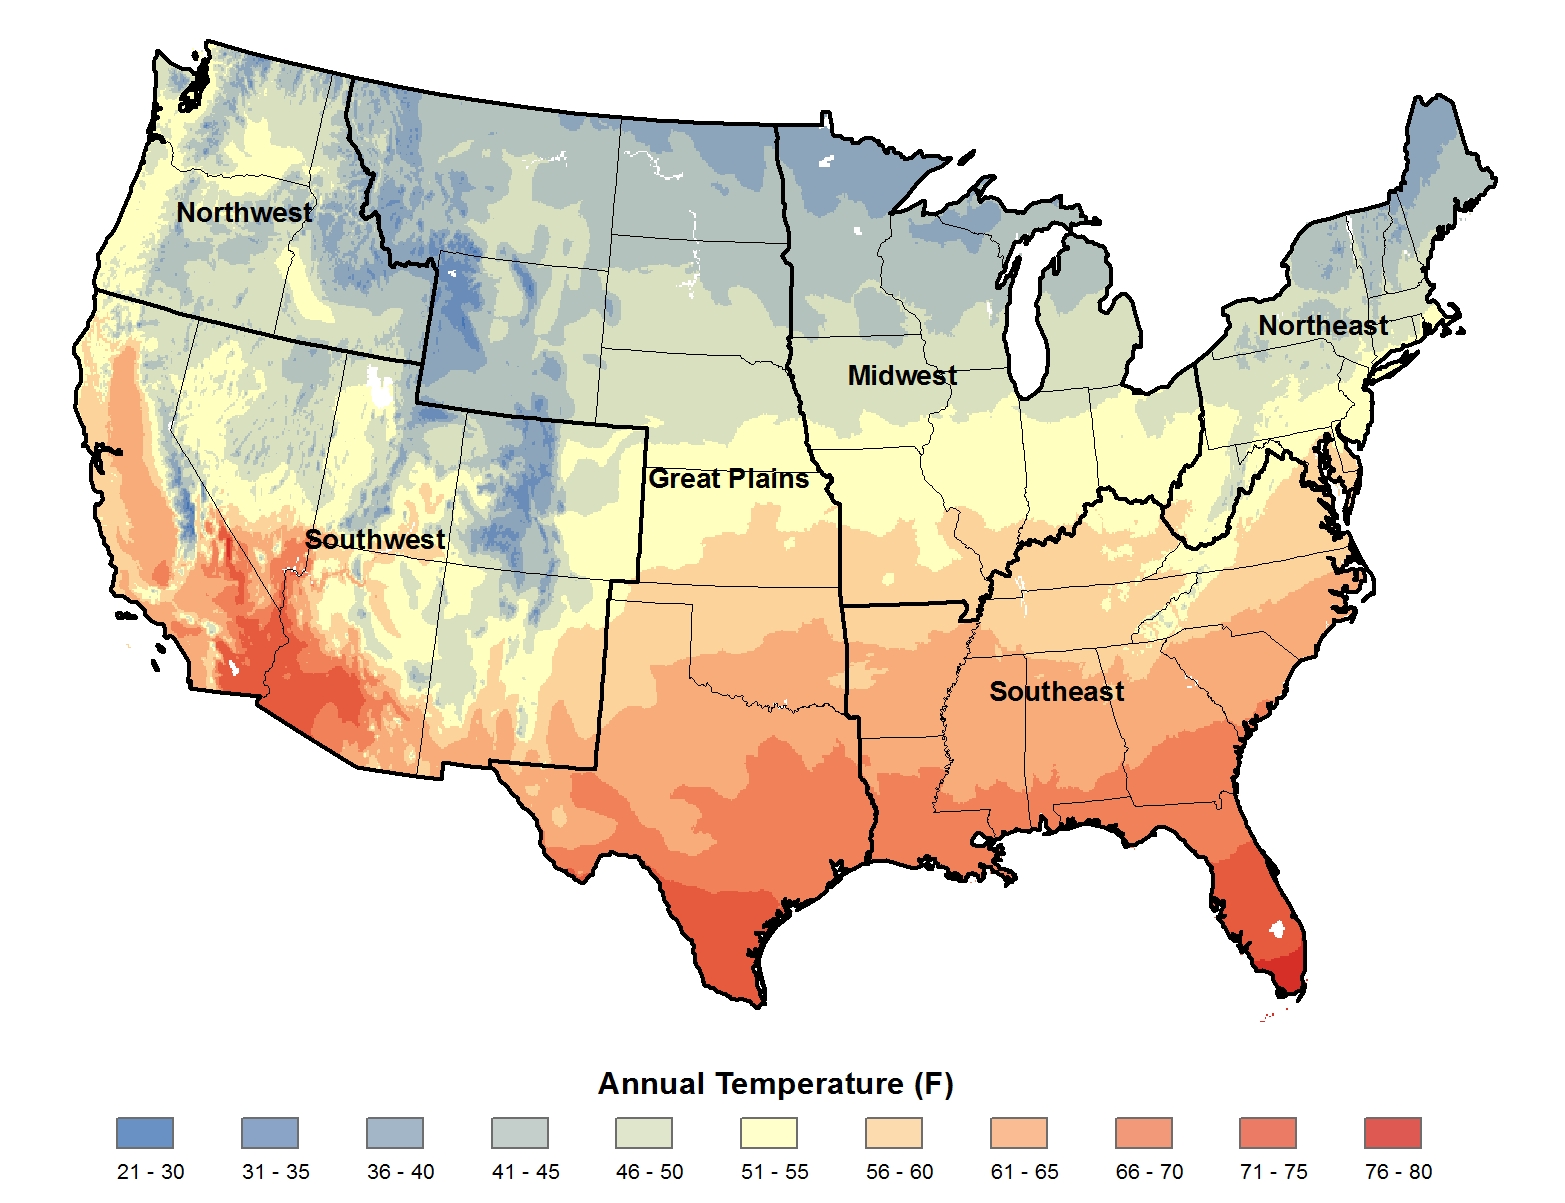 |
|
Average annual temperature |
Observed |
Temperature |
Great Plains |
Regional Climate Trends and Scenarios for the U.S. National Climate Assessment. Part 4. Climate of the U.S. Great Plains |
NCA 3 |
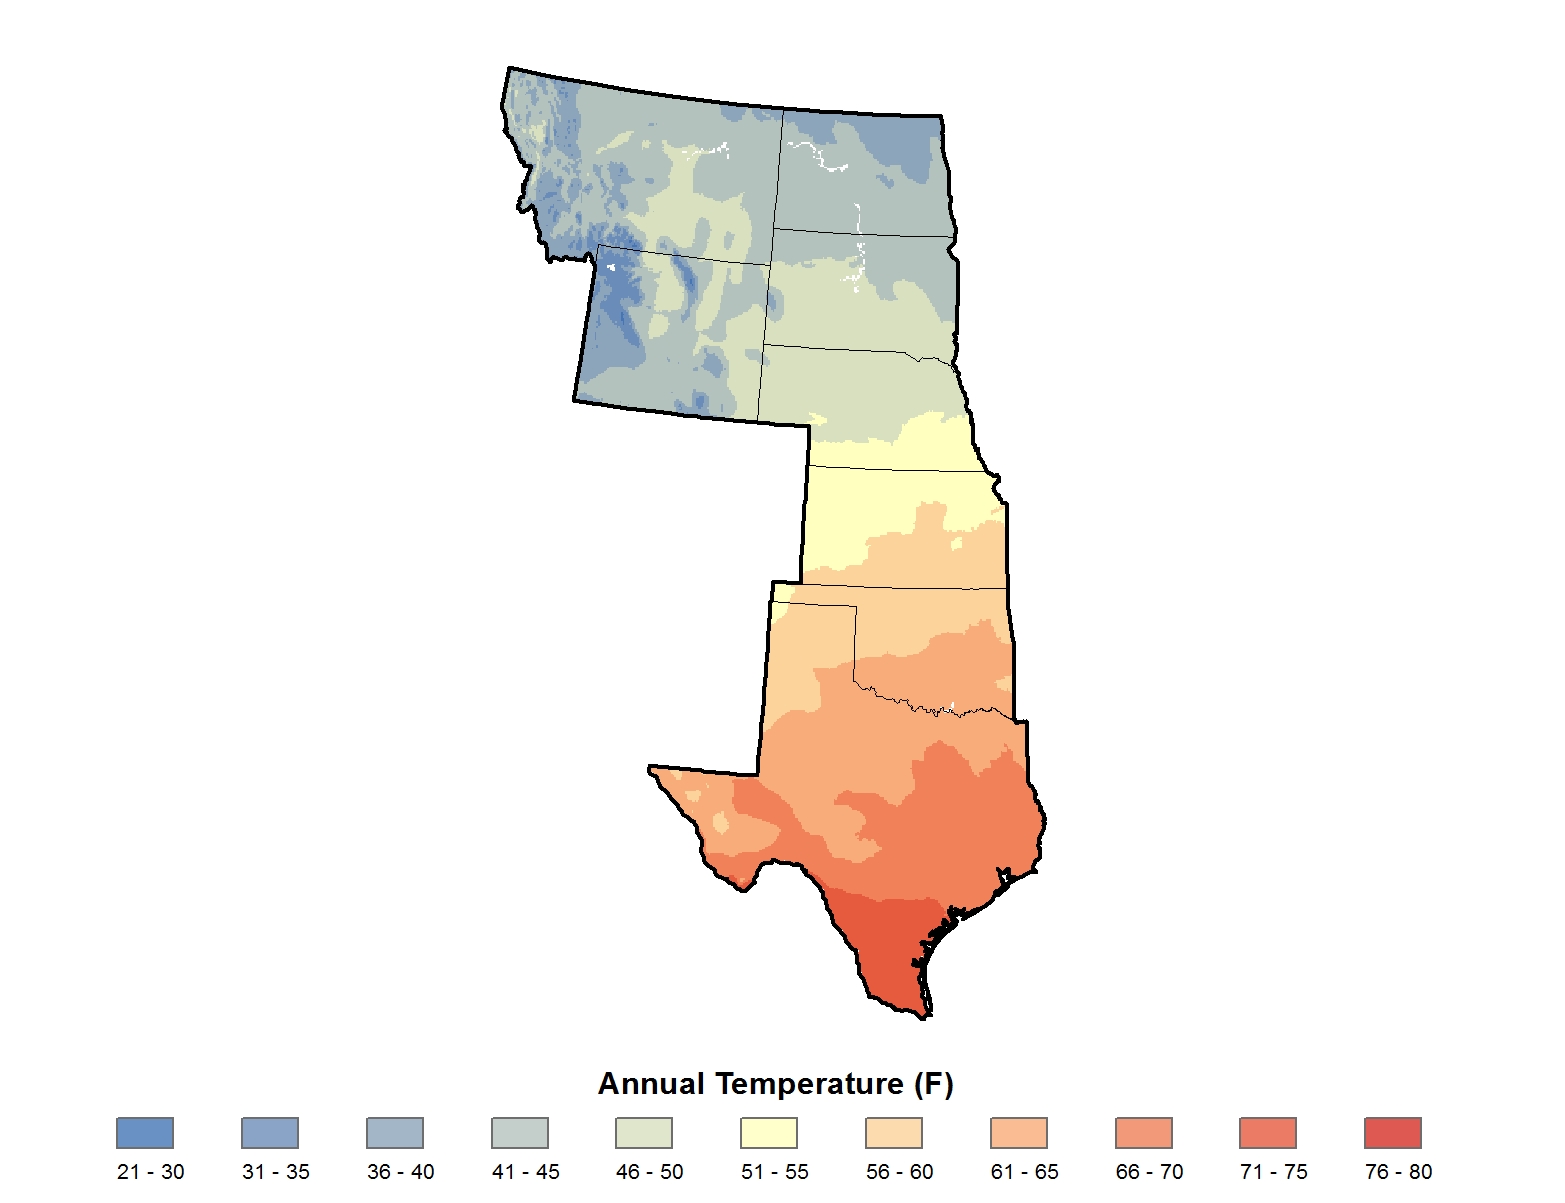 |
|
Average annual temperature |
Observed |
Temperature |
Northeast |
Regional Climate Trends and Scenarios for the U.S. National Climate Assessment. Part 1. Climate of the Northeast U.S. |
NCA 3 |
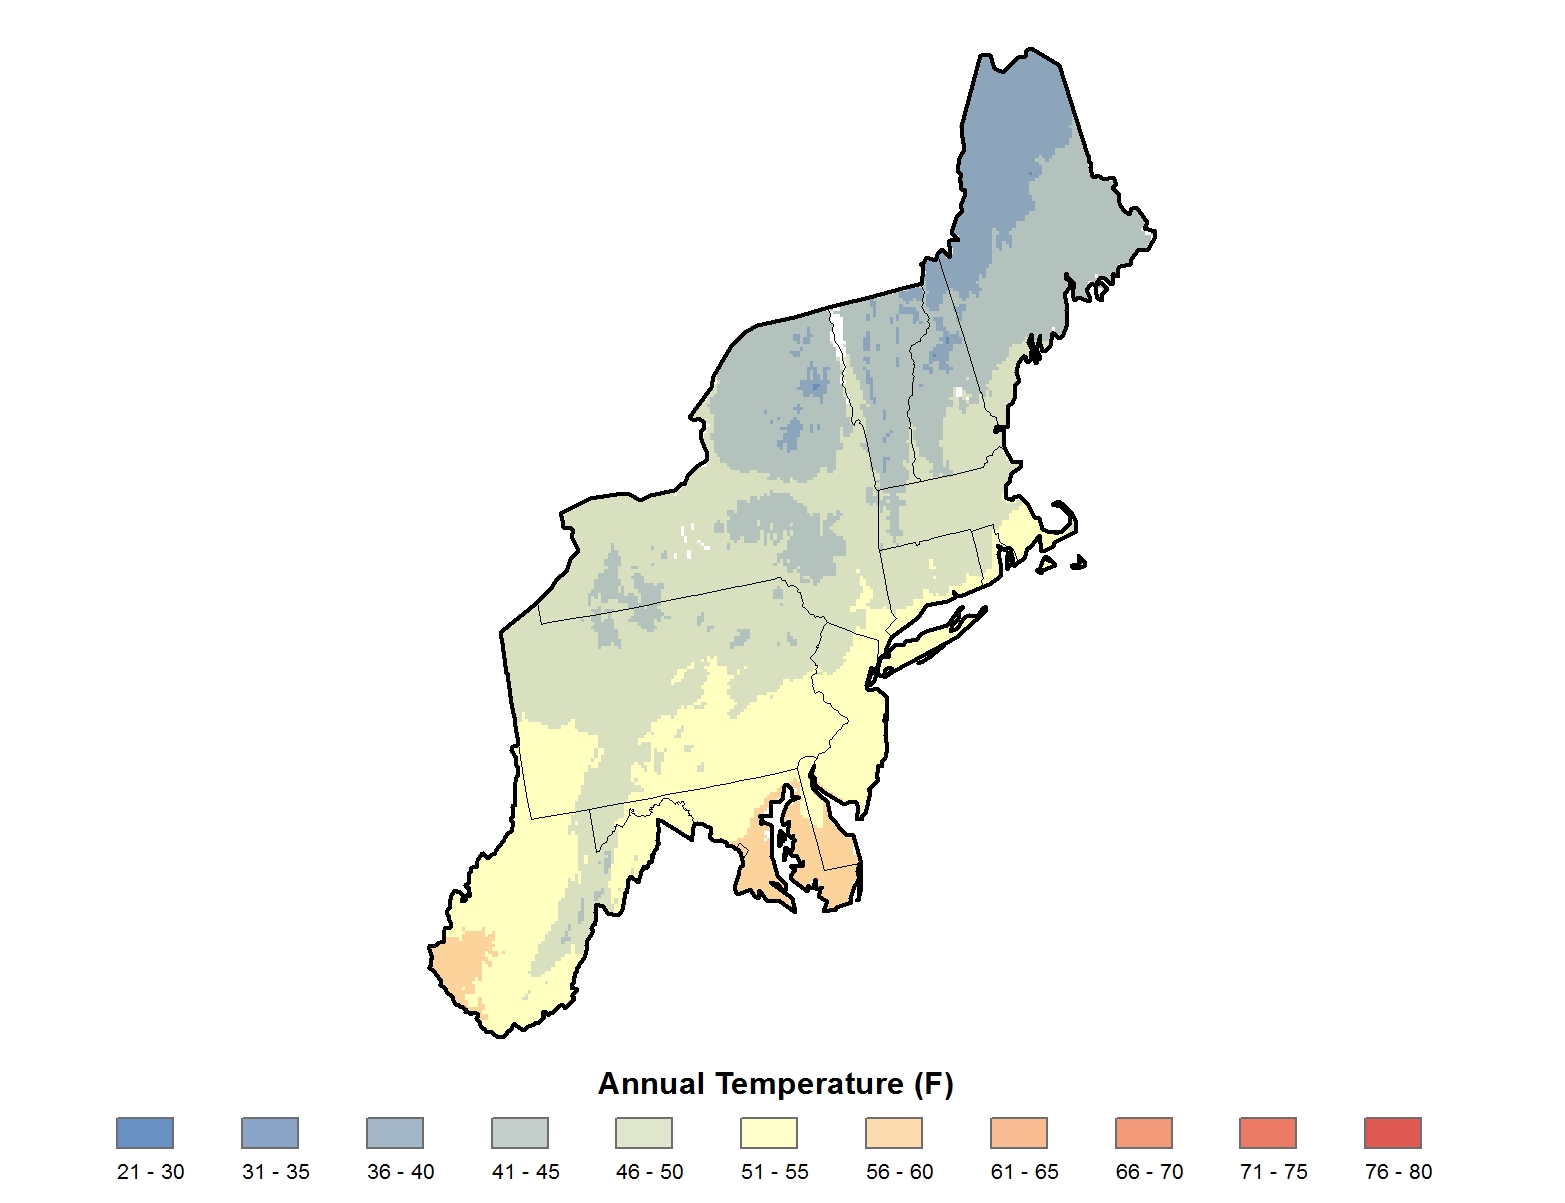 |
|
Average annual temperature |
Observed |
Temperature |
Southwest |
Regional Climate Trends and Scenarios for the U.S. National Climate Assessment. Part 5. Climate of the Southwest U.S. |
NCA 3 |
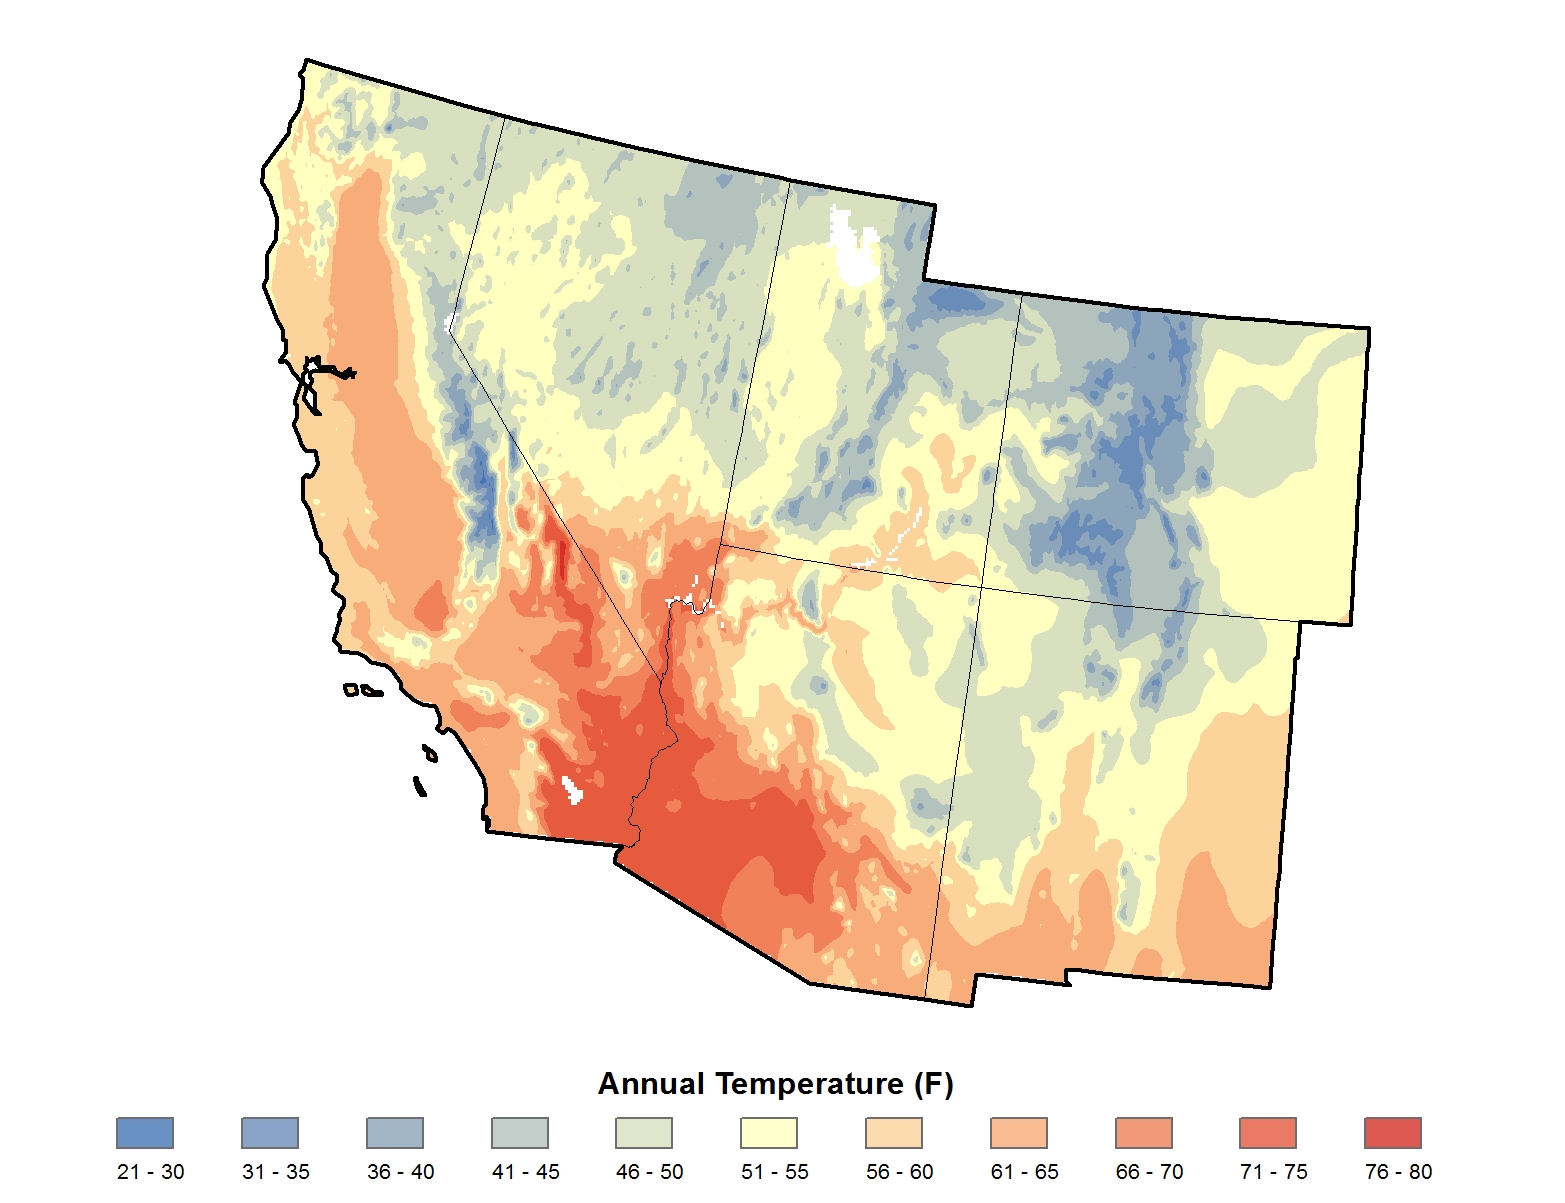 |
|
Average annual temperature |
Observed |
Temperature |
Northwest |
Regional Climate Trends and Scenarios for the U.S. National Climate Assessment. Part 6. Climate of the Northwest U.S. |
NCA 3 |
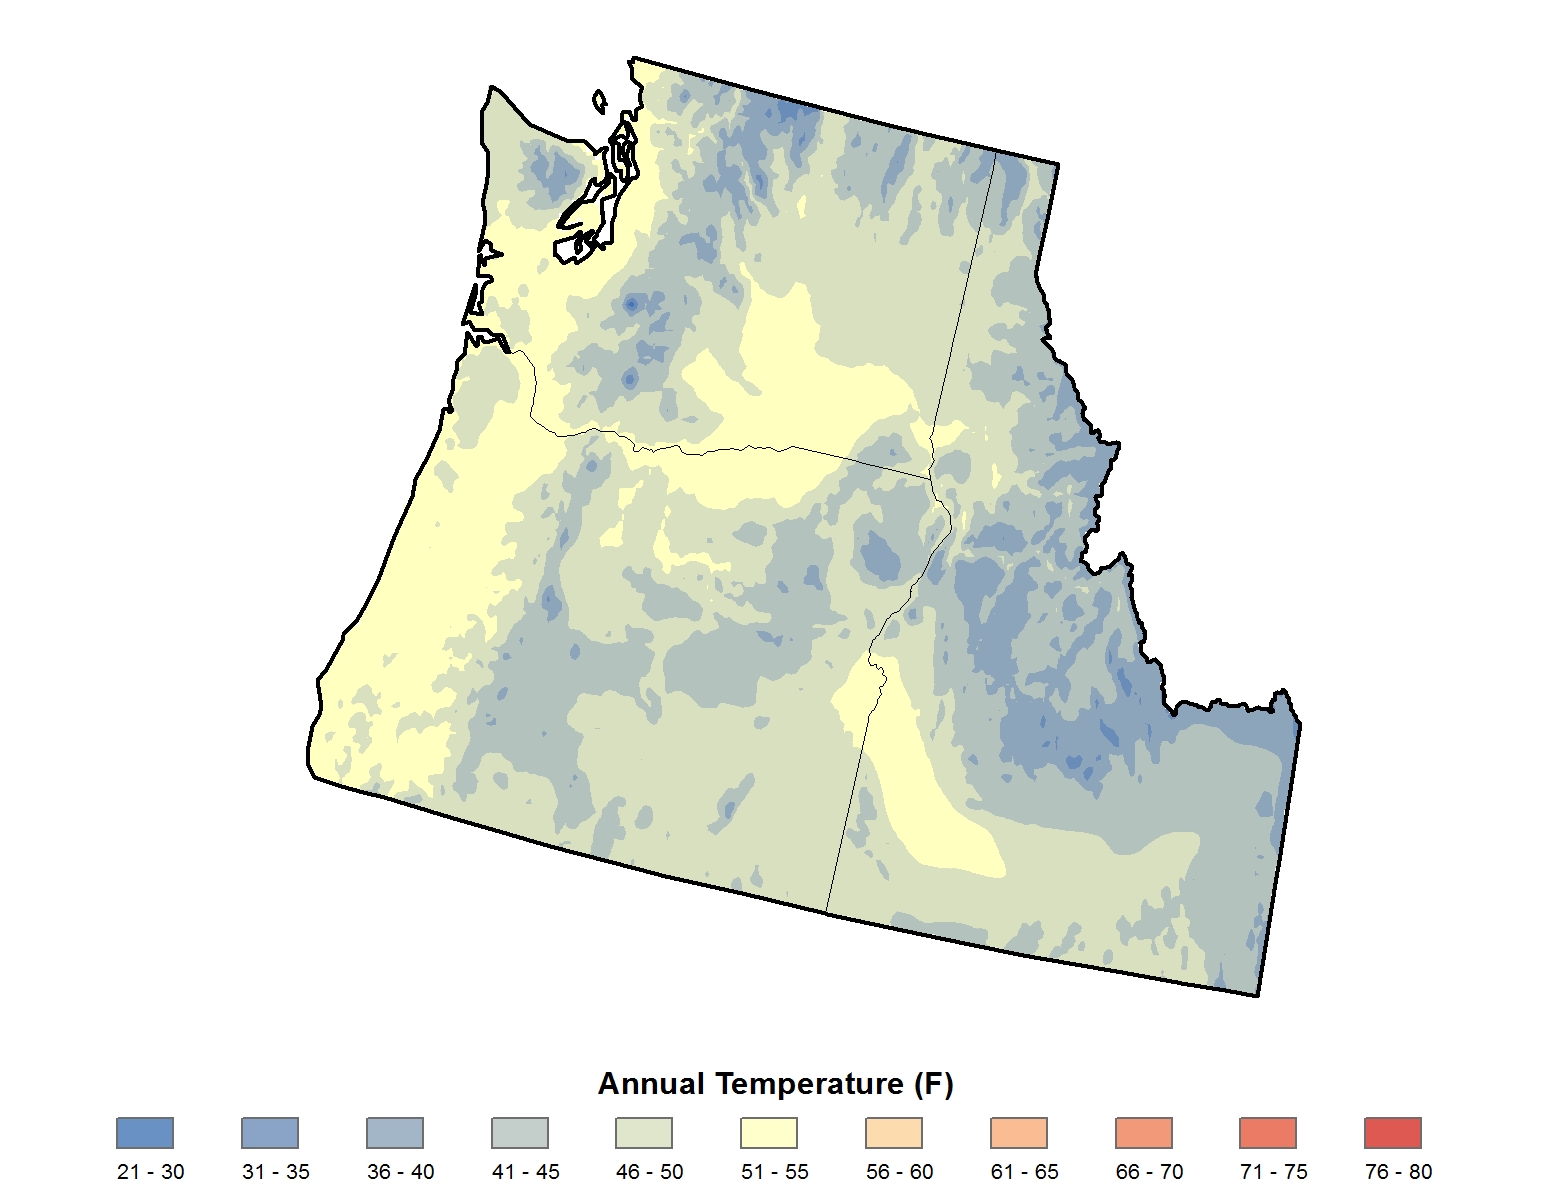 |
|
Average annual temperature |
Observed |
Temperature |
Midwest |
Regional Climate Trends and Scenarios for the U.S. National Climate Assessment. Part 3. Climate of the Midwest U.S. |
NCA 3 |
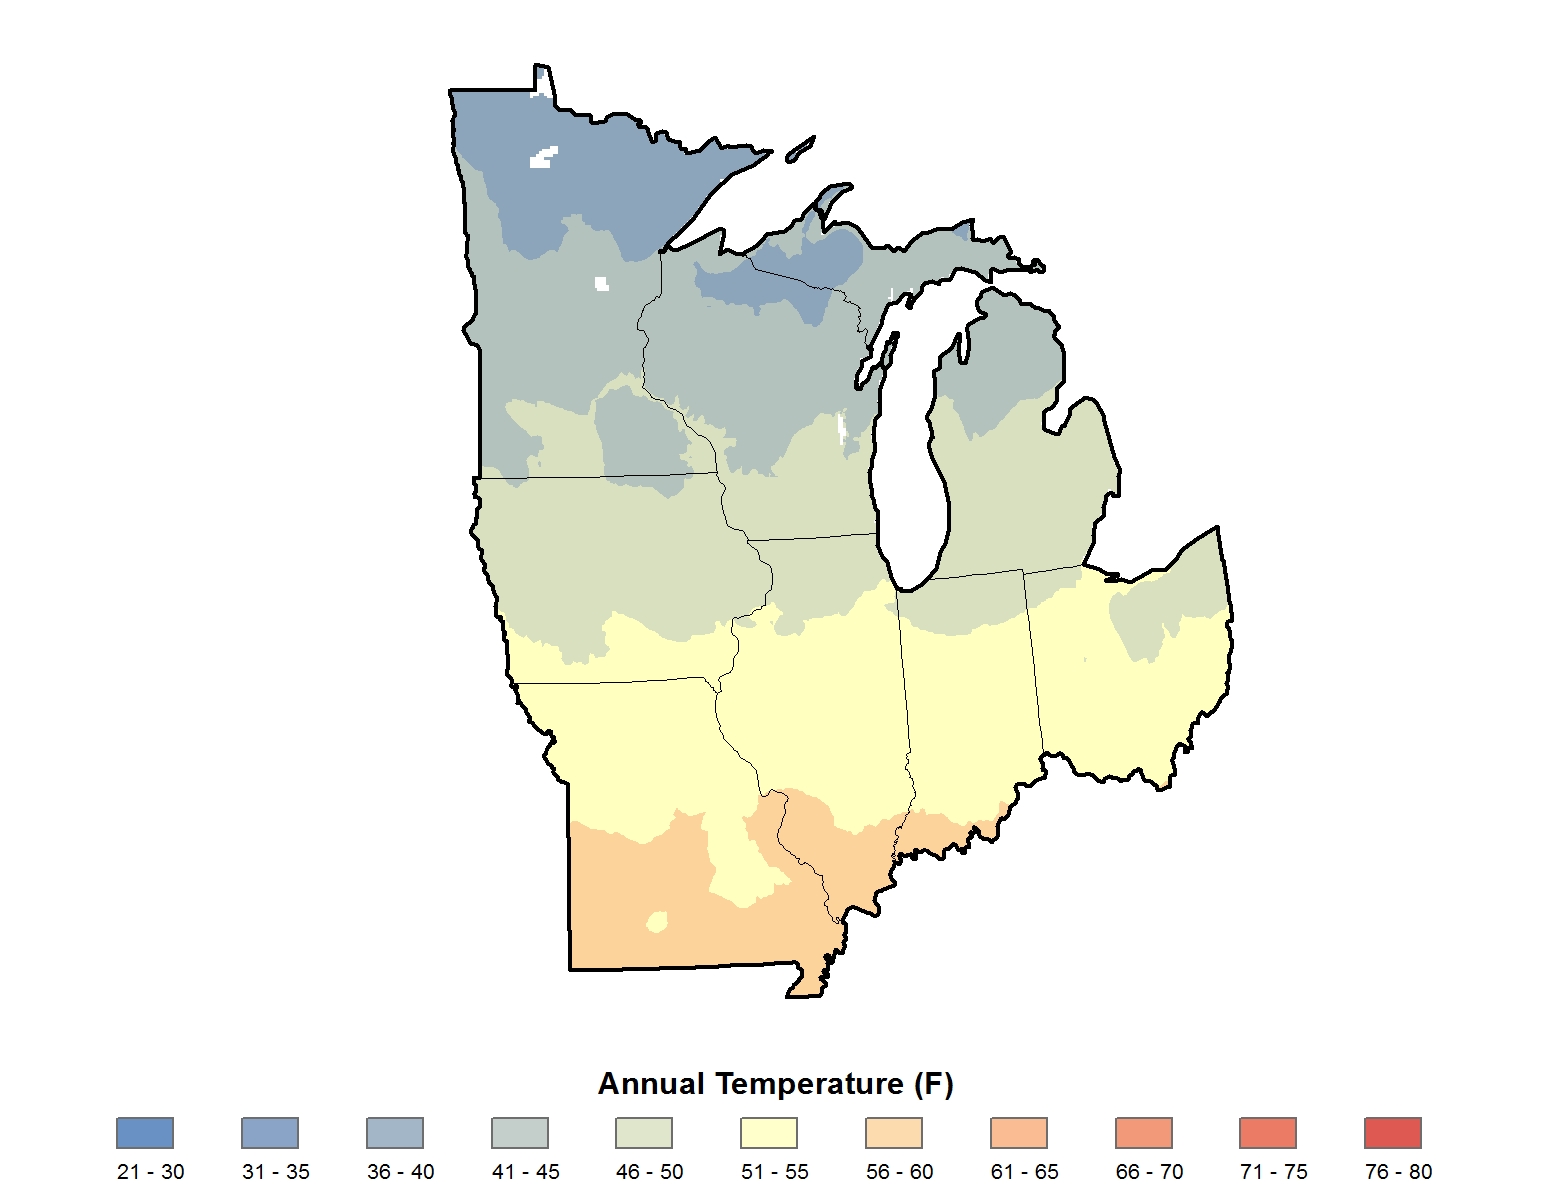 |
|
Average annual snowfall for the Midwest region |
Observed |
Snow |
Midwest |
Regional Climate Trends and Scenarios for the U.S. National Climate Assessment. Part 3. Climate of the Midwest U.S. |
NCA 3 |
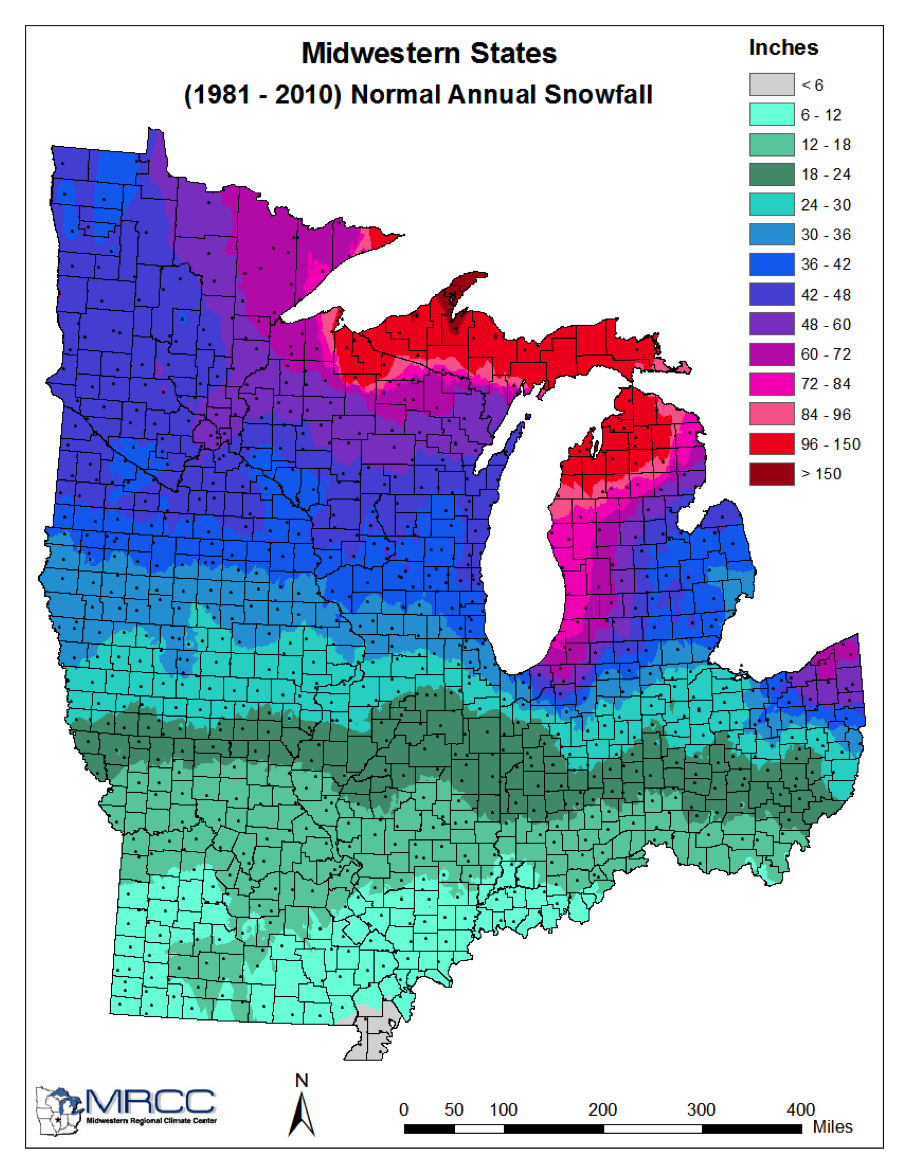 |
|
Average annual precipitation |
Observed |
Precipitation |
National |
Regional Climate Trends and Scenarios for the U.S. National Climate Assessment. Part 9. Climate of the Contiguous United States |
NCA 3 |
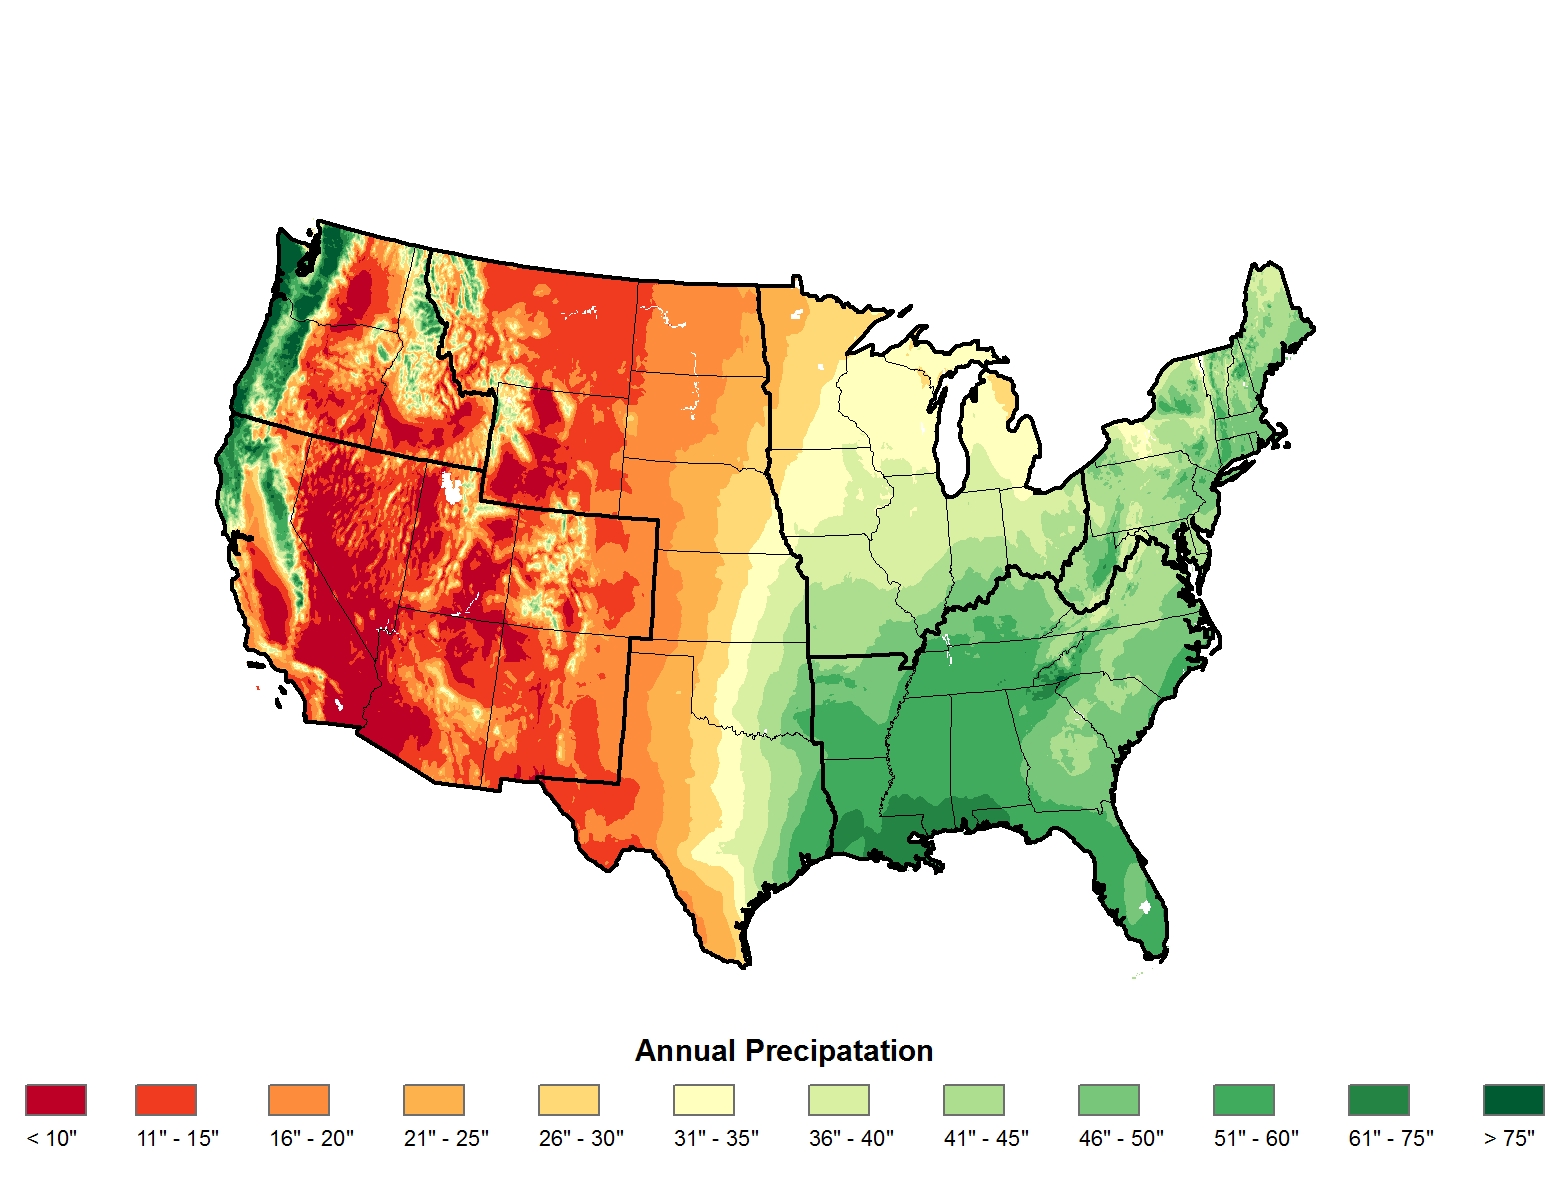 |
|
Average annual precipitation |
Observed |
Precipitation |
Great Plains |
Regional Climate Trends and Scenarios for the U.S. National Climate Assessment. Part 4. Climate of the U.S. Great Plains |
NCA 3 |
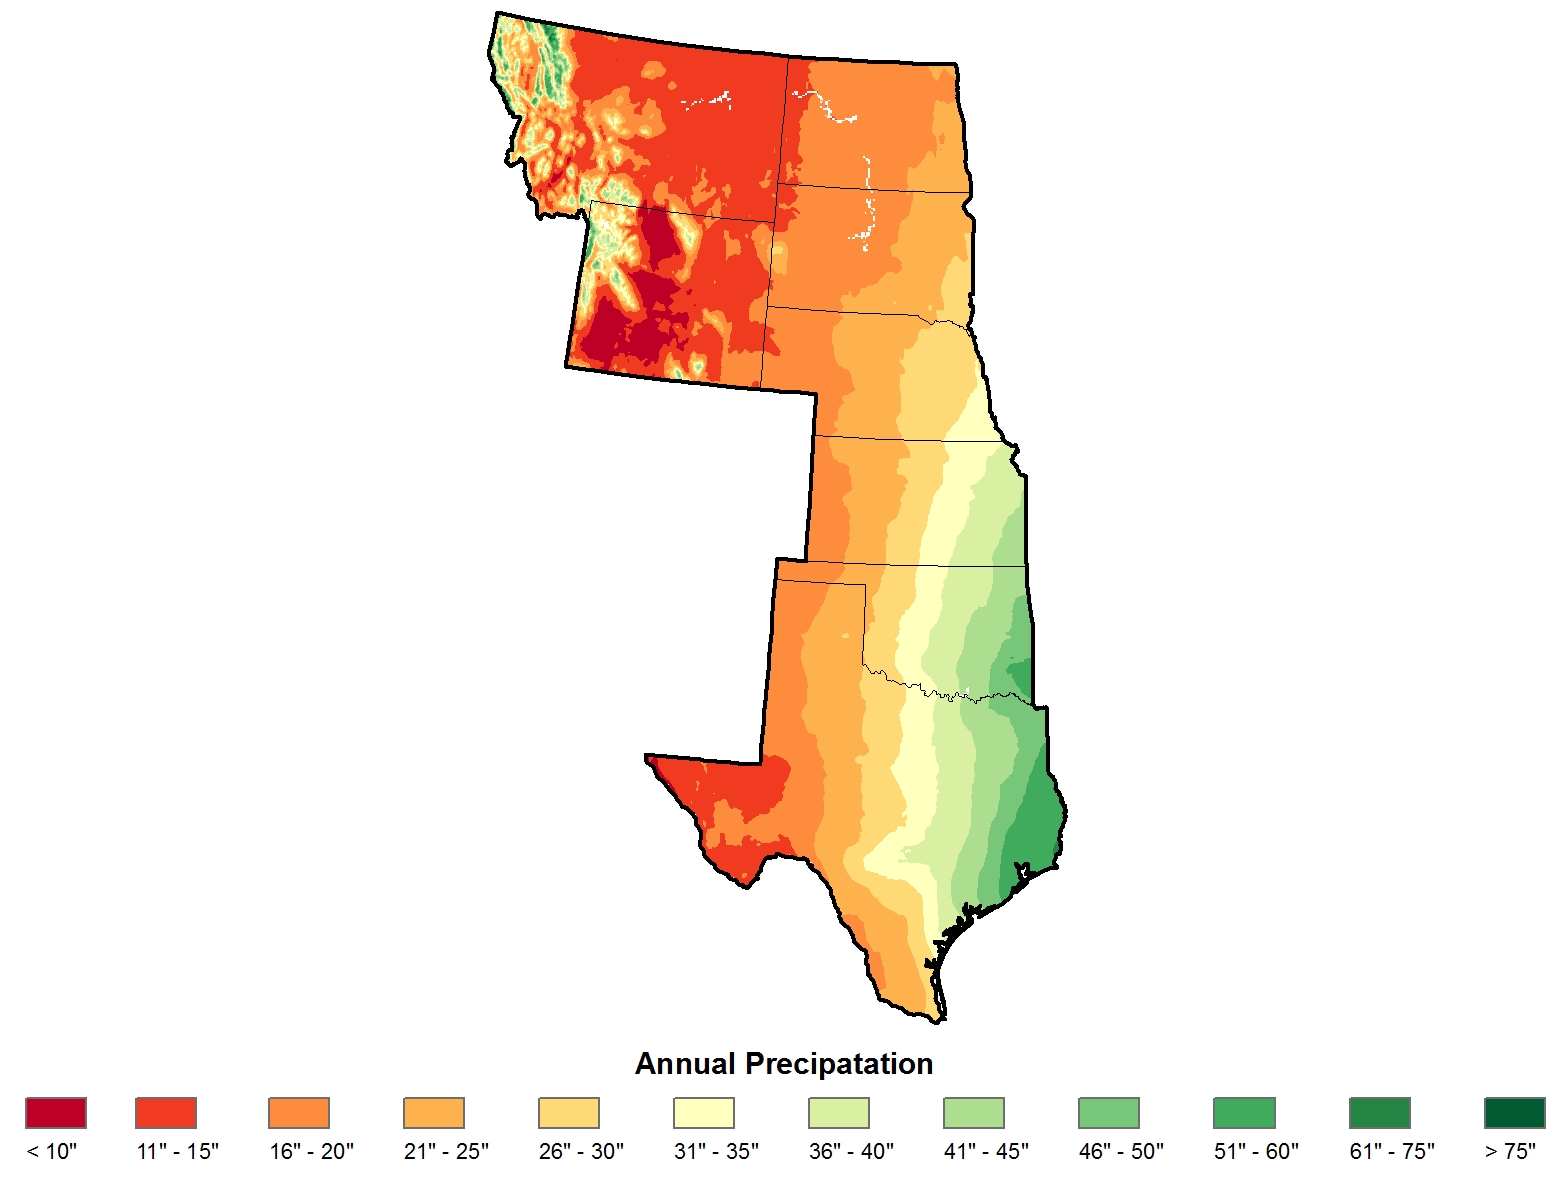 |
|
Average annual precipitation |
Observed |
Precipitation |
Northeast |
Regional Climate Trends and Scenarios for the U.S. National Climate Assessment. Part 1. Climate of the Northeast U.S. |
NCA 3 |
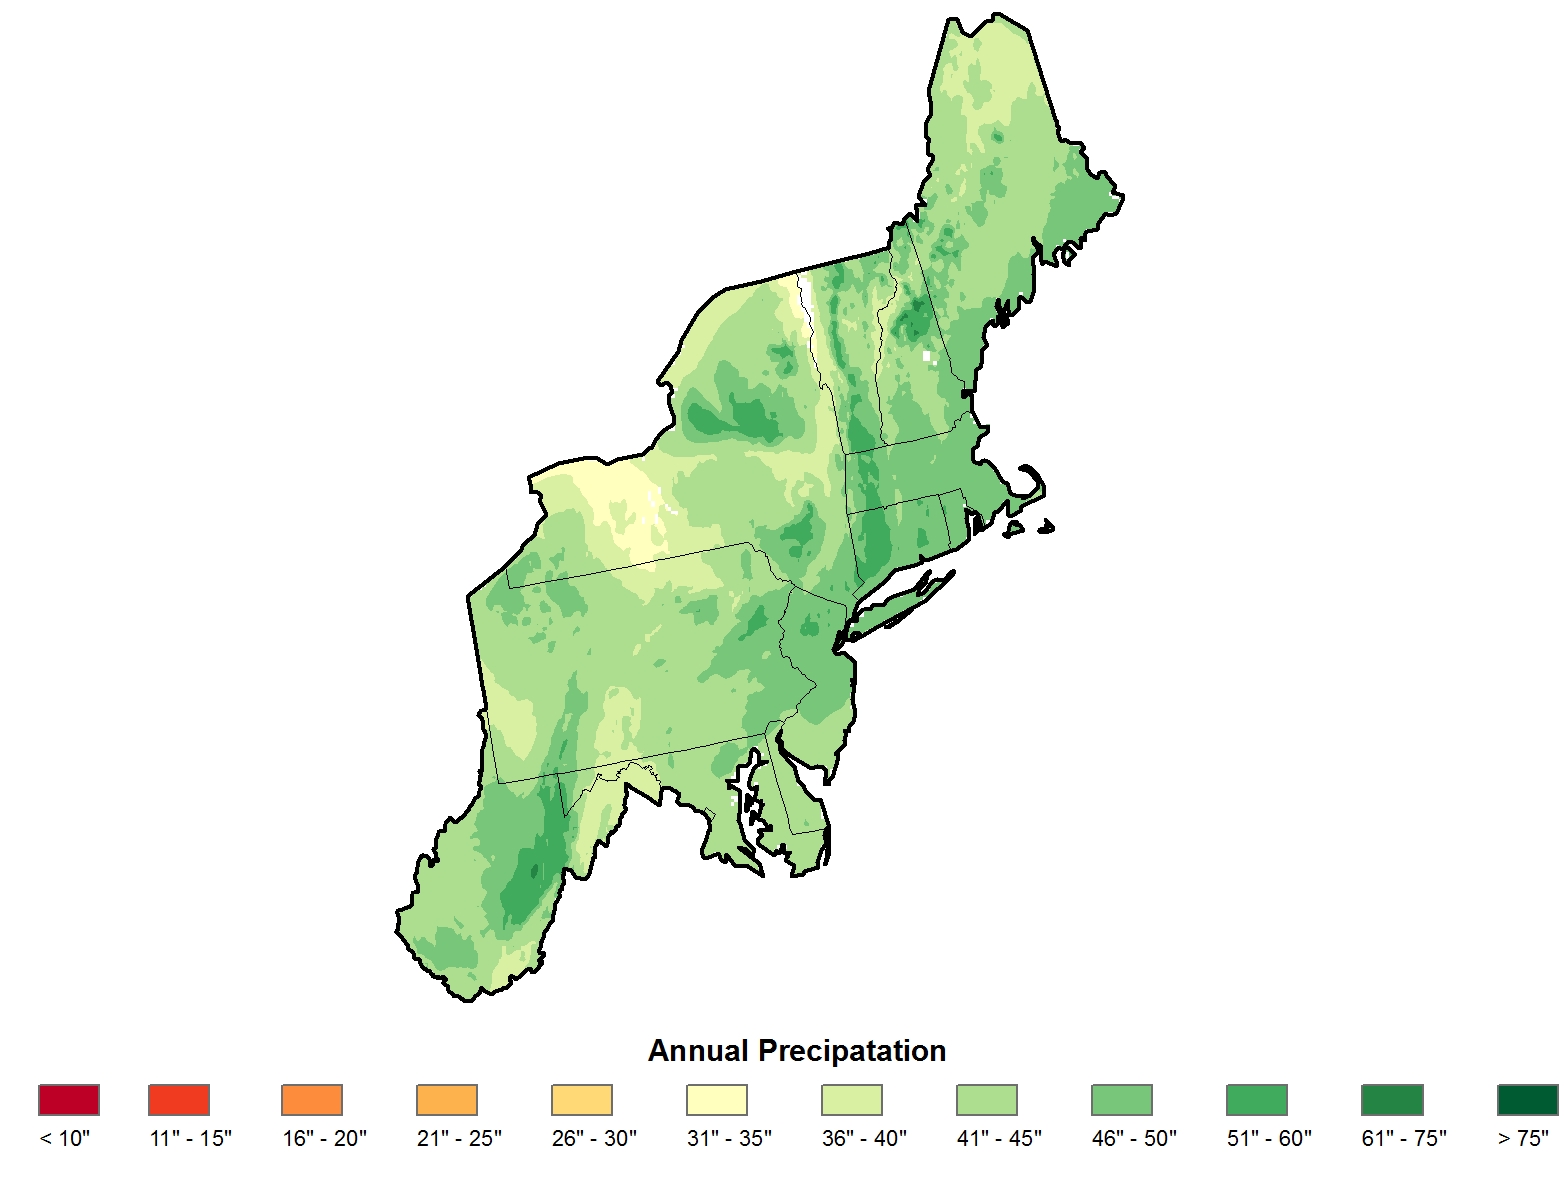 |
|
Average annual precipitation |
Observed |
Precipitation |
Midwest |
Regional Climate Trends and Scenarios for the U.S. National Climate Assessment. Part 3. Climate of the Midwest U.S. |
NCA 3 |
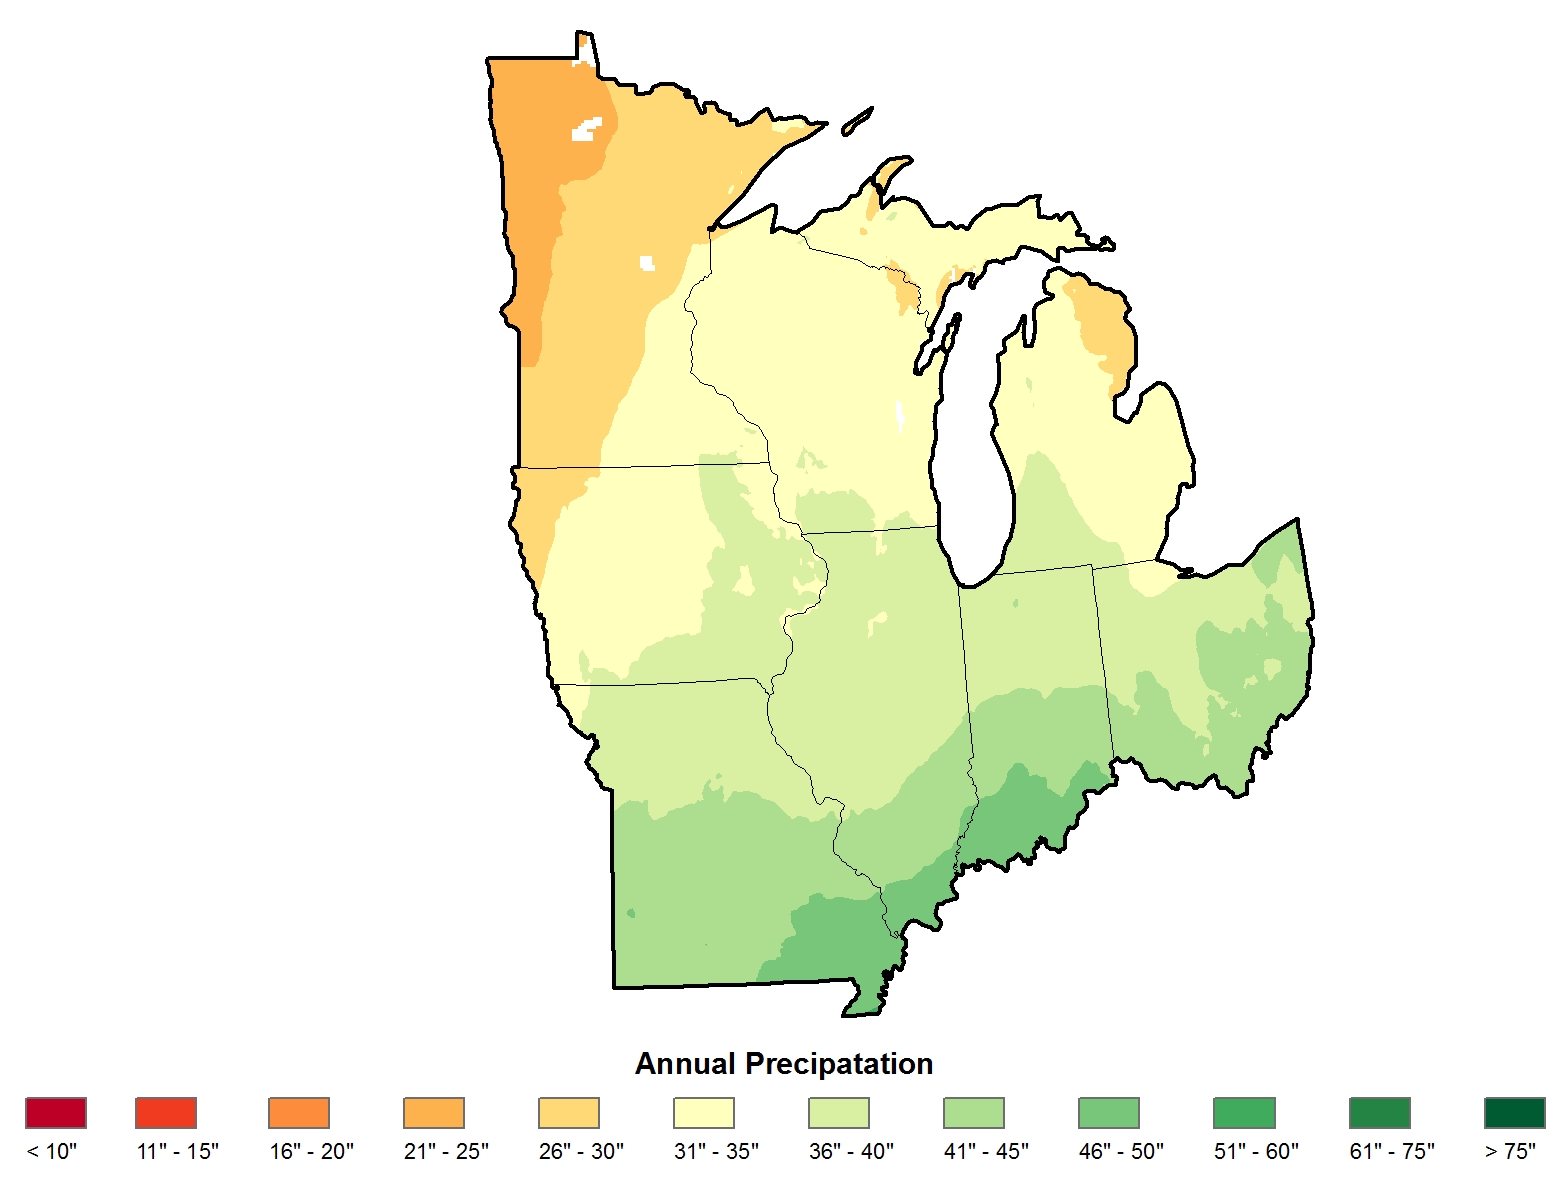 |
|
Average annual precipitation |
Observed |
Precipitation |
Southwest |
Regional Climate Trends and Scenarios for the U.S. National Climate Assessment. Part 5. Climate of the Southwest U.S. |
NCA 3 |
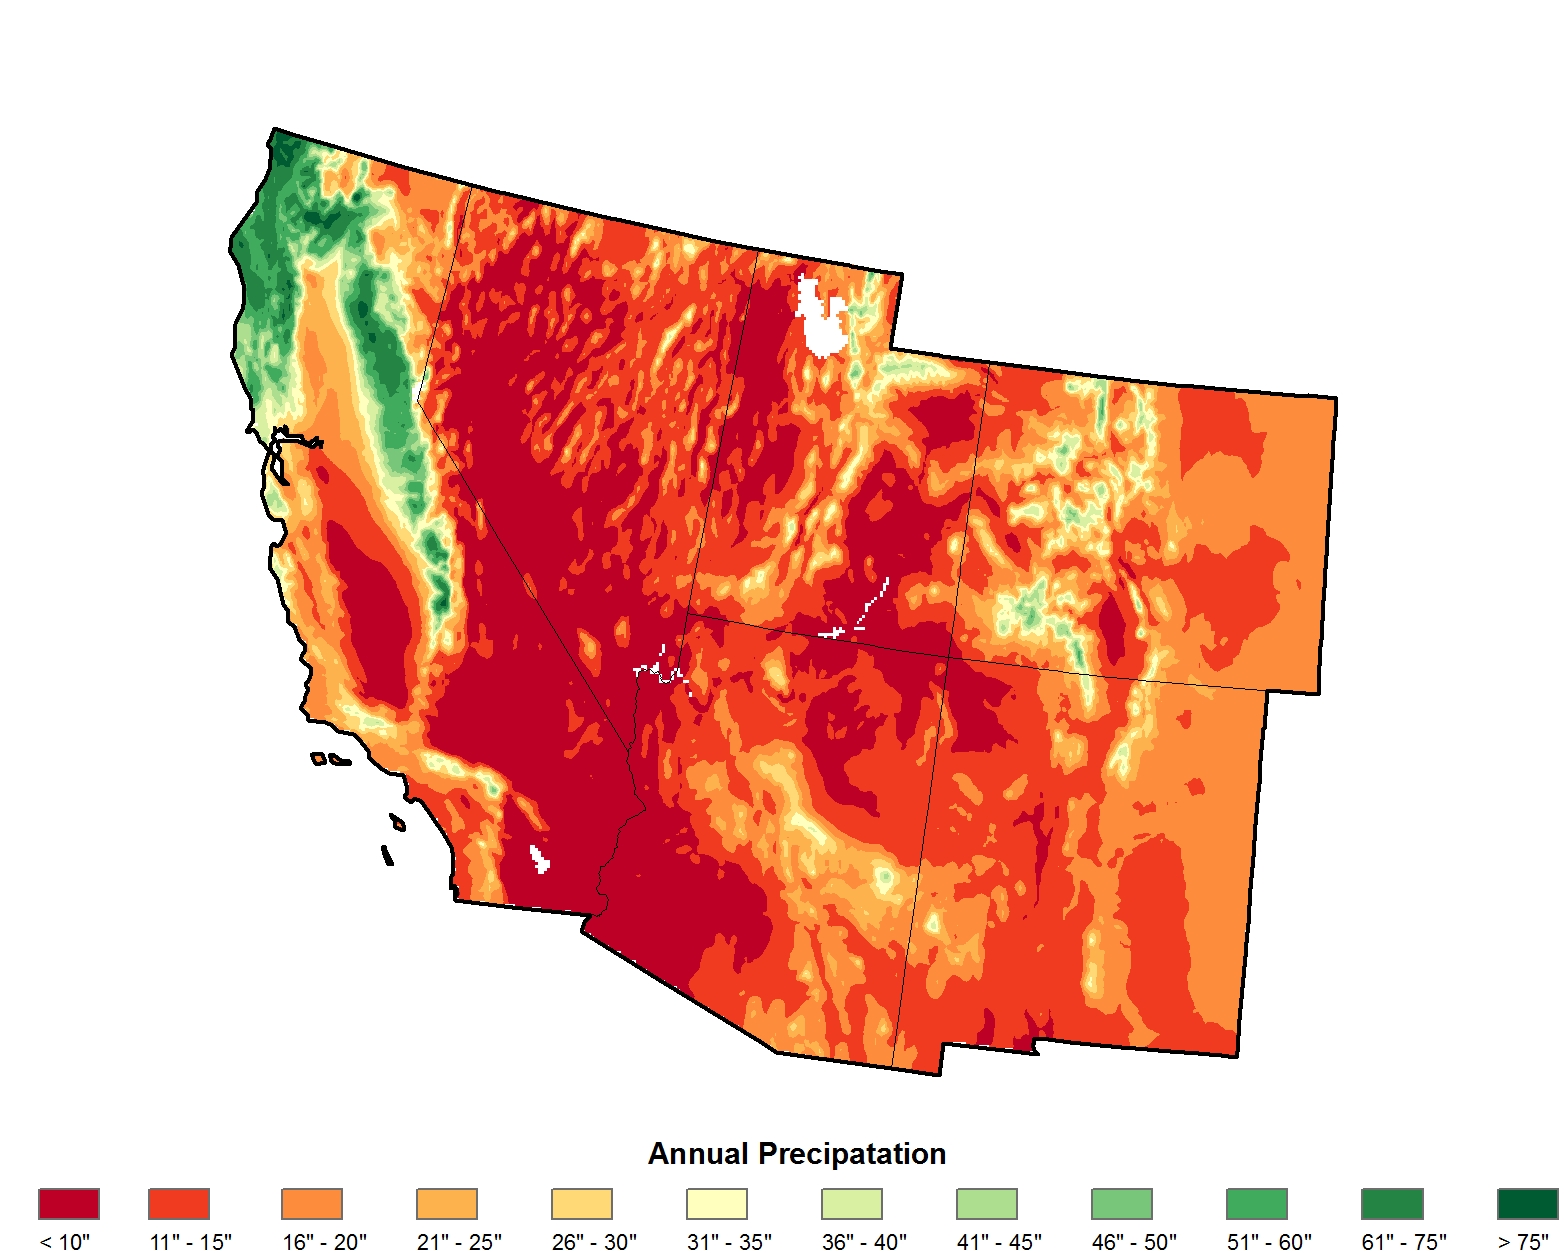 |
|
Average annual precipitation |
Observed |
Precipitation |
Northwest |
Regional Climate Trends and Scenarios for the U.S. National Climate Assessment. Part 6. Climate of the Northwest U.S. |
NCA 3 |
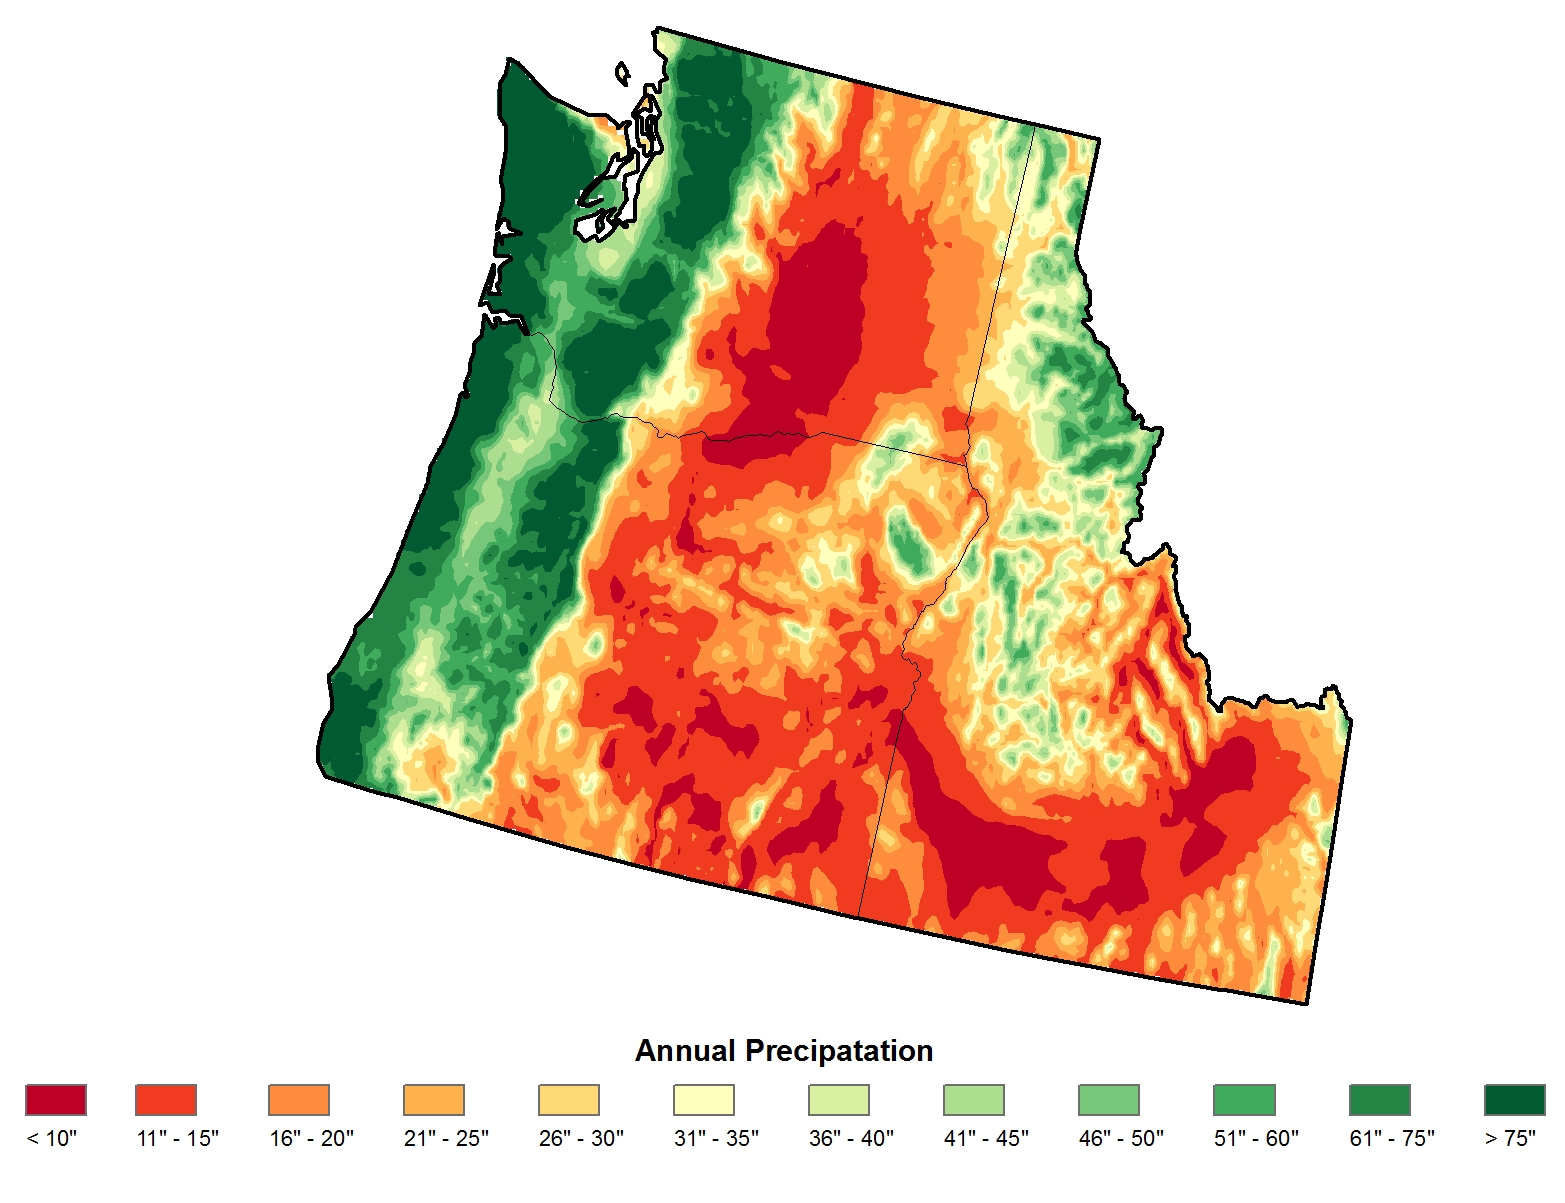 |
|
Average annual number of snowstorms for the Midwest region |
Observed |
Snow |
Midwest |
Regional Climate Trends and Scenarios for the U.S. National Climate Assessment. Part 3. Climate of the Midwest U.S. |
NCA 3 |
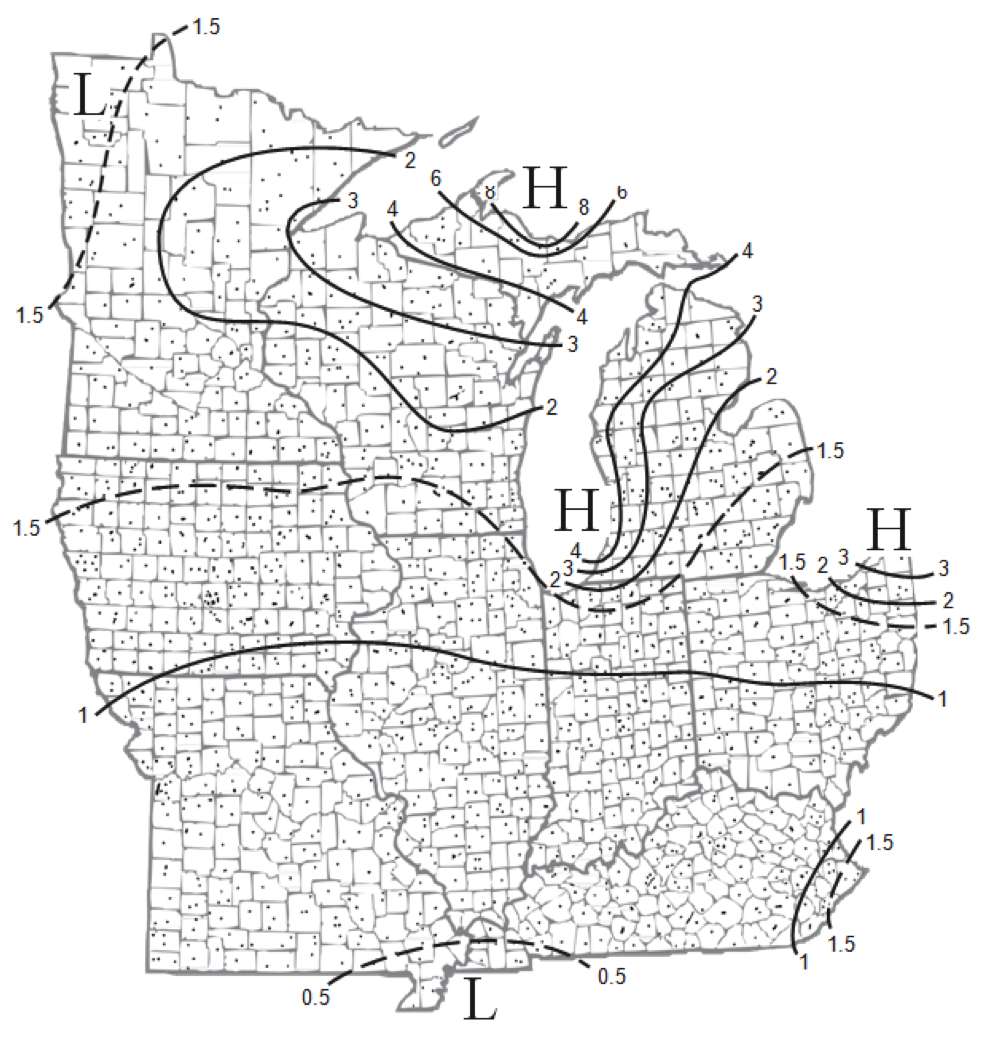 |
|
Average annual number of days with freezing rain for the Midwest region |
Observed |
Precipitation |
Midwest |
Regional Climate Trends and Scenarios for the U.S. National Climate Assessment. Part 3. Climate of the Midwest U.S. |
NCA 3 |
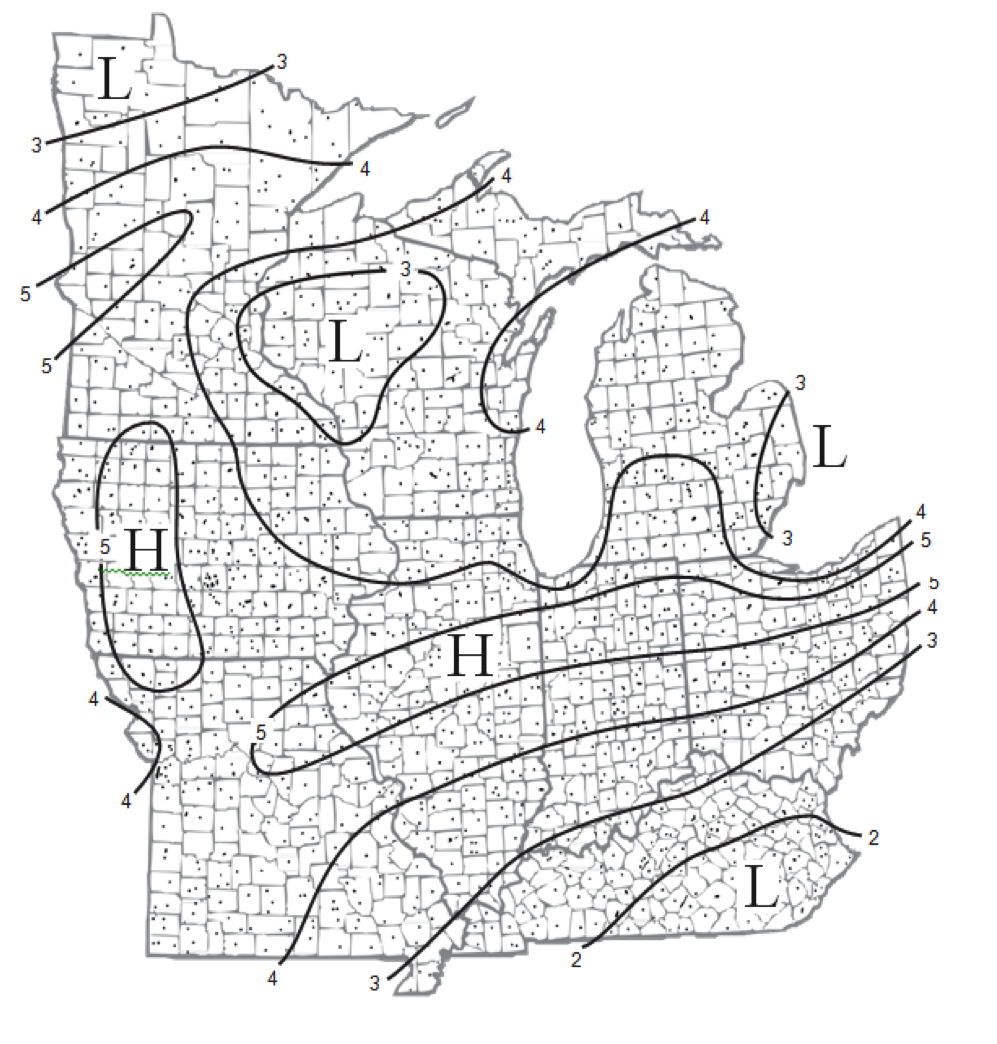 |
|
Annual water year precipitation for the six Southwest states |
Observed |
Precipitation |
Southwest |
Regional Climate Trends and Scenarios for the U.S. National Climate Assessment. Part 5. Climate of the Southwest U.S. |
NCA 3 |
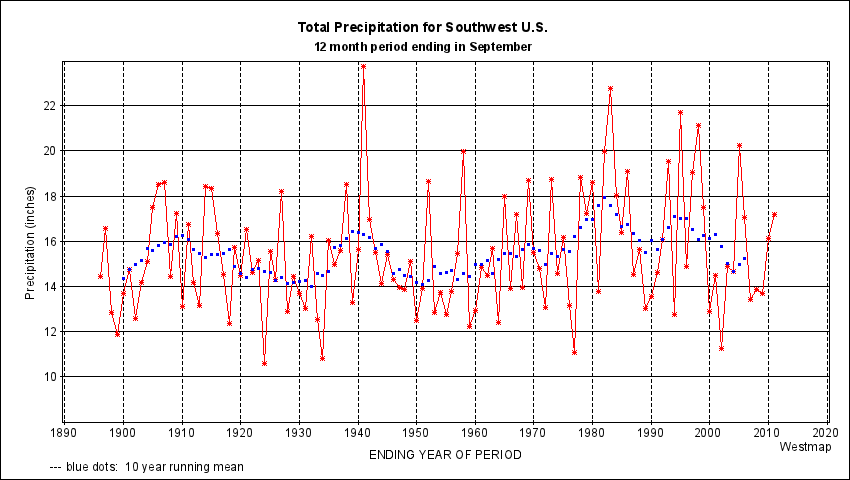 |
|
Annual time series of the Hawaii Rainfall Index |
Observed |
Precipitation |
Hawaii and Pacific Islands |
Regional Climate Trends and Scenarios for the U.S. National Climate Assessment. Part 8. Climate of the Pacific Islands |
NCA 3 |
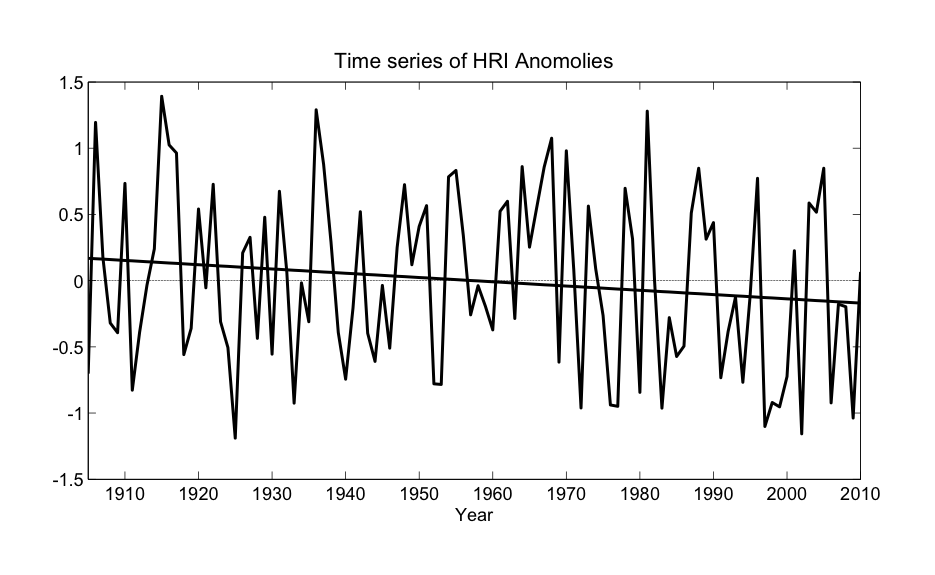 |
|
Annual temperature trends at six climate divisions in the Southeast region |
Observed |
Temperature |
Southeast and Caribbean |
Regional Climate Trends and Scenarios for the U.S. National Climate Assessment. Part 2. Climate of the Southeast U.S. |
NCA 3 |
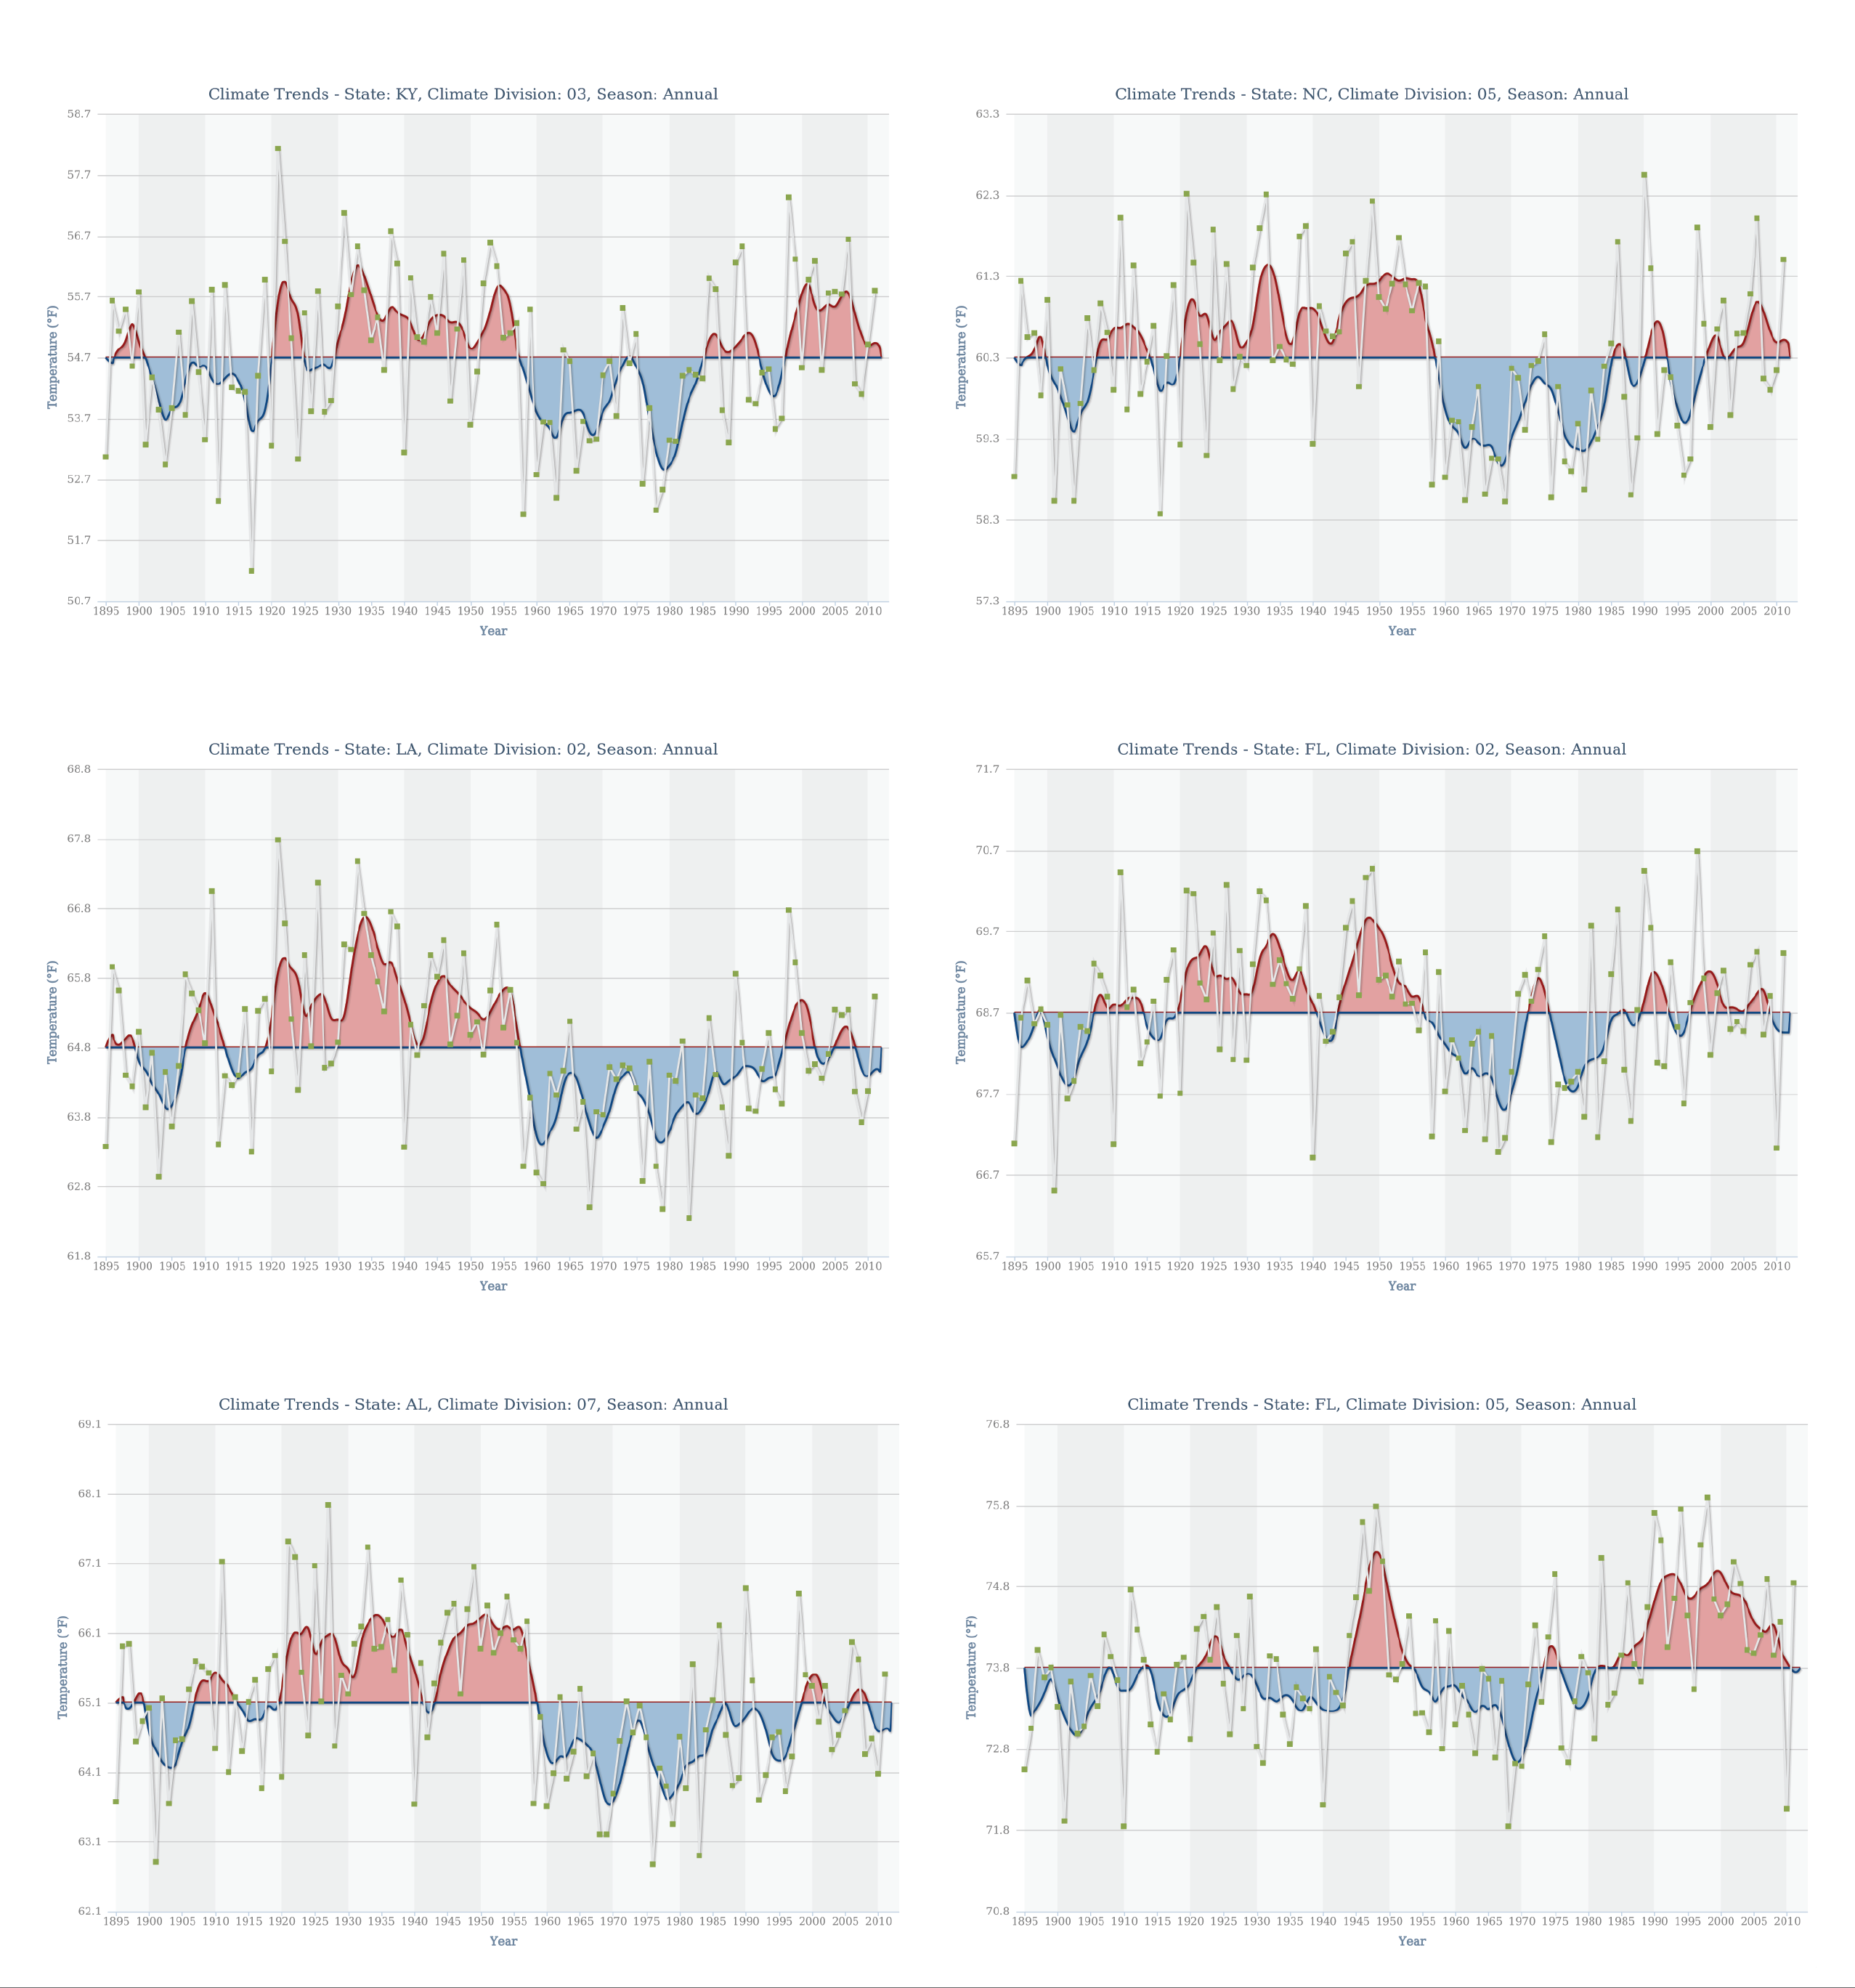 |
|
Annual temperature departure from the long-term mean |
Observed |
Temperature |
Alaska and Arctic |
Regional Climate Trends and Scenarios for the U.S. National Climate Assessment. Part 7. Climate of Alaska |
NCA 3 |
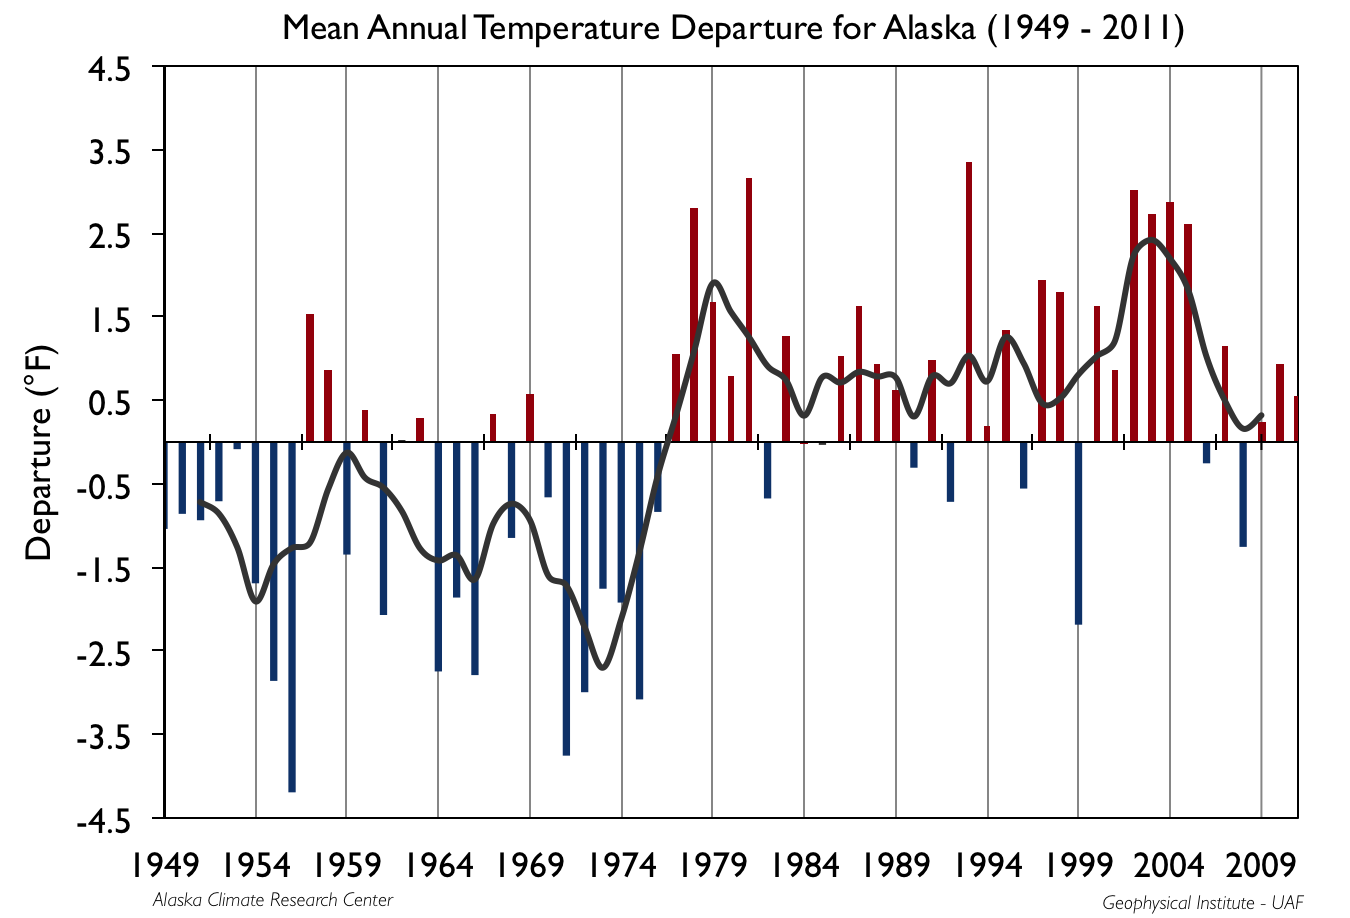 |
|
Annual temperature anomalies for the Midwest region |
Observed |
Temperature |
Midwest |
Regional Climate Trends and Scenarios for the U.S. National Climate Assessment. Part 3. Climate of the Midwest U.S. |
NCA 3 |
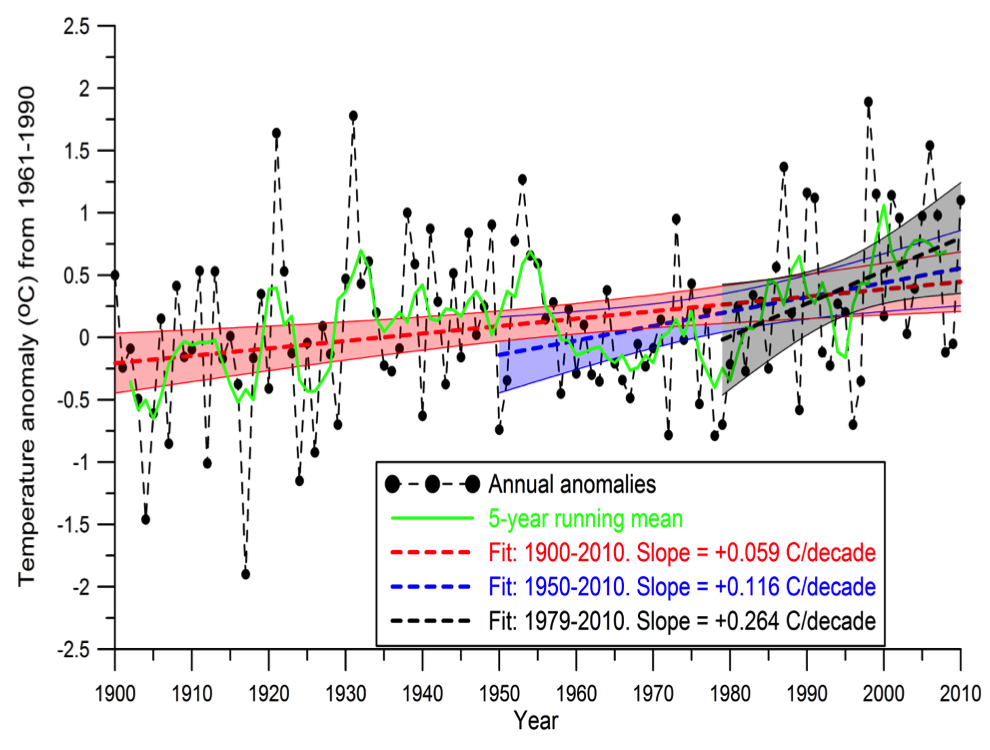 |
|
Annual rainfall in the Western North Pacific subregion |
Observed |
Precipitation |
Hawaii and Pacific Islands |
Regional Climate Trends and Scenarios for the U.S. National Climate Assessment. Part 8. Climate of the Pacific Islands |
NCA 3 |
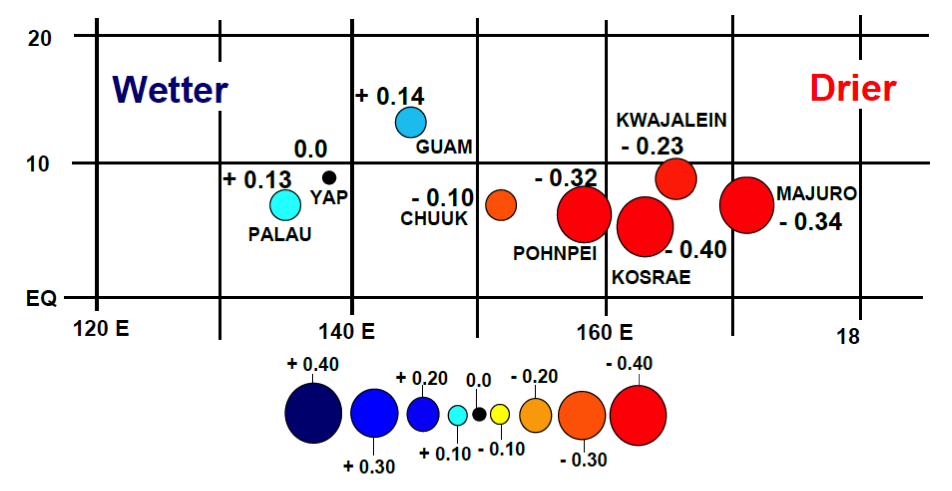 |
|
Annual precipitation trends at six climate divisions in the Southeast region. |
Observed |
Precipitation |
Southeast and Caribbean |
Regional Climate Trends and Scenarios for the U.S. National Climate Assessment. Part 2. Climate of the Southeast U.S. |
NCA 3 |
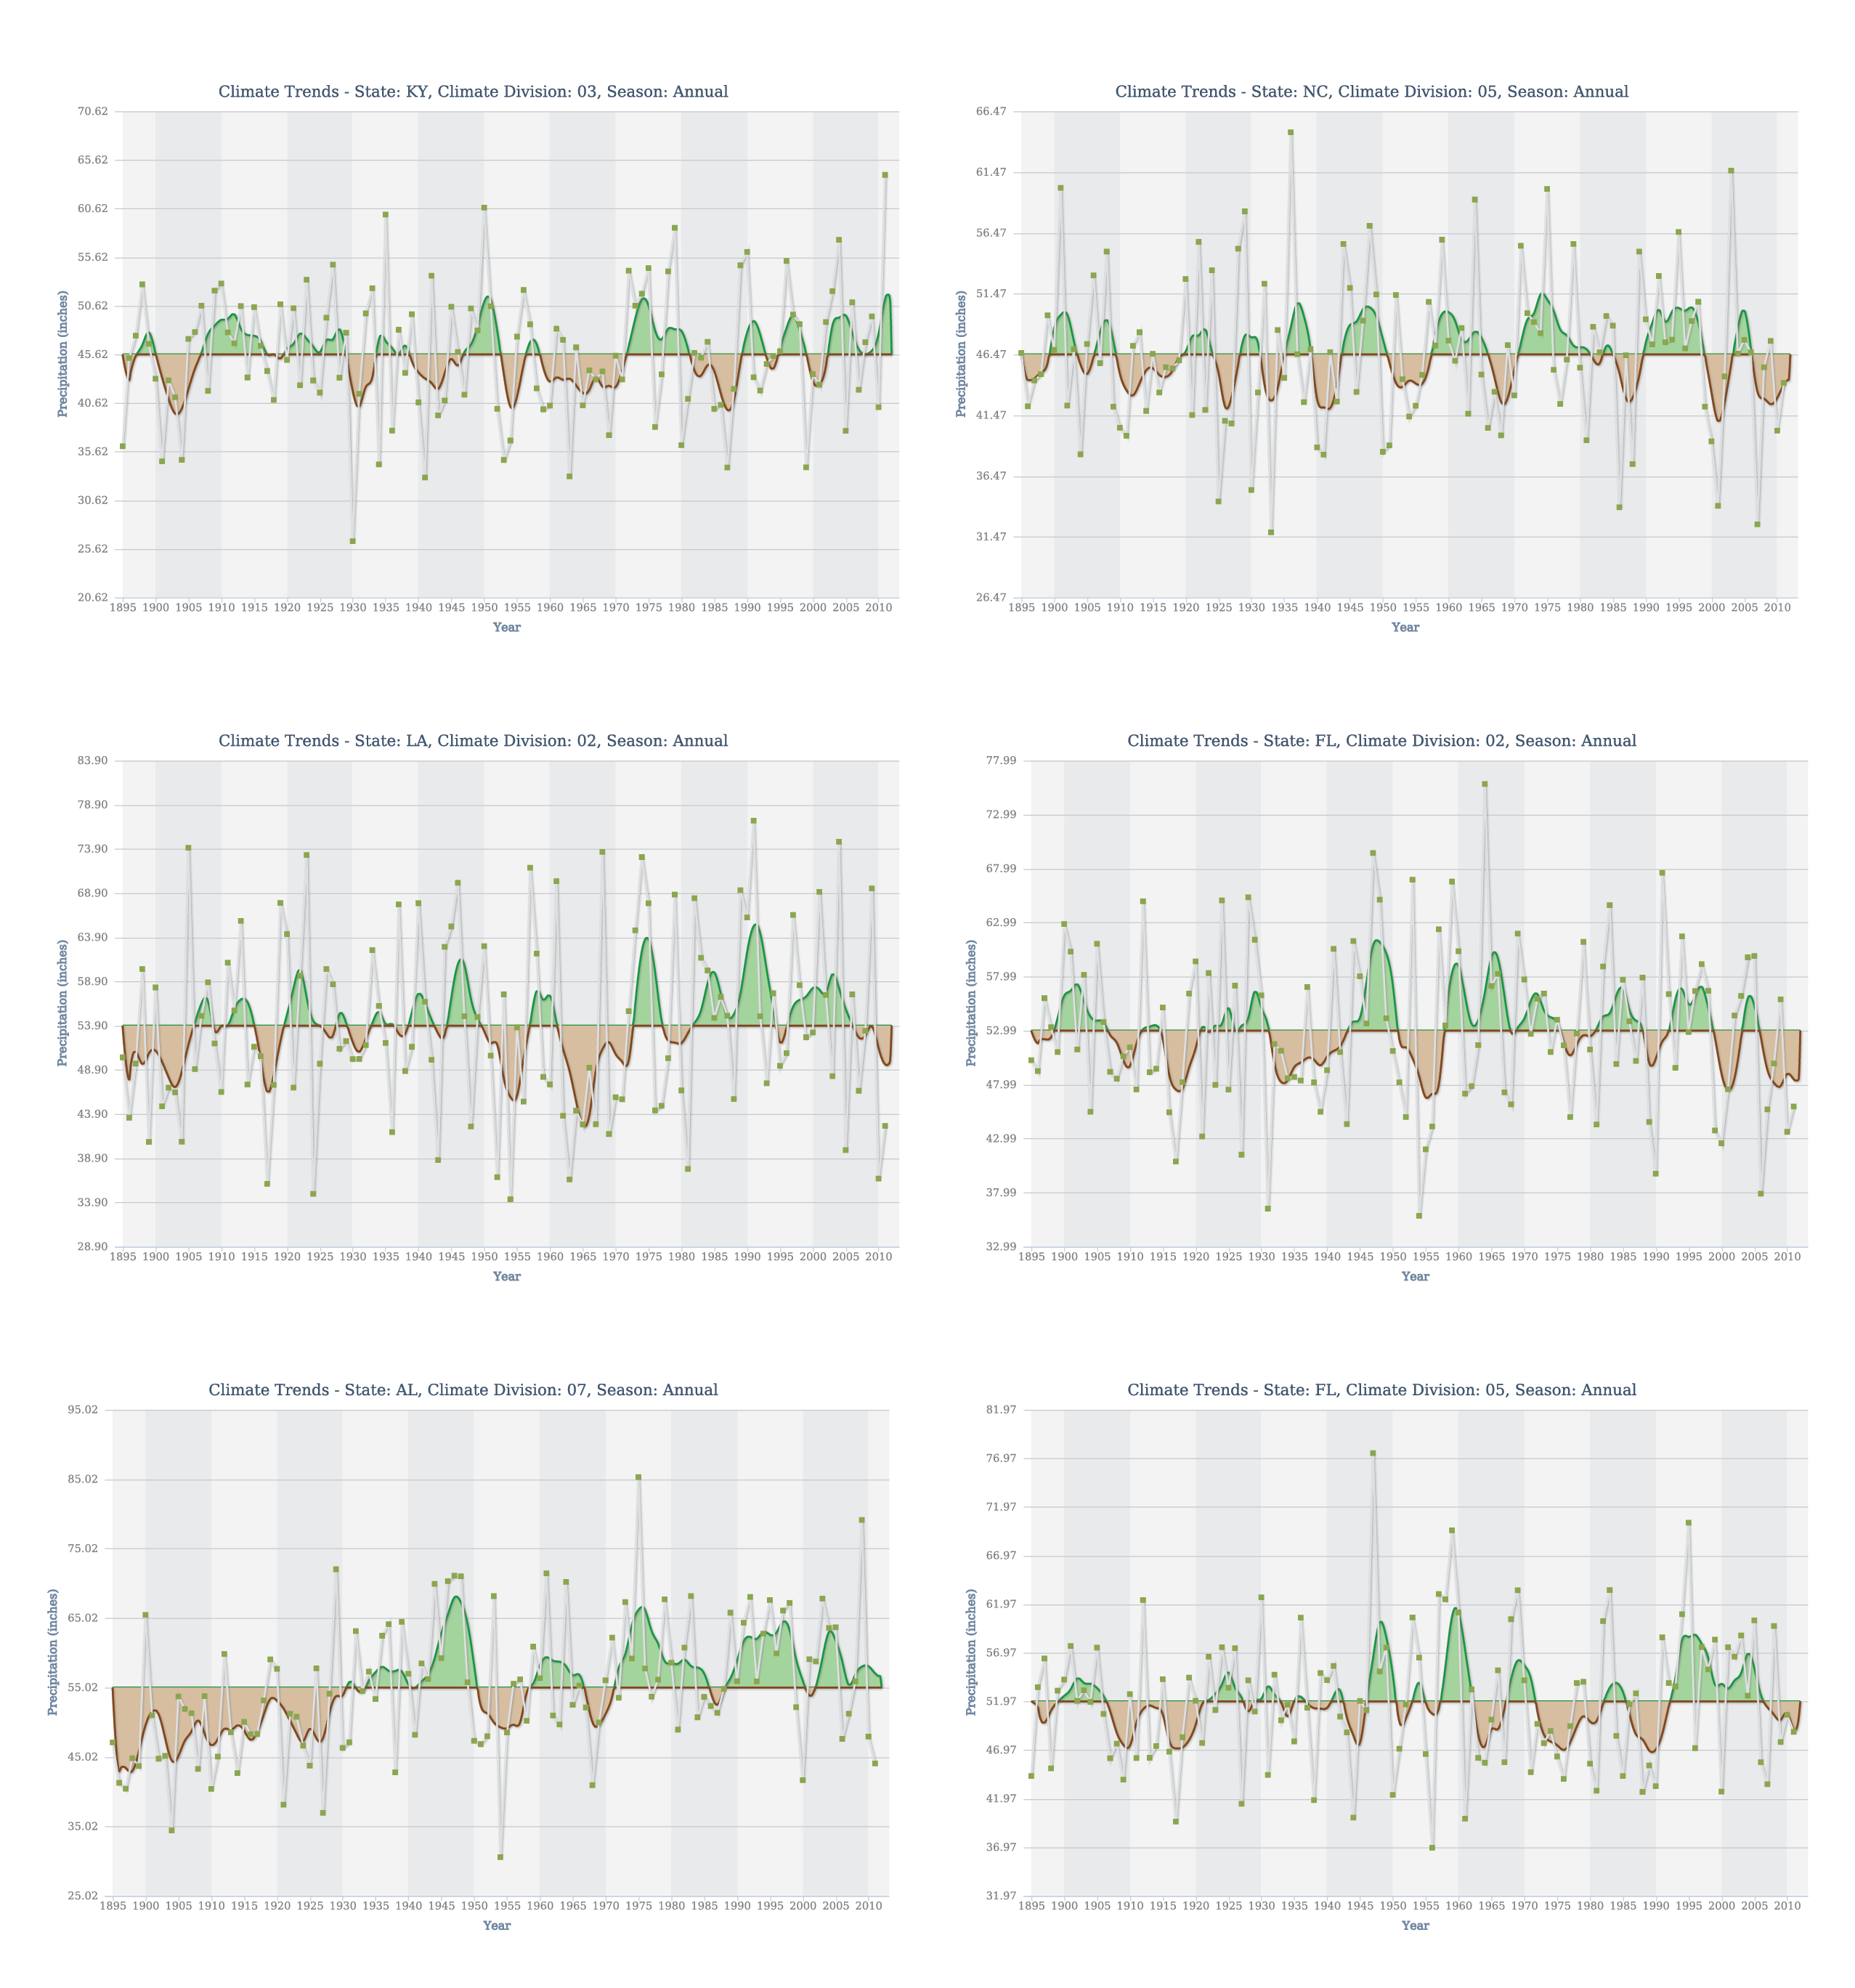 |
|
Annual peak streamflow of the Red River of the North, Fargo, ND |
Observed |
Rivers |
Great Plains |
Regional Climate Trends and Scenarios for the U.S. National Climate Assessment. Part 4. Climate of the U.S. Great Plains |
NCA 3 |
 |
|
Annual number of climate events causing at least $1 billion in losses in the United States |
Observed |
Disasters |
National |
Regional Climate Trends and Scenarios for the U.S. National Climate Assessment. Part 9. Climate of the Contiguous United States |
NCA 3 |
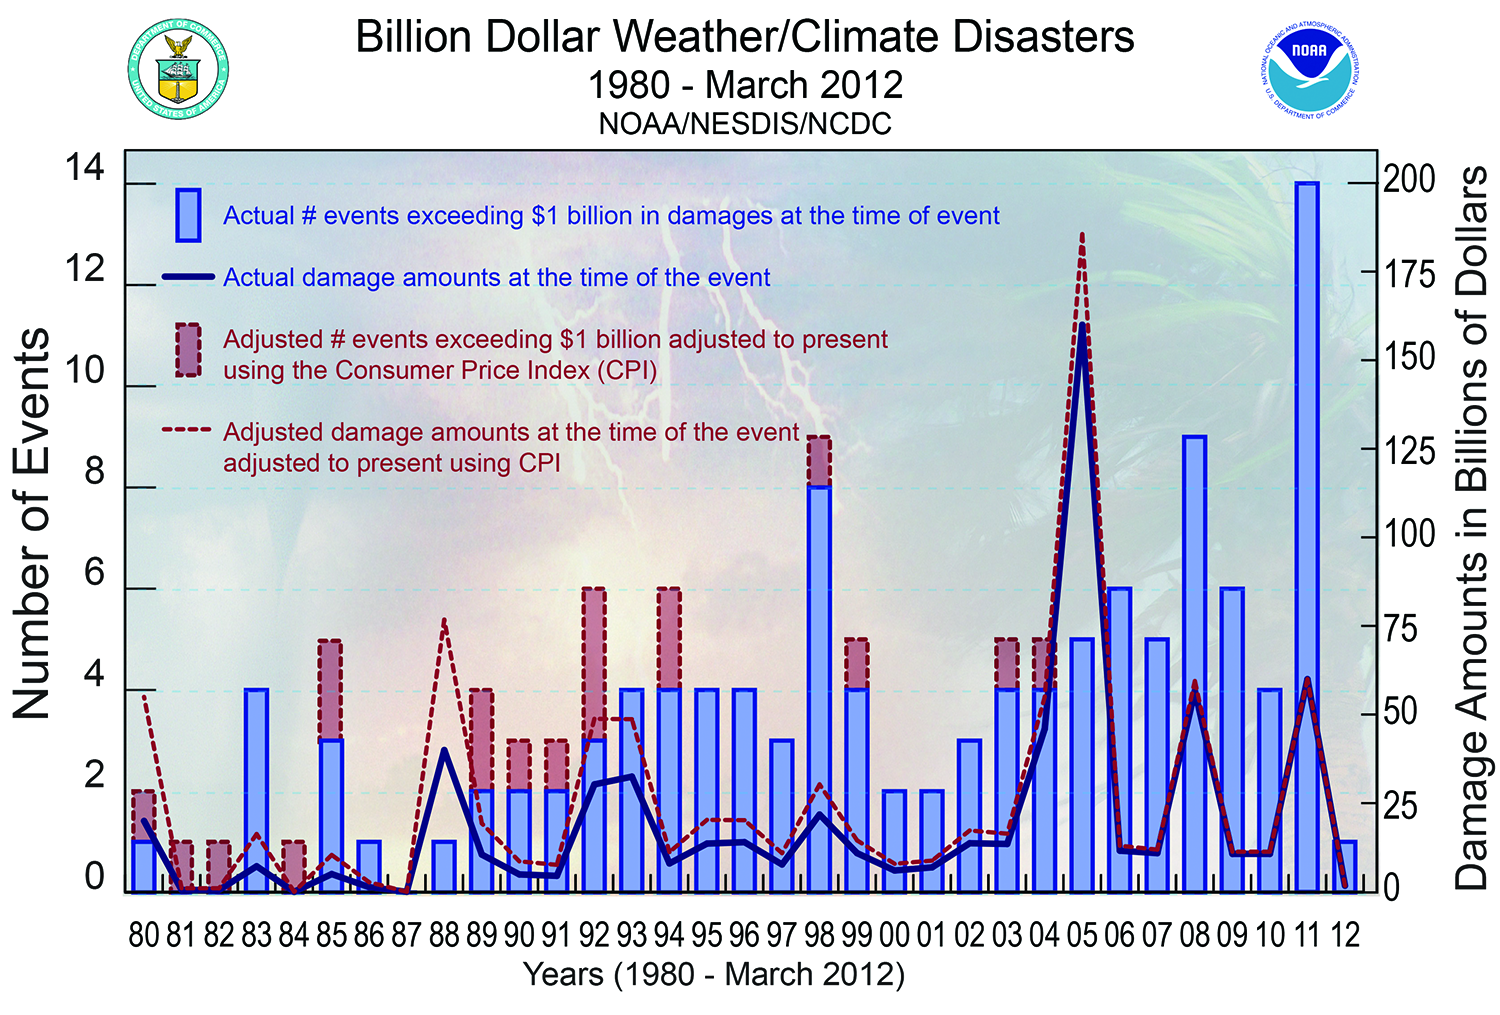 |
|
Annual mean wind speeds |
Observed |
Wind |
Midwest |
Regional Climate Trends and Scenarios for the U.S. National Climate Assessment. Part 3. Climate of the Midwest U.S. |
NCA 3 |
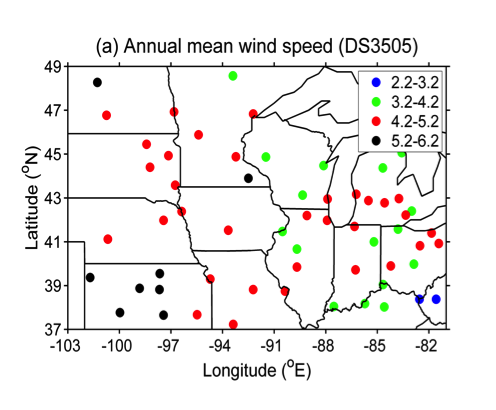 |
|
Annual mean sea level for gauges at four major Northeast coastal cities |
Observed |
Water Level |
Northeast |
Regional Climate Trends and Scenarios for the U.S. National Climate Assessment. Part 1. Climate of the Northeast U.S. |
NCA 3 |
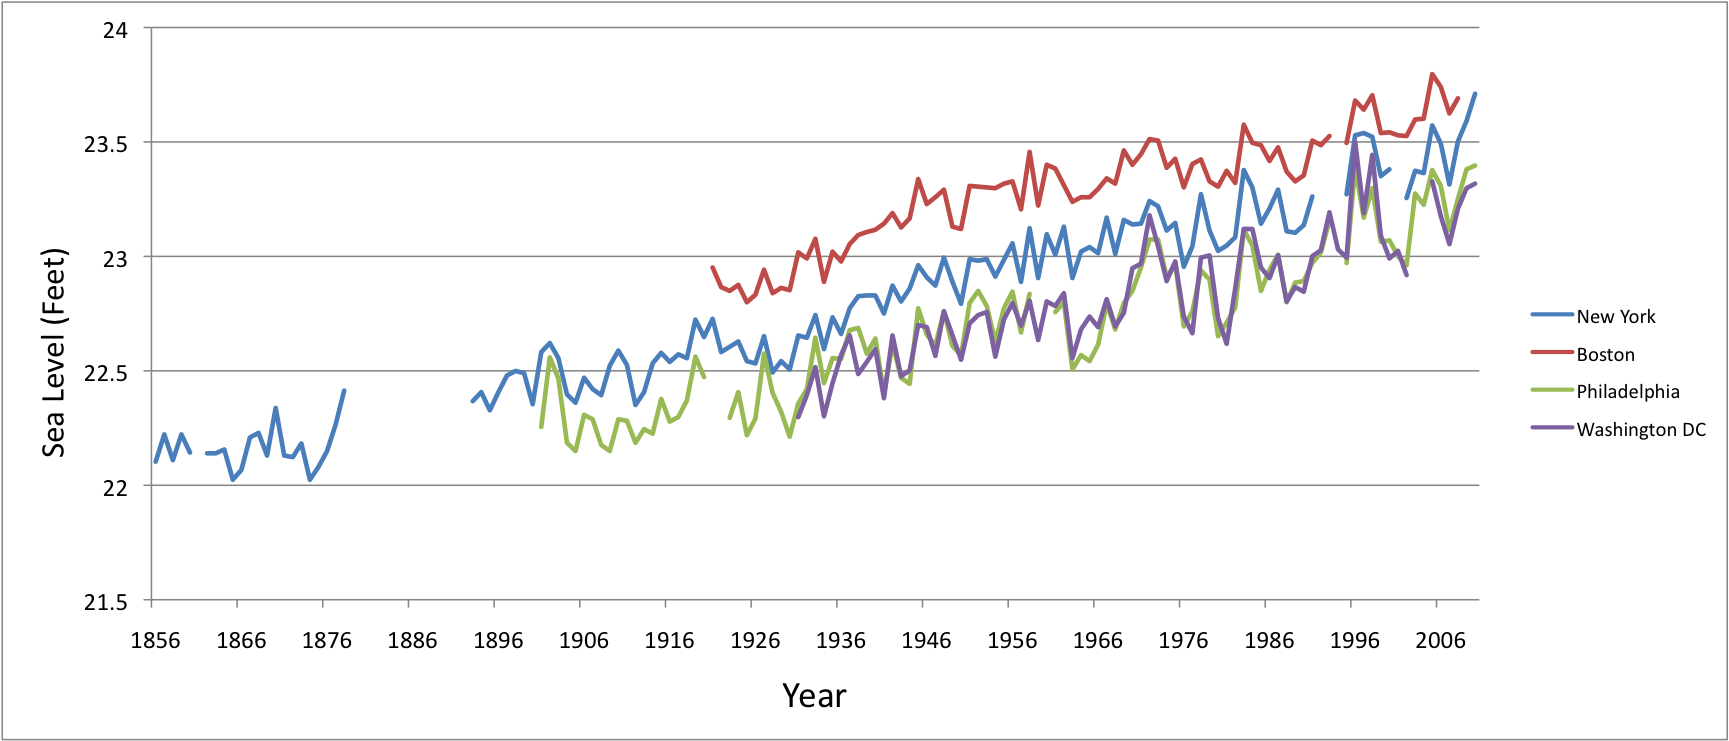 |
|
Annual mean maximum and minimum temperature for the six Southwest states |
Observed |
Temperature |
Southwest |
Regional Climate Trends and Scenarios for the U.S. National Climate Assessment. Part 5. Climate of the Southwest U.S. |
NCA 3 |
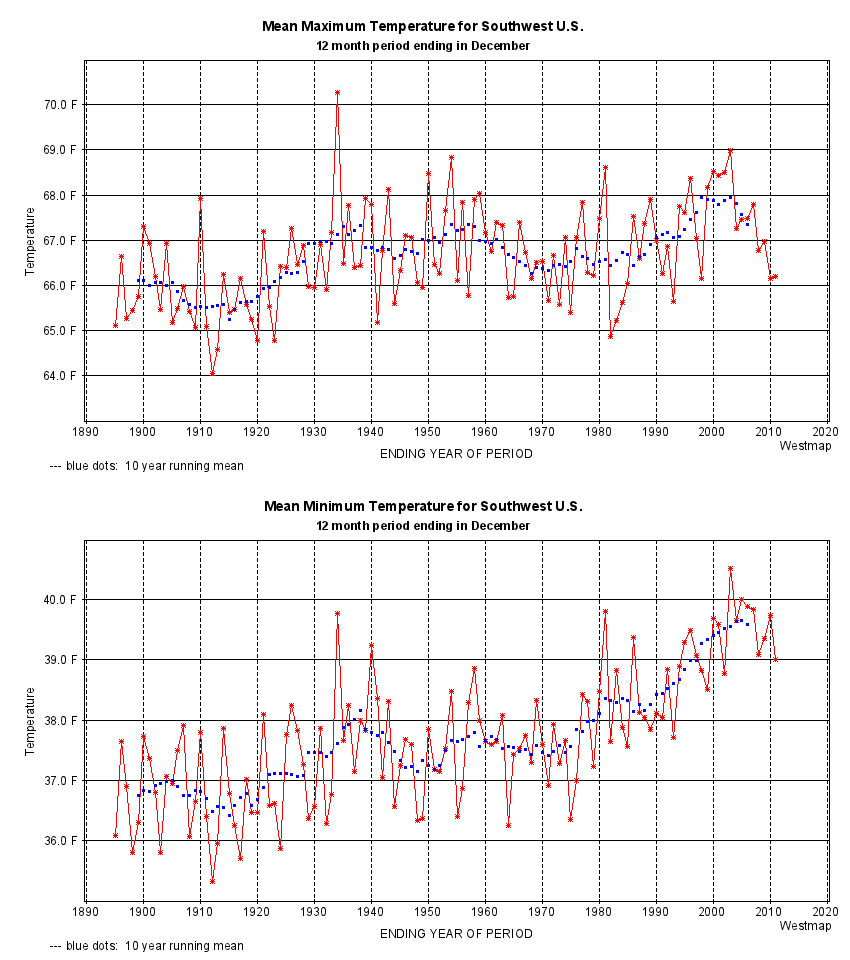 |
|
Annual mean ground temperatures at 1-meter depth |
Simulated |
Temperature |
Alaska and Arctic |
Regional Climate Trends and Scenarios for the U.S. National Climate Assessment. Part 7. Climate of Alaska |
NCA 3 |
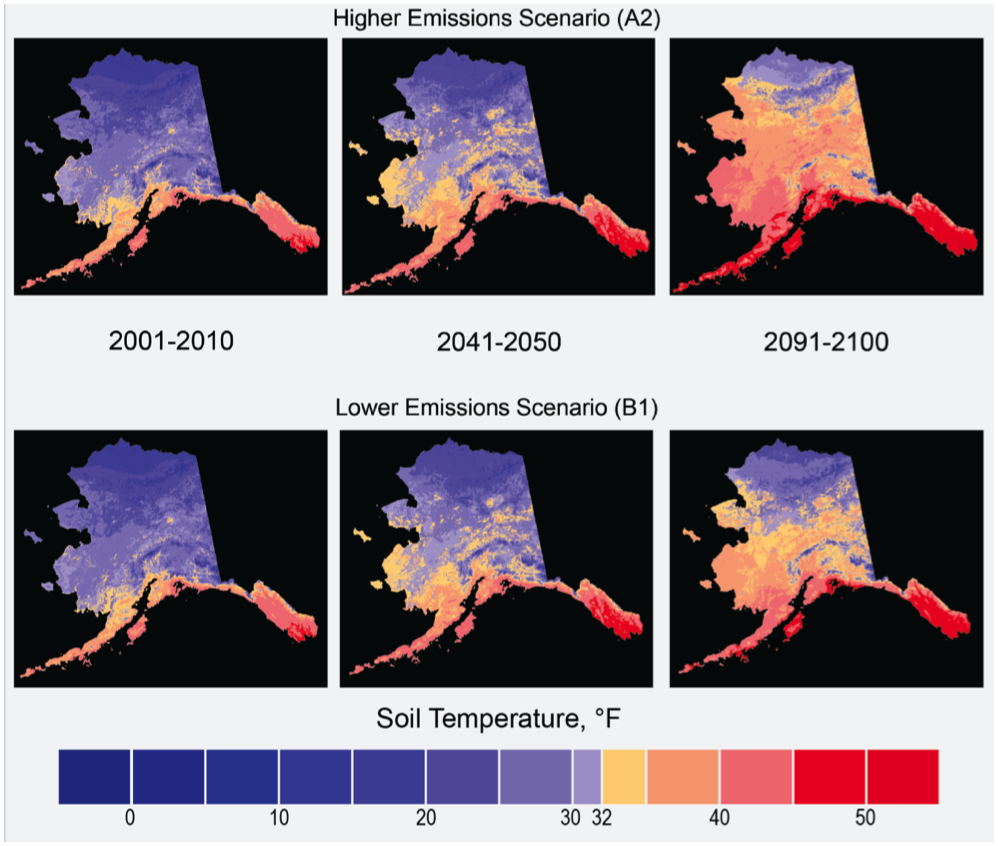 |
|
Annual average snowfall |
Observed |
Snow |
Southeast and Caribbean |
Regional Climate Trends and Scenarios for the U.S. National Climate Assessment. Part 2. Climate of the Southeast U.S. |
NCA 3 |
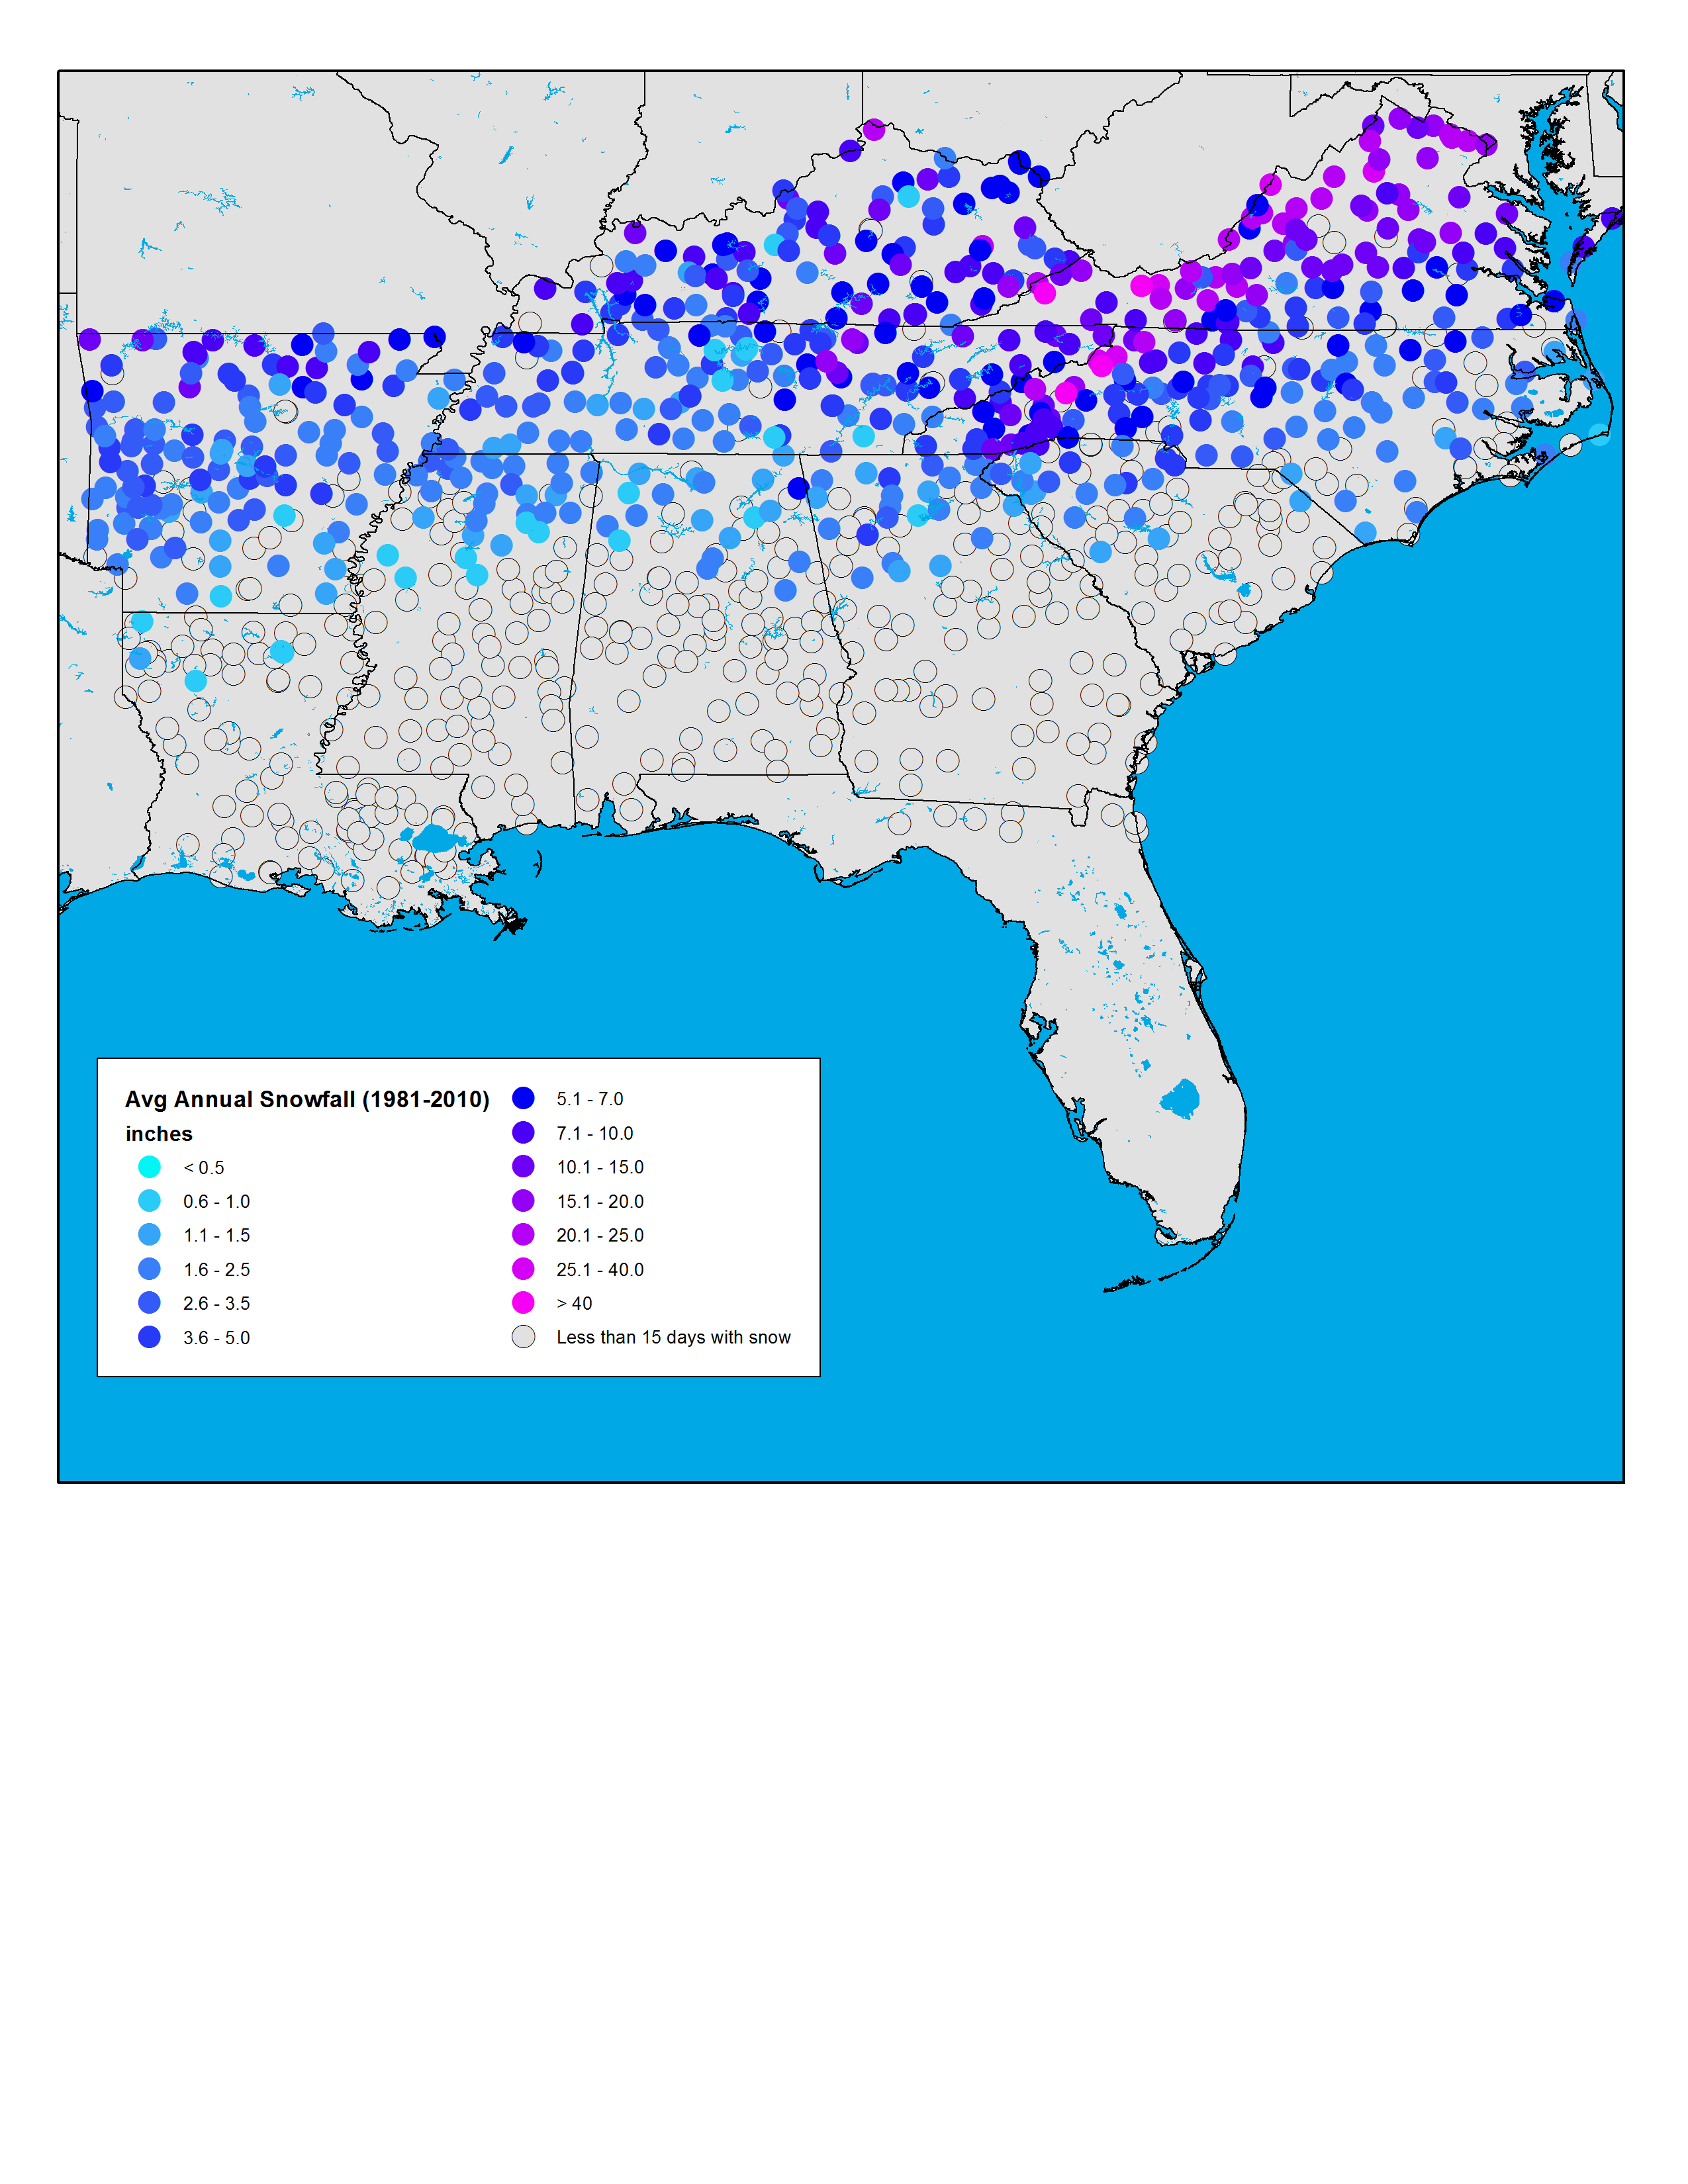 |
|
Annual average precipitation |
Simulated |
Precipitation |
Southeast and Caribbean |
Regional Climate Trends and Scenarios for the U.S. National Climate Assessment. Part 2. Climate of the Southeast U.S. |
NCA 3 |
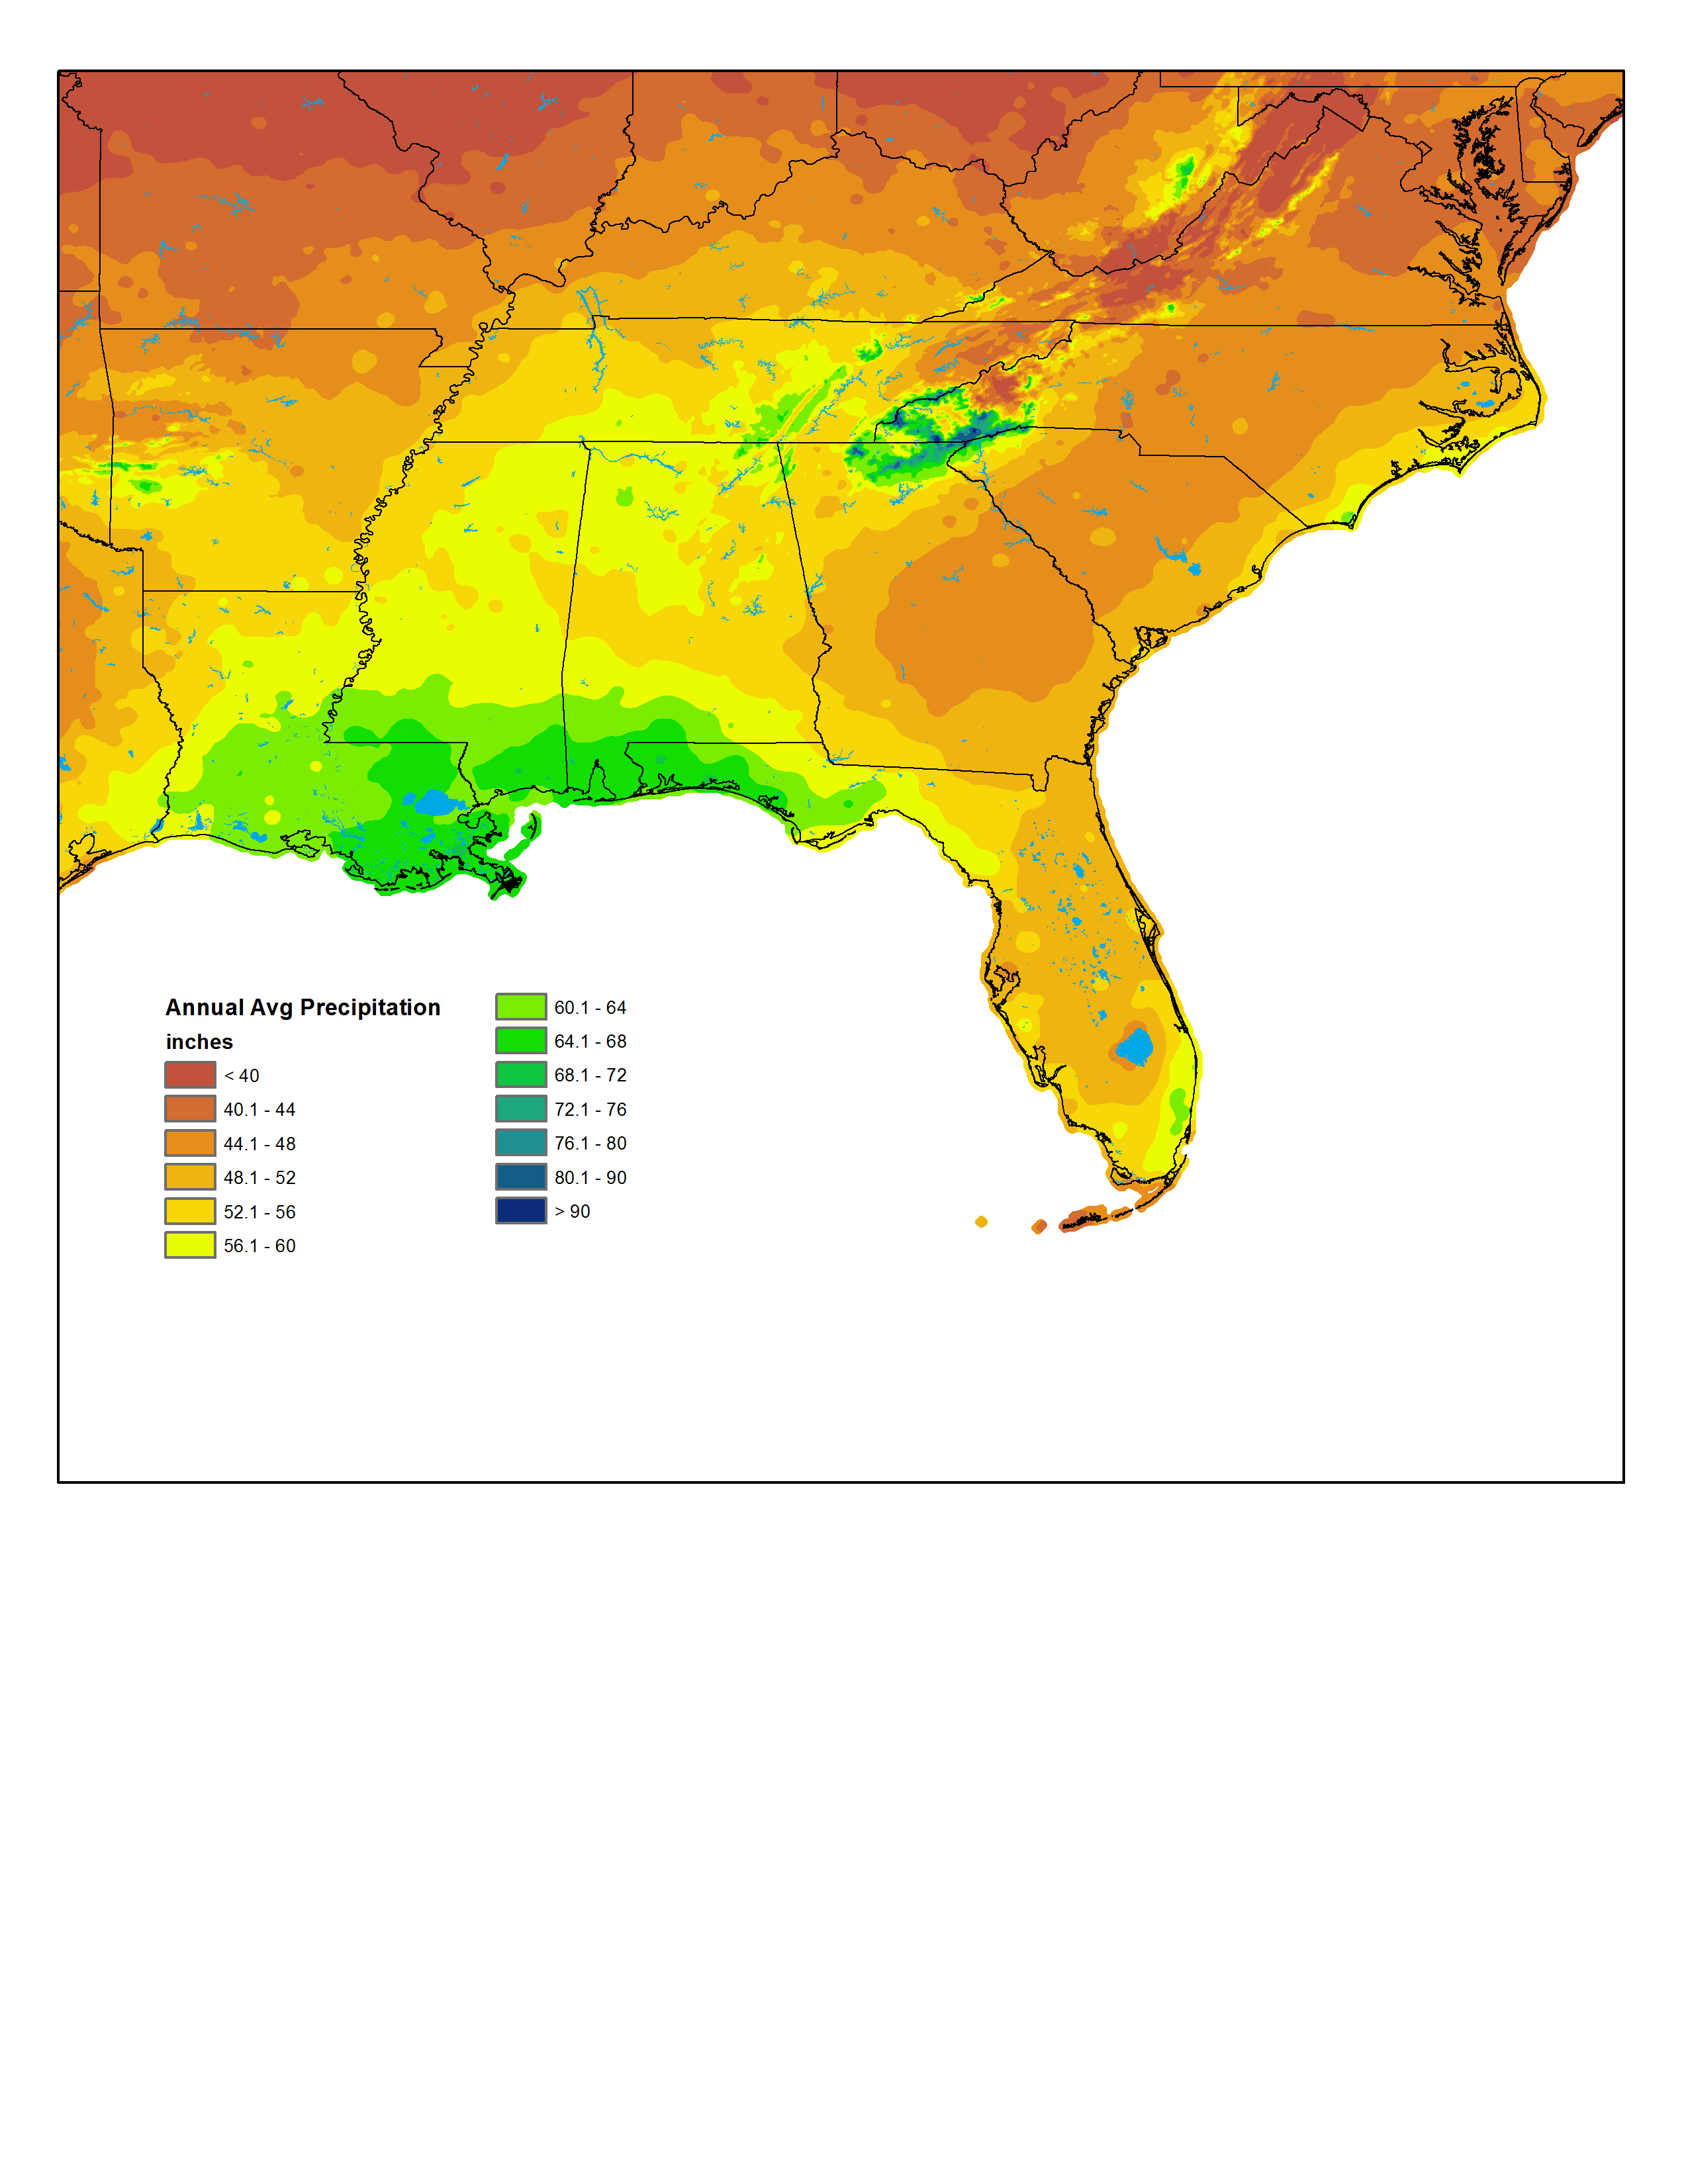 |
|
Annual and seasonal temperature anomaly |
Observed |
Temperature |
Southeast and Caribbean |
Regional Climate Trends and Scenarios for the U.S. National Climate Assessment. Part 2. Climate of the Southeast U.S. |
NCA 3 |
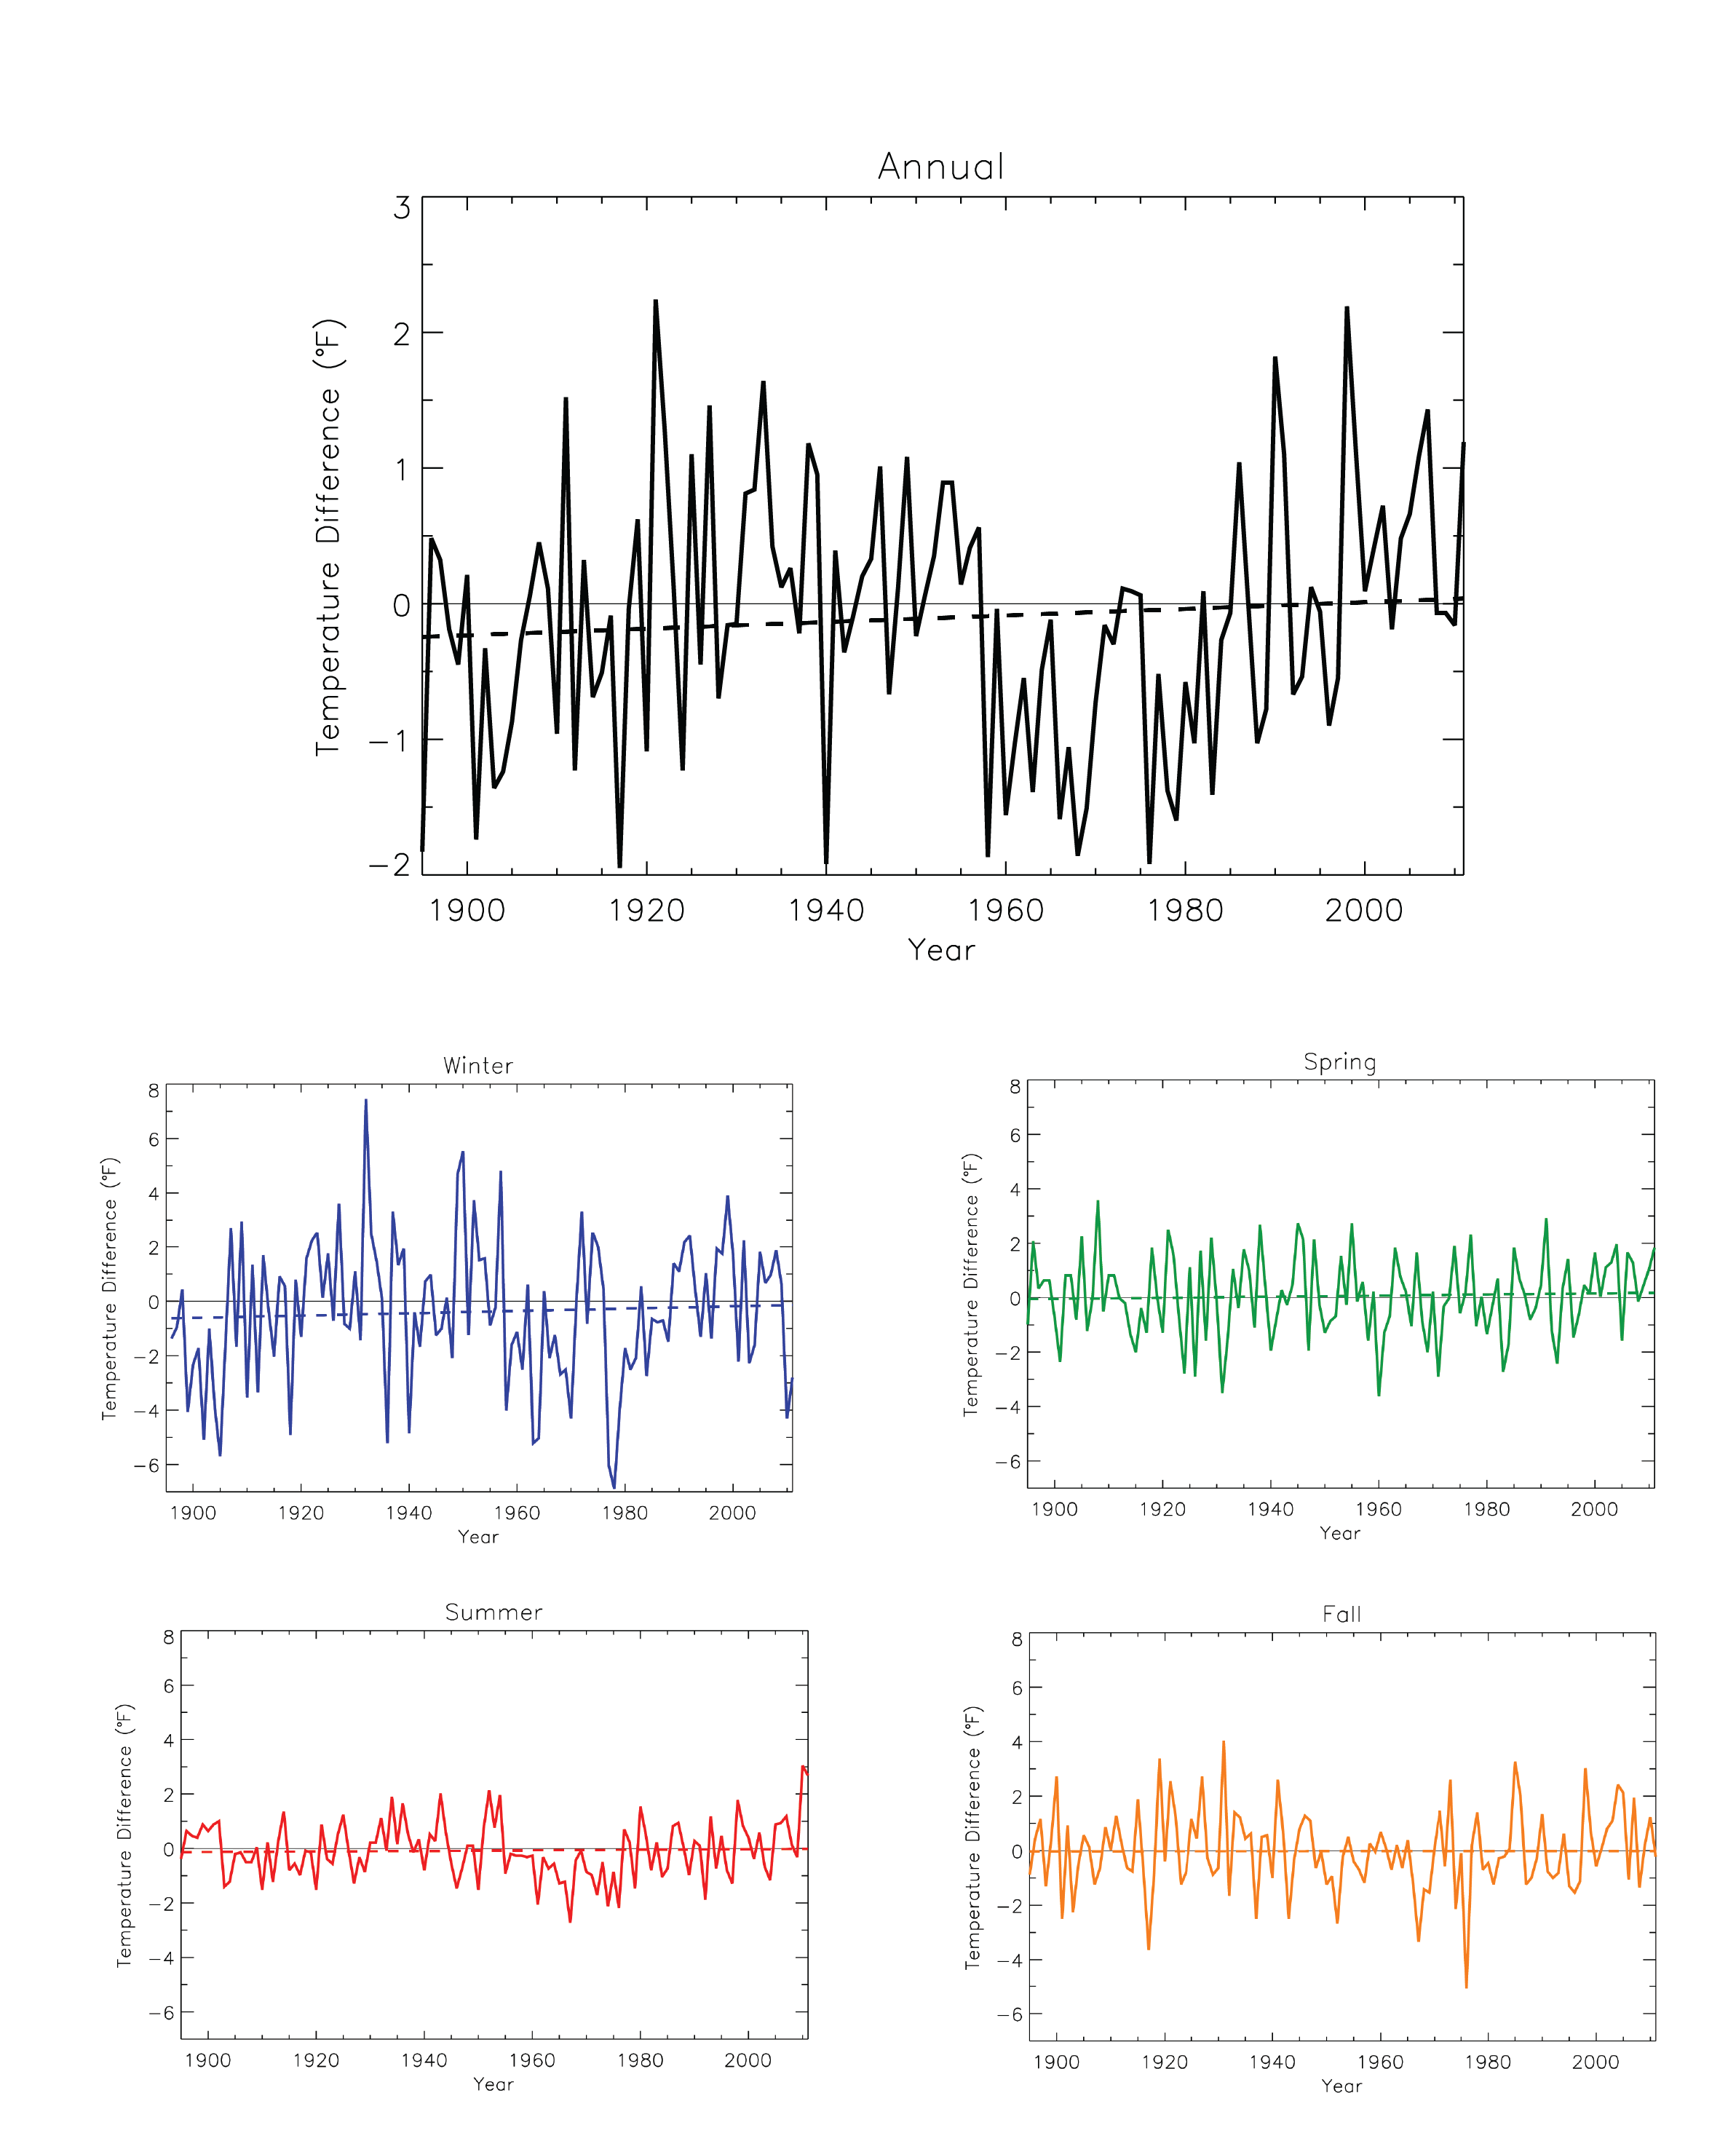 |
|
Annual and seasonal temperature anomaly |
Observed |
Temperature |
National |
Regional Climate Trends and Scenarios for the U.S. National Climate Assessment. Part 9. Climate of the Contiguous United States |
NCA 3 |
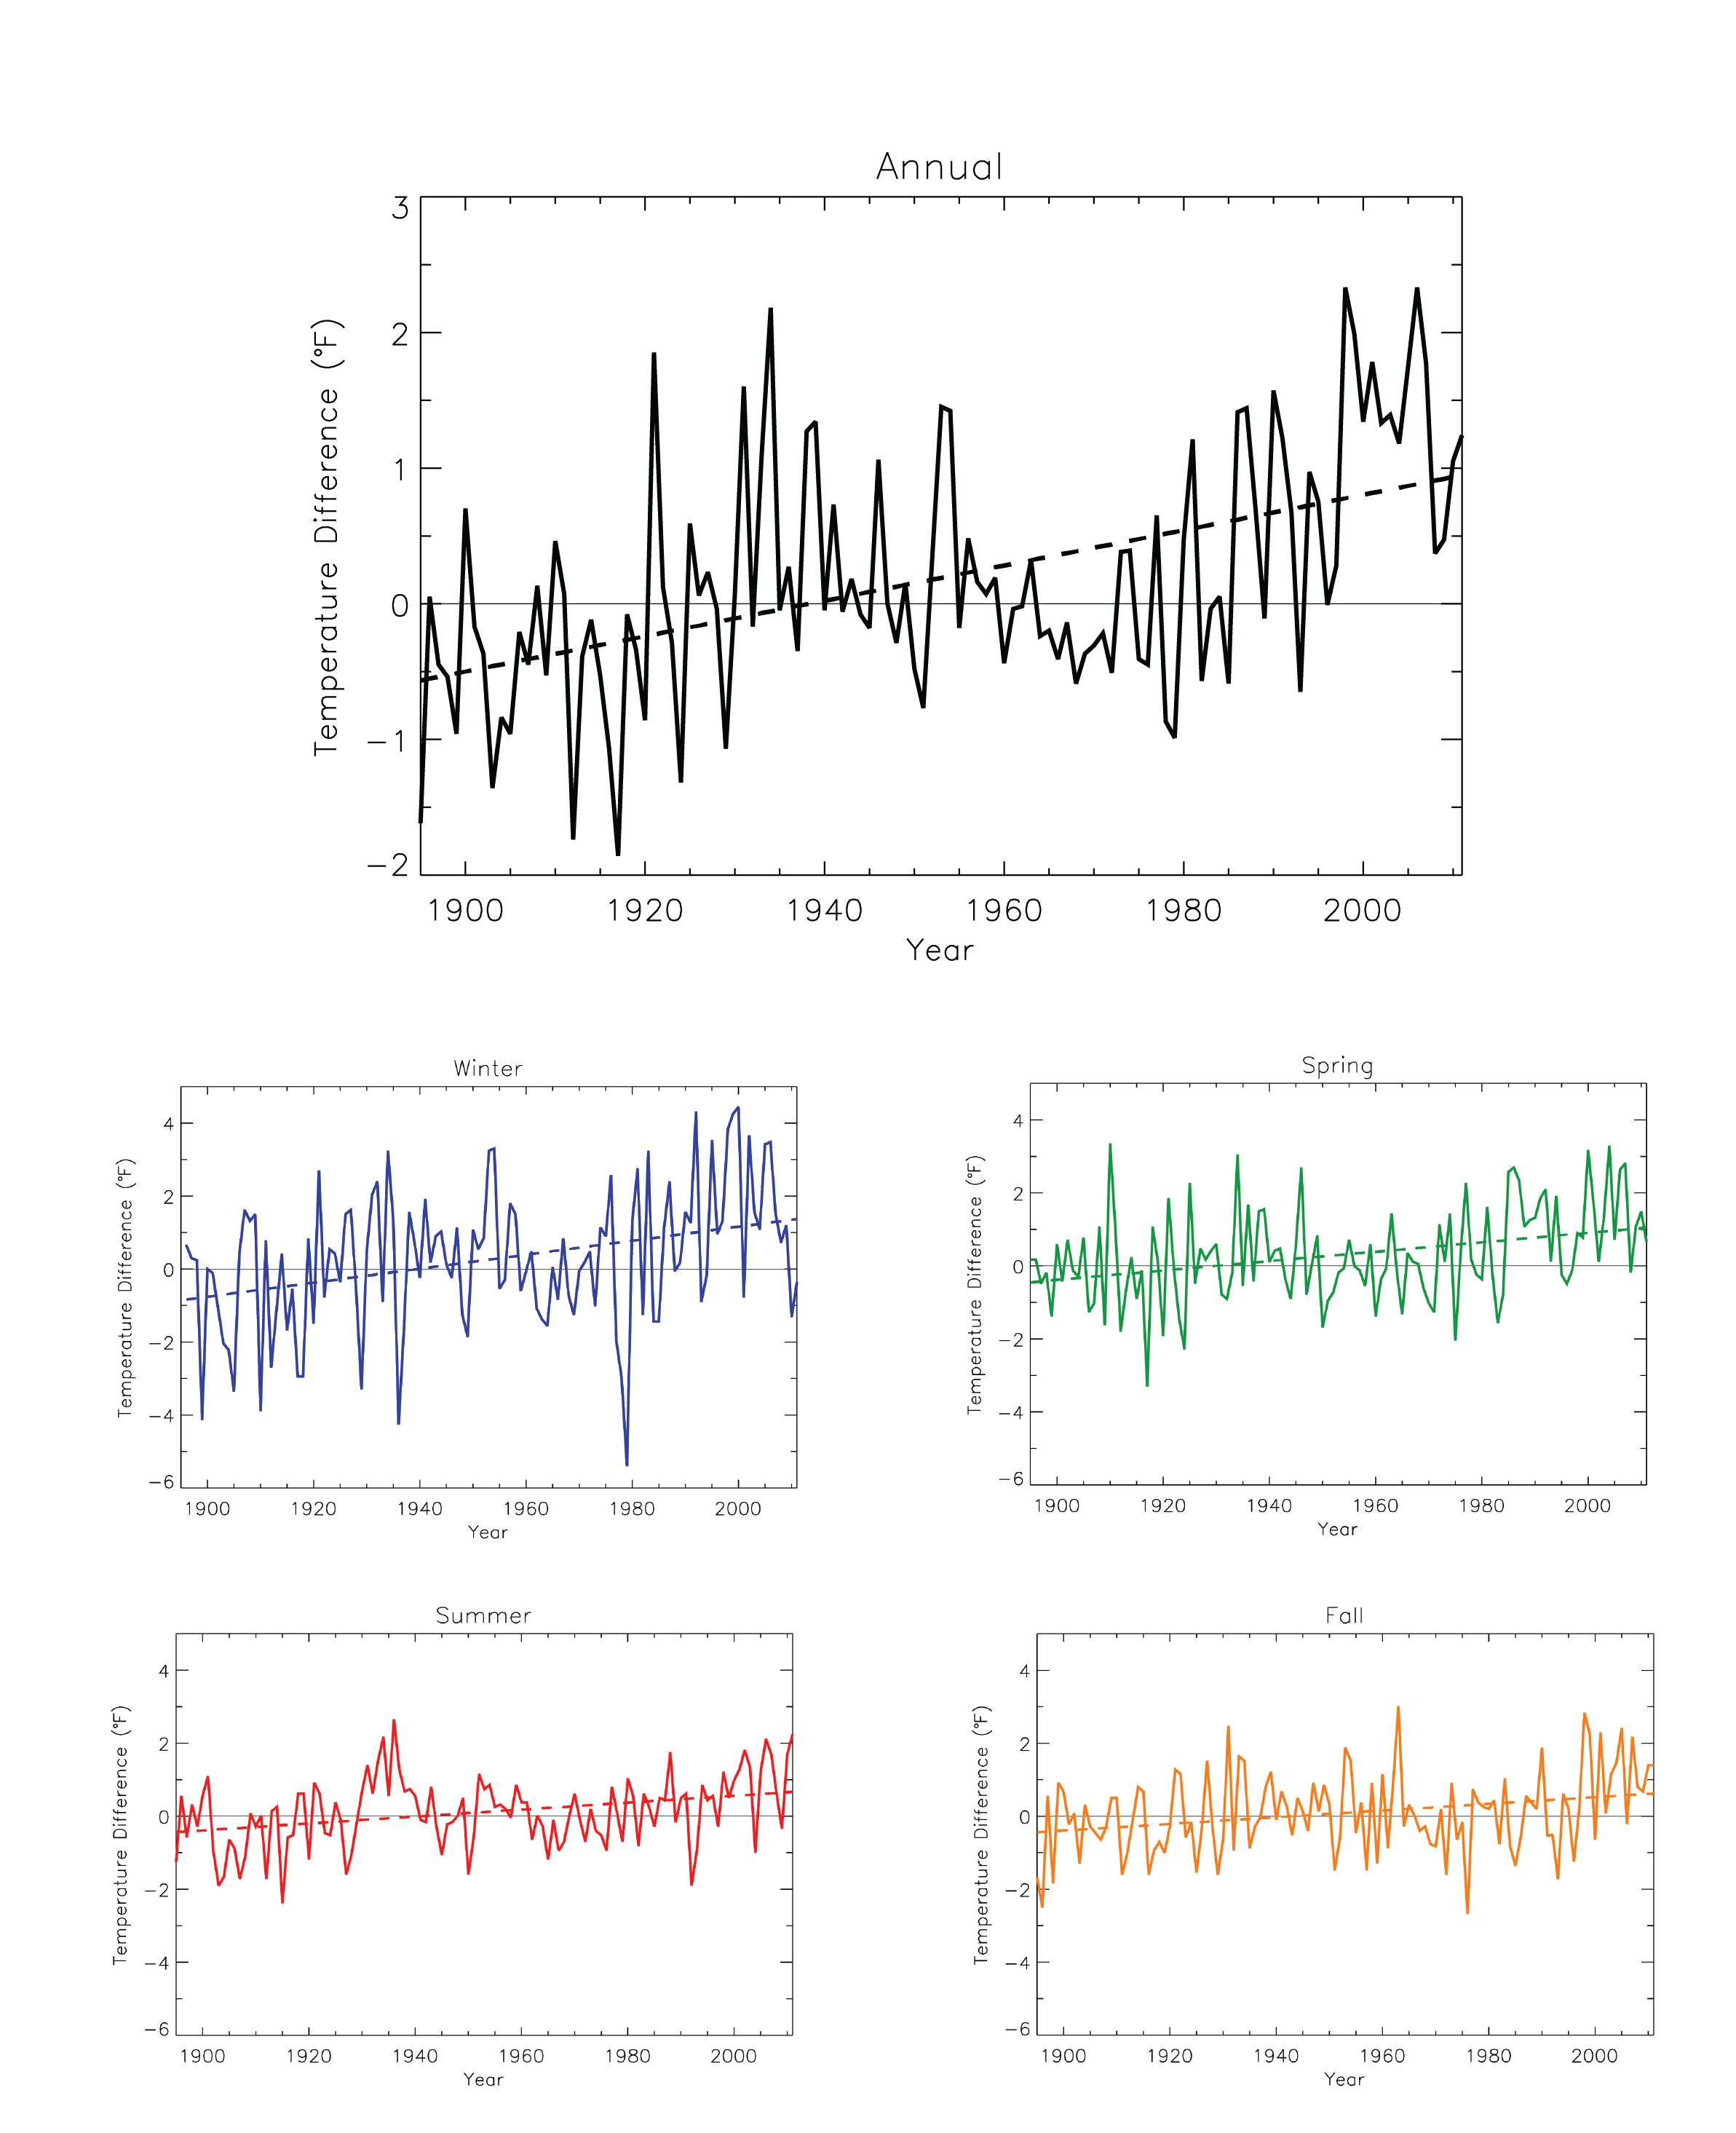 |
|
Annual and seasonal temperature anomaly |
Observed |
Temperature |
Great Plains |
Regional Climate Trends and Scenarios for the U.S. National Climate Assessment. Part 4. Climate of the U.S. Great Plains |
NCA 3 |
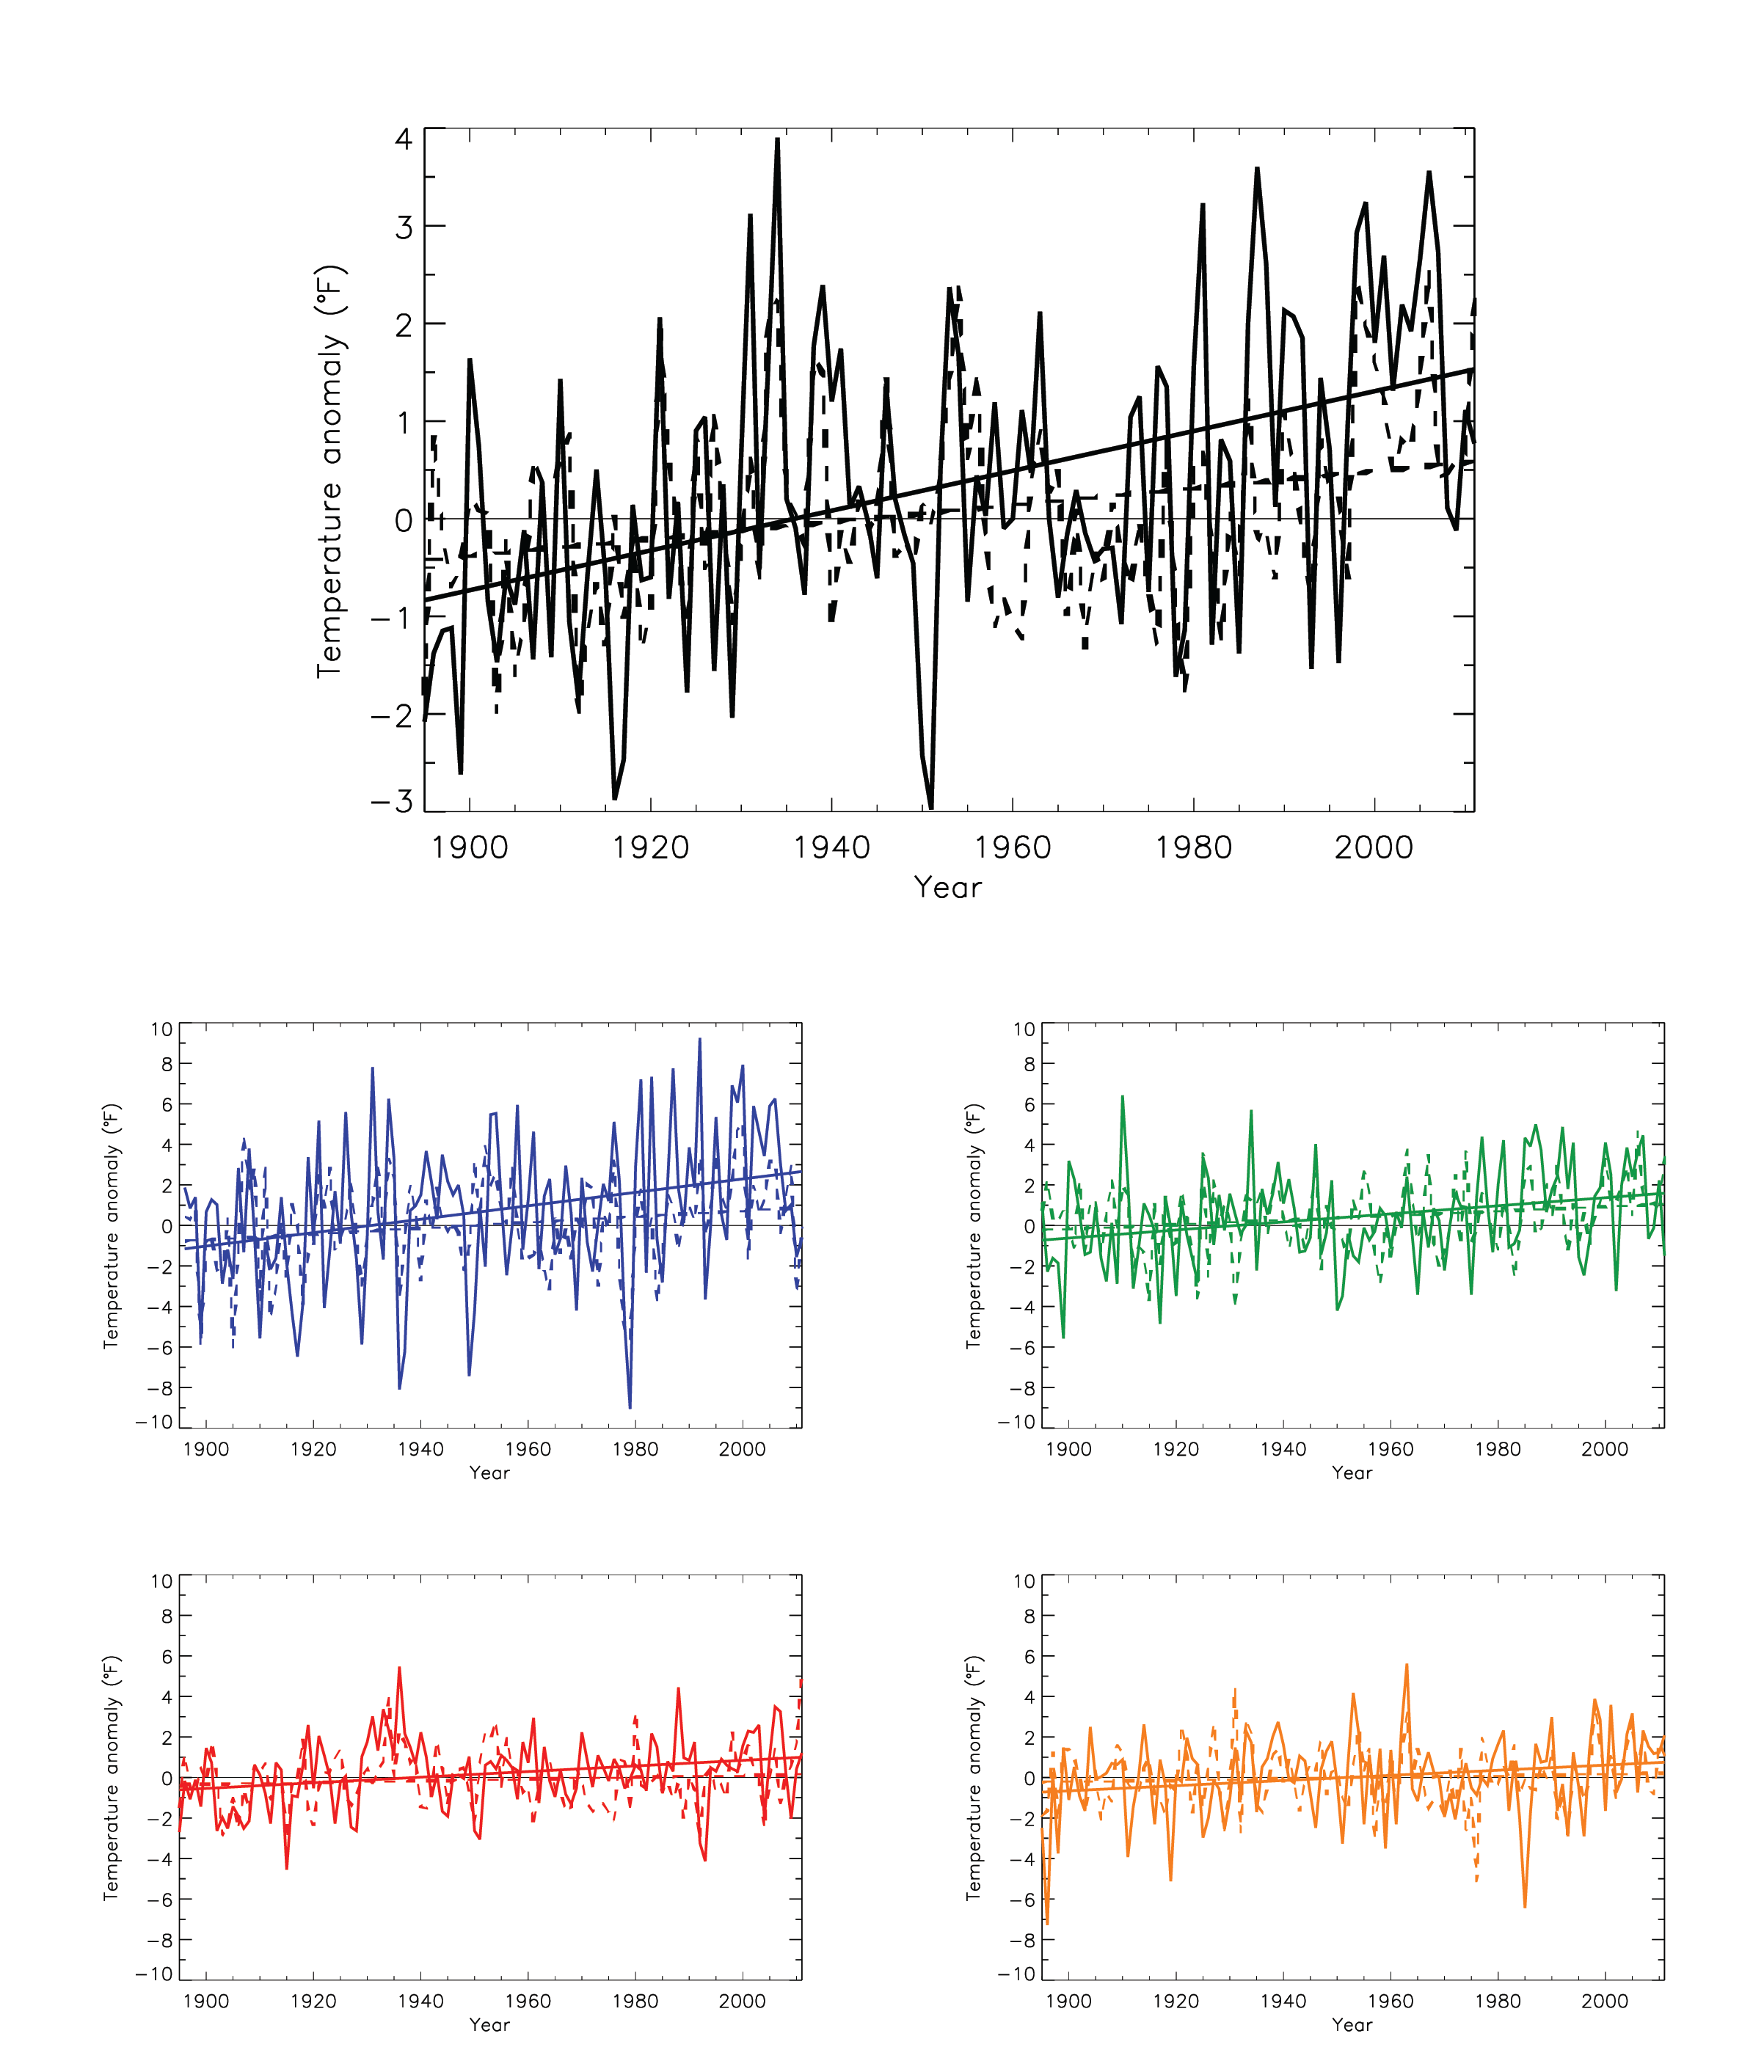 |
|
Annual and seasonal temperature anomaly |
Observed |
Temperature |
Northeast |
Regional Climate Trends and Scenarios for the U.S. National Climate Assessment. Part 1. Climate of the Northeast U.S. |
NCA 3 |
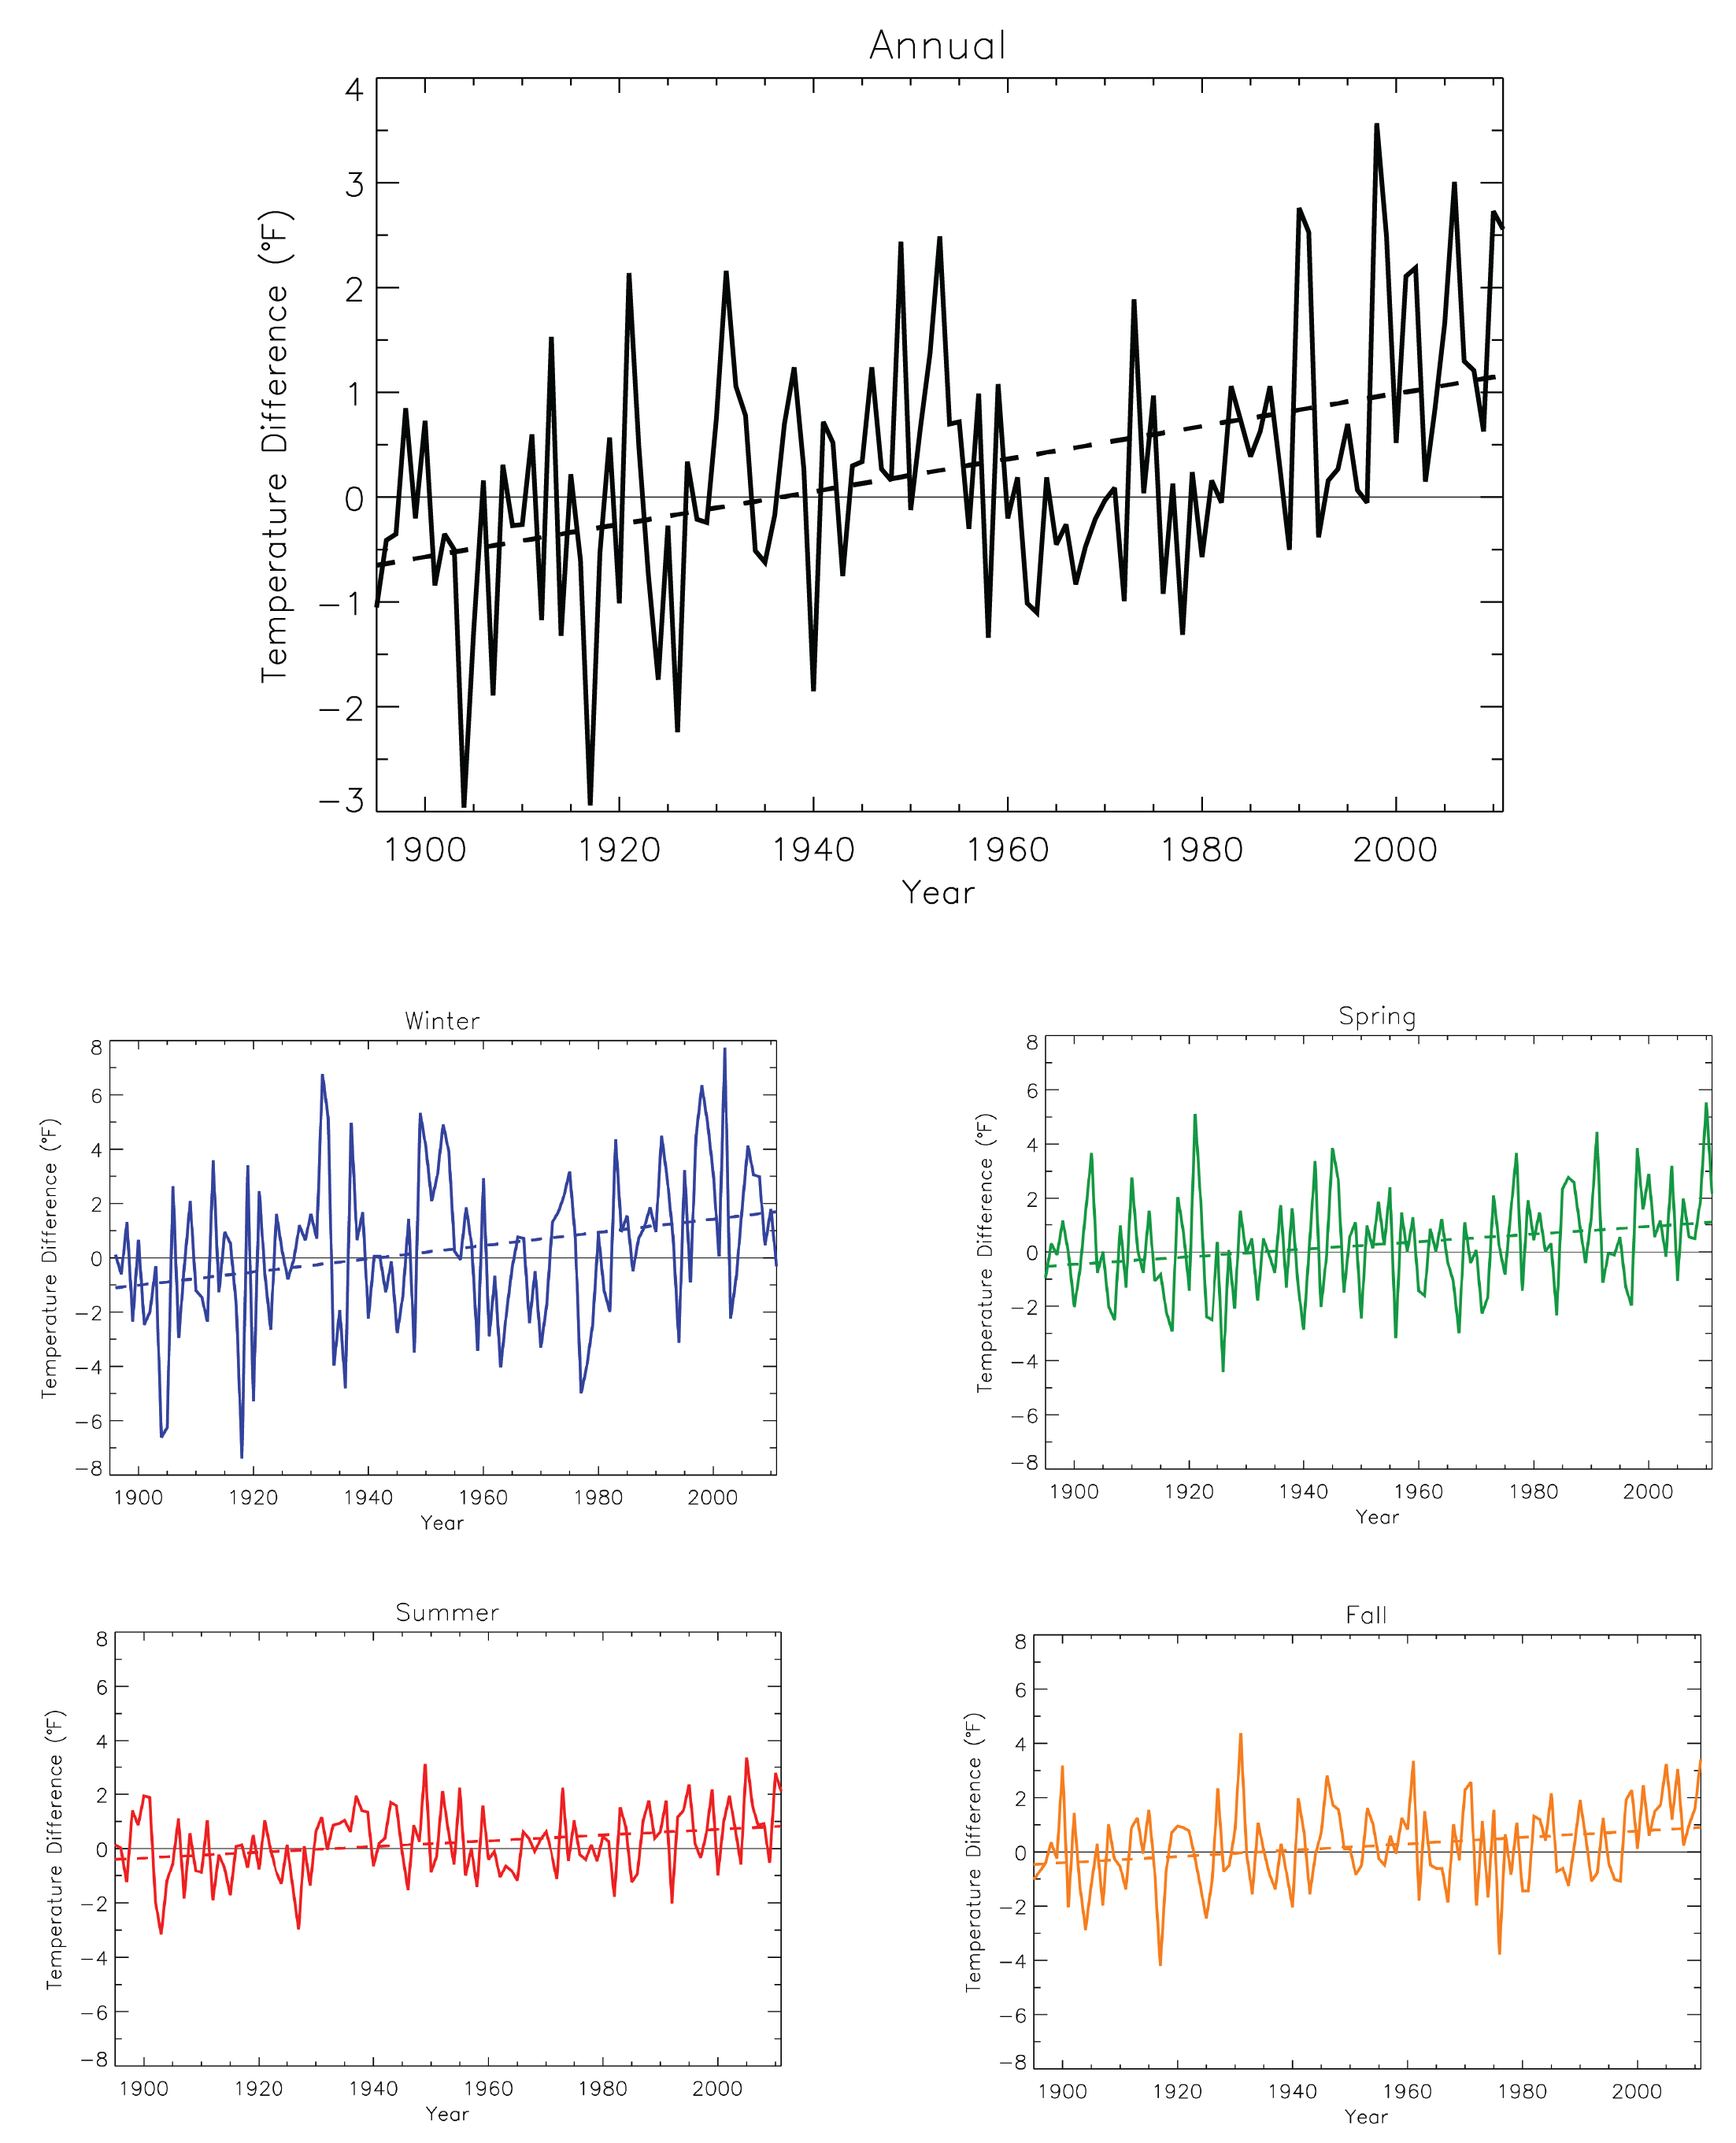 |
|
Annual and seasonal temperature anomaly |
Observed |
Temperature |
Southwest |
Regional Climate Trends and Scenarios for the U.S. National Climate Assessment. Part 5. Climate of the Southwest U.S. |
NCA 3 |
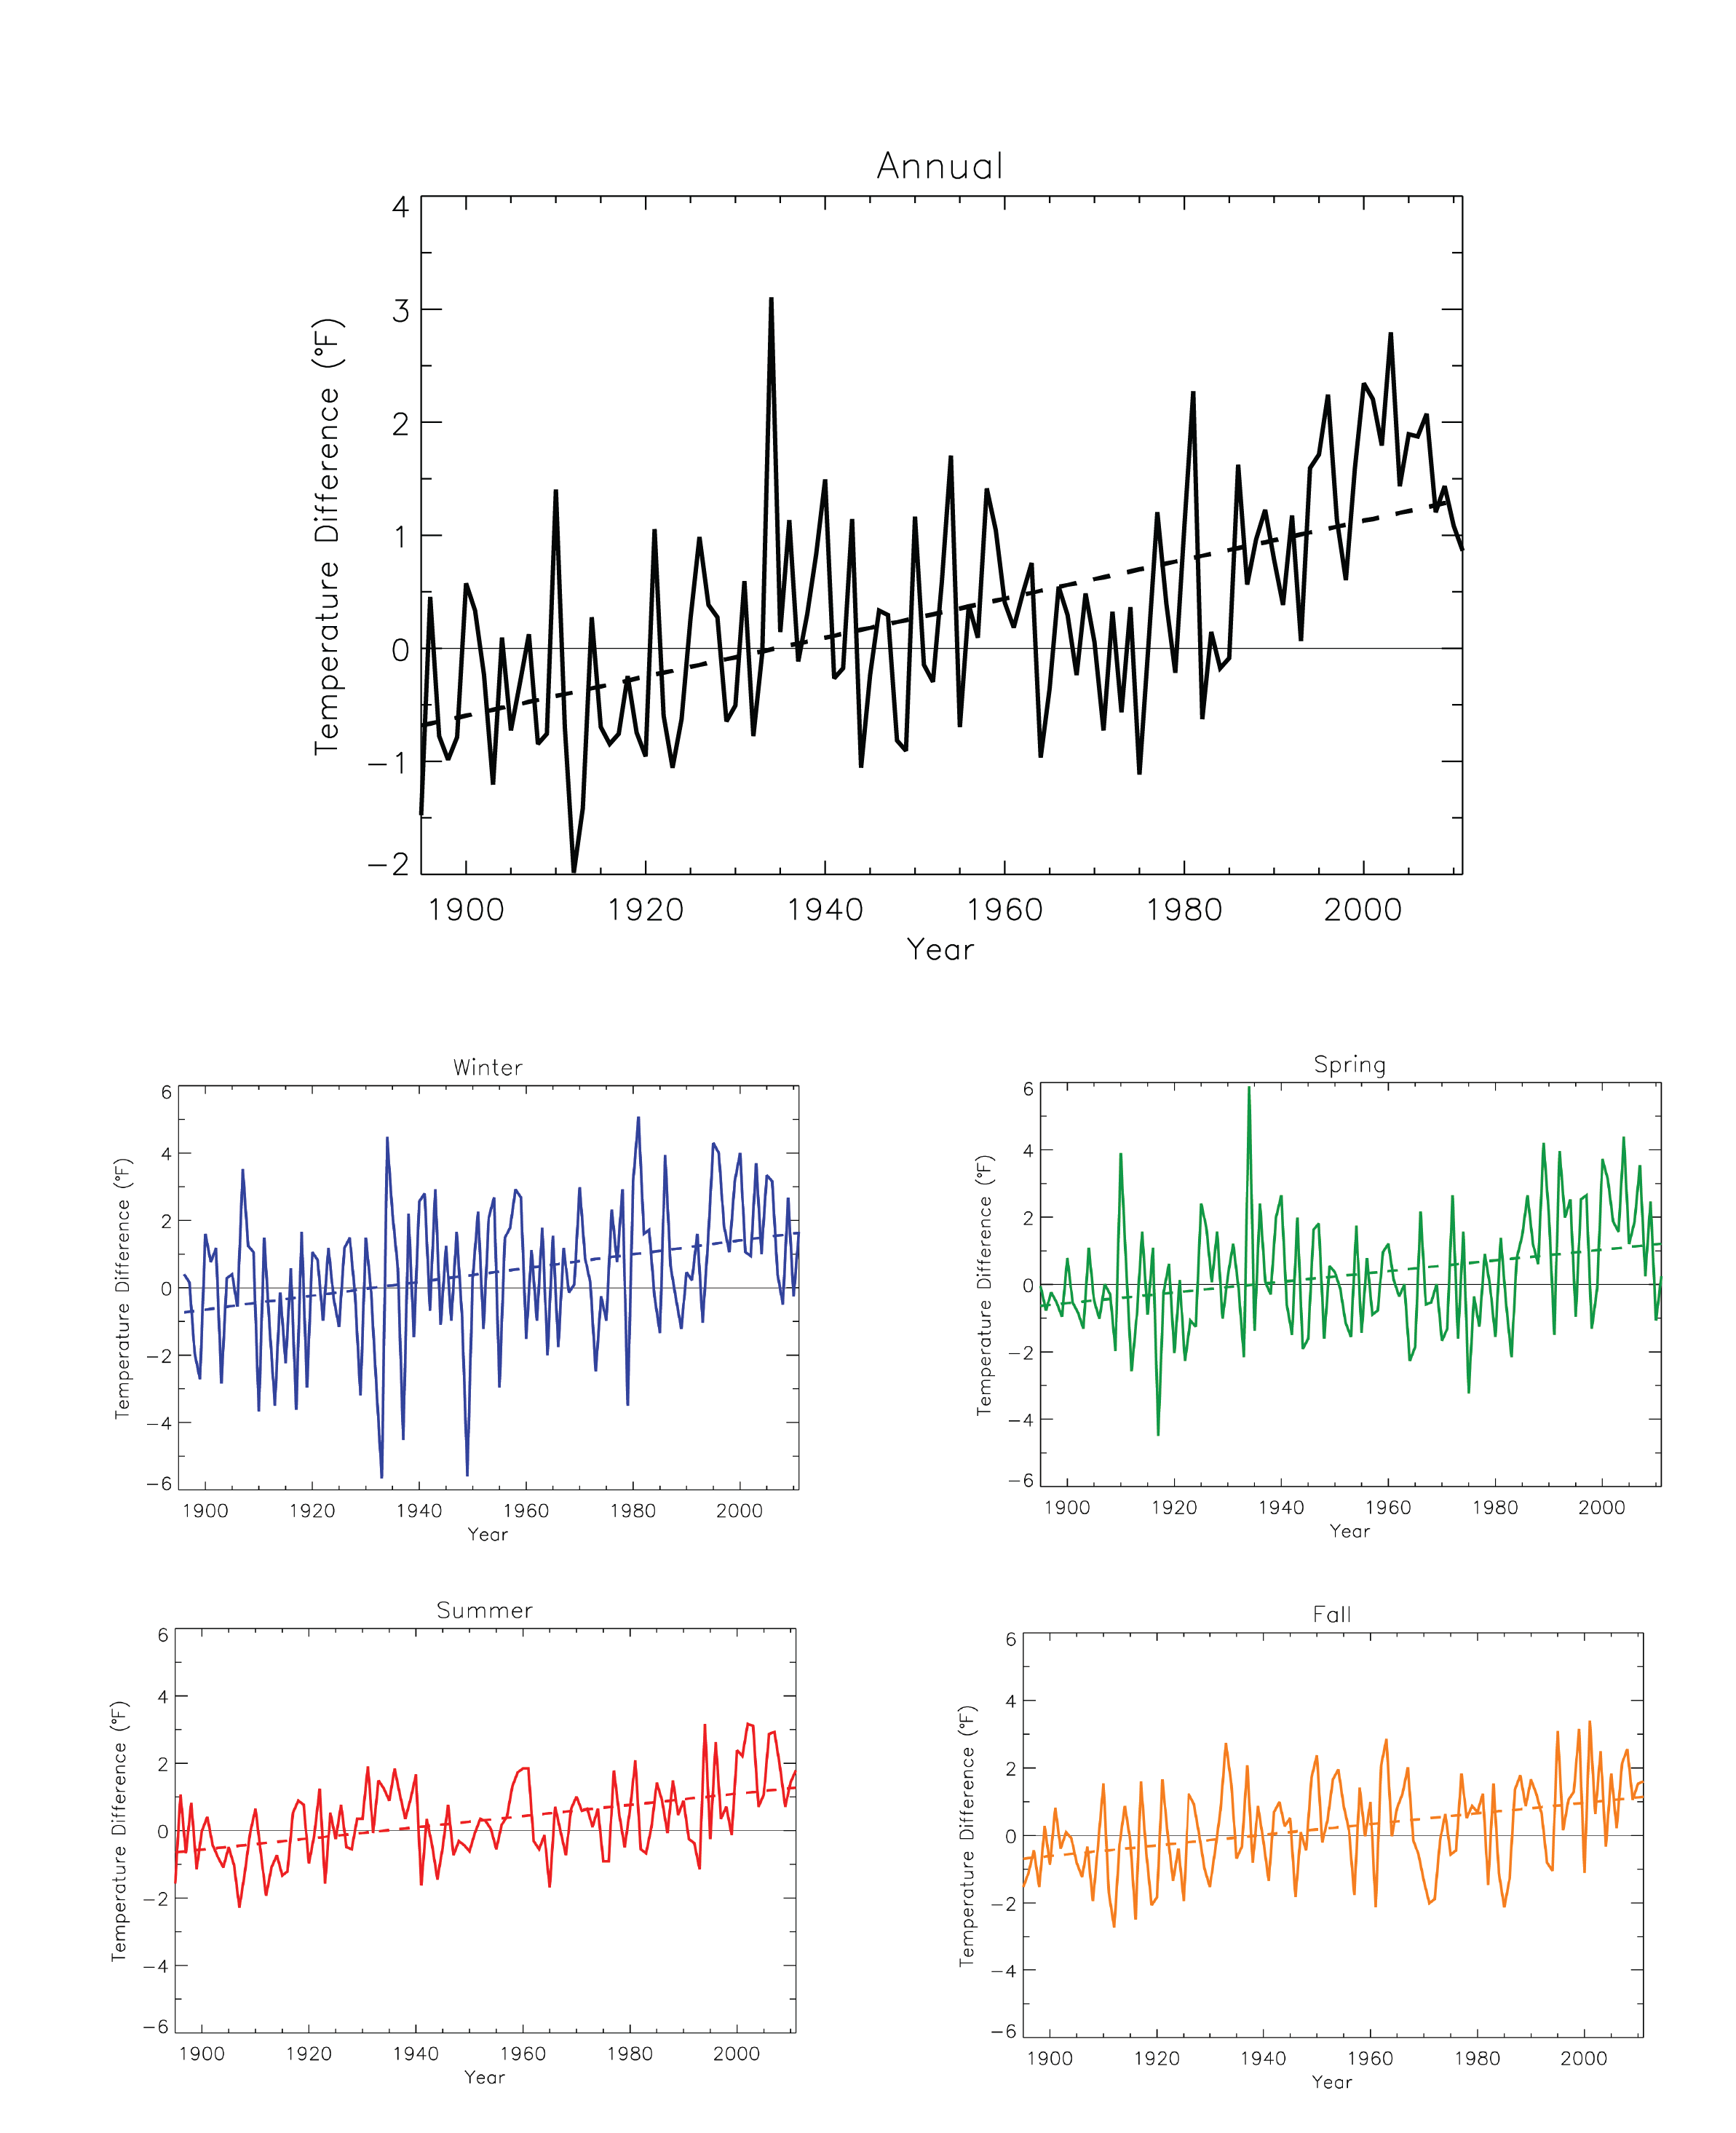 |
|
Annual and seasonal temperature anomaly |
Observed |
Temperature |
Northwest |
Regional Climate Trends and Scenarios for the U.S. National Climate Assessment. Part 6. Climate of the Northwest U.S. |
NCA 3 |
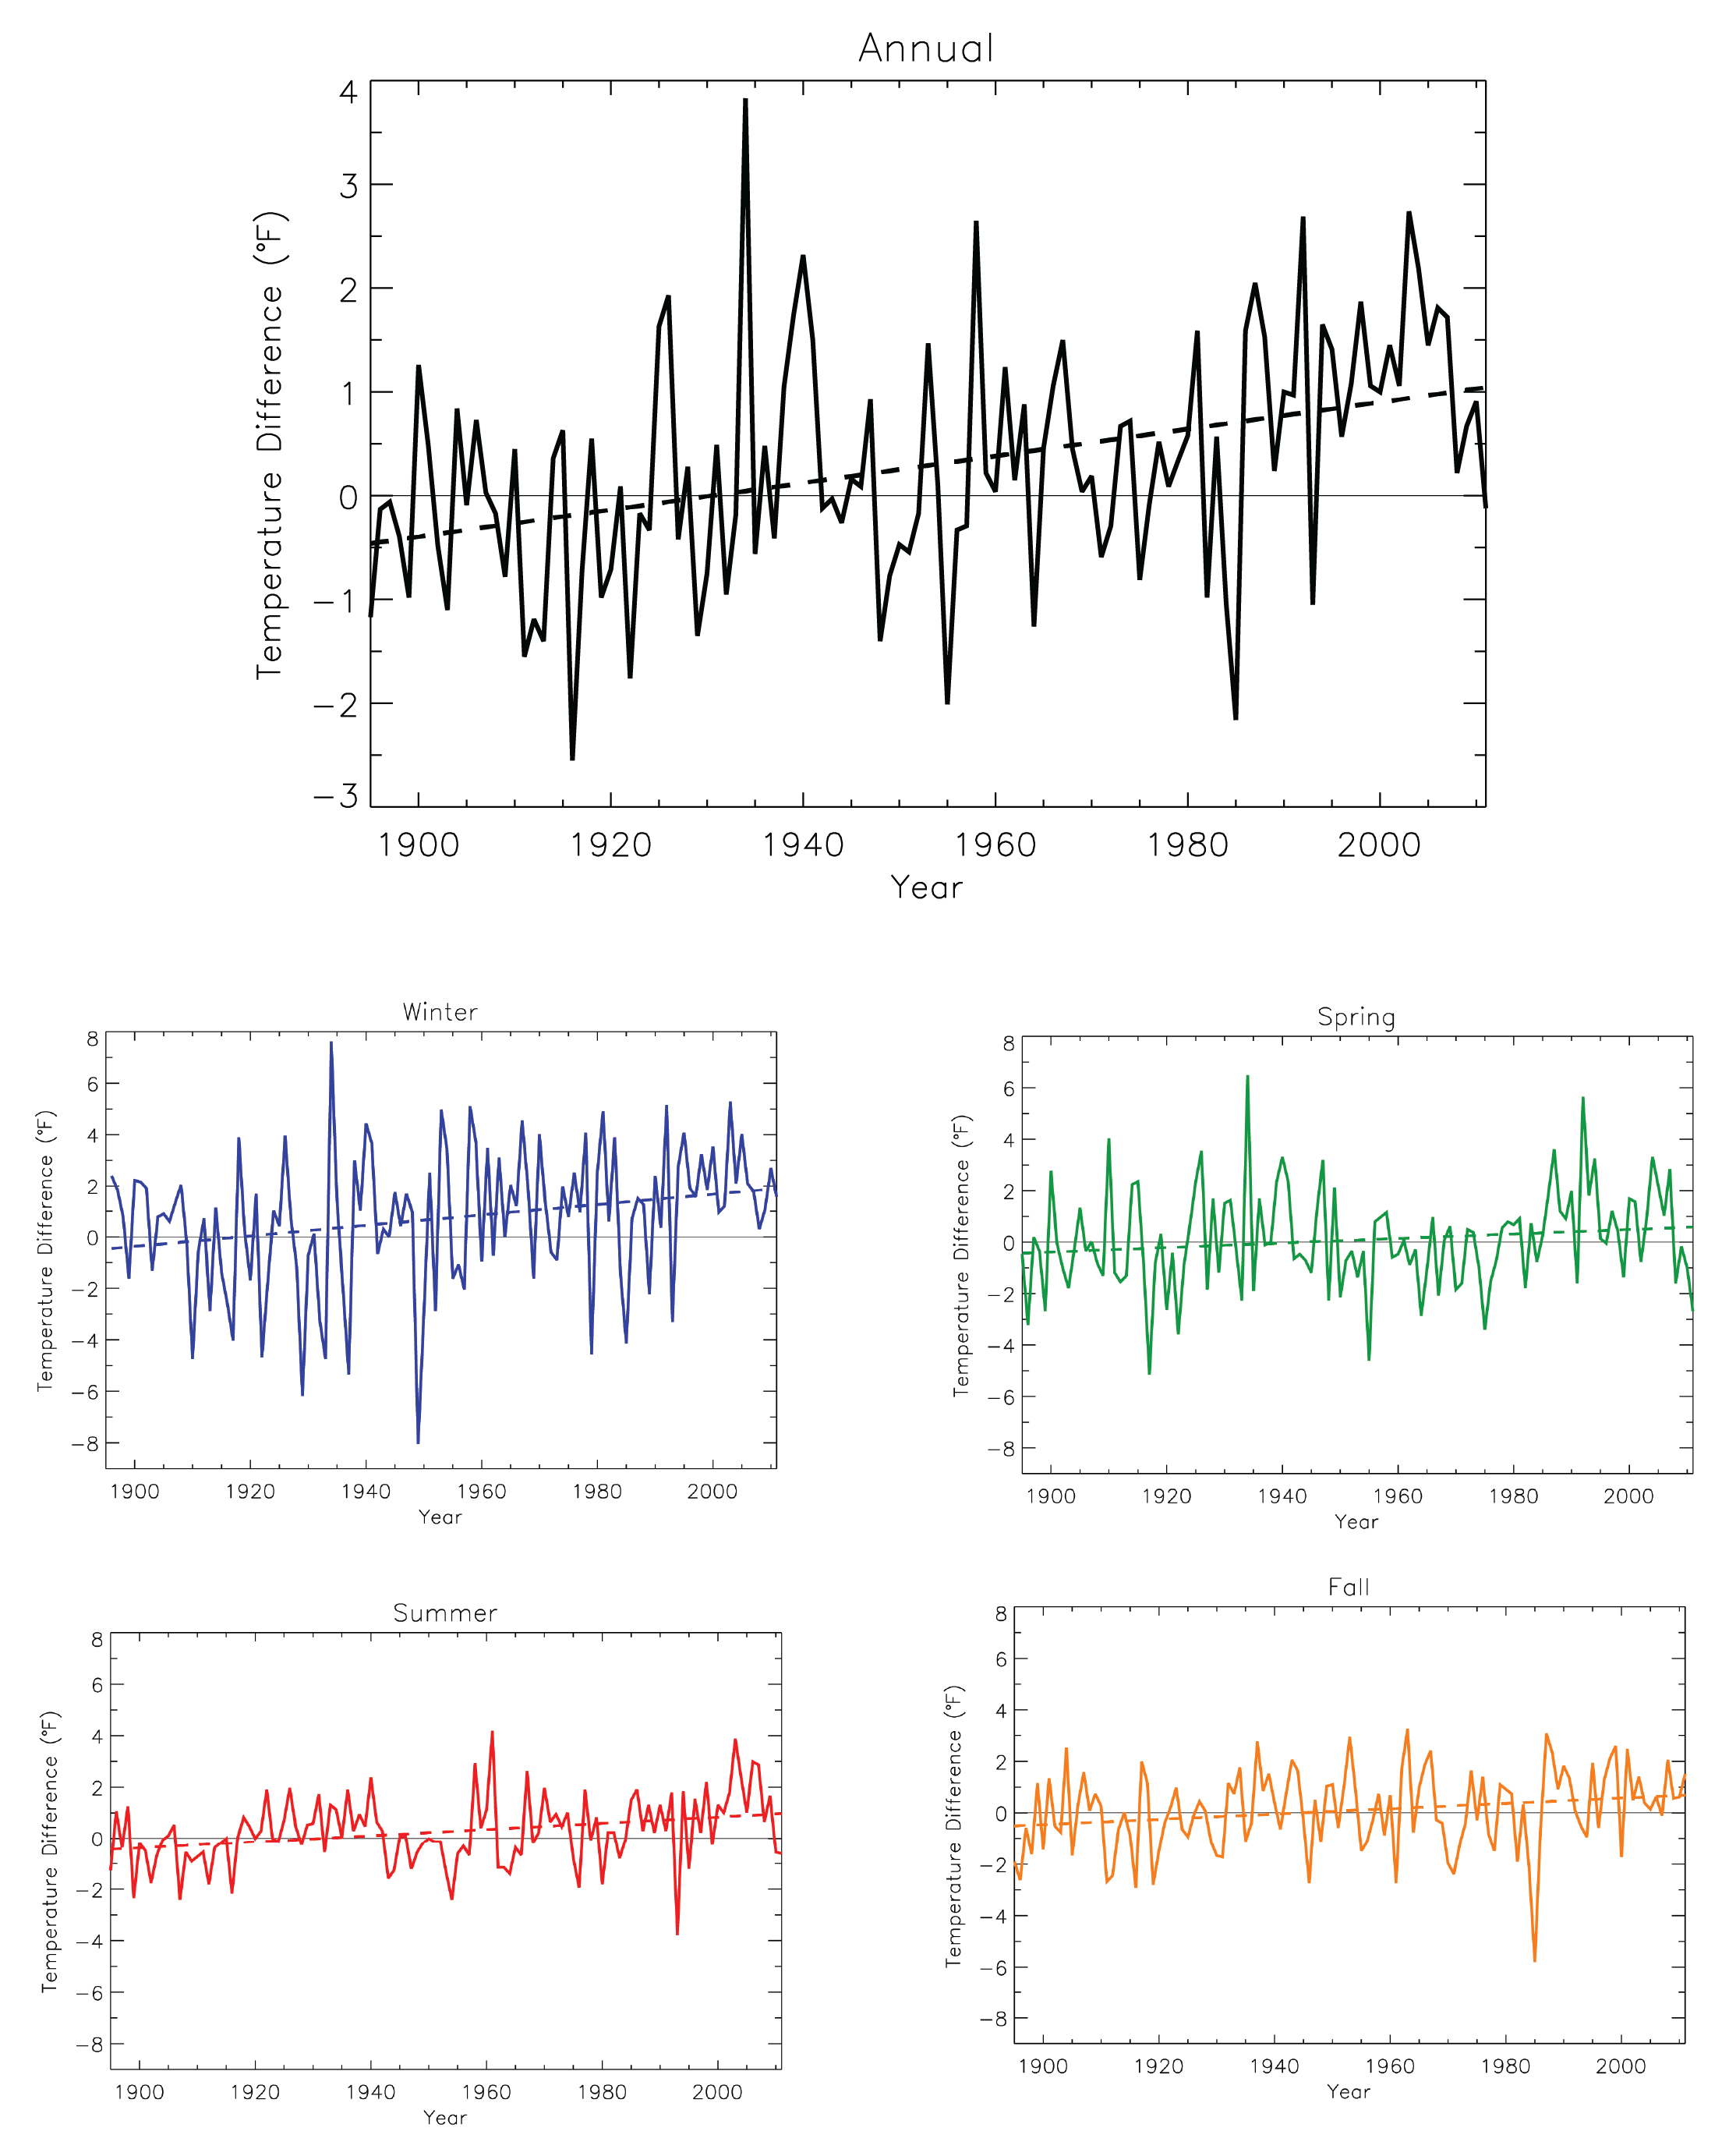 |
|
Annual and seasonal temperature anomaly |
Observed |
Temperature |
Midwest |
Regional Climate Trends and Scenarios for the U.S. National Climate Assessment. Part 3. Climate of the Midwest U.S. |
NCA 3 |
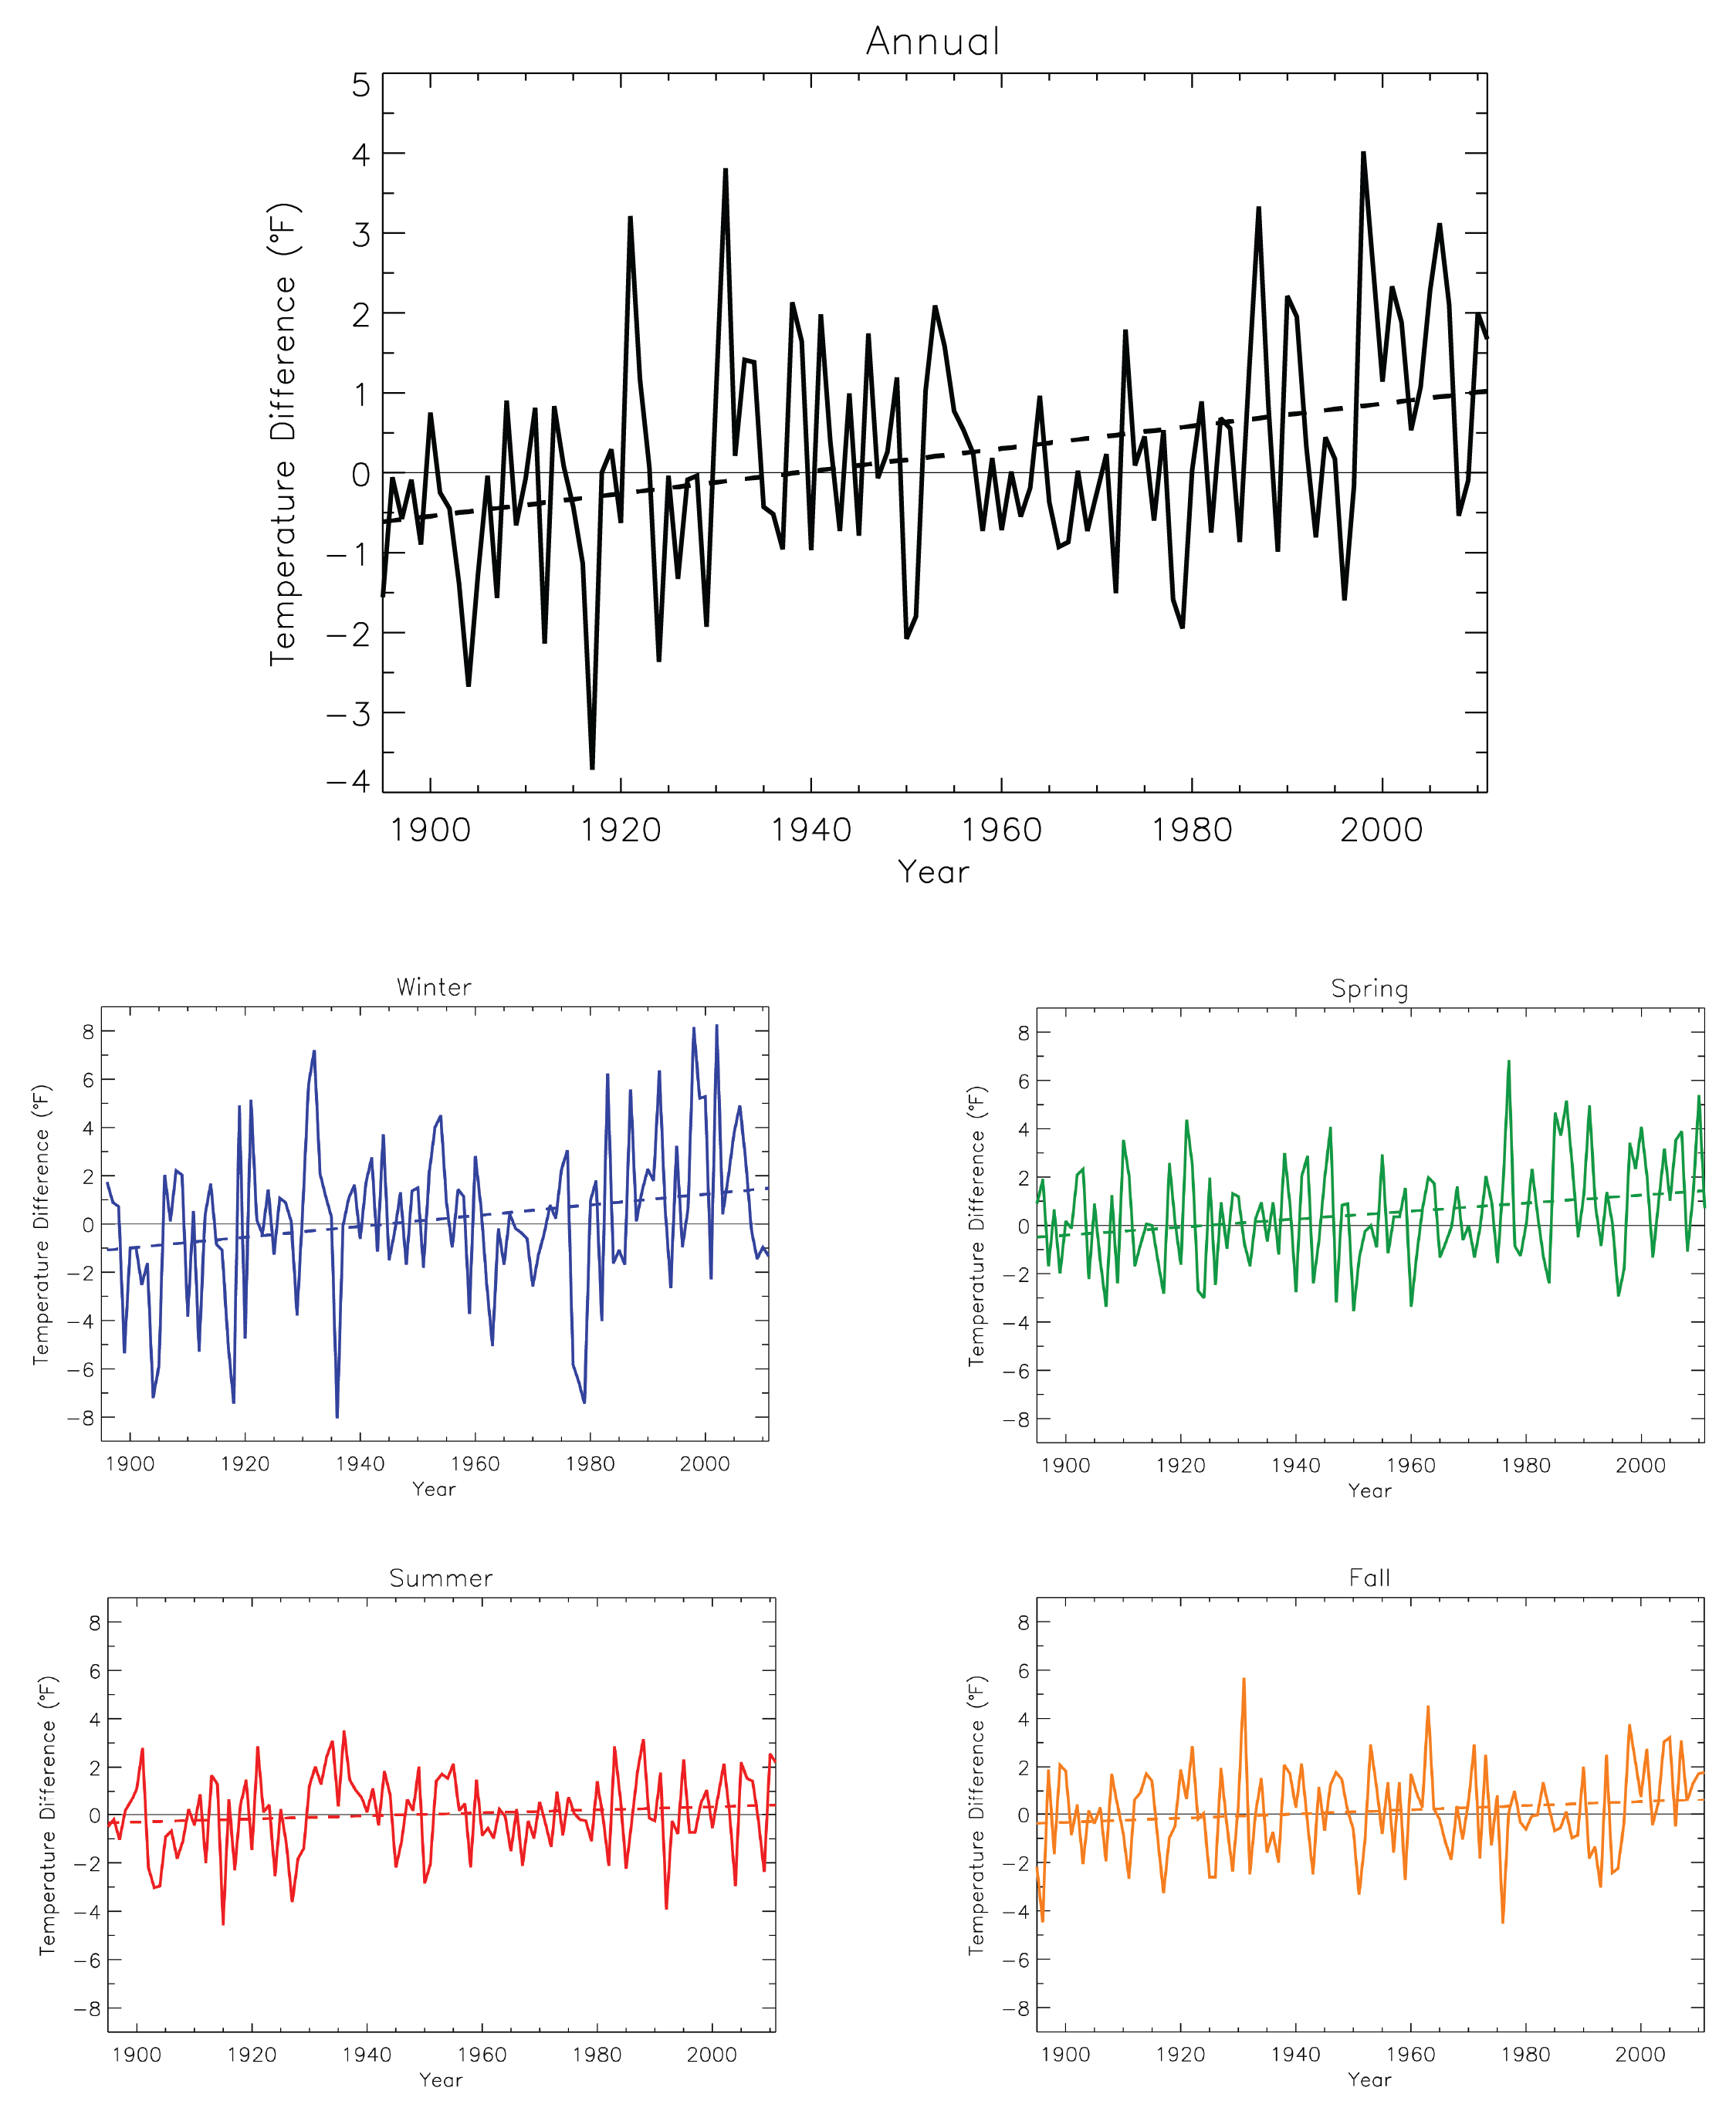 |
|
Annual and seasonal precipitation anomaly |
Observed |
Precipitation |
National |
Regional Climate Trends and Scenarios for the U.S. National Climate Assessment. Part 9. Climate of the Contiguous United States |
NCA 3 |
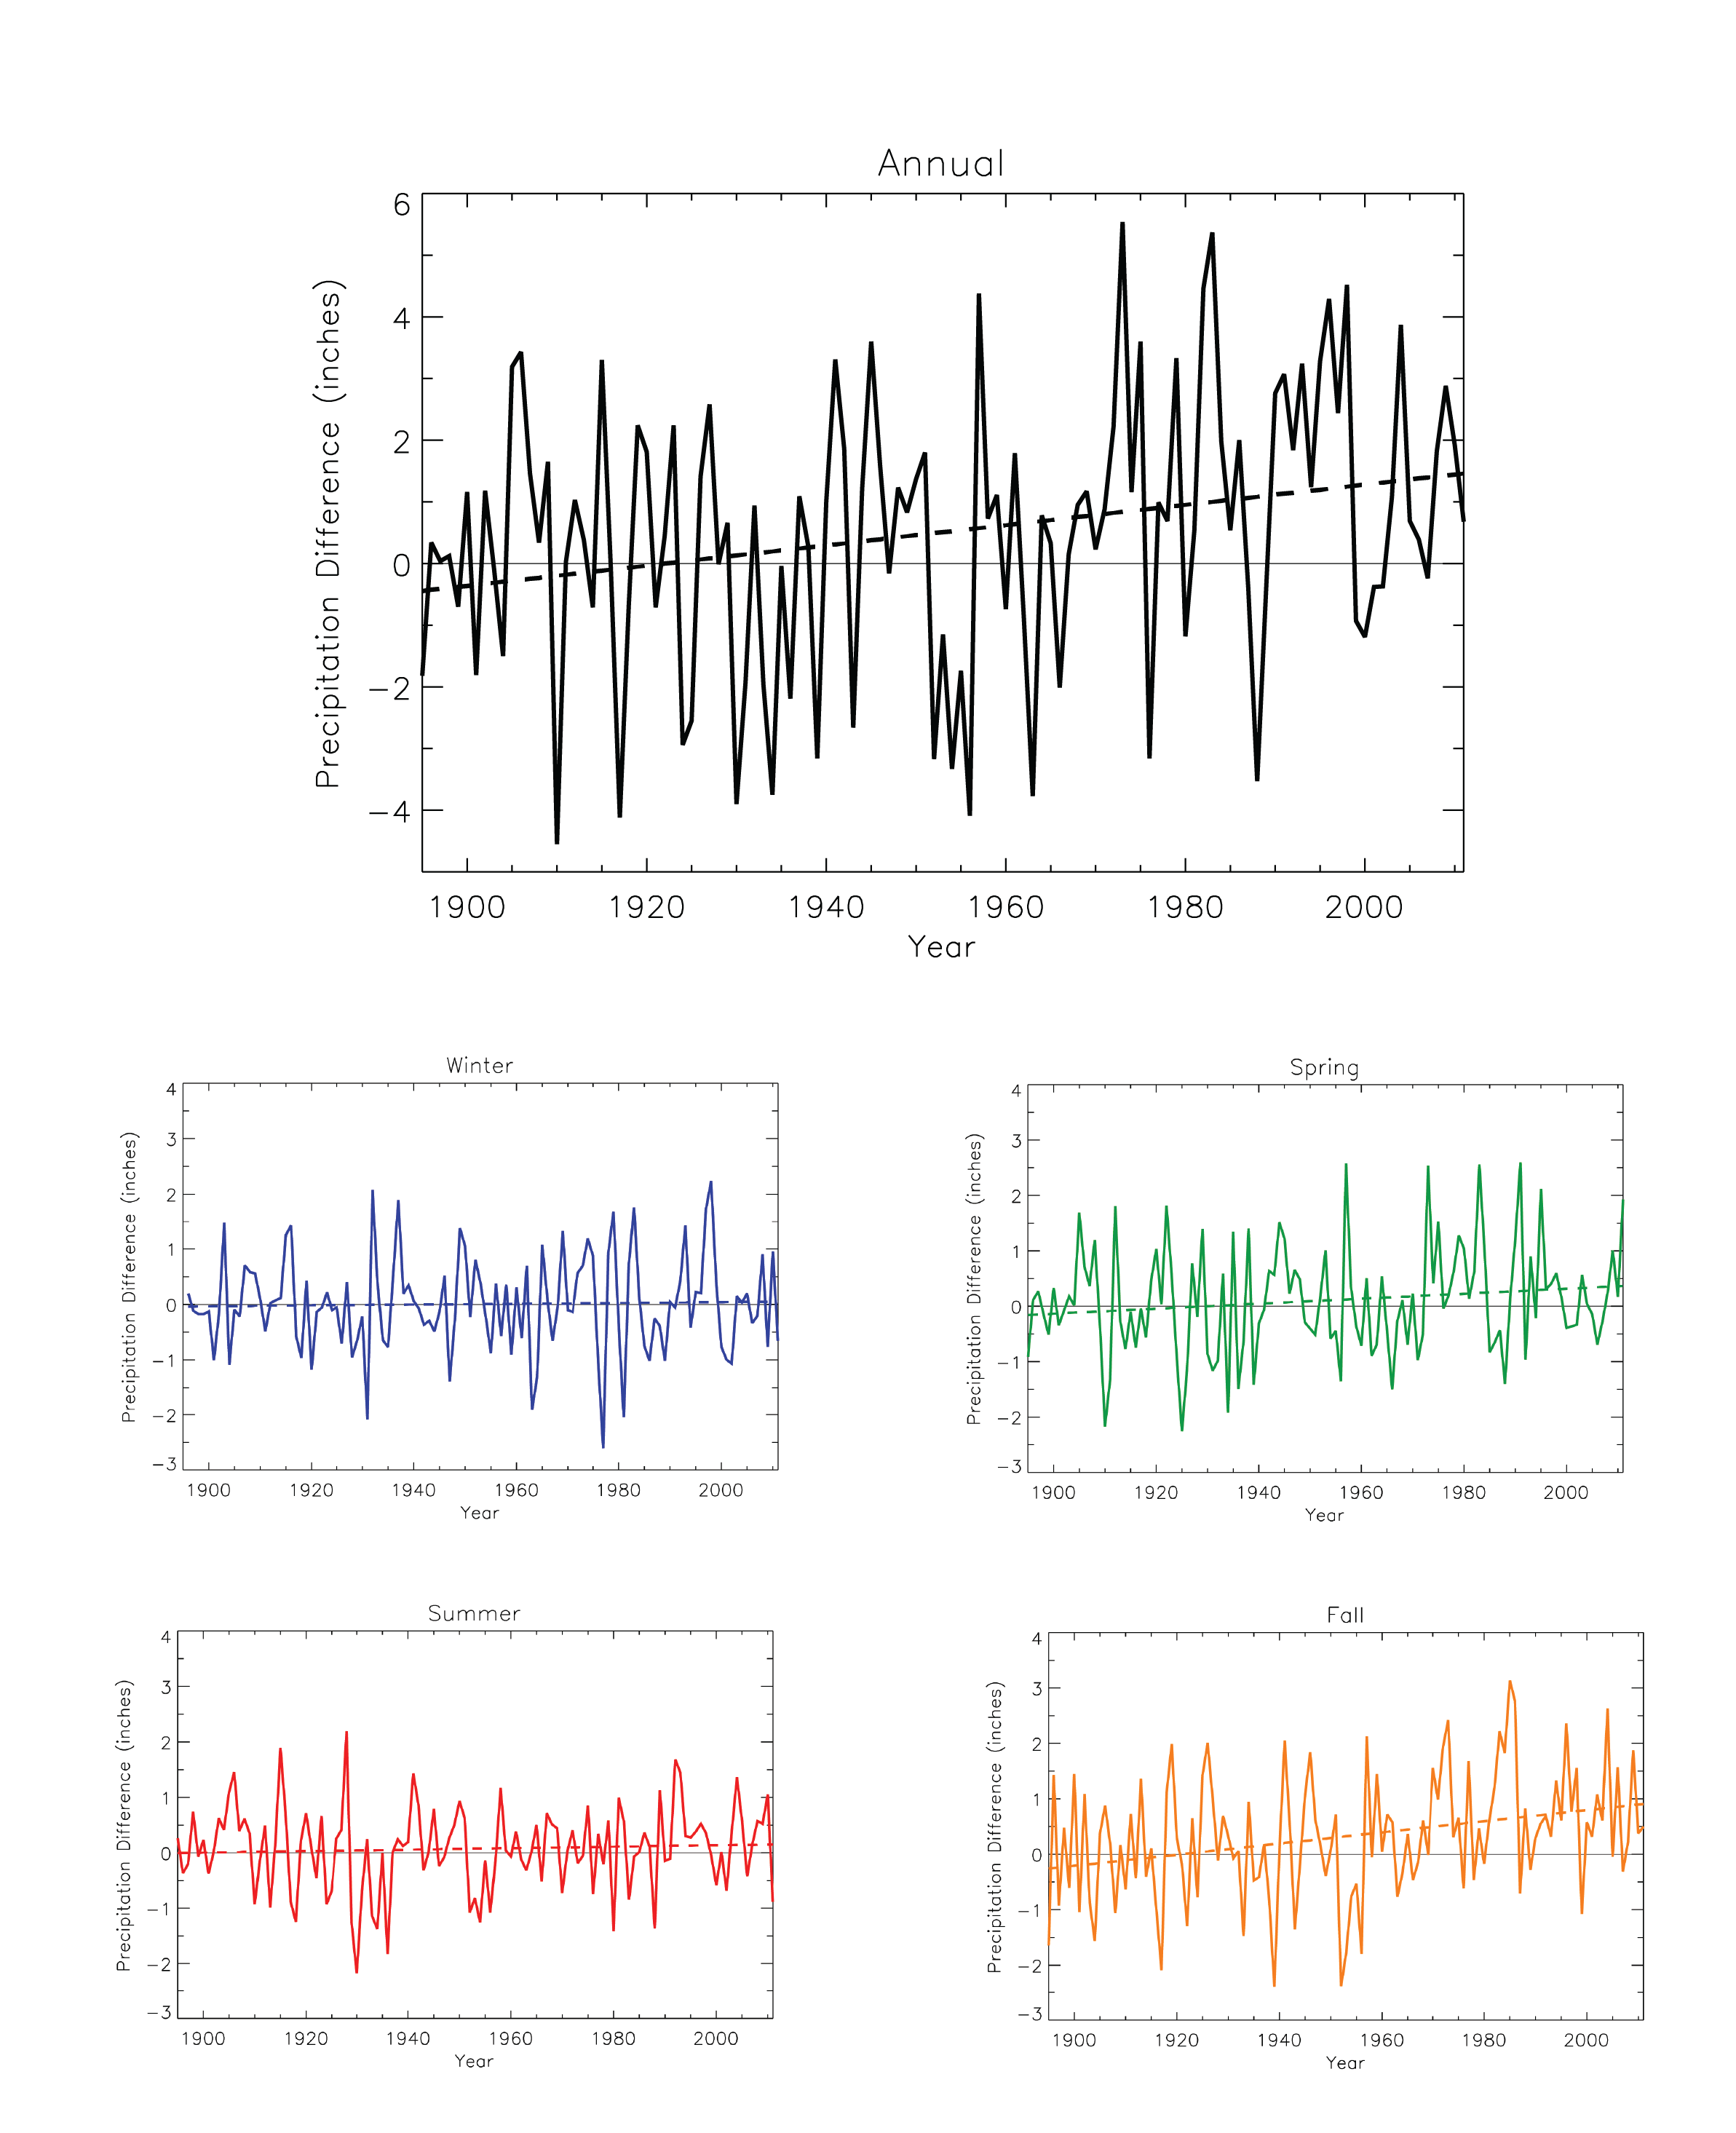 |
|
Annual and seasonal precipitation anomaly |
Observed |
Precipitation |
Great Plains |
Regional Climate Trends and Scenarios for the U.S. National Climate Assessment. Part 4. Climate of the U.S. Great Plains |
NCA 3 |
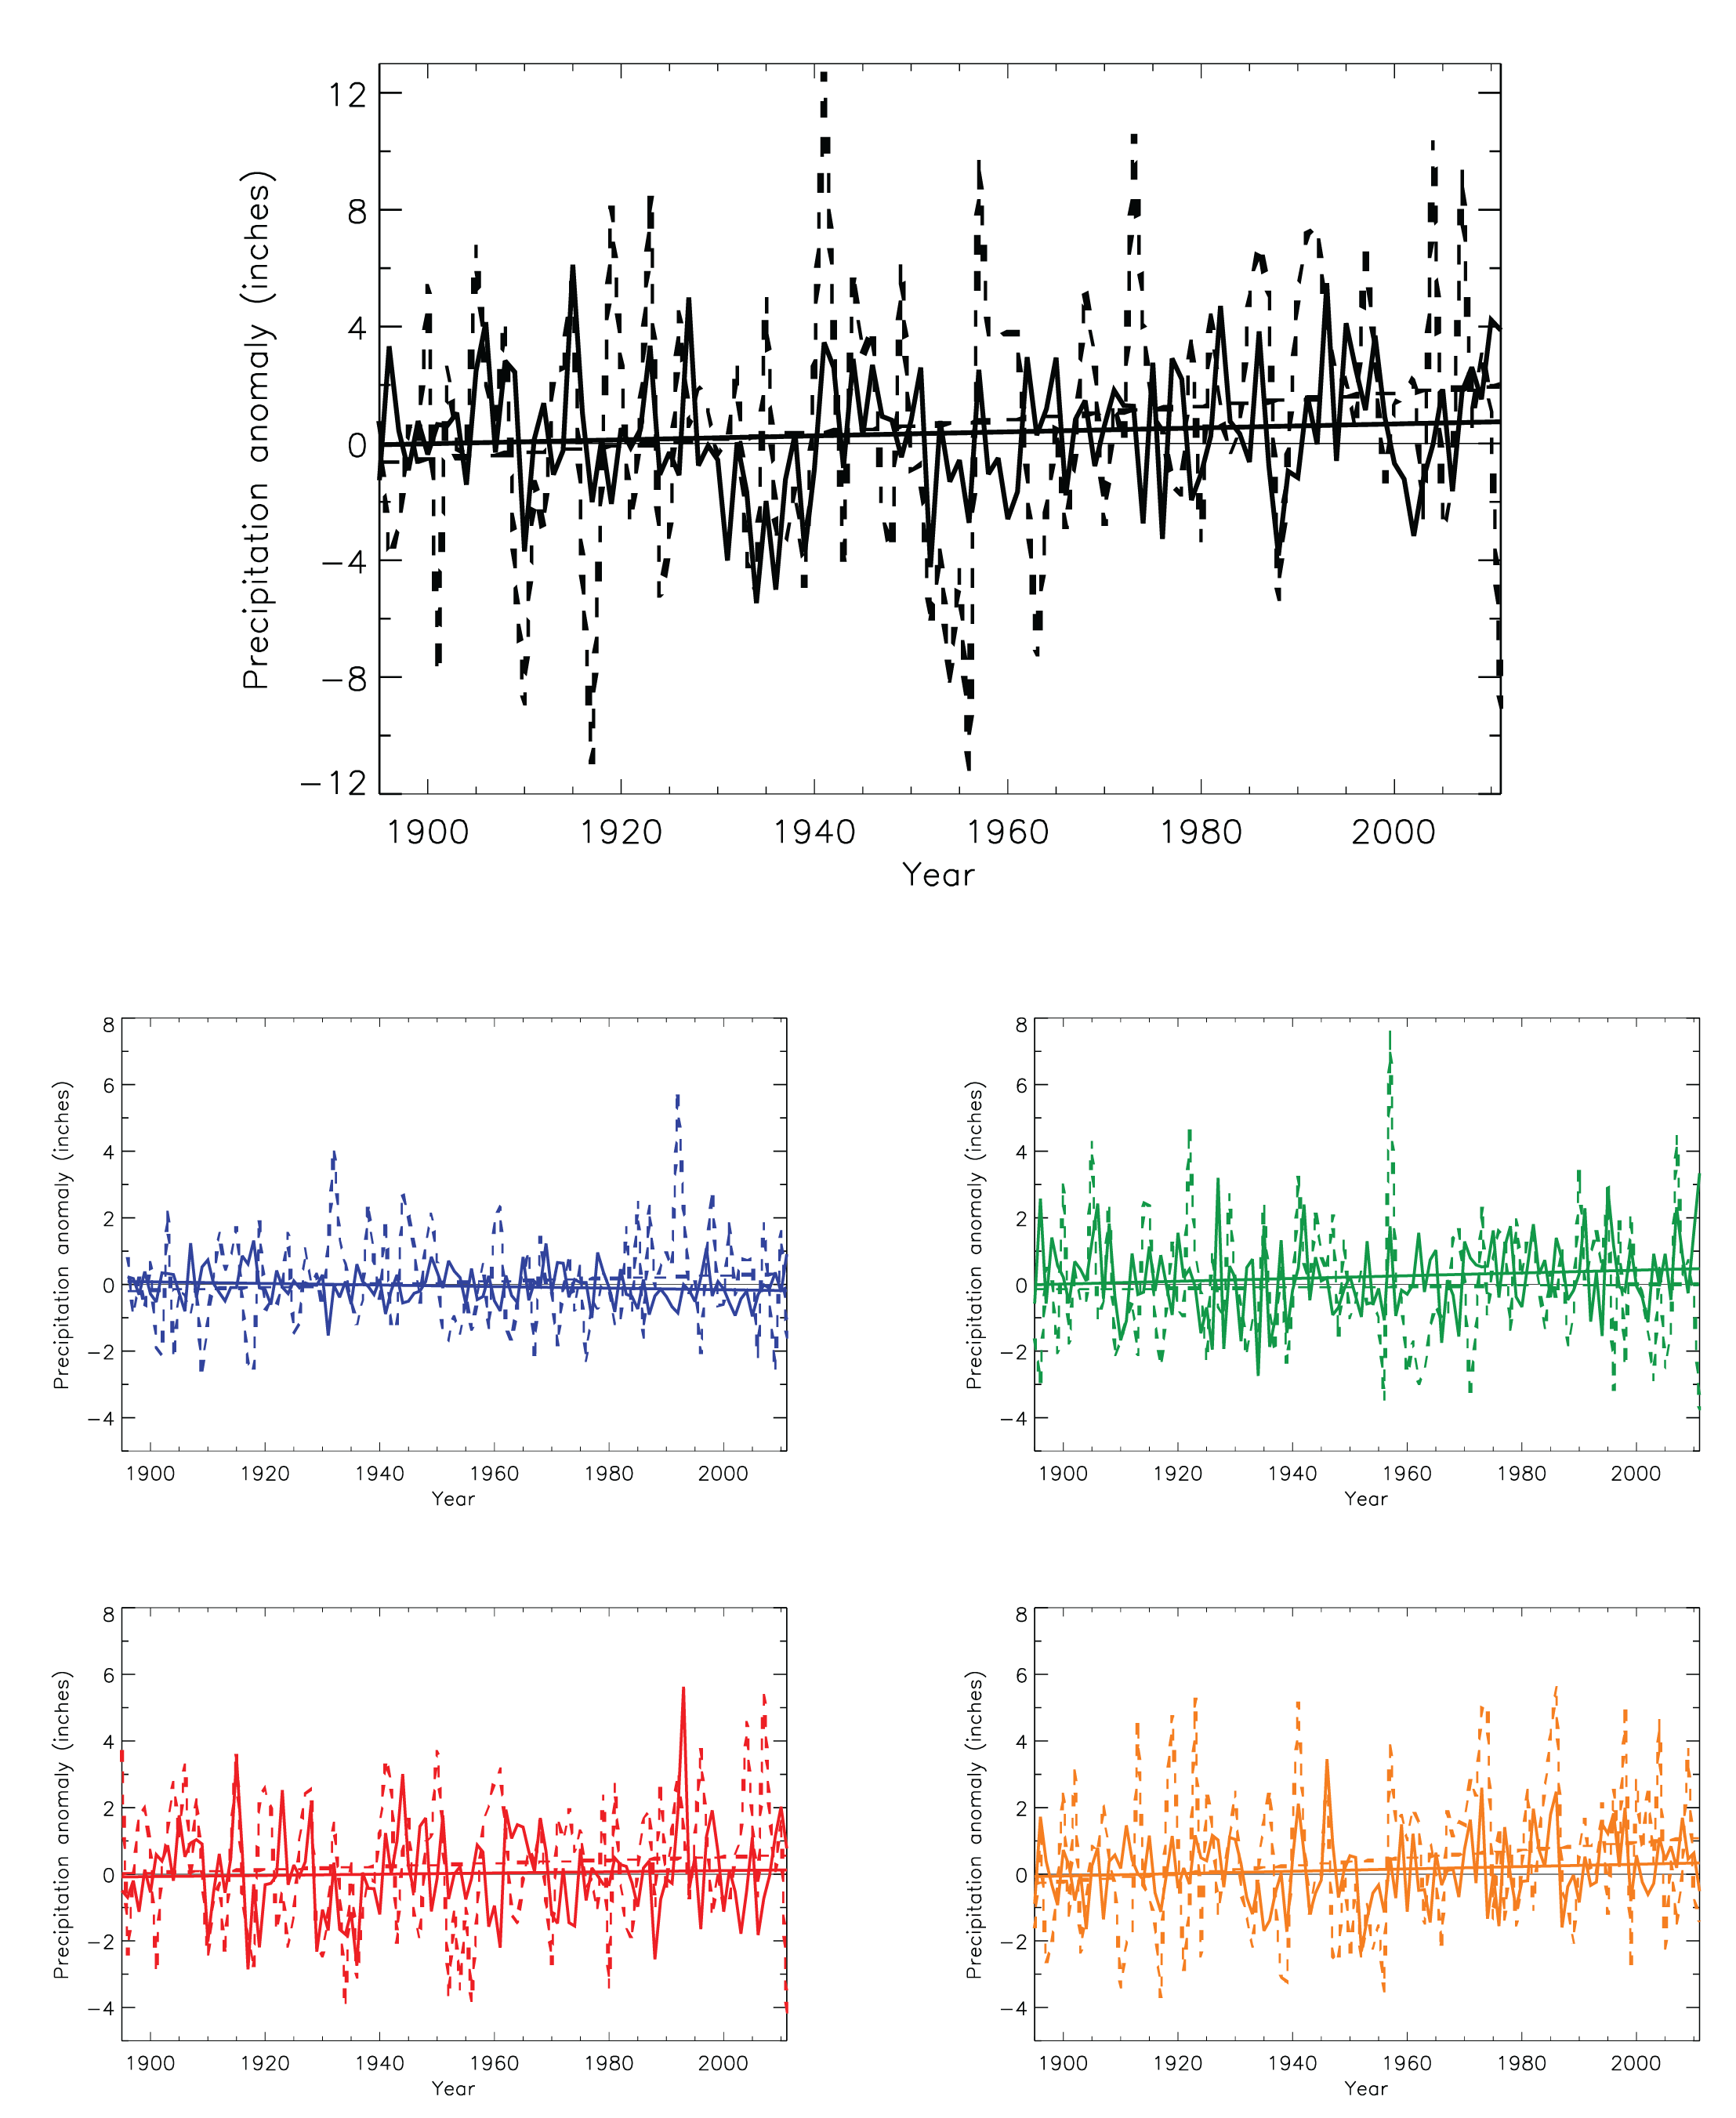 |
|
Annual and seasonal precipitation anomaly |
Observed |
Precipitation |
Northeast |
Regional Climate Trends and Scenarios for the U.S. National Climate Assessment. Part 1. Climate of the Northeast U.S. |
NCA 3 |
 |
|
Annual and seasonal precipitation anomaly |
Observed |
Precipitation |
Southeast and Caribbean |
Regional Climate Trends and Scenarios for the U.S. National Climate Assessment. Part 2. Climate of the Southeast U.S. |
NCA 3 |
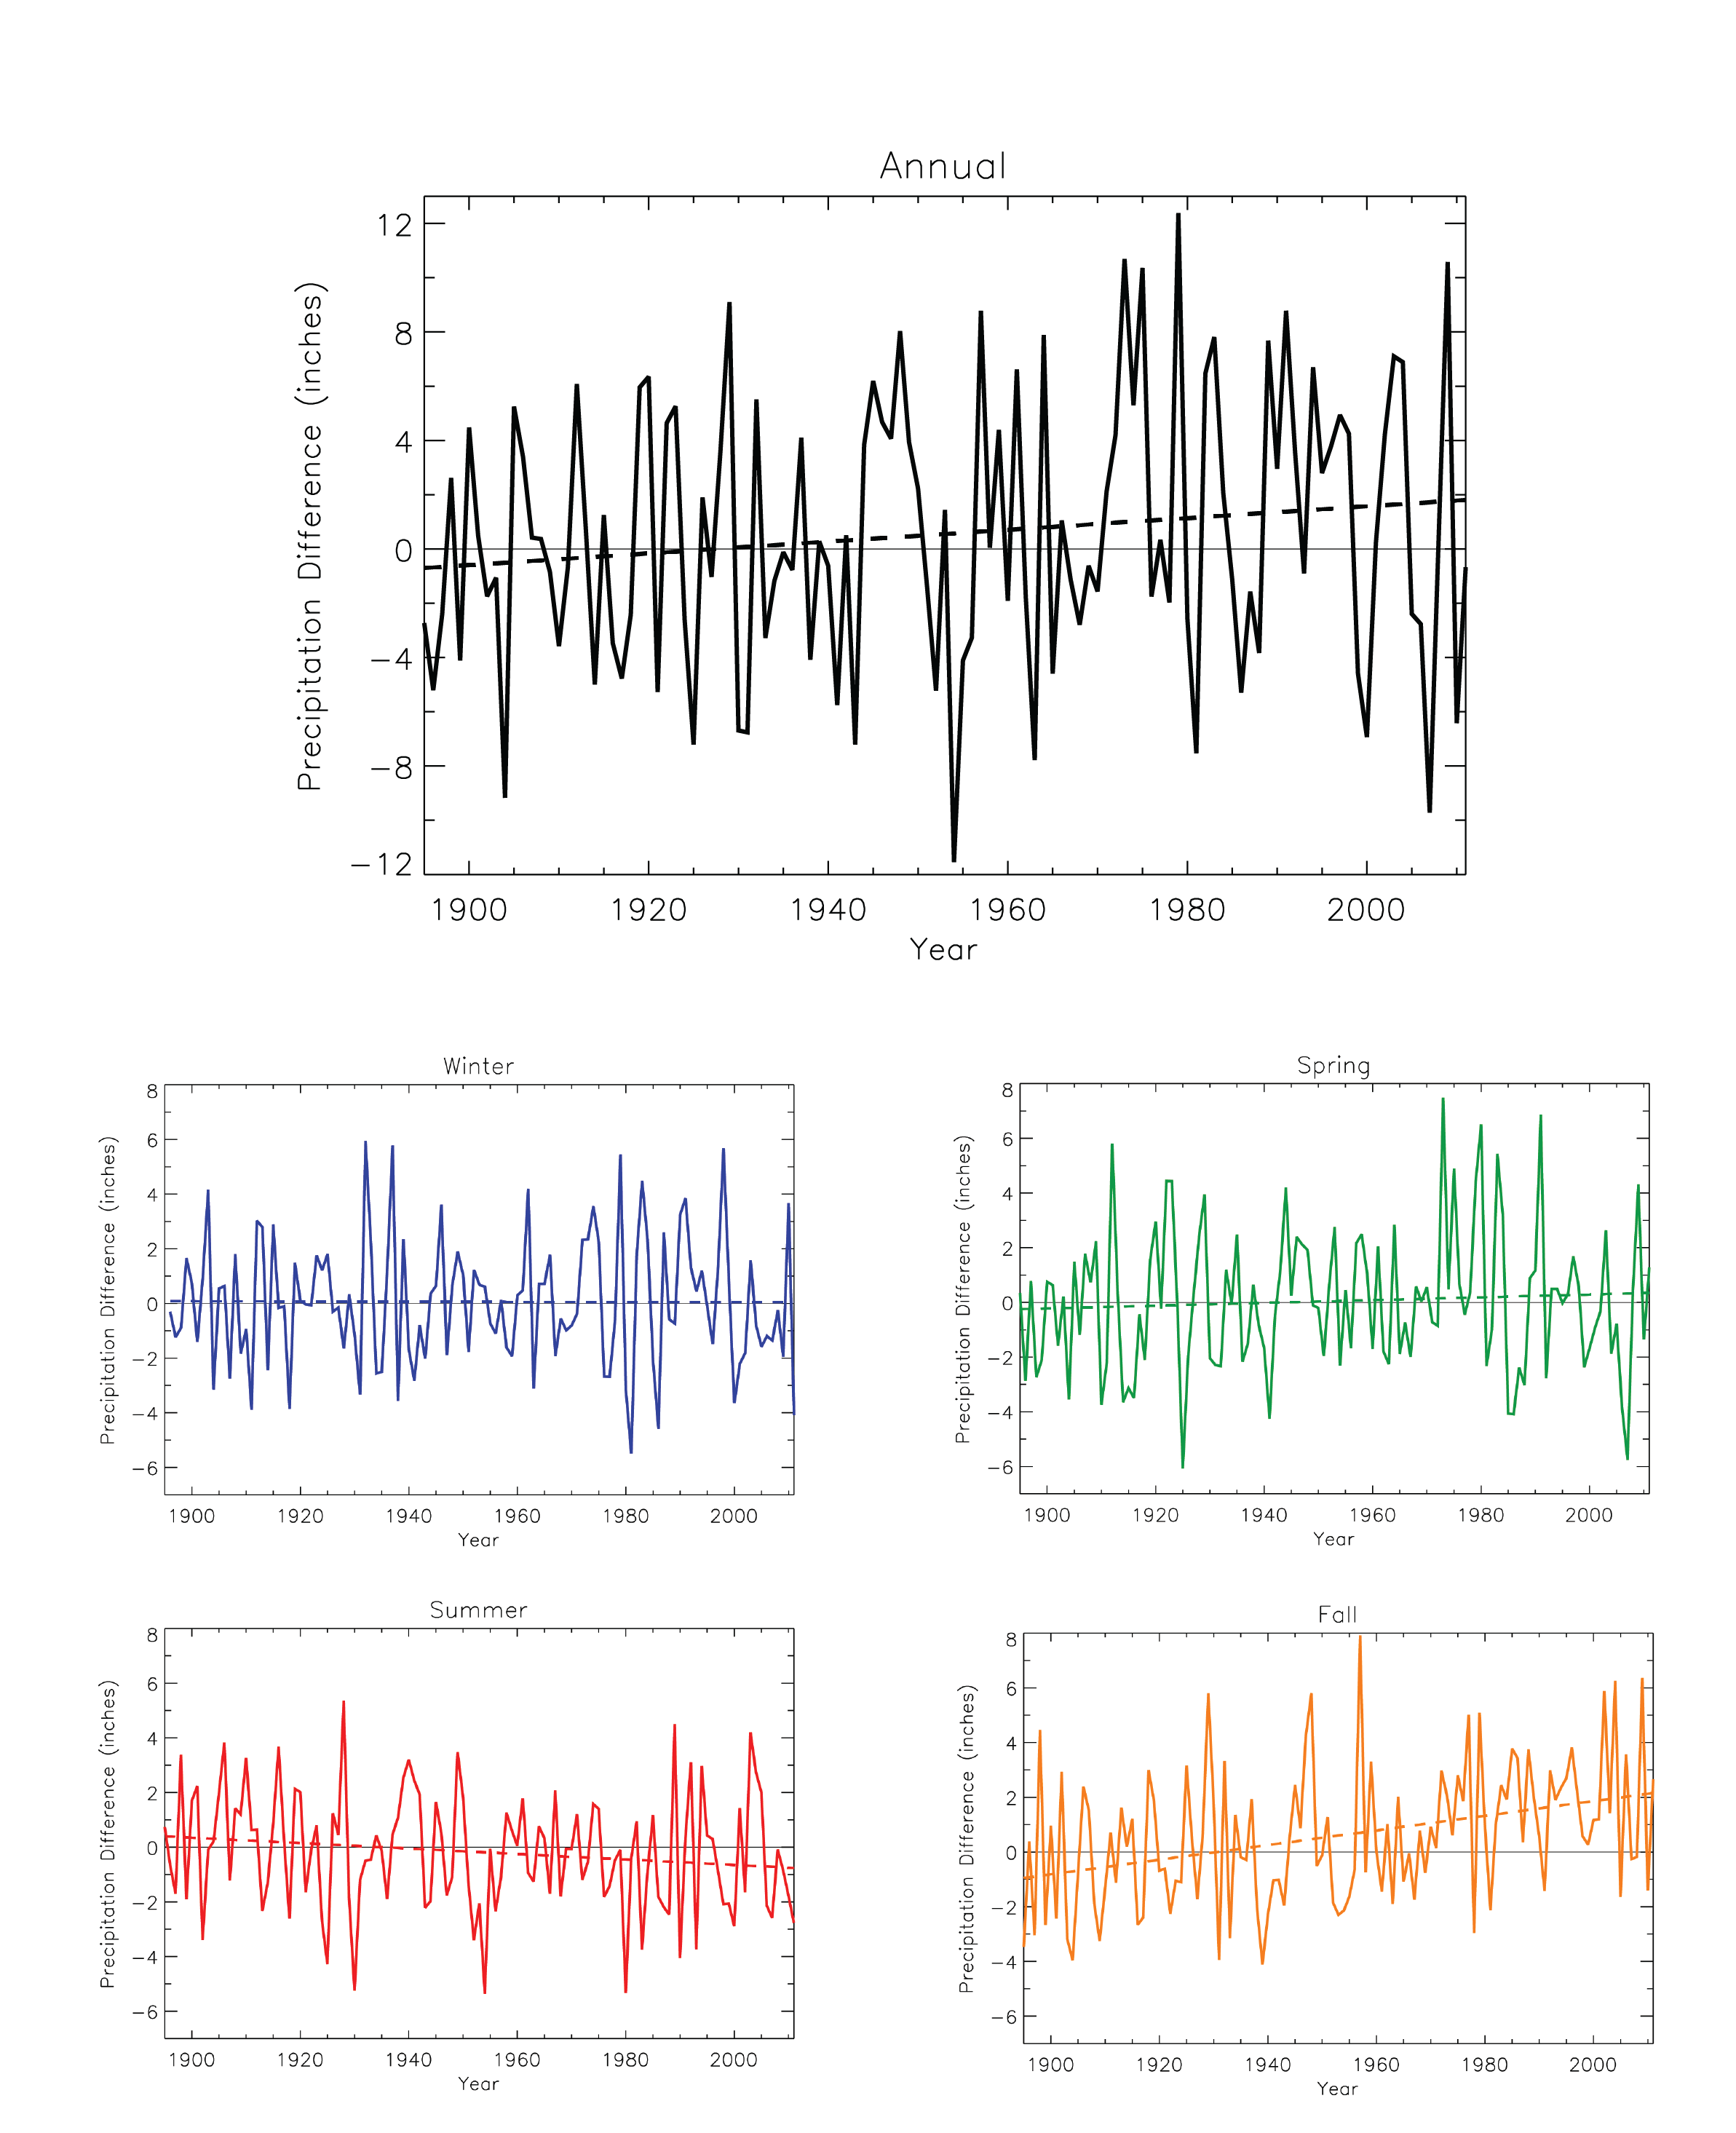 |
|
Annual and seasonal precipitation anomaly |
Observed |
Precipitation |
Southwest |
Regional Climate Trends and Scenarios for the U.S. National Climate Assessment. Part 5. Climate of the Southwest U.S. |
NCA 3 |
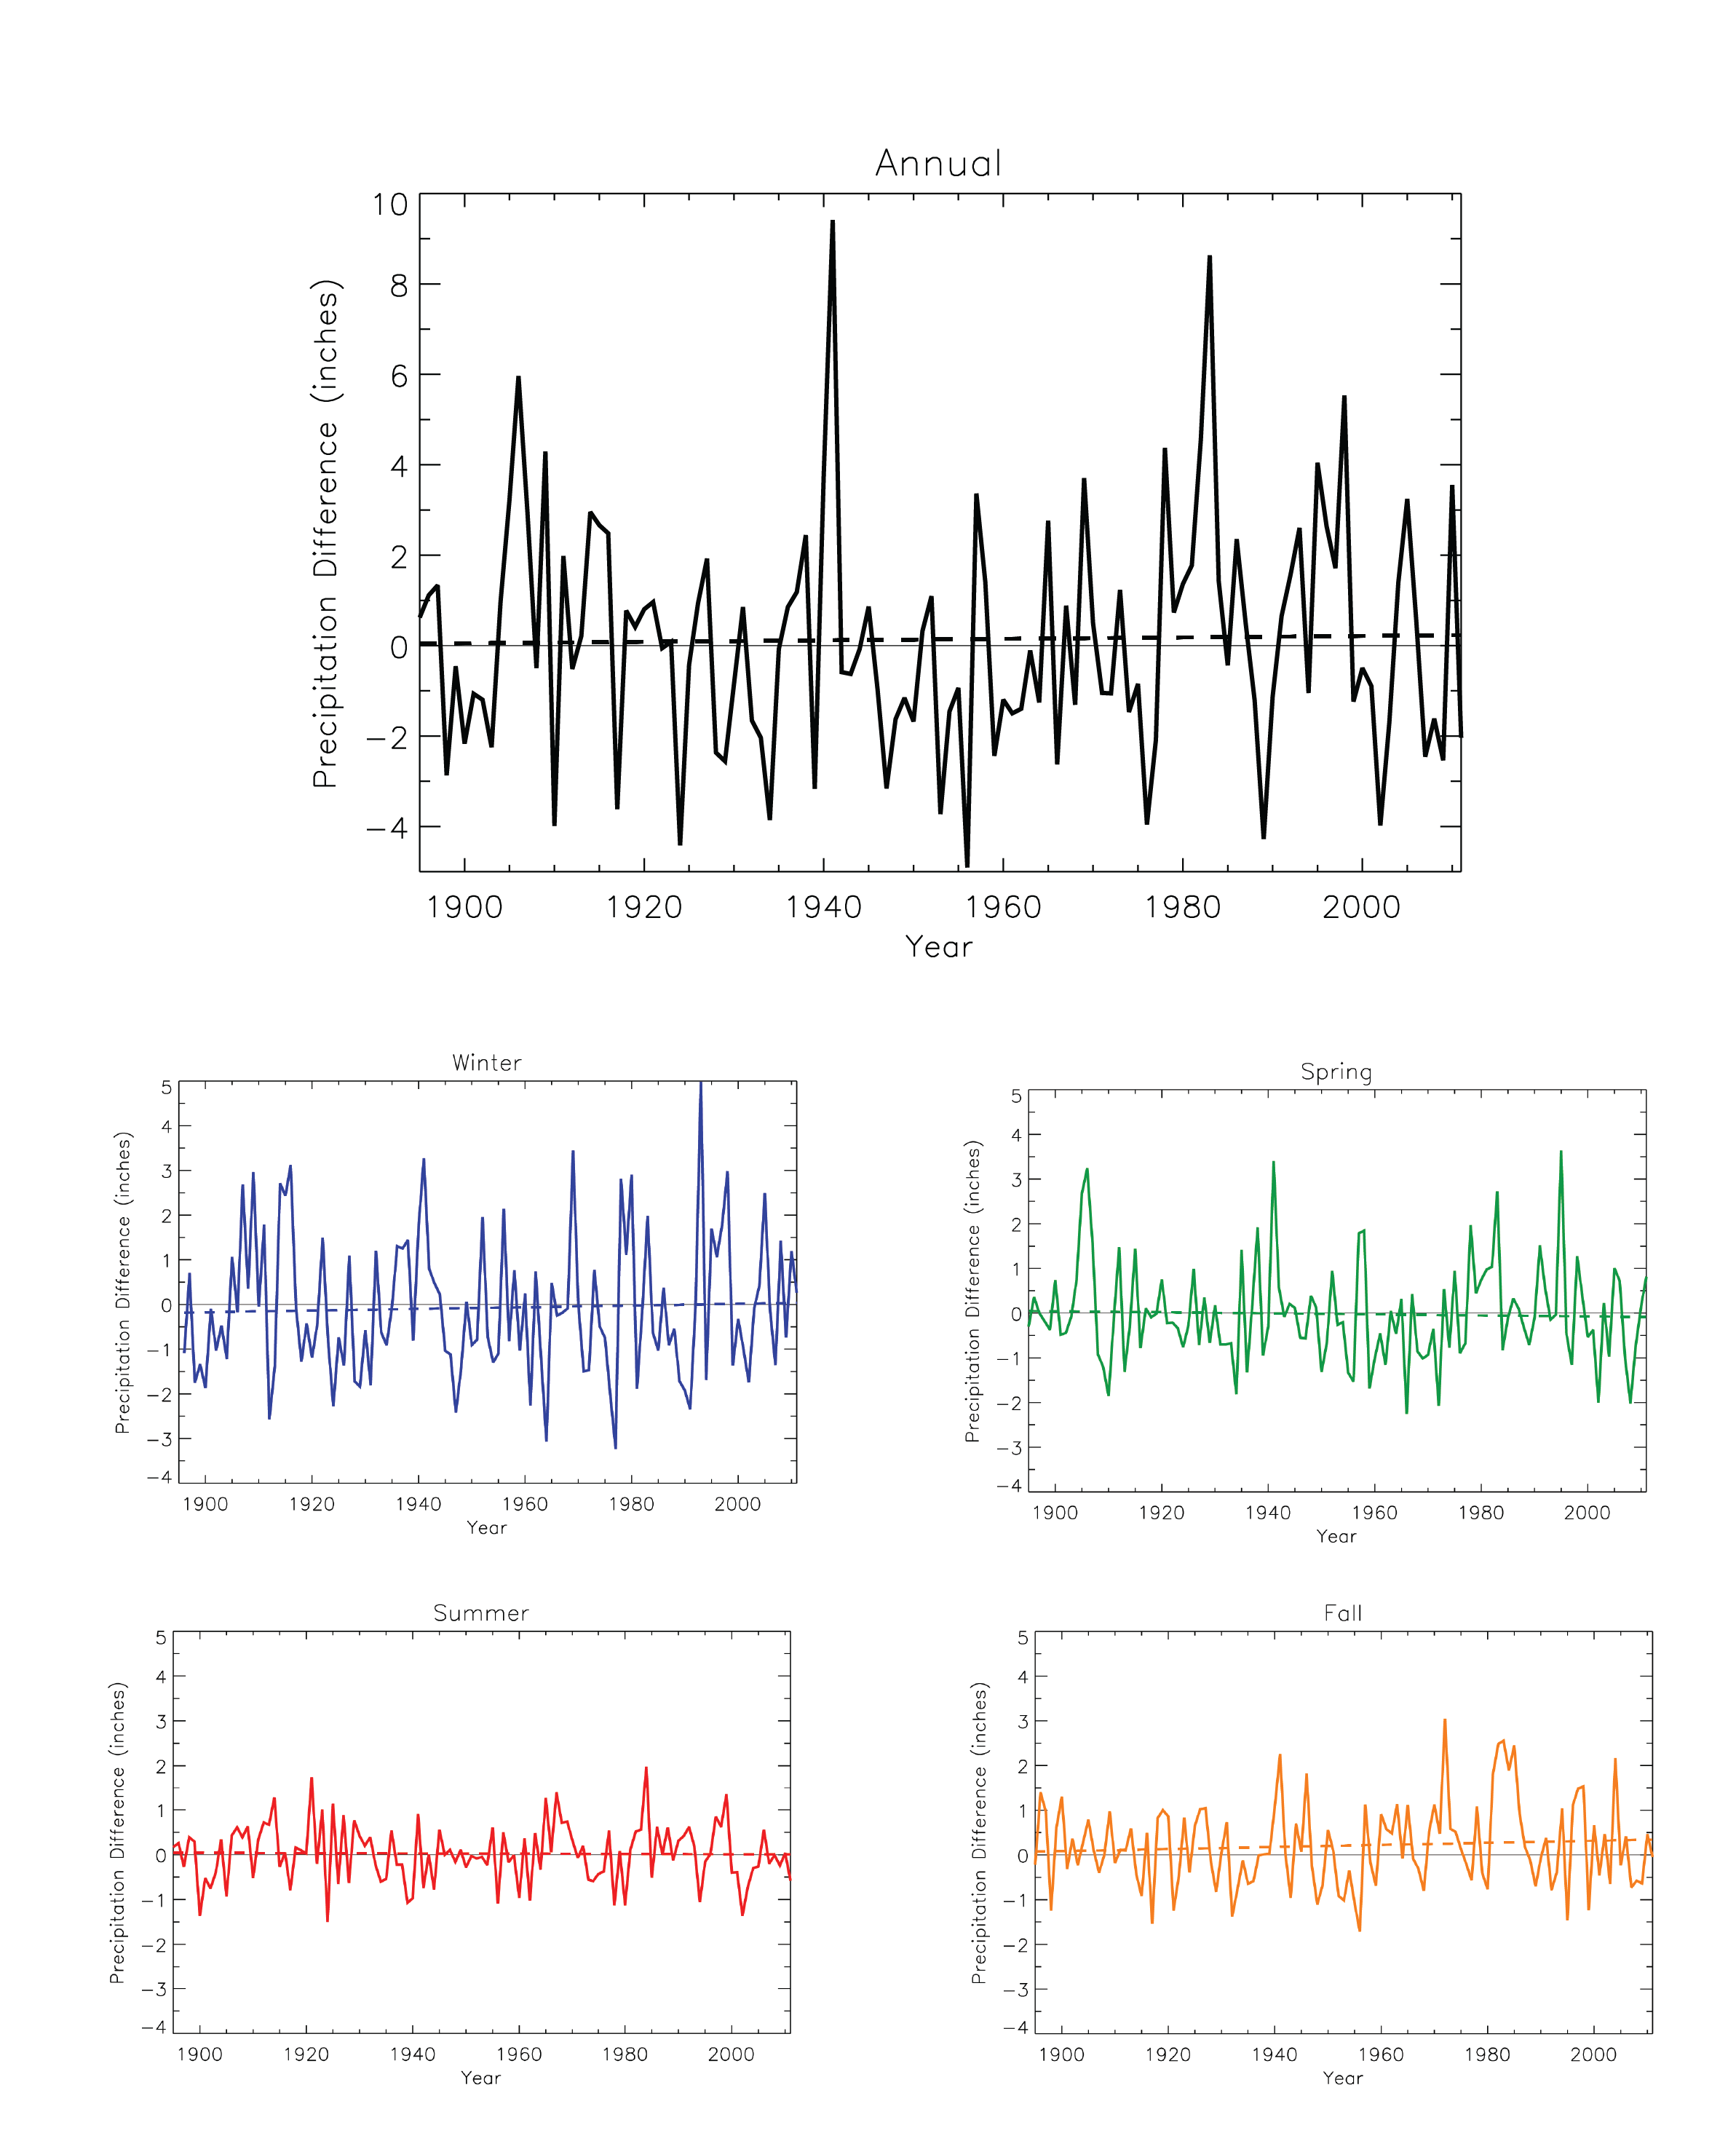 |
|
Annual and seasonal precipitation anomaly |
Observed |
Precipitation |
Northwest |
Regional Climate Trends and Scenarios for the U.S. National Climate Assessment. Part 6. Climate of the Northwest U.S. |
NCA 3 |
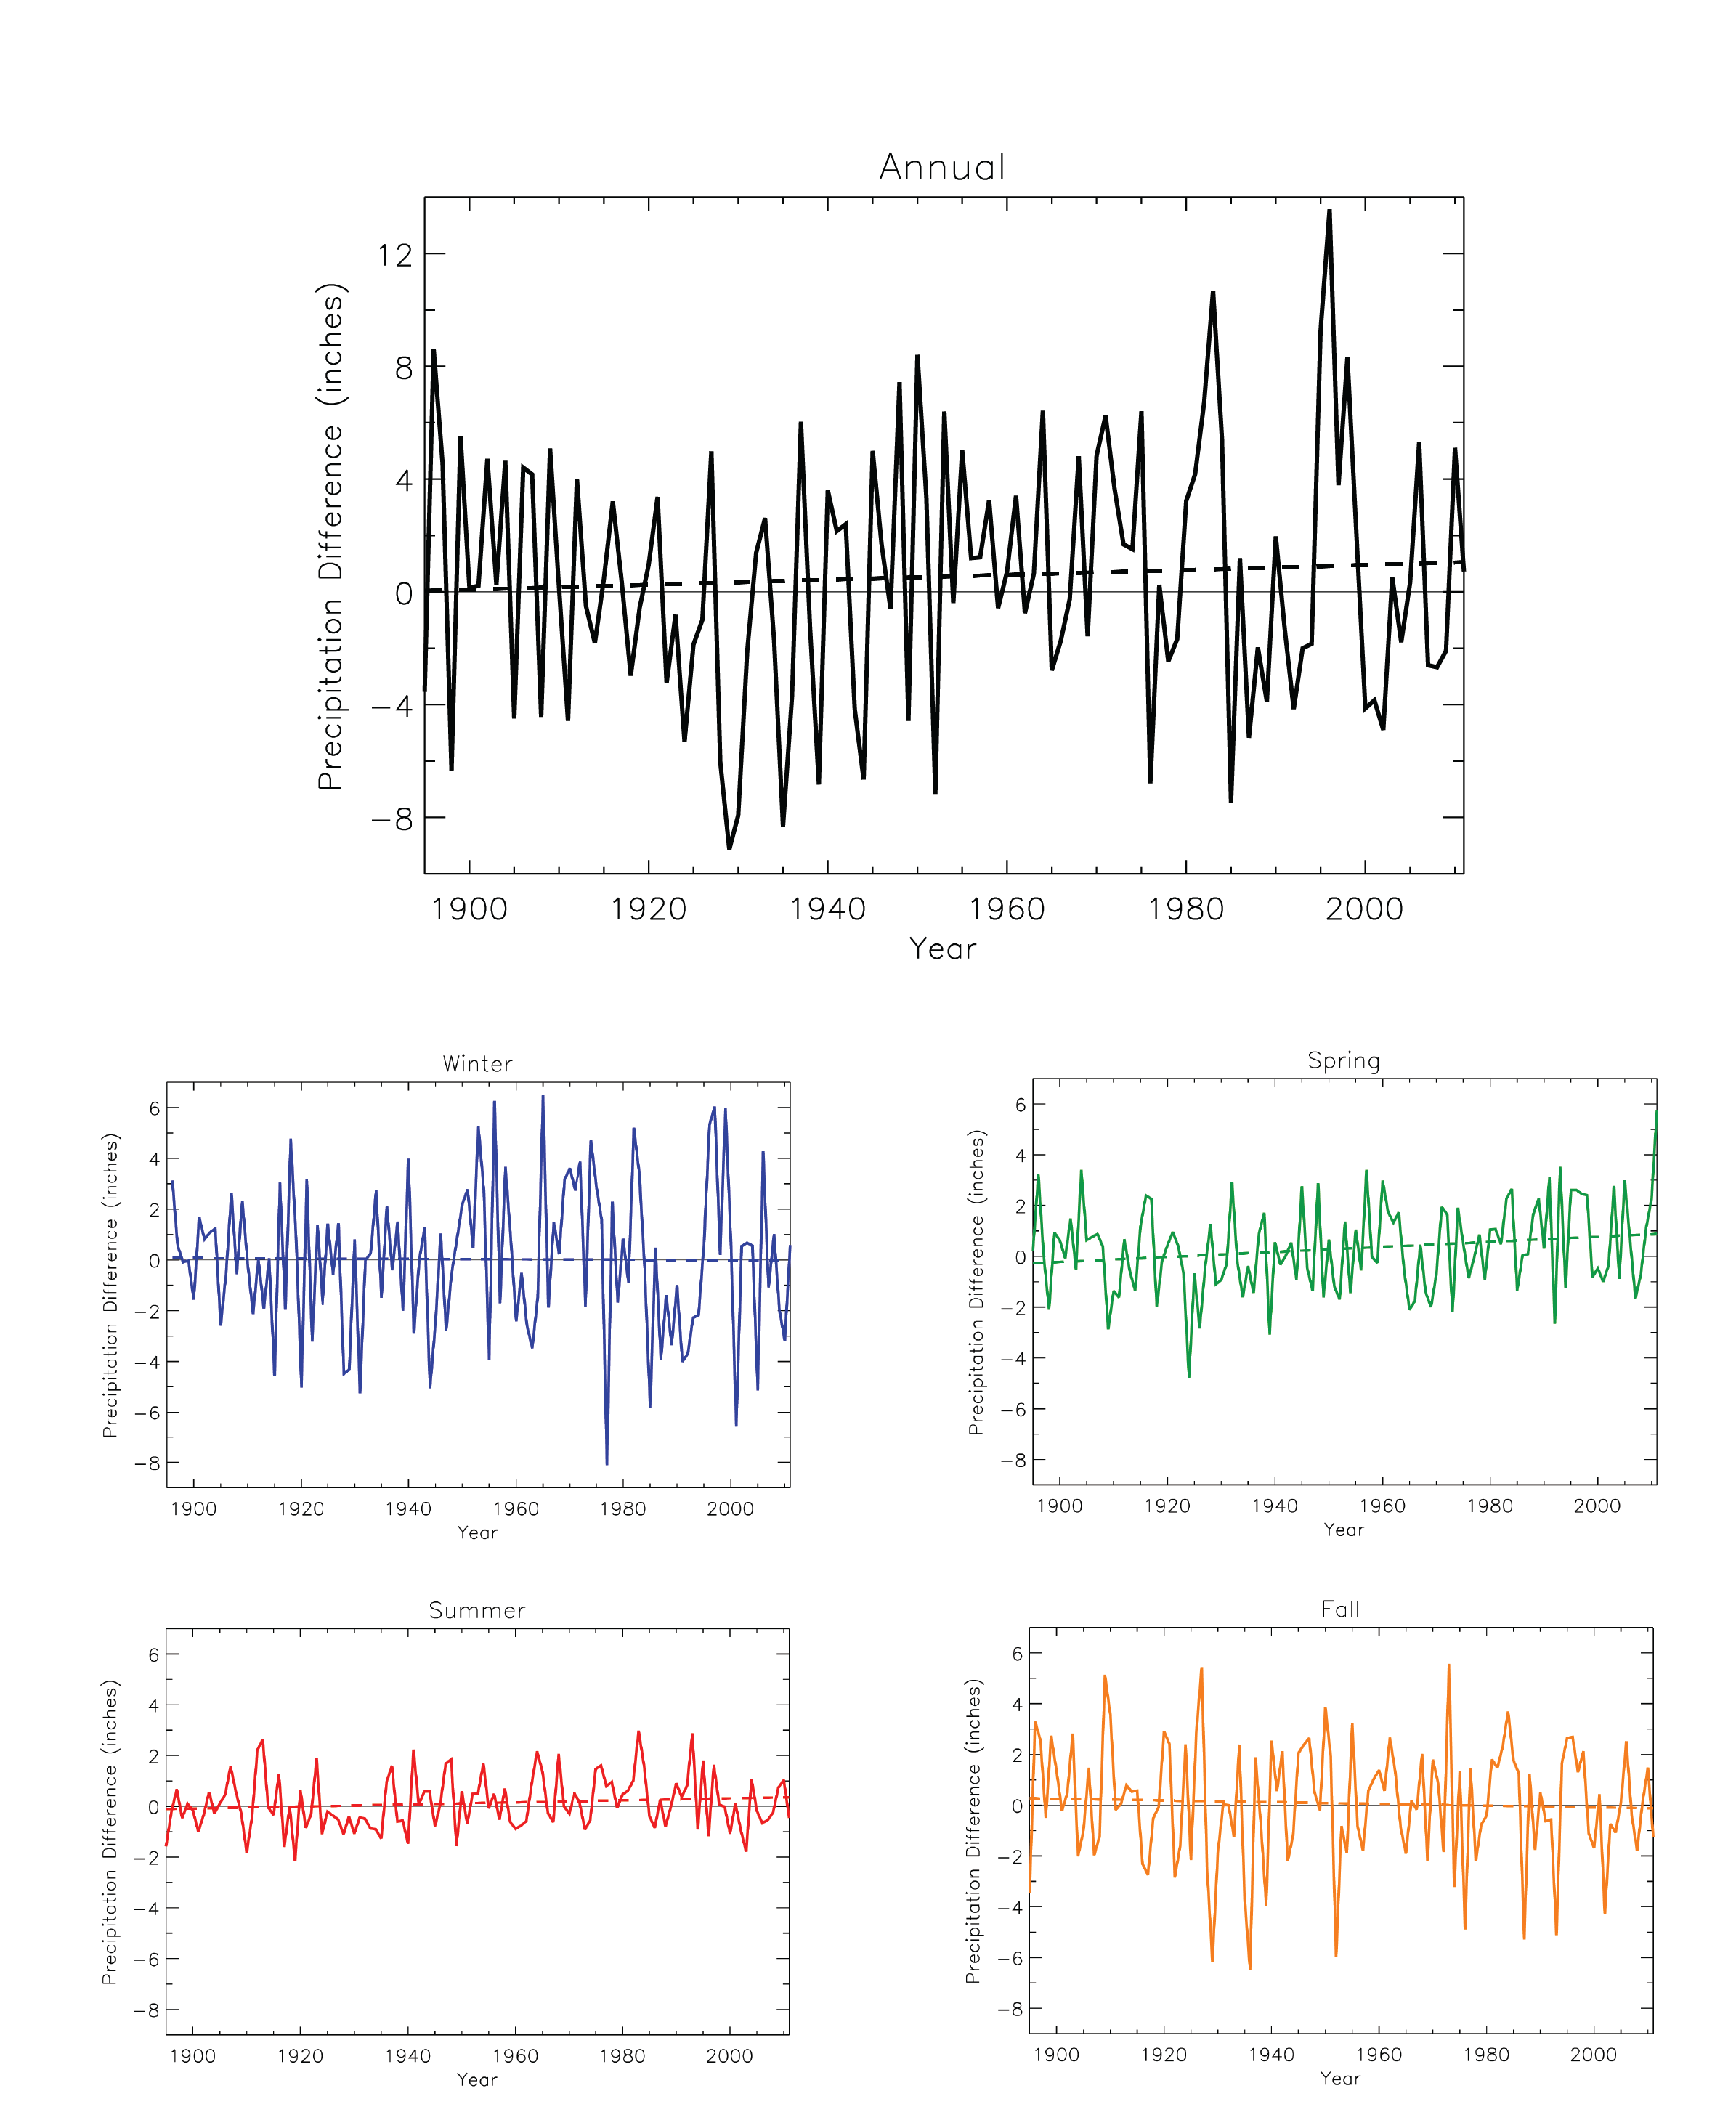 |
|
Annual and seasonal precipitation anomaly |
Observed |
Precipitation |
Midwest |
Regional Climate Trends and Scenarios for the U.S. National Climate Assessment. Part 3. Climate of the Midwest U.S. |
NCA 3 |
 |
|
(a) Least squares trends in satellite altimetry sea level height (SLH) across the North Pacific at (b) San Francisco (SFO) and (c) La Jolla (SIO) |
Observed |
Sea |
Northwest |
Global Sea Level Rise Scenarios for the United States National Climate Assessment |
NCA 3 |
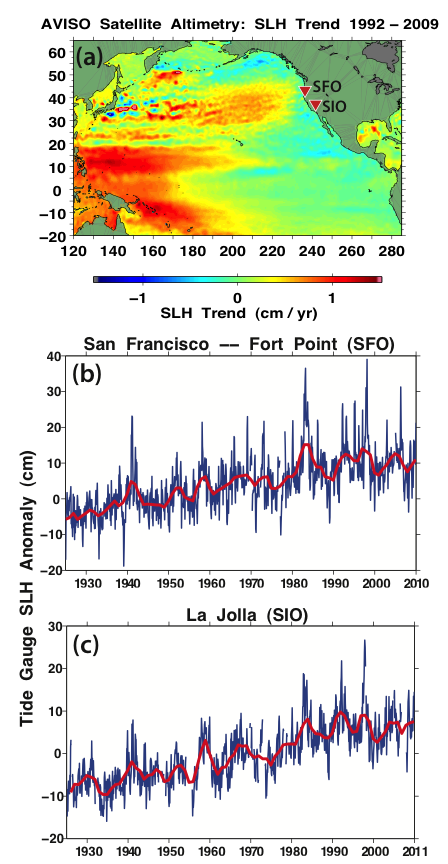 |
|
(a) Average annual precipitation during the top 10 wettest days in a year for for the Midwest region (b) Trend in the sum of the top 10 wettest days in a year for for the Midwest region |
Observed |
Precipitation |
Midwest |
Regional Climate Trends and Scenarios for the U.S. National Climate Assessment. Part 3. Climate of the Midwest U.S. |
NCA 3 |
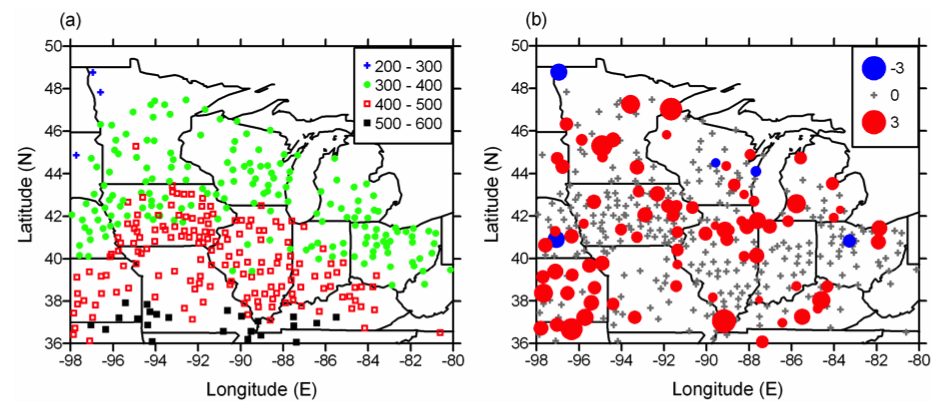 |