General Information
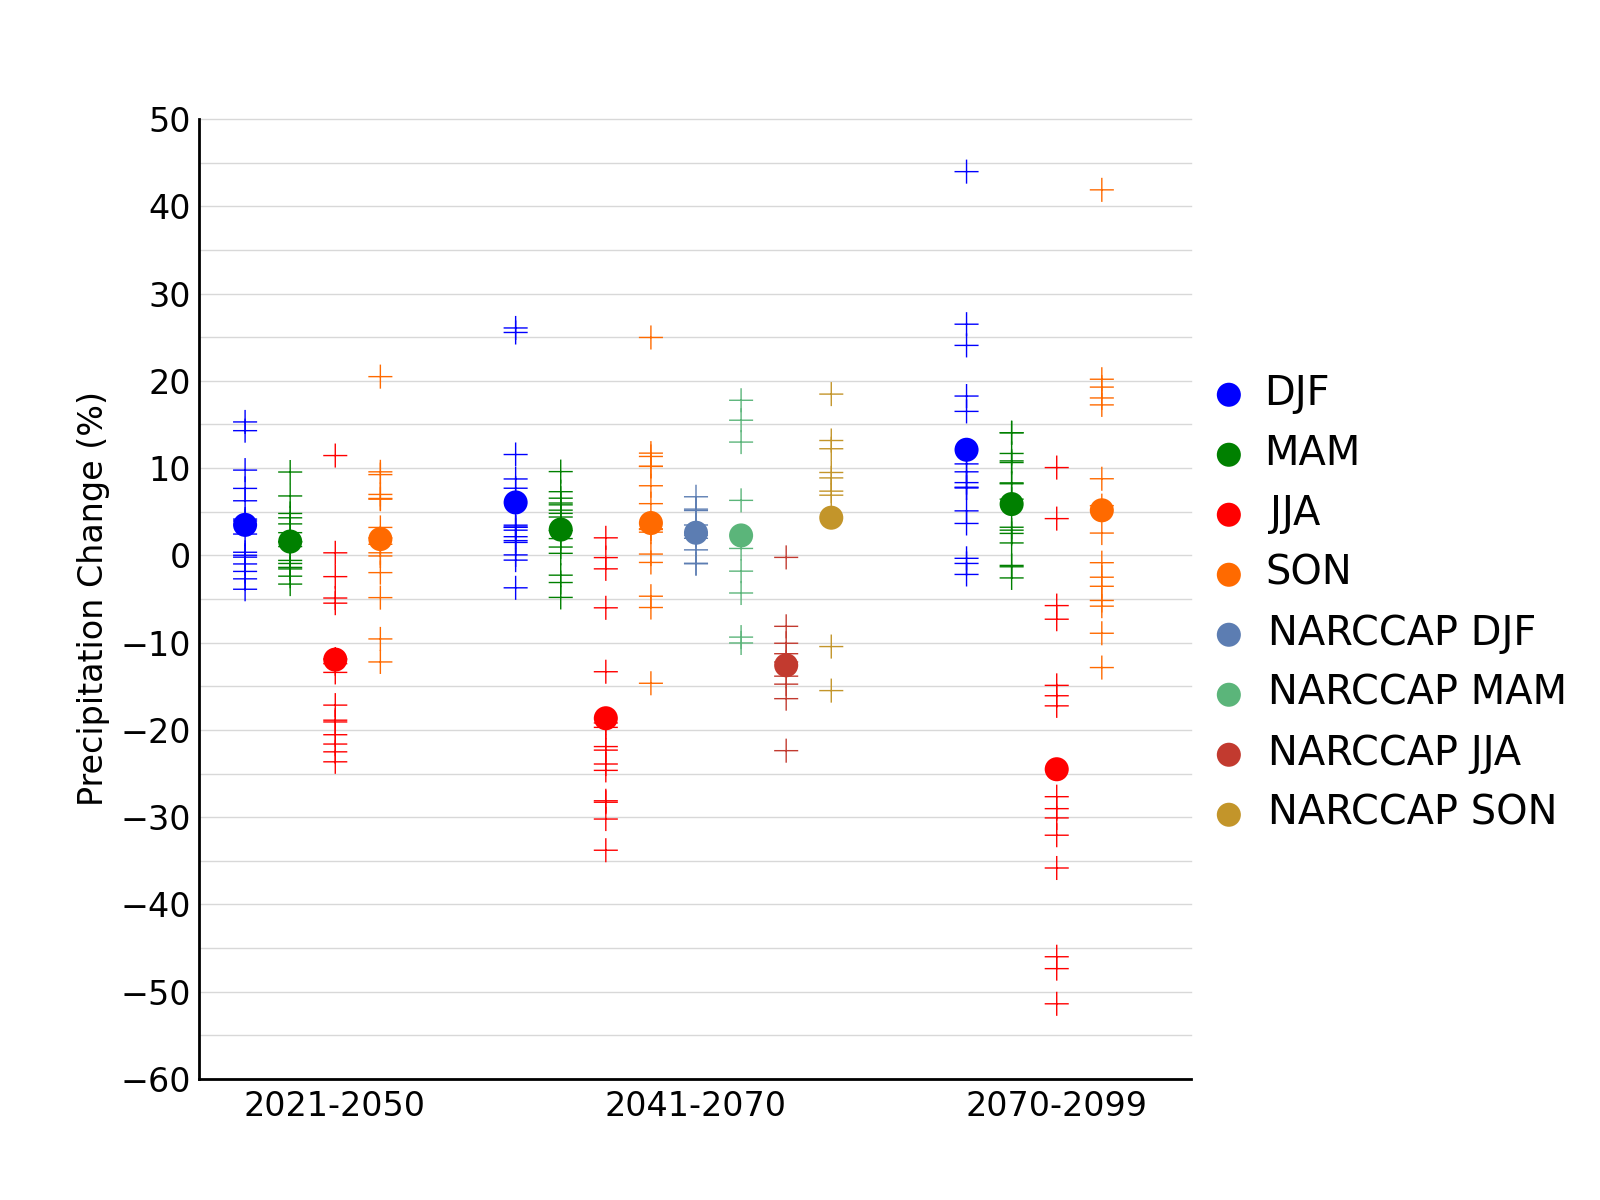
Simulated seasonal mean precipitation change (%) for the Northwest region, for each future time period (2021-2050, 2041-2070, and 2070-2099) with respect to the reference period of 1971-1999. Values are given for all 15 CMIP3 models for the high (A2) emissions scenario. Also shown are values (relative to 1971-2000) for 9 NARCCAP models for 2041-2070. The small plus signs indicate each individual model and the circles depict the multi-model means. Seasons are indicated as follows: winter (DJF, December-January-February), spring (MAM, March-April-May), summer (JJA, June-July-August), and fall (SON, September-October-November). The ranges of model-simulated changes are large compared to the mean changes and to differences between the seasons.
Data Type:
Simulated
Variable Type:
Precipitation
Region:
Metadata
Metadata File(s):
Files