General Information
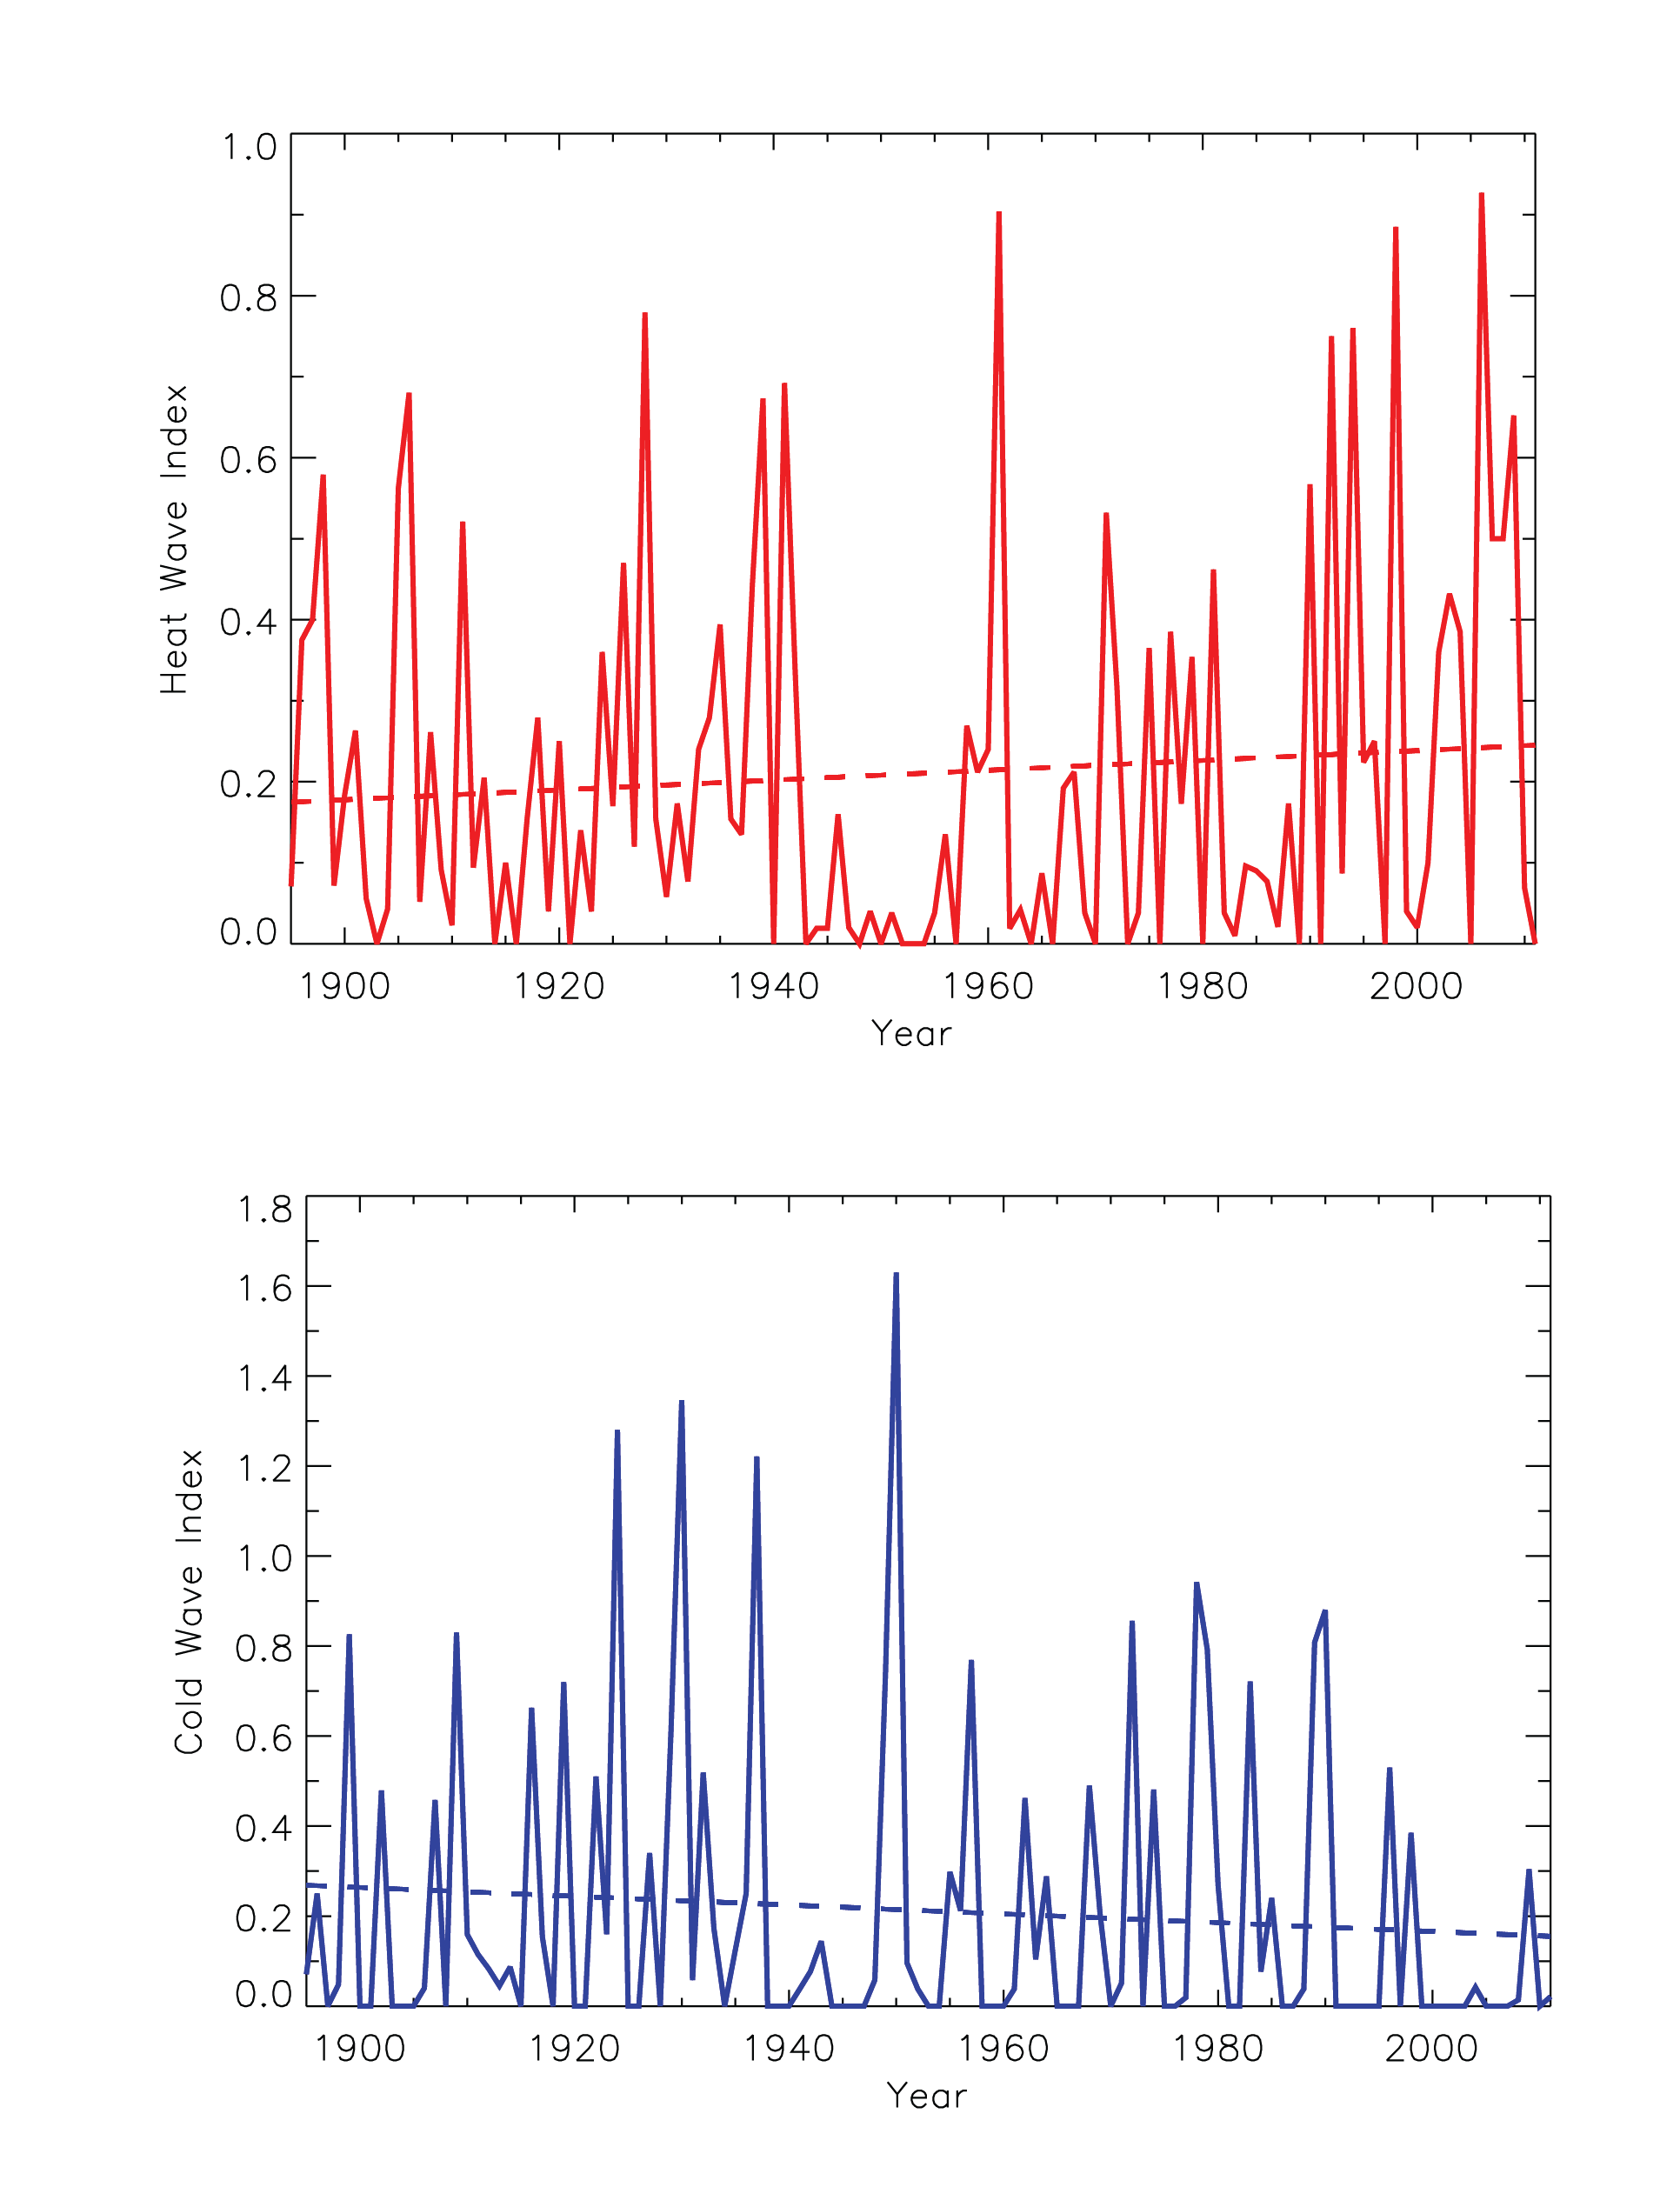
Time series of an index for the occurrence of heat waves (top) and cold waves (bottom), defined as 4-day periods that are hotter and colder, respectively, than the threshold for a 1 in 5-year recurrence, for the Northwest region. The dashed line is a linear fit. Based on daily COOP data from long-term stations in the National Climatic Data Centers Global Historical Climate Network data set. Only stations with less than 10% missing daily temperature data for the period 1895-2011 are used in this analysis. Events are first identified for each individual station by ranking all 4-day period mean temperature values and choosing the highest (heat waves) and lowest (cold waves) non-overlapping N/5 events, where N is the number of years of data for that particular station. Then, event numbers for each year are averaged for all stations in each 1x1 degree grid box. Finally, a regional average is determined by averaging the values for the individual grid boxes. This regional average is the index. The upward trend in heat waves is not statistically significant. The highest number of intense heat waves occurred in the 1930s and 2000s. The overall trend in cold waves is also not statistically significant. The number of intense cold wave events has been low during the last 15 years.
Data Type:
Observed
Variable Type:
Temperature
Region:
Source Information
Data Source(s):
Image Source:
Laura Stevens
Metadata
Metadata File(s):
Files