General Information
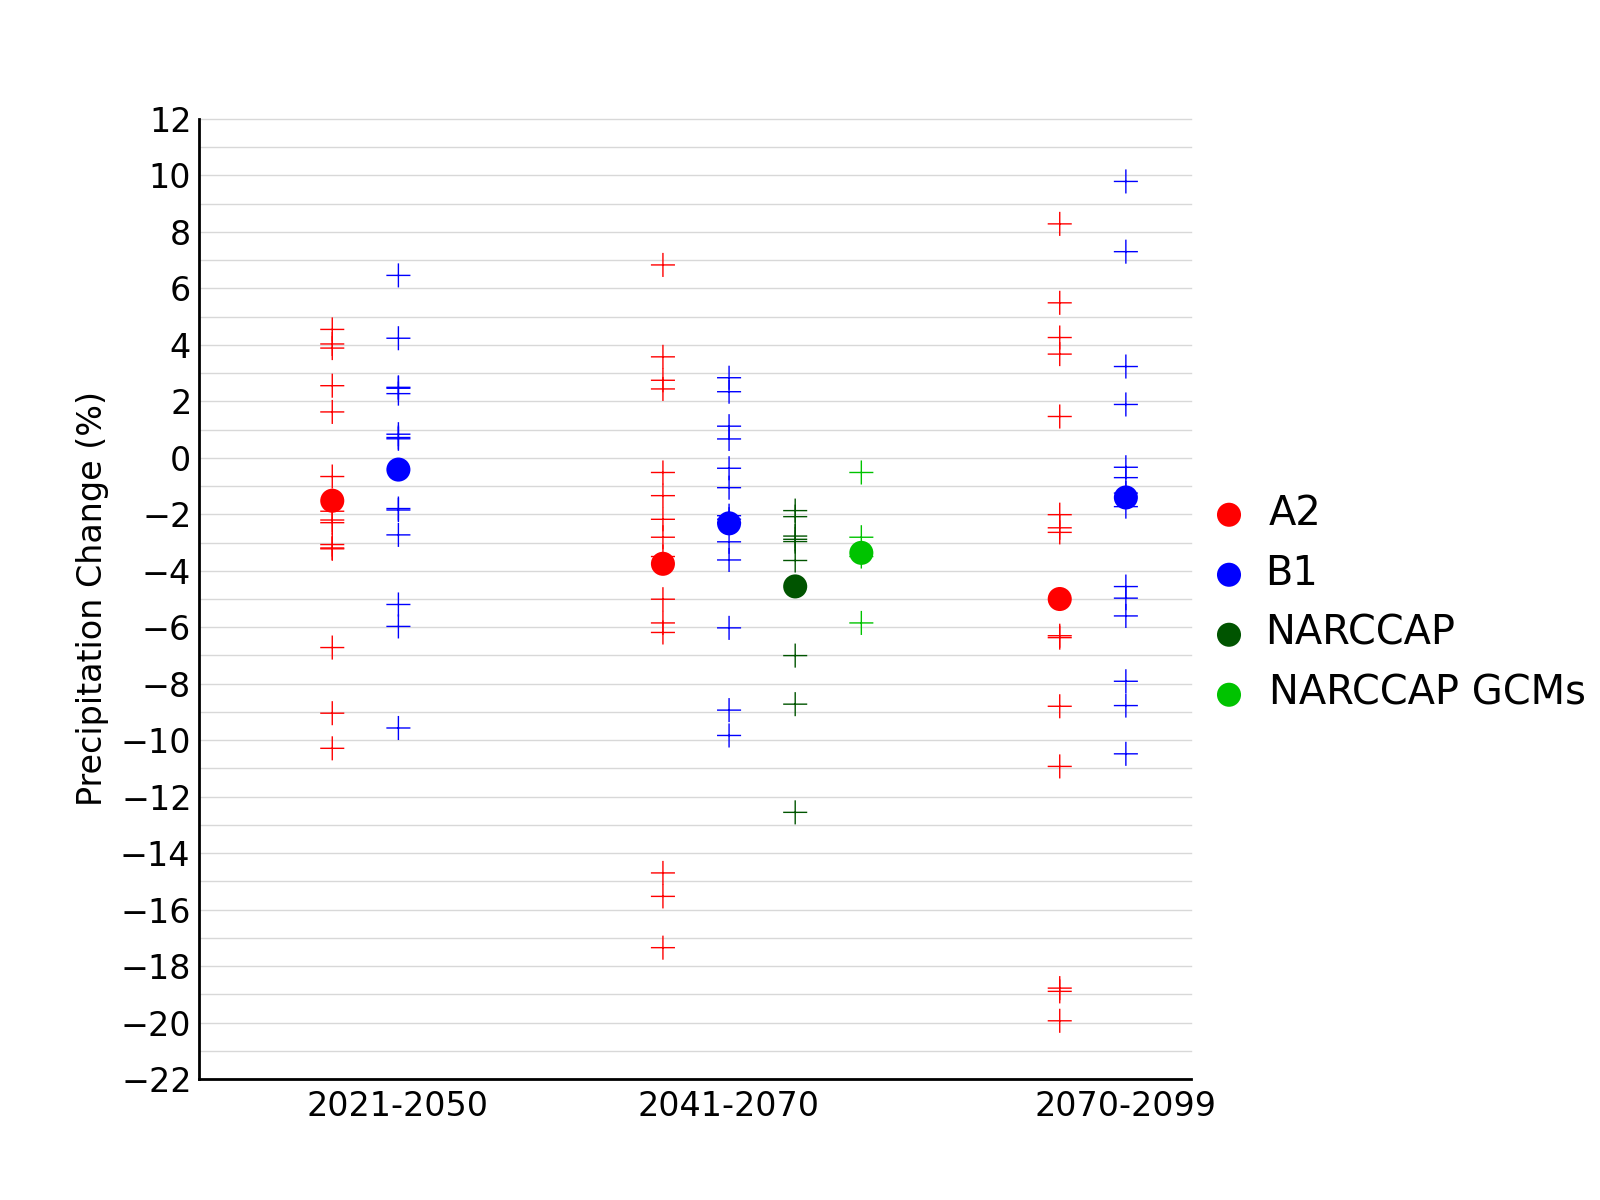
Simulated annual mean precipitation change (%) for the Southwest region, for each future time period (2021-2050, 2041-2070, and 2070-2099) with respect to the reference period of 1971-1999. Values are given for the high (A2) and low (B1) emissions scenarios for the 14 (B1) or 15 (A2) CMIP3 models. Also shown for 2041-2070 (high emissions scenario only) are values for 9 NARCCAP models, as well as for the 4 GCMs used to drive the NARCCAP simulations. The small plus signs indicate each individual model and the circles depict the multi-model means. The range of model-simulated changes is very large compared to the mean changes and to differences between the A2 and B1 scenarios.
Data Type:
Simulated
Variable Type:
Precipitation
Region:
Metadata
Metadata File(s):
Files