General Information
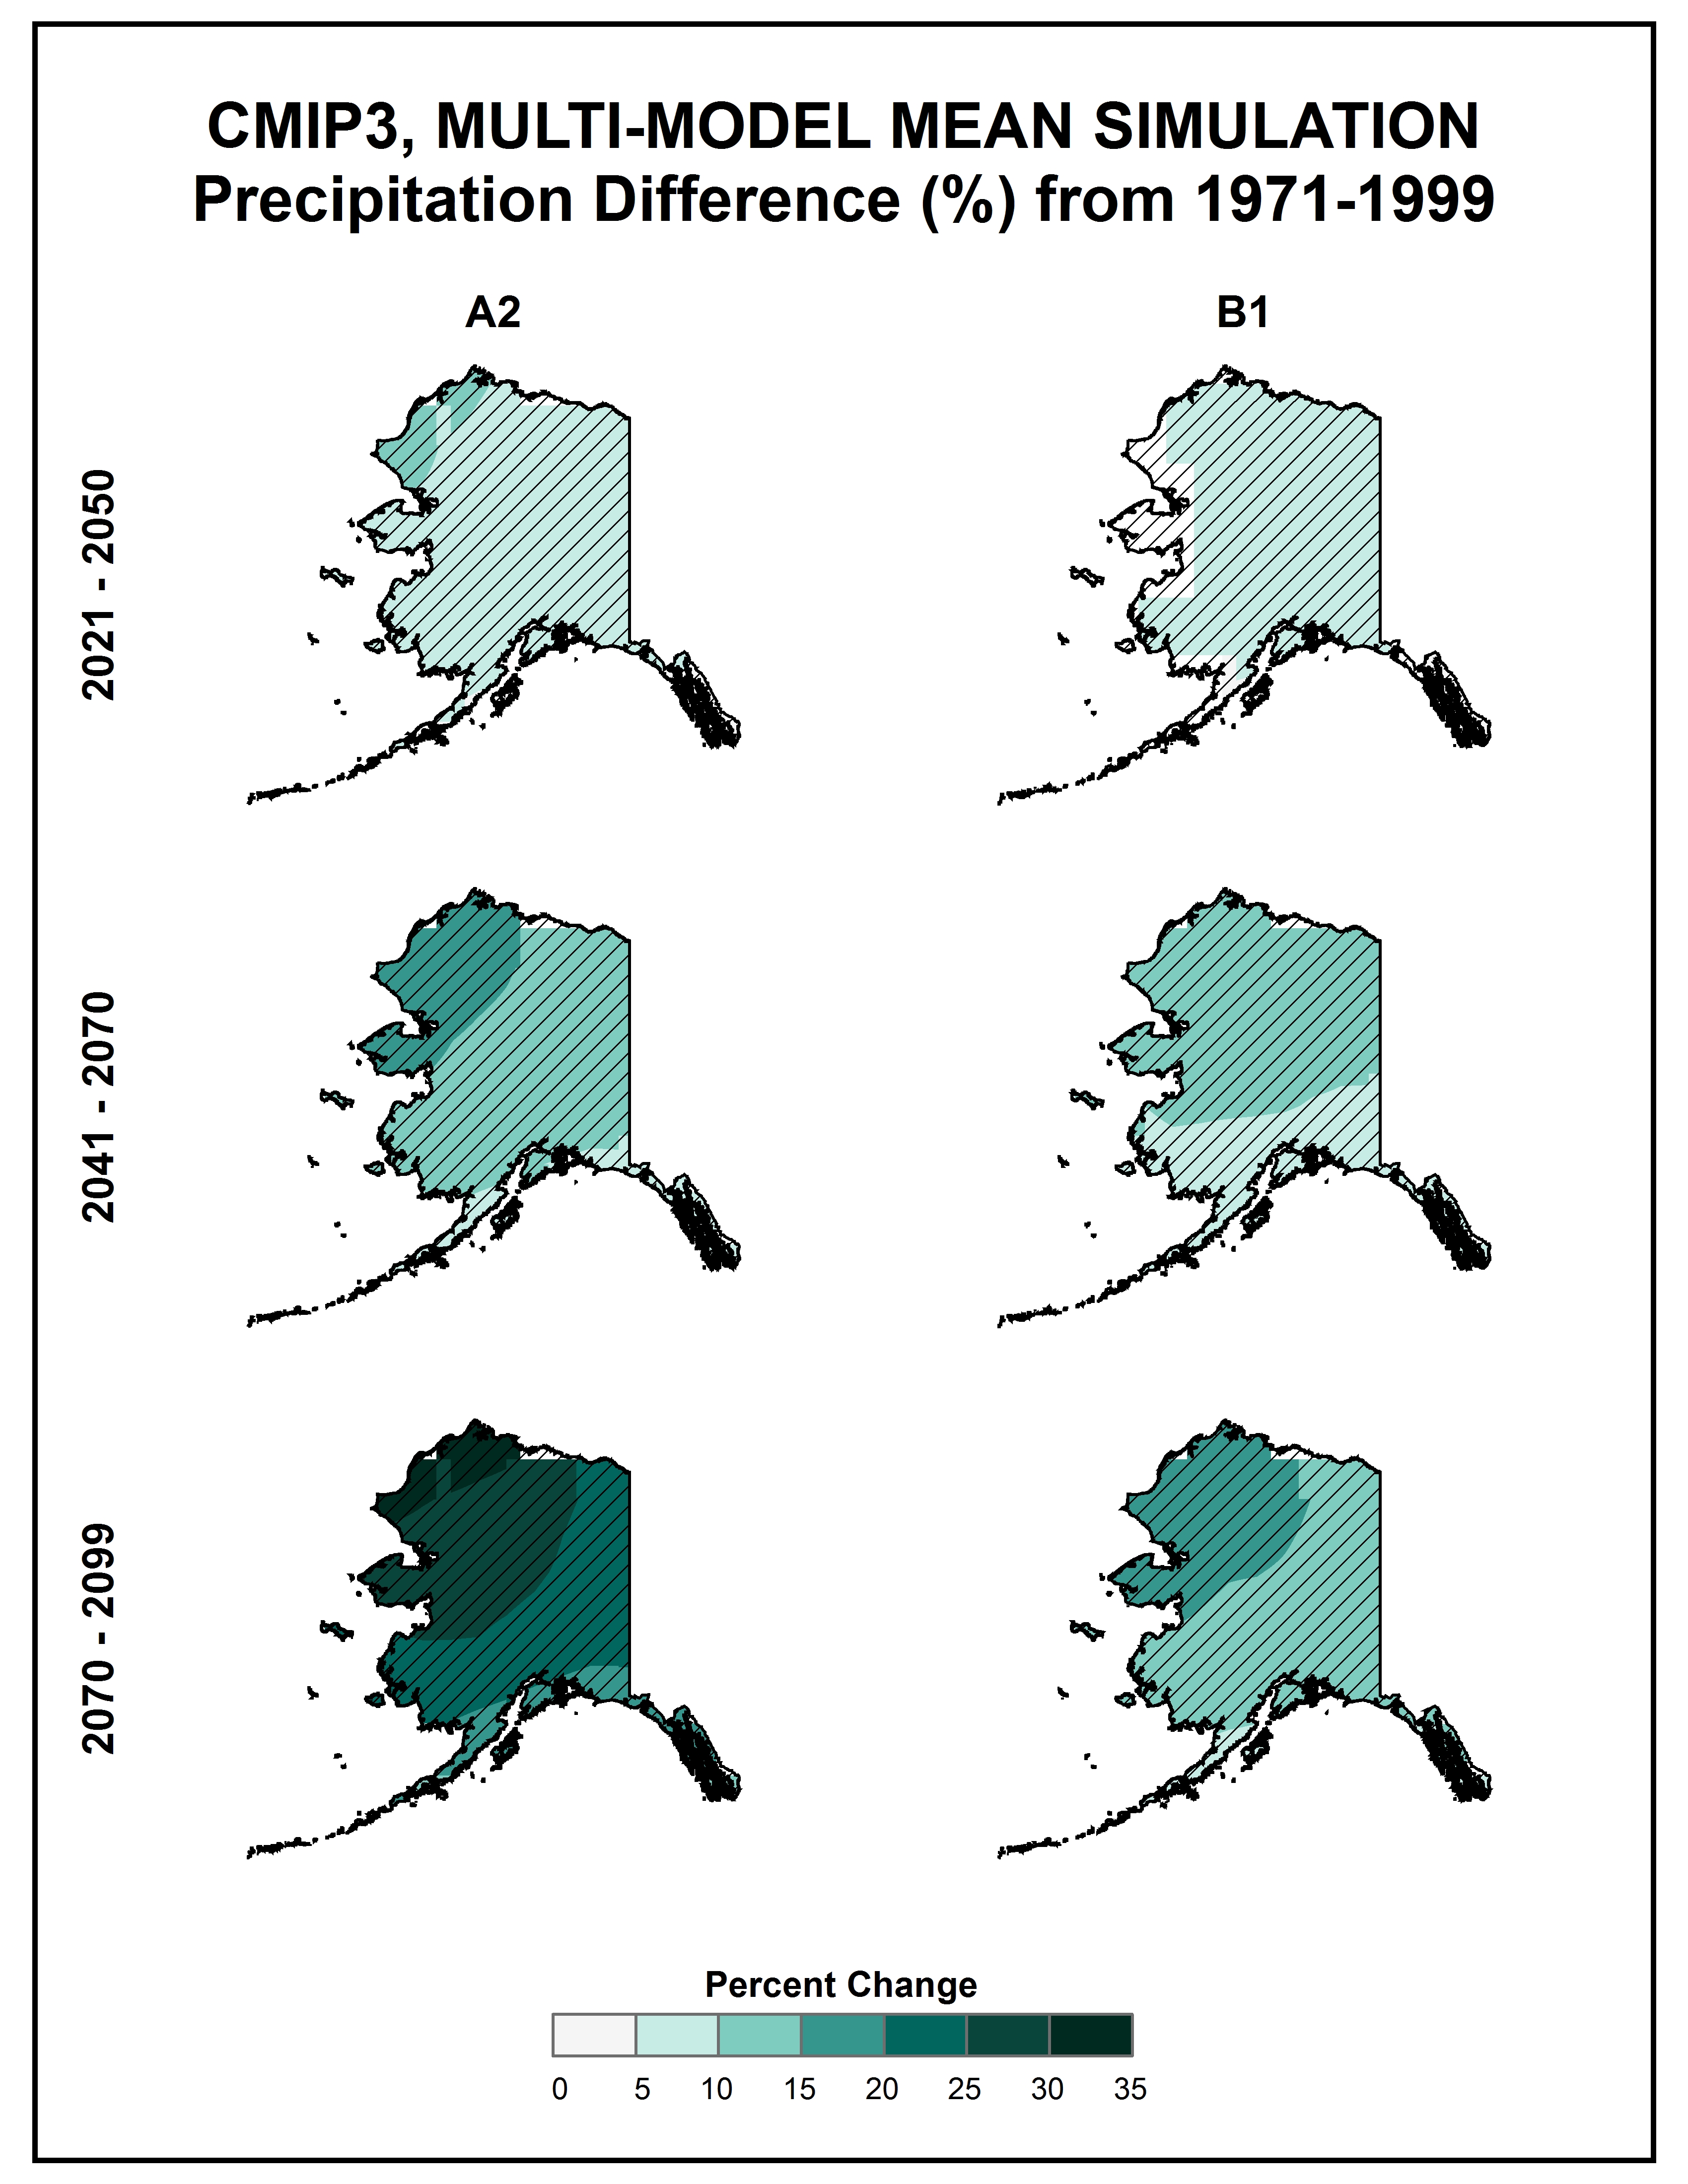
Simulated difference in annual mean precipitation (%) for Alaska, for each future time period (2021-2050, 2041-2070, and 2070-2099) with respect to the reference period of 1971-1999. These are multi-model means for the high (A2) and low (B1) emissions scenarios from the 14 (B1) or 15 (A2) CMIP3 global climate simulations. Color with hatching indicates that more than 50% of the models show a statistically significant change in precipitation, and more than 67% agree on the sign of the change (see text). The greatest increases in precipitation amount are simulated to occur in the far northwest of Alaska.
Data Type:
Simulated
Variable Type:
Precipitation
Region:
Source Information
Data Source(s):
Image Source:
Greg Dobson
Metadata
Metadata File(s):
Files